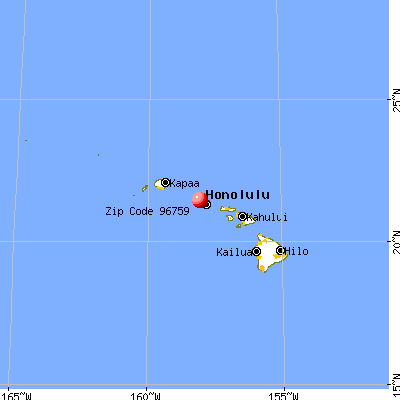
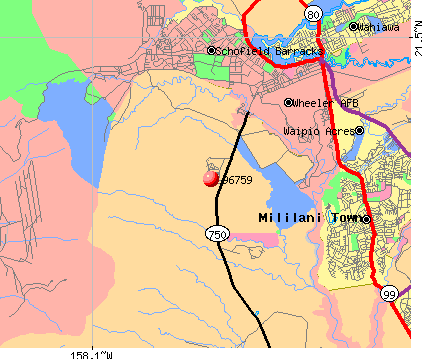
According to our research of Hawaii and other state lists, there was 1 registered sex offender living in 96759 zip code as of May 28, 2024. The ratio of all residents to sex offenders in zip code 96759 is 448 to 1. The ratio of registered sex offenders to all residents in this zip code is near the state average.
Median resident age:
This zip code:
52.0 years
Hawaii median age:
40.8 years
Average household size:
This zip code:
2.9 people
Hawaii:
2.8 people
Averages for the 2004 tax year for zip code 96759, filed in 2005:
Average Adjusted Gross Income (AGI) in 2004: $34,332 (Individual Income Tax Returns)
Here:
$34,332
State:
$46,564
Salary/wage: $33,358 (reported on 97.2% of returns)
Here:
$33,358
State:
$39,831
(% of AGI for various income ranges: 79.0% for AGIs below $10k, 98.2% for AGIs $10k-25k, 97.1% for AGIs $25k-50k, 91.0% for AGIs $50k-75k)
Taxable interest for individuals: $263 (reported on 45.6% of returns)
This zip code:
$263
Hawaii:
$1,263
Total itemized deductions: $13,319 (31% of AGI, reported on 47.6% of returns)
Here:
$13,319
State:
$20,647
Here:
31.5% of AGI
State:
23.5% of AGI
Charity contributions deductions: $2,929 (8% of AGI, reported on 44.8% of returns)
Here:
$2,929
State:
$2,966
Here:
7.6% of AGI
State:
3.3% of AGI
Total tax: $3,046 (reported on 69.6% of returns)
96759:
$3,046
State:
$7,224
Earned income credit: $1,200 (reported on 14.0% of returns)
Here:
$1,200
State:
$1,536
Percentage of individuals using paid preparers for their 2004 taxes: 77.6%
Here:
78%
State:
58%
(% for various income ranges: 83.3% for AGIs below $10k, 72.6% for AGIs $10k-25k, 83.0% for AGIs $25k-50k, 69.2% for AGIs $50k-75k)
Size of family households: 46 2-persons, 47 4-persons
46 married couples with children.
0 single-parent households ().
51.8% of residents of 96759 zip code speak English at home.
44.2% of residents speak Asian or Pacific Island language at home (34% very well, 33% not well, 34% not at all).
Foreign born population: 120 (43.7%) (0.0% of them are naturalized citizens)
:
43.7%
Whole state:
17.1%
64%Malaysia
32%Taiwan
Year of entry for the foreign-born population
02010 or later
02000 to 2009
391990 to 1999
125Before 1990
Facilities with environmental interests located in this zip code:
DEL MONTE KUNIA FRESH FRUIT PACKING FACILITY (94-1000 KUNIA ROAD in KUNIA, HI)
AIR SYNTHETIC MINOR (AIRS/AFS) SUPERFUND NPL (Superfund database) STATE MASTER (HEER-FRS) STATE MASTER (Hawaii environmental compliance and hazardous materials tracking) UNDERGROUND STORAGE TANK PROGRAM (Hawaii Underground Storage Tank Program) CRITERIA AND HAZARDOUS AIR POLLUTANT INVENTORY (Inventory of air pollution sources) Large Quantity Generators, more that 1000 kg of hazardous waste/month (Resource Conservation and Recovery Act (tracking hazardous waste)) Business SIC classification: NONCLASSIFIABLE ESTABLISHMENTS Organizations: DEL MONTE FRESH PRODUCE (HAWAII) INC (CONTACT/OPERATOR)
, THE ESTATE OF JAMES CAMPBELL (CONTACT/OWNER)
Alternative names: DEL MONTE CORP, DEL MONTE CORP KUNIA WELL, DEL MONTE CORP. (OAHU PLANTATION), DEL MONTE HAWAIIAN OPERATIONS, OAHU PLANTATION
DEL MONTE CORP (OAHU PLANTATION) (927 LUAWAI ST in KUNIA, HI)
STATE MASTER (HEER-FRS) STATE MASTER (Hawaii environmental compliance and hazardous materials tracking) FORMAL ENFORCEMENT ACTION (Integrated Compliance Information System) - ICIS-09-2005-0134, ENFORCEMENT/COMPLIANCE ACTIVITY
KUNIA ROAD (KUNIA ROAD in KUNIA, HI)
STATE MASTER (HEER-FRS) National Pollutant Discharge Elimination System NON-MAJOR (Tracking pollutant discharge elimination systems) - permit
BOARD OF WATER SUPPLY - NITRAT (94-220 KUNIA ROAD in KUNIA, HI)
National Pollutant Discharge Elimination System NON-MAJOR (Tracking pollutant discharge elimination systems) - permit Business SIC classification: NONCLASSIFIABLE ESTABLISHMENTS Alternative names: BOARD OF WATER SUPPLY-NITRATE
KUNIA ROAD IMPROVEMENTS (480 OLINDA RD in KUNIA, HI)
National Pollutant Discharge Elimination System NON-MAJOR (Tracking pollutant discharge elimination systems) - permit Business SIC classification: NONCLASSIFIABLE ESTABLISHMENTS Alternative names: SEABURY HALL, PHASE I
KUNIA WELLS II NITRATE TREATME (94-220 KUNIA ROAD in KUNIA, HI)
National Pollutant Discharge Elimination System NON-MAJOR (Tracking pollutant discharge elimination systems) - permit Business SIC classification: NONCLASSIFIABLE ESTABLISHMENTS Alternative names: KUNIA WELLS II NITRATE TREATMT
FIELD STATION KUNIA (H-1 in KUNIA, HI)
CRITERIA AND HAZARDOUS AIR POLLUTANT INVENTORY (Inventory of air pollution sources) Business SIC and NAICS classification: NATIONAL SECURITY
Housing units lacking complete kitchen facilities: 53.5%
50.6%Electricity
49.5%No fuel used
Place of birth for U.S.-born residents:
This state: 97
65% of the 96759 zip code residents lived in the same house 5 years ago. Out of people who lived in different houses, 88% lived in this county. Out of people who lived in different counties, 50% lived in Hawaii.
49% of the 96759 zip code residents lived in the same house 1 year ago. Out of people who lived in different houses, 95% moved from this county.
Private vs. public school enrollment:
Students in private schools in grades 1 to 8 (elementary and middle school):
Here:
0.0%
Hawaii:
21.6%
Students in private undergraduate colleges:
Here:
0.0%
Hawaii:
23.3%
Companies with federal contracts located in this zip code:
DEL MONTE FRESH PRODUCE (HAWAI (94-1000 KUNIA RD in KUNIA, HI) : $88,996 in 5 contractsfrom 2002 to 2004
Contracts for Maintenance, Repair and Rebuilding of Equipment -- Water Purification and Sewage Treatment Equipment by Army Signed by year:2000: $0; 2001: $0; 2002: $55,921; 2003: $26,460; 2004: $6,615; 2005: $0; 2006: $0.
Biggest contracts:
$30,721 with Army for Maintenance, Repair and Rebuilding of Equipment -- Water Purification and Sewage Treatment Equipment. Signed on 2002-09-30. Completion date: 2002-12-31.
$26,460, same as above.Signed on 2003-12-04. Completion date: 2004-12-31.
$25,200, same as above.Signed on 2002-11-26. Completion date: 2003-12-31.
$6,615, same as above.Signed on 2004-12-28. Completion date: 2004-12-31.
Top industries in this zip code by the number of employees in 2005:
Educational Services: Elementary and Secondary Schools (20-49 employees: 1 establishment)
Accommodation and Food Services: Full-Service Restaurants (5-9: 1)
Other Services (except Public Administration): Environment, Conservation and Wildlife Organizations (5-9: 1)
Finance and Insurance: Credit Unions (1-4: 1)
People in group quarters in 2000:
13 people in agriculture workers' dormitories on farms
9 people in unknown juvenile institutions
Fatal accident statistics in 2011:
Fatal accident count: 1
Vehicles involved in fatal accidents: 5
Fatal accidents caused by drunken drivers: 1
Fatalities: 2
Persons involved in fatal accidents: 12
Pedestrians involved in fatal accidents: 0
Home Mortgage Disclosure Act Aggregated Statistics For Year 2009 (Based on 2 partial tracts)
A) FHA, FSA/RHS & VA Home Purchase Loans
B) Conventional Home Purchase Loans
C) Refinancings
D) Home Improvement Loans
F) Non-occupant Loans on < 5 Family Dwellings (A B C & D)
Number
Average Value
Number
Average Value
Number
Average Value
Number
Average Value
Number
Average Value
LOANS ORIGINATED
124
$452,891
75
$321,240
438
$357,679
24
$267,158
42
$295,776
APPLICATIONS APPROVED, NOT ACCEPTED
5
$526,780
4
$364,620
75
$371,402
1
$655,200
7
$312,063
APPLICATIONS DENIED
13
$394,027
9
$346,964
161
$391,875
13
$154,425
17
$267,014
APPLICATIONS WITHDRAWN
13
$426,686
12
$409,609
104
$378,378
3
$322,797
13
$247,162
FILES CLOSED FOR INCOMPLETENESS
0
$0
0
$0
12
$353,808
1
$1,310,400
3
$271,253
Aggregated Statistics For Year 2008 (Based on 2 partial tracts)
A) FHA, FSA/RHS & VA Home Purchase Loans
B) Conventional Home Purchase Loans
C) Refinancings
D) Home Improvement Loans
F) Non-occupant Loans on < 5 Family Dwellings (A B C & D)
Number
Average Value
Number
Average Value
Number
Average Value
Number
Average Value
Number
Average Value
LOANS ORIGINATED
97
$425,907
193
$422,533
290
$348,616
41
$174,763
58
$330,289
APPLICATIONS APPROVED, NOT ACCEPTED
4
$295,822
12
$388,533
48
$323,696
9
$129,584
9
$269,214
APPLICATIONS DENIED
21
$442,229
37
$406,543
173
$355,861
14
$178,682
34
$246,201
APPLICATIONS WITHDRAWN
26
$410,508
29
$424,705
106
$379,596
5
$326,552
14
$244,202
FILES CLOSED FOR INCOMPLETENESS
0
$0
7
$286,229
8
$318,919
1
$39,310
5
$315,806
Aggregated Statistics For Year 2007 (Based on 4 partial tracts)
A) FHA, FSA/RHS & VA Home Purchase Loans
B) Conventional Home Purchase Loans
C) Refinancings
D) Home Improvement Loans
F) Non-occupant Loans on < 5 Family Dwellings (A B C & D)
Number
Average Value
Number
Average Value
Number
Average Value
Number
Average Value
Number
Average Value
LOANS ORIGINATED
75
$419,048
384
$374,525
364
$316,793
67
$169,335
98
$302,368
APPLICATIONS APPROVED, NOT ACCEPTED
5
$387,354
33
$292,616
81
$321,550
5
$268,632
22
$330,697
APPLICATIONS DENIED
10
$385,520
62
$336,096
164
$332,714
40
$95,252
33
$295,935
APPLICATIONS WITHDRAWN
8
$430,466
71
$340,132
115
$308,707
8
$245,700
12
$177,450
FILES CLOSED FOR INCOMPLETENESS
0
$0
13
$340,099
16
$287,387
1
$1,054,870
1
$811,140
Aggregated Statistics For Year 2006 (Based on 4 partial tracts)
A) FHA, FSA/RHS & VA Home Purchase Loans
B) Conventional Home Purchase Loans
C) Refinancings
D) Home Improvement Loans
F) Non-occupant Loans on < 5 Family Dwellings (A B C & D)
Number
Average Value
Number
Average Value
Number
Average Value
Number
Average Value
Number
Average Value
LOANS ORIGINATED
84
$381,451
957
$305,353
508
$298,854
110
$168,786
207
$296,036
APPLICATIONS APPROVED, NOT ACCEPTED
1
$716,790
106
$280,636
80
$316,773
9
$229,757
35
$320,861
APPLICATIONS DENIED
5
$482,752
123
$320,611
180
$345,218
46
$158,609
41
$308,487
APPLICATIONS WITHDRAWN
3
$272,563
95
$349,670
200
$330,745
12
$140,322
18
$385,694
FILES CLOSED FOR INCOMPLETENESS
1
$628,990
16
$281,162
63
$385,195
4
$63,555
4
$288,942
Aggregated Statistics For Year 2005 (Based on 4 partial tracts)
A) FHA, FSA/RHS & VA Home Purchase Loans
B) Conventional Home Purchase Loans
C) Refinancings
D) Home Improvement Loans
E) Loans on Dwellings For 5+ Families
F) Non-occupant Loans on < 5 Family Dwellings (A B C & D)
G) Loans On Manufactured Home Dwelling (A B C & D)
Number
Average Value
Number
Average Value
Number
Average Value
Number
Average Value
Number
Average Value
Number
Average Value
Number
Average Value
LOANS ORIGINATED
34
$310,989
742
$281,259
636
$274,817
96
$234,944
0
$0
249
$249,971
0
$0
APPLICATIONS APPROVED, NOT ACCEPTED
1
$330,220
92
$240,715
85
$293,761
10
$132,481
0
$0
37
$232,862
0
$0
APPLICATIONS DENIED
1
$321,050
112
$265,598
180
$261,791
28
$195,575
0
$0
38
$206,595
1
$242,420
APPLICATIONS WITHDRAWN
1
$304,010
98
$279,877
157
$285,475
39
$207,849
1
$26,208,000
29
$241,837
0
$0
FILES CLOSED FOR INCOMPLETENESS
0
$0
18
$287,706
80
$358,935
1
$284,360
0
$0
10
$321,310
0
$0
Aggregated Statistics For Year 2004 (Based on 4 partial tracts)
A) FHA, FSA/RHS & VA Home Purchase Loans
B) Conventional Home Purchase Loans
C) Refinancings
D) Home Improvement Loans
F) Non-occupant Loans on < 5 Family Dwellings (A B C & D)
G) Loans On Manufactured Home Dwelling (A B C & D)
Number
Average Value
Number
Average Value
Number
Average Value
Number
Average Value
Number
Average Value
Number
Average Value
LOANS ORIGINATED
41
$210,559
726
$246,231
636
$221,854
55
$240,566
252
$202,488
0
$0
APPLICATIONS APPROVED, NOT ACCEPTED
0
$0
89
$200,889
93
$207,536
3
$104,833
37
$210,266
0
$0
APPLICATIONS DENIED
3
$122,080
101
$235,859
145
$241,484
28
$161,086
46
$201,631
2
$50,110
APPLICATIONS WITHDRAWN
4
$197,870
71
$234,499
209
$222,733
13
$236,477
30
$169,522
0
$0
FILES CLOSED FOR INCOMPLETENESS
1
$214,910
17
$219,685
20
$220,868
1
$163,800
5
$218,836
0
$0
Aggregated Statistics For Year 2003 (Based on 4 partial tracts)
A) FHA, FSA/RHS & VA Home Purchase Loans
B) Conventional Home Purchase Loans
C) Refinancings
D) Home Improvement Loans
F) Non-occupant Loans on < 5 Family Dwellings (A B C & D)
Number
Average Value
Number
Average Value
Number
Average Value
Number
Average Value
Number
Average Value
LOANS ORIGINATED
66
$184,945
556
$220,525
1,183
$198,110
31
$134,210
278
$164,799
APPLICATIONS APPROVED, NOT ACCEPTED
5
$198,132
69
$233,536
109
$218,128
1
$196,560
22
$192,450
APPLICATIONS DENIED
7
$128,044
51
$213,766
174
$187,515
8
$23,751
32
$145,767
APPLICATIONS WITHDRAWN
3
$157,247
68
$241,518
209
$215,160
3
$120,120
33
$149,346
FILES CLOSED FOR INCOMPLETENESS
0
$0
10
$168,255
37
$192,381
0
$0
8
$156,592
Aggregated Statistics For Year 2002 (Based on 4 partial tracts)
A) FHA, FSA/RHS & VA Home Purchase Loans
B) Conventional Home Purchase Loans
C) Refinancings
D) Home Improvement Loans
F) Non-occupant Loans on < 5 Family Dwellings (A B C & D)
Number
Average Value
Number
Average Value
Number
Average Value
Number
Average Value
Number
Average Value
LOANS ORIGINATED
41
$159,773
291
$194,696
506
$192,593
14
$75,722
119
$146,148
APPLICATIONS APPROVED, NOT ACCEPTED
1
$178,210
39
$210,437
48
$202,457
0
$0
10
$150,958
APPLICATIONS DENIED
3
$132,787
33
$196,719
93
$211,335
7
$20,624
17
$137,206
APPLICATIONS WITHDRAWN
1
$277,800
31
$218,921
130
$194,100
3
$37,127
7
$166,609
FILES CLOSED FOR INCOMPLETENESS
0
$0
7
$202,924
25
$163,643
1
$39,310
3
$119,683
Aggregated Statistics For Year 2001 (Based on 2 partial tracts)
A) FHA, FSA/RHS & VA Home Purchase Loans
B) Conventional Home Purchase Loans
C) Refinancings
D) Home Improvement Loans
F) Non-occupant Loans on < 5 Family Dwellings (A B C & D)
Number
Average Value
Number
Average Value
Number
Average Value
Number
Average Value
Number
Average Value
LOANS ORIGINATED
28
$127,015
211
$201,354
279
$184,424
16
$19,492
64
$127,252
APPLICATIONS APPROVED, NOT ACCEPTED
3
$133,660
18
$155,573
21
$199,555
1
$32,760
5
$106,928
APPLICATIONS DENIED
1
$153,320
25
$152,898
51
$234,305
7
$33,321
1
$120,560
APPLICATIONS WITHDRAWN
7
$132,724
17
$232,635
43
$175,472
7
$19,281
9
$125,507
FILES CLOSED FOR INCOMPLETENESS
0
$0
0
$0
20
$168,976
0
$0
3
$134,097
Aggregated Statistics For Year 2000 (Based on 4 partial tracts)
A) FHA, FSA/RHS & VA Home Purchase Loans
B) Conventional Home Purchase Loans
C) Refinancings
D) Home Improvement Loans
E) Loans on Dwellings For 5+ Families
F) Non-occupant Loans on < 5 Family Dwellings (A B C & D)
Number
Average Value
Number
Average Value
Number
Average Value
Number
Average Value
Number
Average Value
Number
Average Value
LOANS ORIGINATED
45
$118,751
145
$136,788
42
$180,149
22
$50,570
3
$1,878,240
37
$74,445
APPLICATIONS APPROVED, NOT ACCEPTED
3
$99,590
21
$122,554
21
$220,459
4
$15,725
0
$0
7
$73,196
APPLICATIONS DENIED
8
$105,324
25
$152,142
20
$139,099
4
$17,362
0
$0
4
$151,680
APPLICATIONS WITHDRAWN
1
$124,490
24
$175,375
21
$144,269
0
$0
0
$0
7
$105,769
FILES CLOSED FOR INCOMPLETENESS
0
$0
1
$421,950
12
$291,782
0
$0
0
$0
1
$216,220
Aggregated Statistics For Year 1999 (Based on 2 partial tracts)
A) FHA, FSA/RHS & VA Home Purchase Loans
B) Conventional Home Purchase Loans
C) Refinancings
D) Home Improvement Loans
E) Loans on Dwellings For 5+ Families
F) Non-occupant Loans on < 5 Family Dwellings (A B C & D)
Detailed PMIC statistics for the following Tracts:0086.03
2003 - 2018 National Fire Incident Reporting System (NFIRS) incidents
Based on the data from the years 2003 - 2018 the average number of fire incidents per year is 7. The highest number of reported fire incidents - 14 took place in 2017, and the least - 2 in 2009. The data has a rising trend.
When looking into fire subcategories, the most reports belonged to: Outside Fires (54.8%), and Mobile Property/Vehicle Fires (39.1%).
Fire incident types reported to NFIRS in Zip Code 96759


 Nearest zip codes: 96857, 96792, 96707, 96797, 96706, 96789.


 Based on the data from the years 2003 - 2018 the average number of fire incidents per year is 7. The highest number of reported fire incidents - 14 took place in 2017, and the least - 2 in 2009. The data has a rising trend.
 When looking into fire subcategories, the most reports belonged to: Outside Fires (54.8%), and Mobile Property/Vehicle Fires (39.1%).