Estimated zip code population in 2022: 7,186 Zip code population in 2010: 8,339 Zip code population in 2000: 4,410
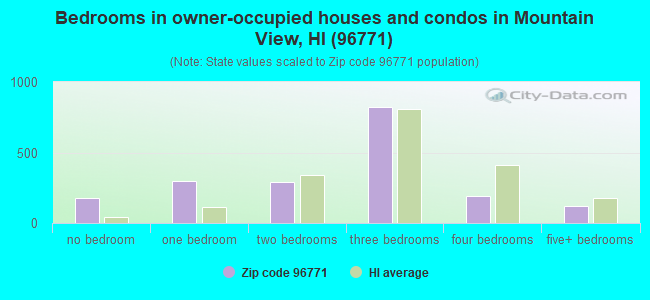
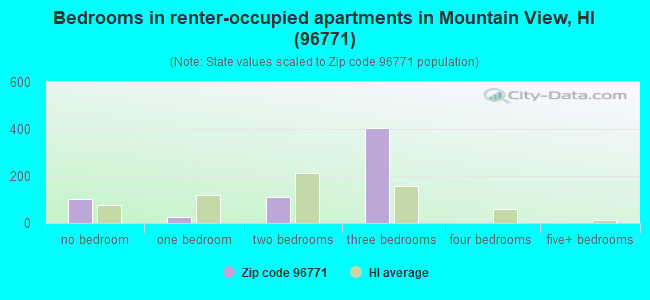
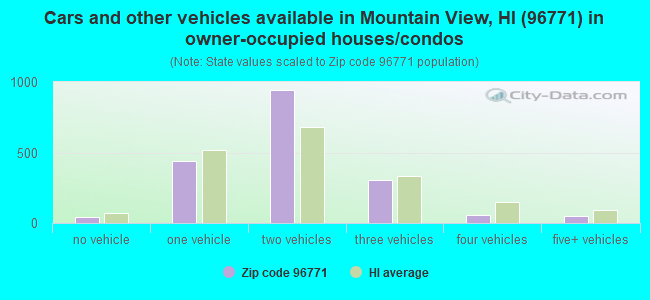
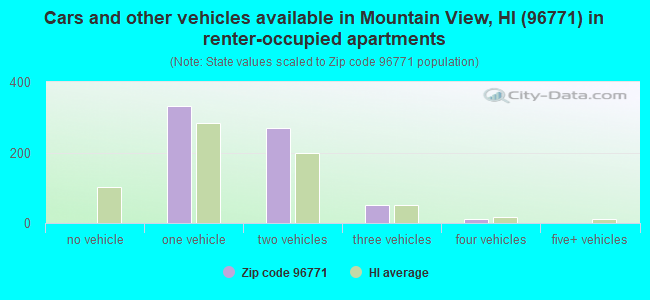
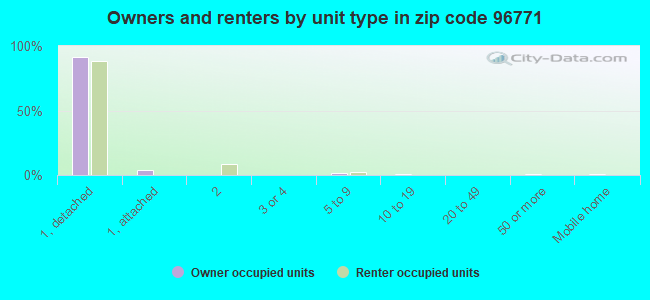
Houses and condos: 2,928 Renter-occupied apartments: 675
% of renters here:
27%
State:
37%
March 2022 cost of living index in zip code 96771: 106.3 (more than average, U.S. average is 100)
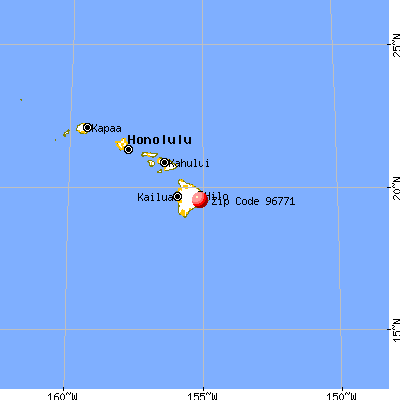
Land area: 92.0 sq. mi. Water area: 0.0 sq. mi.
Population density: 78 people per square mile
(very low).
OSM Map
General Map
Google Map
MSN Map
OSM Map
General Map
Google Map
MSN Map
OSM Map
General Map
Google Map
MSN Map
OSM Map
General Map
Google Map
MSN Map
Please wait while loading the map...
Real estate property taxes paid for housing units in 2022:
This zip code:
0.2% ($652)
Hawaii:
0.3% ($2,092)
Median real estate property taxes paid for housing units with mortgages in 2022: $823 (0.3%) Median real estate property taxes paid for housing units with no mortgage in 2022: $506 (0.2%)
Business Search- 14 Million verified businesses
Males: 3,349
(46.6%)
Females: 3,837
(53.4%)
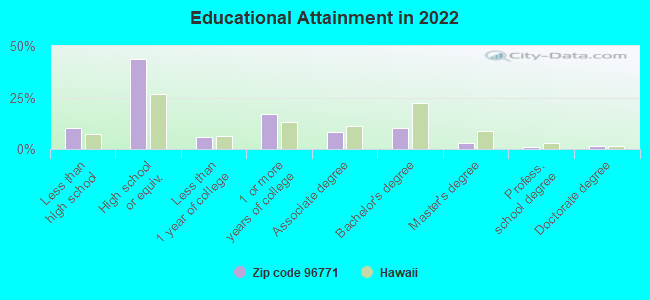
For population 25 years and over in 96771:
High school or higher: 89.0%
Bachelor's degree or higher: 15.1%
Graduate or professional degree: 5.1%
Unemployed: 9.2%
Mean travel time to work (commute): 36.5 minutes
For population 15 years and over in 96771:
Never married: 36.5%
Now married: 46.8%
Separated: 3.3%
Widowed: 5.2%
Divorced: 8.2%
Zip code 96771 compared to state average:
Median household income below state average.
Median house value significantly below state average.
Unemployed percentage above state average.
Black race population percentage significantly below state average.
Foreign-born population percentage significantly below state average.
Length of stay since moving in above state average.
House age below state average.
Percentage of population with a bachelor's degree or higher significantly below state average.
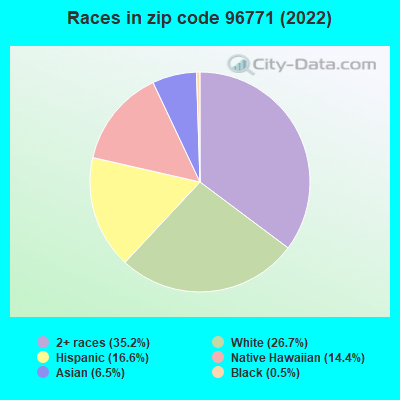
2,52535.2%Two or more races
1,92126.7%White
1,19216.6%Hispanic or Latino
1,03614.4%Native Hawaiian and Other Pacific Islander
Averages for the 2020 tax year for zip code 96771, filed in 2021:
Average Adjusted Gross Income (AGI) in 2020: $41,671 (Individual Income Tax Returns)
Here:
$41,671
State:
$72,945
Salary/wage: $38,645 (reported on 70.7% of returns)
Here:
$38,645
State:
$57,697
(% of AGI for various income ranges: 898.6% for AGIs below $25k, 3078.7% for AGIs $25k-50k, 5952.4% for AGIs $50k-75k, 10097.1% for AGIs $75k-100k, 23314.3% for AGIs $100k-200k)
Taxable interest for individuals: $556 (reported on 24.5% of returns)
This zip code:
$556
Hawaii:
$1,356
(% of AGI for various income ranges: 10.7% for AGIs below $25k, 11.1% for AGIs $25k-50k, 20.0% for AGIs $50k-75k, 95.7% for AGIs $75k-100k, 67.1% for AGIs $100k-200k)
Ordinary dividends: $3,378 (reported on 9.8% of returns)
Here:
$3,378
State:
$6,387
(% of AGI for various income ranges: 22.7% for AGIs below $25k, 36.6% for AGIs $25k-50k, 100.0% for AGIs $50k-75k, 245.7% for AGIs $100k-200k)
Net capital gain/loss in AGI: +$11,575 (reported on 8.7% of returns)
Here:
+$11,575
State:
+$23,240
(% of AGI for various income ranges: 13.4% for AGIs below $25k, 35.5% for AGIs $25k-50k, 127.1% for AGIs $50k-75k, 2037.1% for AGIs $100k-200k)
Profit/loss from business: +$5,621 (reported on 17.9% of returns)
Here:
+$5,621
State:
+$15,381
(% of AGI for various income ranges: 129.3% for AGIs below $25k, 118.2% for AGIs $25k-50k, 67.6% for AGIs $50k-75k, 810.0% for AGIs $100k-200k)
Taxable individual retirement arrangement distribution: $17,817 (reported on 6.5% of returns)
96771:
$17,817
Hawaii:
$19,883
(% of AGI for various income ranges: 58.8% for AGIs below $25k, 63.9% for AGIs $25k-50k, 267.6% for AGIs $50k-75k, 1587.1% for AGIs $100k-200k)
Total itemized deductions: $27,500 (reported on 3.3% of returns)
Here:
$27,500
State:
$33,097
(% of AGI for various income ranges: 530.0% for AGIs $50k-75k, 1070.0% for AGIs $100k-200k)
Charity contributions: $5,675 (reported on 2.2% of returns)
Here:
$5,675
State:
$7,368
(% of AGI for various income ranges: 324.3% for AGIs $75k-100k)
Taxes paid: $6,183 (reported on 3.3% of returns)
96771:
$6,183
State:
$7,601
(% of AGI for various income ranges: 97.1% for AGIs $50k-75k, 294.3% for AGIs $100k-200k)
Earned income credit: $2,289 (reported on 24.5% of returns)
Here:
$2,289
State:
$2,008
(% of AGI for various income ranges: 117.1% for AGIs below $25k, 98.4% for AGIs $25k-50k)
Percentage of individuals using paid preparers for their 2020 taxes: 89.7%
Here:
90%
State:
89%
(% for various income ranges: 86.9% for AGIs below $25k, 91.7% for AGIs $25k-50k, 91.7% for AGIs $50k-75k, 91.7% for AGIs $75k-100k, 107.1% for AGIs $100k-200k, 0.0% for AGIs over 200k)
Averages for the 2012 tax year for zip code 96771, filed in 2013:
Average Adjusted Gross Income (AGI) in 2012: $32,981 (Individual Income Tax Returns)
Here:
$32,981
State:
$57,303
Salary/wage: $30,556 (reported on 75.5% of returns)
Here:
$30,556
State:
$47,500
(% of AGI for various income ranges: 66.3% for AGIs below $25k, 74.0% for AGIs $25k-50k, 70.9% for AGIs $50k-75k, 76.6% for AGIs $75k-100k, 62.2% for AGIs $100k-200k)
Taxable interest for individuals: $676 (reported on 27.8% of returns)
This zip code:
$676
Hawaii:
$1,212
(% of AGI for various income ranges: 1.1% for AGIs below $25k, 0.5% for AGIs $25k-50k, 0.5% for AGIs $50k-75k, 0.4% for AGIs $75k-100k, 0.4% for AGIs $100k-200k)
Ordinary dividends: $2,288 (reported on 11.3% of returns)
Here:
$2,288
State:
$5,430
(% of AGI for various income ranges: 1.2% for AGIs below $25k, 0.4% for AGIs $25k-50k, 1.2% for AGIs $50k-75k, 1.1% for AGIs $75k-100k)
Net capital gain/loss in AGI: +$1,008 (reported on 8.6% of returns)
Here:
+$1,008
State:
+$13,910
(% of AGI for various income ranges: 0.4% for AGIs $50k-75k, 1.1% for AGIs $75k-100k)
Profit/loss from business: +$7,841 (reported on 17.9% of returns)
Here:
+$7,841
State:
+$15,881
(% of AGI for various income ranges: 12.0% for AGIs below $25k, 2.4% for AGIs $25k-50k, 0.8% for AGIs $50k-75k, 7.7% for AGIs $75k-100k)
Taxable individual retirement arrangement distribution: $9,467 (reported on 7.9% of returns)
96771:
$9,467
Hawaii:
$15,720
(% of AGI for various income ranges: 2.0% for AGIs below $25k, 3.0% for AGIs $25k-50k, 7.8% for AGIs $75k-100k)
Total itemized deductions: $17,996 (27% of AGI, reported on 18.5% of returns)
Here:
$17,996
State:
$25,496
Here:
27.0% of AGI
State:
23.1% of AGI
(% of AGI for various income ranges: 6.1% for AGIs below $25k, 9.2% for AGIs $25k-50k, 10.5% for AGIs $50k-75k, 15.0% for AGIs $75k-100k, 11.2% for AGIs $100k-200k)
Charity contributions: $2,425 (reported on 13.2% of returns)
Here:
$2,425
State:
$3,353
(% of AGI for various income ranges: 0.4% for AGIs below $25k, 0.7% for AGIs $25k-50k, 1.1% for AGIs $50k-75k, 1.3% for AGIs $75k-100k, 1.5% for AGIs $100k-200k)
Taxes paid: $4,371 (reported on 18.5% of returns)
96771:
$4,371
State:
$8,029
(% of AGI for various income ranges: 0.8% for AGIs below $25k, 1.7% for AGIs $25k-50k, 2.3% for AGIs $50k-75k, 3.8% for AGIs $75k-100k, 4.4% for AGIs $100k-200k)
Earned income credit: $2,408 (reported on 32.5% of returns)
Here:
$2,408
State:
$2,113
(% of AGI for various income ranges: 9.9% for AGIs below $25k, 1.8% for AGIs $25k-50k)
Percentage of individuals using paid preparers for their 2012 taxes: 44.4%
Here:
44%
State:
53%
(% for various income ranges: 41.0% for AGIs below $25k, 45.7% for AGIs $25k-50k, 50.0% for AGIs $50k-75k, 62.5% for AGIs $75k-100k, 42.9% for AGIs $100k-200k)
Averages for the 2004 tax year for zip code 96771, filed in 2005:
Average Adjusted Gross Income (AGI) in 2004: $27,844 (Individual Income Tax Returns)
Here:
$27,844
State:
$46,564
Salary/wage: $26,320 (reported on 79.0% of returns)
Here:
$26,320
State:
$39,831
(% of AGI for various income ranges: 113.2% for AGIs below $10k, 72.6% for AGIs $10k-25k, 76.0% for AGIs $25k-50k, 79.1% for AGIs $50k-75k, 74.1% for AGIs $75k-100k, 57.8% for AGIs over 100k)
Taxable interest for individuals: $800 (reported on 45.2% of returns)
This zip code:
$800
Hawaii:
$1,263
(% of AGI for various income ranges: 4.1% for AGIs below $10k, 1.7% for AGIs $10k-25k, 1.0% for AGIs $25k-50k, 1.8% for AGIs $50k-75k, 0.8% for AGIs $75k-100k, 0.3% for AGIs over 100k)
Taxable dividends: $1,429 (reported on 13.8% of returns)
Here:
$1,429
State:
$3,145
(% of AGI for various income ranges: 1.6% for AGIs below $10k, 1.0% for AGIs $10k-25k, 0.7% for AGIs $25k-50k, 0.6% for AGIs $50k-75k, 0.8% for AGIs $75k-100k, 0.0% for AGIs over 100k)
Net capital gain/loss: +$11,154 (reported on 12.8% of returns)
Here:
+$11,154
State:
+$16,059
(% of AGI for various income ranges: -0.6% for AGIs below $10k, 0.7% for AGIs $10k-25k, 1.4% for AGIs $25k-50k, 3.1% for AGIs $50k-75k, 8.3% for AGIs $75k-100k, 21.5% for AGIs over 100k)
Profit/loss from business: +$5,545 (reported on 16.9% of returns)
Here:
+$5,545
State:
+$13,847
(% of AGI for various income ranges: 17.4% for AGIs below $10k, 6.2% for AGIs $10k-25k, 5.9% for AGIs $25k-50k, -0.1% for AGIs $50k-75k, -1.3% for AGIs $75k-100k)
Profit/loss from farming: +$3,400 (reported on 4.5% of returns)
Here:
+$3,400
State:
-$719
(% of AGI for various income ranges: -1.9% for AGIs below $10k, 3.2% for AGIs $10k-25k, 0.1% for AGIs $50k-75k)
IRA payment deduction: $2,818 (reported on 3.0% of returns)
96771:
$2,818
Hawaii:
$2,867
Total itemized deductions: $14,229 (25% of AGI, reported on 21.5% of returns)
Here:
$14,229
State:
$20,647
Here:
25.3% of AGI
State:
23.5% of AGI
(% of AGI for various income ranges: 6.9% for AGIs below $10k, 8.1% for AGIs $10k-25k, 10.2% for AGIs $25k-50k, 11.6% for AGIs $50k-75k, 13.3% for AGIs $75k-100k, 14.7% for AGIs over 100k)
Charity contributions deductions: $2,208 (4% of AGI, reported on 17.6% of returns)
Here:
$2,208
State:
$2,966
Here:
3.8% of AGI
State:
3.3% of AGI
(% of AGI for various income ranges: 1.0% for AGIs $10k-25k, 1.2% for AGIs $25k-50k, 1.5% for AGIs $50k-75k, 1.8% for AGIs $75k-100k, 2.3% for AGIs over 100k)
Total tax: $3,373 (reported on 66.2% of returns)
96771:
$3,373
State:
$7,224
(% of AGI for various income ranges: 3.4% for AGIs below $10k, 4.2% for AGIs $10k-25k, 6.9% for AGIs $25k-50k, 8.0% for AGIs $50k-75k, 11.1% for AGIs $75k-100k, 14.2% for AGIs over 100k)
Earned income credit: $1,699 (reported on 24.3% of returns)
Here:
$1,699
State:
$1,536
Percentage of individuals using paid preparers for their 2004 taxes: 55.4%
Here:
55%
State:
58%
(% for various income ranges: 52.4% for AGIs below $10k, 54.2% for AGIs $10k-25k, 59.0% for AGIs $25k-50k, 55.9% for AGIs $50k-75k, 52.5% for AGIs $75k-100k, 71.0% for AGIs over 100k)
Likely homosexual households (counted as self-reported same-sex unmarried-partner households)
Lesbian couples: 0.5% of all households
Gay men: 0.0% of all households
Household received Food Stamps/SNAP in the past 12 months: 881 Household did not receive Food Stamps/SNAP in the past 12 months: 1,672
Women who had a birth in the past 12 months: 84 (6 now married, 74 unmarried) Women who did not have a birth in the past 12 months: 1,549 (566 now married, 986 unmarried)
Housing units in zip code 96771 with a mortgage: 978 (72 second mortgage, 58 both second mortgage and home equity loan) Houses without a mortgage: 27
Median monthly owner costs for units with a mortgage: $1,663 Median monthly owner costs for units without a mortgage: $251
Residents with income below the poverty level in 2022:
This zip code:
21.7%
Whole state:
10.2%
Residents with income below 50% of the poverty level in 2022:
This zip code:
11.2%
Whole state:
4.7%
Median number of rooms in houses and condos:
Here:
4.7
State:
5.5
Median number of rooms in apartments:
Here:
4.7
State:
3.9
Notable locations in this zip code not listed on our city pages
Notable locations in zip code 96771: Fern Acres Volunteer Fire Station 5D (A), Fern Forest Volunteer Fire Station 5C (B). Display/hide their locations on the map
In group quarters: 14 (-1 institutionalized population)
Size of family households: 752 2-persons, 191 3-persons, 410 4-persons, 147 5-persons, 158 6-persons, 75 7-or-more-persons
Size of nonfamily households: 700 1-person, 54 2-persons, 20 3-persons
714 married couples with children.
753 single-parent households (259 men, 494 women).
78.4% of residents of 96771 zip code speak English at home.
0.7% of residents speak Spanish at home (100% very well).
0.7% of residents speak other Indo-European language at home (56% very well, 44% well).
8.1% of residents speak Asian or Pacific Island language at home (68% very well, 15% well, 17% not well).
12.7% of residents speak other language at home (63% very well, 37% well).
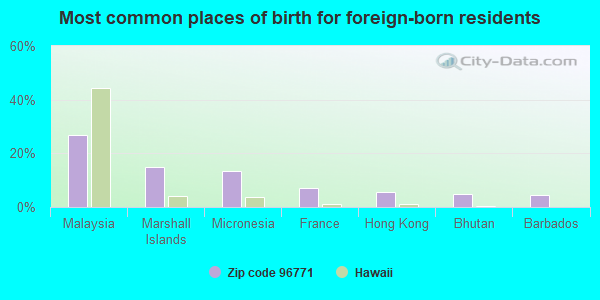
Foreign born population: 412 (5.7%) (62.3% of them are naturalized citizens)
This zip code:
5.7%
Whole state:
17.1%
27%Malaysia
15%Marshall Islands
13%Micronesia
7%France
6%Hong Kong
5%Bhutan
4%Barbados
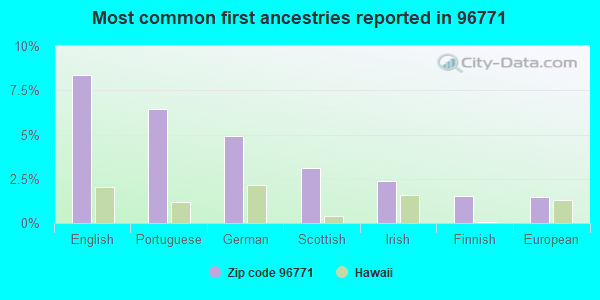
8%English
6%Portuguese
5%German
3%Scottish
2%Irish
2%Finnish
1%European
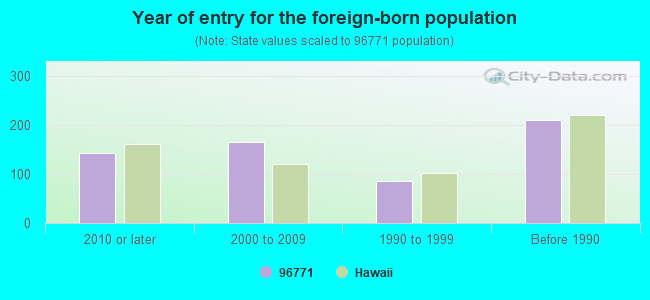
Year of entry for the foreign-born population
1422010 or later
1652000 to 2009
861990 to 1999
210Before 1990
Facilities with environmental interests located in this zip code:
MOUNTAIN VIEW ELEMENTARY SCHOOL (18-1235 VOLCANO HIGHWAY in MOUNTAIN VIEW, HI)
(Geographic Names Information System) STATE MASTER (HEER-FRS) (National Center for Education Statistics) - STATE ID-5-379 Organizations: HAWAII DEPT OF EDUCATION (SCHOOL DISTRICT)
SAALFELD FAMILY RANCH - KUKUI (18 MILE MARKER KOHALA MTN RD in MOUNTAIN VIEW, HI)
National Pollutant Discharge Elimination System NON-MAJOR (Tracking pollutant discharge elimination systems) - permit Business SIC classification: NONCLASSIFIABLE ESTABLISHMENTS
MOUNTAIN VIEW ELEMENTARY SCHOOL (18 1235 VOLCANO HWY in MOUNTAIN VIEW, HI)
Conditionally Exempt Small Quantity Generators, less than 100 kg/month of hazardous waste (Resource Conservation and Recovery Act (tracking hazardous waste)) - notification Organizations: STATE OF H I D A G S (CONTACT/OWNER)
Housing units lacking complete plumbing facilities: 10.3% Housing units lacking complete kitchen facilities: 15.5%
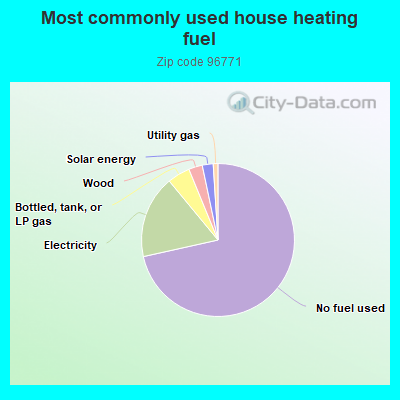
71.6%No fuel used
17.5%Electricity
4.8%Bottled, tank, or LP gas
2.9%Wood
2.3%Solar energy
1.0%Utility gas
Population in 1990: 3,170. Population change in the 1990s: +1,240 (+39.1%).
Place of birth for U.S.-born residents:
This state: 4,924
Northeast: 197
Midwest: 362
South: 360
West: 772
59% of the 96771 zip code residents lived in the same house 5 years ago. Out of people who lived in different houses, 61% lived in this county. Out of people who lived in different counties, 50% lived in Hawaii.
93% of the 96771 zip code residents lived in the same house 1 year ago. Out of people who lived in different houses, 57% moved from this county. Out of people who lived in different houses, 5% moved from different county within same state. Out of people who lived in different houses, 42% moved from different state.
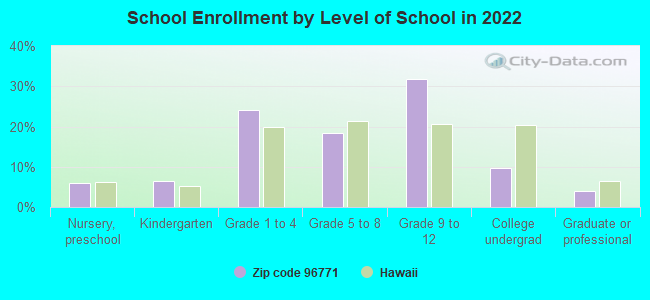
Private vs. public school enrollment:
Students in private schools in grades 1 to 8 (elementary and middle school): 136
Here:
19.9%
Hawaii:
21.6%
Students in private schools in grades 9 to 12 (high school): 88
Here:
17.2%
Hawaii:
21.5%
Students in private undergraduate colleges:
Here:
0.0%
Hawaii:
23.3%
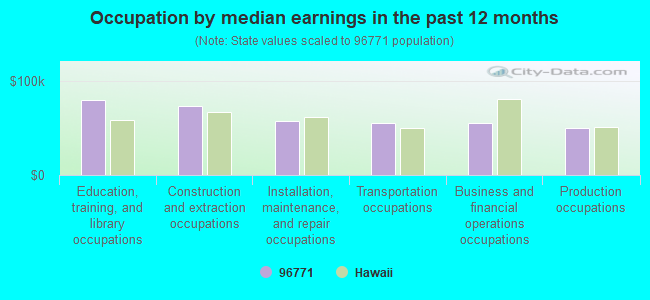
Occupation by median earnings in the past 12 months ($)
79,756Education, training, and library occupations
73,128Construction and extraction occupations
57,101Installation, maintenance, and repair occupations
54,906Transportation occupations
54,889Business and financial operations occupations
49,481Production occupations
Top industries in this zip code by the number of employees in 2005:
Construction: New Single-Family Housing Construction (except Operative Builders) (5-9 employees: 1 establishment)
Real Estate and Rental and Leasing: Lessors of Residential Buildings and Dwellings (1-4: 1)
Professional, Scientific, and Technical Services: Other Accounting Services (1-4: 1)
Finance and Insurance: Claims Adjusting (1-4: 1)
Educational Services: Elementary and Secondary Schools (1-4: 1)
Health Care and Social Assistance: Child Day Care Services (1-4: 1)
Construction: Site Preparation Contractors (1-4: 1)
Fatal accident statistics in 2012:
Fatal accident count: 2
Vehicles involved in fatal accidents: 4
Fatal accidents caused by drunken drivers: 1
Fatalities: 2
Persons involved in fatal accidents: 4
Pedestrians involved in fatal accidents: 0
Fatal accident statistics in 2010:
Fatal accident count: 1
Vehicles involved in fatal accidents: 2
Fatal accidents caused by drunken drivers: 1
Fatalities: 1
Persons involved in fatal accidents: 3
Pedestrians involved in fatal accidents: 0
2003 - 2018 National Fire Incident Reporting System (NFIRS) incidents
Based on the data from the years 2003 - 2018 the average number of fire incidents per year is 26. The highest number of reported fire incidents - 38 took place in 2018, and the least - 4 in 2003. The data has a rising trend.
When looking into fire subcategories, the most reports belonged to: Outside Fires (54.3%), and Structure Fires (30.4%).
Fire incident types reported to NFIRS in Zip Code 96771


+$3,400
-$719
(% of AGI for various income ranges: -1.9% for AGIs below $10k, 3.2% for AGIs $10k-25k, 0.1% for AGIs $50k-75k)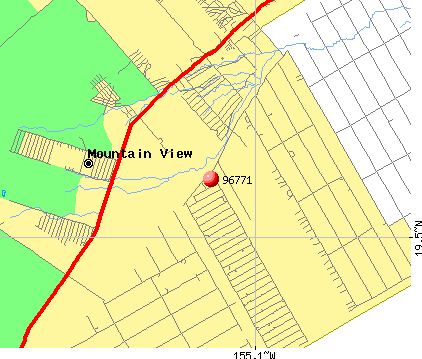 Nearest zip codes: 96760, 96778, 96749, 96720, 96781, 96785.
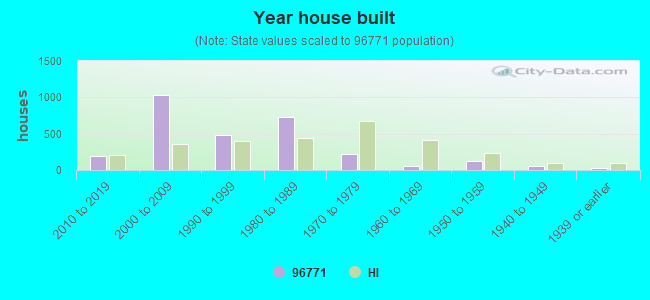


 Based on the data from the years 2003 - 2018 the average number of fire incidents per year is 26. The highest number of reported fire incidents - 38 took place in 2018, and the least - 4 in 2003. The data has a rising trend.
 When looking into fire subcategories, the most reports belonged to: Outside Fires (54.3%), and Structure Fires (30.4%).