Estimated zip code population in 2022: 2,871 Zip code population in 2010: 3,161 Zip code population in 2000: 2,924
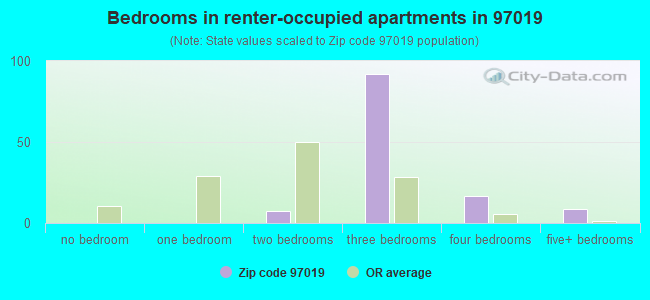
Houses and condos: 1,109 Renter-occupied apartments: 127
% of renters here:
13%
State:
37%
March 2022 cost of living index in zip code 97019: 96.7 (near average, U.S. average is 100)
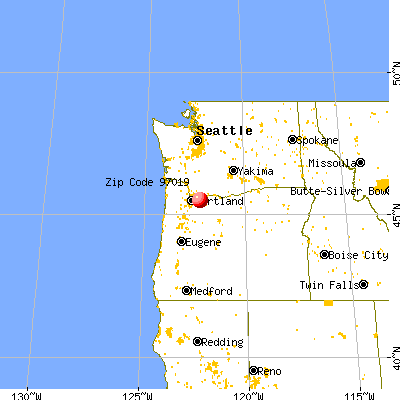
Land area: 58.7 sq. mi. Water area: 0.2 sq. mi.
Population density: 49 people per square mile
(very low).
OSM Map
General Map
Google Map
MSN Map
OSM Map
General Map
Google Map
MSN Map
OSM Map
General Map
Google Map
MSN Map
OSM Map
General Map
Google Map
MSN Map
Please wait while loading the map...
Real estate property taxes paid for housing units in 2022:
This zip code:
0.5% ($3,457)
Oregon:
0.8% ($3,646)
Median real estate property taxes paid for housing units with mortgages in 2022: $3,616 (0.5%) Median real estate property taxes paid for housing units with no mortgage in 2022: $2,592 (0.4%)
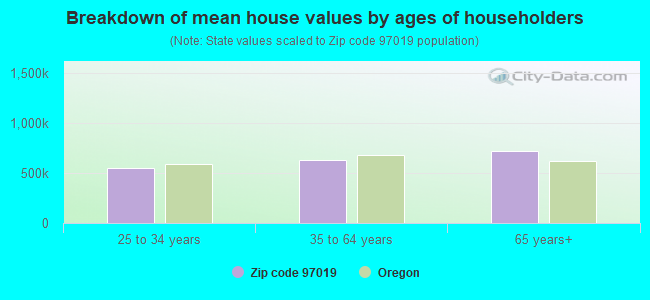
Estimated median house/condo value in 2022: $694,796
97019:
$694,796
Oregon:
$475,600
Median resident age:
This zip code:
39.3 years
Oregon median age:
40.5 years
Average household size:
This zip code:
2.8 people
Oregon:
2.4 people
Averages for the 2020 tax year for zip code 97019, filed in 2021:
Average Adjusted Gross Income (AGI) in 2020: $86,461 (Individual Income Tax Returns)
Here:
$86,461
State:
$76,001
Salary/wage: $62,760 (reported on 77.0% of returns)
Here:
$62,760
State:
$61,959
(% of AGI for various income ranges: 1264.6% for AGIs below $25k, 3714.8% for AGIs $25k-50k, 6234.3% for AGIs $50k-75k, 8645.0% for AGIs $75k-100k, 19457.5% for AGIs $100k-200k, 54153.3% for AGIs over 200k)
Taxable interest for individuals: $1,777 (reported on 40.4% of returns)
This zip code:
$1,777
Oregon:
$1,628
(% of AGI for various income ranges: 10.7% for AGIs below $25k, 24.8% for AGIs $25k-50k, 84.3% for AGIs $50k-75k, 141.7% for AGIs $75k-100k, 188.1% for AGIs $100k-200k, 1613.3% for AGIs over 200k)
Ordinary dividends: $4,739 (reported on 22.4% of returns)
Here:
$4,739
State:
$7,165
(% of AGI for various income ranges: 40.7% for AGIs below $25k, 51.0% for AGIs $25k-50k, 103.6% for AGIs $50k-75k, 122.5% for AGIs $75k-100k, 273.1% for AGIs $100k-200k, 2520.0% for AGIs over 200k)
Net capital gain/loss in AGI: +$23,579 (reported on 20.5% of returns)
Here:
+$23,579
State:
+$23,403
(% of AGI for various income ranges: 19.3% for AGIs below $25k, 50.5% for AGIs $25k-50k, 129.3% for AGIs $50k-75k, 280.8% for AGIs $75k-100k, 418.8% for AGIs $100k-200k, 21443.3% for AGIs over 200k)
Profit/loss from business: +$13,783 (reported on 18.6% of returns)
Here:
+$13,783
State:
+$16,511
(% of AGI for various income ranges: 144.6% for AGIs below $25k, 196.7% for AGIs $25k-50k, 636.4% for AGIs $50k-75k, 441.7% for AGIs $75k-100k, 1286.2% for AGIs $100k-200k)
Taxable individual retirement arrangement distribution: $13,978 (reported on 11.2% of returns)
97019:
$13,978
Oregon:
$20,730
(% of AGI for various income ranges: 59.6% for AGIs below $25k, 103.3% for AGIs $25k-50k, 300.7% for AGIs $50k-75k, 449.2% for AGIs $75k-100k, 732.5% for AGIs $100k-200k)
Total itemized deductions: $29,107 (reported on 16.8% of returns)
Here:
$29,107
State:
$31,050
(% of AGI for various income ranges: 421.9% for AGIs $25k-50k, 342.9% for AGIs $50k-75k, 1247.5% for AGIs $75k-100k, 1960.0% for AGIs $100k-200k, 6200.0% for AGIs over 200k)
Charity contributions: $5,486 (reported on 13.0% of returns)
Here:
$5,486
State:
$8,791
(% of AGI for various income ranges: 63.8% for AGIs $25k-50k, 111.7% for AGIs $75k-100k, 346.9% for AGIs $100k-200k, 1096.7% for AGIs over 200k)
Taxes paid: $8,892 (reported on 16.1% of returns)
97019:
$8,892
State:
$8,487
(% of AGI for various income ranges: 57.5% for AGIs below $25k, 118.6% for AGIs $50k-75k, 383.3% for AGIs $75k-100k, 621.2% for AGIs $100k-200k, 1770.0% for AGIs over 200k)
Earned income credit: $1,707 (reported on 9.3% of returns)
Here:
$1,707
State:
$1,977
(% of AGI for various income ranges: 52.9% for AGIs below $25k, 51.4% for AGIs $25k-50k)
Percentage of individuals using paid preparers for their 2020 taxes: 89.4%
Here:
89%
State:
93%
(% for various income ranges: 88.6% for AGIs below $25k, 84.4% for AGIs $25k-50k, 90.9% for AGIs $50k-75k, 90.0% for AGIs $75k-100k, 90.9% for AGIs $100k-200k, 100.0% for AGIs over 200k)
Averages for the 2012 tax year for zip code 97019, filed in 2013:
Average Adjusted Gross Income (AGI) in 2012: $62,375 (Individual Income Tax Returns)
Here:
$62,375
State:
$57,845
Salary/wage: $51,170 (reported on 79.5% of returns)
Here:
$51,170
State:
$47,723
(% of AGI for various income ranges: 65.5% for AGIs below $25k, 67.9% for AGIs $25k-50k, 69.9% for AGIs $50k-75k, 65.7% for AGIs $75k-100k, 76.5% for AGIs $100k-200k, 33.8% for AGIs over 200k)
Taxable interest for individuals: $1,284 (reported on 39.7% of returns)
This zip code:
$1,284
Oregon:
$1,848
(% of AGI for various income ranges: 0.9% for AGIs below $25k, 0.9% for AGIs $25k-50k, 1.2% for AGIs $50k-75k, 1.0% for AGIs $75k-100k, 0.4% for AGIs $100k-200k, 1.1% for AGIs over 200k)
Ordinary dividends: $3,003 (reported on 23.3% of returns)
Here:
$3,003
State:
$5,987
(% of AGI for various income ranges: 1.3% for AGIs below $25k, 1.1% for AGIs $25k-50k, 1.0% for AGIs $50k-75k, 1.0% for AGIs $75k-100k, 0.6% for AGIs $100k-200k, 2.4% for AGIs over 200k)
Net capital gain/loss in AGI: +$2,925 (reported on 19.2% of returns)
Here:
+$2,925
State:
+$13,095
(% of AGI for various income ranges: 0.6% for AGIs $50k-75k, 0.1% for AGIs $75k-100k, 1.0% for AGIs $100k-200k, 3.3% for AGIs over 200k)
Profit/loss from business: +$15,400 (reported on 19.9% of returns)
Here:
+$15,400
State:
+$13,871
(% of AGI for various income ranges: 12.7% for AGIs below $25k, 6.0% for AGIs $25k-50k, 4.1% for AGIs $50k-75k, 5.1% for AGIs $75k-100k, 5.5% for AGIs $100k-200k)
Taxable individual retirement arrangement distribution: $12,294 (reported on 11.6% of returns)
97019:
$12,294
Oregon:
$16,036
(% of AGI for various income ranges: 2.9% for AGIs below $25k, 2.7% for AGIs $25k-50k, 2.6% for AGIs $50k-75k, 4.5% for AGIs $75k-100k, 1.7% for AGIs $100k-200k)
Total itemized deductions: $24,703 (25% of AGI, reported on 47.9% of returns)
Here:
$24,703
State:
$24,430
Here:
25.4% of AGI
State:
23.2% of AGI
(% of AGI for various income ranges: 16.9% for AGIs below $25k, 15.2% for AGIs $25k-50k, 18.7% for AGIs $50k-75k, 21.3% for AGIs $75k-100k, 21.0% for AGIs $100k-200k, 16.1% for AGIs over 200k)
Charity contributions: $3,276 (reported on 40.4% of returns)
Here:
$3,276
State:
$3,648
(% of AGI for various income ranges: 1.2% for AGIs below $25k, 1.5% for AGIs $25k-50k, 2.1% for AGIs $50k-75k, 2.4% for AGIs $75k-100k, 2.3% for AGIs $100k-200k, 2.4% for AGIs over 200k)
Taxes paid: $10,065 (reported on 47.3% of returns)
97019:
$10,065
State:
$10,269
(% of AGI for various income ranges: 3.5% for AGIs below $25k, 3.9% for AGIs $25k-50k, 6.2% for AGIs $50k-75k, 7.8% for AGIs $75k-100k, 9.4% for AGIs $100k-200k, 9.9% for AGIs over 200k)
Earned income credit: $1,939 (reported on 12.3% of returns)
Here:
$1,939
State:
$2,021
(% of AGI for various income ranges: 4.0% for AGIs below $25k, 1.0% for AGIs $25k-50k)
Percentage of individuals using paid preparers for their 2012 taxes: 52.7%
Here:
53%
State:
47%
(% for various income ranges: 41.7% for AGIs below $25k, 51.6% for AGIs $25k-50k, 57.1% for AGIs $50k-75k, 60.0% for AGIs $75k-100k, 63.6% for AGIs $100k-200k, 75.0% for AGIs over 200k)
Averages for the 2004 tax year for zip code 97019, filed in 2005:
Average Adjusted Gross Income (AGI) in 2004: $46,648 (Individual Income Tax Returns)
Here:
$46,648
State:
$46,788
Salary/wage: $40,929 (reported on 80.7% of returns)
Here:
$40,929
State:
$39,788
(% of AGI for various income ranges: 234.5% for AGIs below $10k, 68.2% for AGIs $10k-25k, 77.3% for AGIs $25k-50k, 77.7% for AGIs $50k-75k, 79.0% for AGIs $75k-100k, 51.1% for AGIs over 100k)
Taxable interest for individuals: $1,045 (reported on 50.5% of returns)
This zip code:
$1,045
Oregon:
$2,126
(% of AGI for various income ranges: 14.0% for AGIs below $10k, 1.5% for AGIs $10k-25k, 1.8% for AGIs $25k-50k, 1.1% for AGIs $50k-75k, 0.4% for AGIs $75k-100k, 0.7% for AGIs over 100k)
Taxable dividends: $1,281 (reported on 26.2% of returns)
Here:
$1,281
State:
$3,427
(% of AGI for various income ranges: 6.2% for AGIs below $10k, 1.3% for AGIs $10k-25k, 0.6% for AGIs $25k-50k, 0.7% for AGIs $50k-75k, 0.5% for AGIs $75k-100k, 0.6% for AGIs over 100k)
Net capital gain/loss: +$11,085 (reported on 23.6% of returns)
Here:
+$11,085
State:
+$12,447
(% of AGI for various income ranges: -1.3% for AGIs below $10k, 0.1% for AGIs $10k-25k, 1.2% for AGIs $25k-50k, 2.2% for AGIs $50k-75k, 3.2% for AGIs $75k-100k, 14.1% for AGIs over 100k)
Profit/loss from business: +$11,488 (reported on 18.0% of returns)
Here:
+$11,488
State:
+$11,682
(% of AGI for various income ranges: -16.4% for AGIs below $10k, 11.1% for AGIs $10k-25k, 3.9% for AGIs $25k-50k, 4.7% for AGIs $50k-75k, 1.6% for AGIs $75k-100k, 5.6% for AGIs over 100k)
IRA payment deduction: $3,041 (reported on 3.4% of returns)
97019:
$3,041
Oregon:
$3,035
Self-employed pension: $9,538 (reported on 0.9% of returns)
Here:
$9,538
Oregon:
$14,224
Total itemized deductions: $20,736 (28% of AGI, reported on 49.5% of returns)
Here:
$20,736
State:
$20,209
Here:
28.1% of AGI
State:
24.7% of AGI
(% of AGI for various income ranges: 51.5% for AGIs below $10k, 22.0% for AGIs $10k-25k, 20.6% for AGIs $25k-50k, 24.0% for AGIs $50k-75k, 24.9% for AGIs $75k-100k, 18.3% for AGIs over 100k)
Charity contributions deductions: $3,232 (4% of AGI, reported on 43.1% of returns)
Here:
$3,232
State:
$3,145
Here:
4.2% of AGI
State:
3.6% of AGI
(% of AGI for various income ranges: 3.4% for AGIs below $10k, 2.2% for AGIs $10k-25k, 2.3% for AGIs $25k-50k, 2.2% for AGIs $50k-75k, 3.1% for AGIs $75k-100k, 4.1% for AGIs over 100k)
Total tax: $6,357 (reported on 77.7% of returns)
97019:
$6,357
State:
$7,148
(% of AGI for various income ranges: 6.2% for AGIs below $10k, 5.5% for AGIs $10k-25k, 6.8% for AGIs $25k-50k, 8.3% for AGIs $50k-75k, 9.0% for AGIs $75k-100k, 17.0% for AGIs over 100k)
Earned income credit: $1,439 (reported on 10.3% of returns)
Here:
$1,439
State:
$1,605
Percentage of individuals using paid preparers for their 2004 taxes: 54.8%
Here:
55%
State:
53%
(% for various income ranges: 45.3% for AGIs below $10k, 53.0% for AGIs $10k-25k, 51.7% for AGIs $25k-50k, 63.5% for AGIs $50k-75k, 55.1% for AGIs $75k-100k, 73.9% for AGIs over 100k)
Likely homosexual households (counted as self-reported same-sex unmarried-partner households)
Lesbian couples: 0.4% of all households
Gay men: 0.0% of all households
Household received Food Stamps/SNAP in the past 12 months: 17 Household did not receive Food Stamps/SNAP in the past 12 months: 979
Women who had a birth in the past 12 months: 147 (147 now married, 0 unmarried) Women who did not have a birth in the past 12 months: 466 (294 now married, 164 unmarried)
Housing units in zip code 97019 with a mortgage: 650 (74 second mortgage, 73 both second mortgage and home equity loan) Median monthly owner costs for units with a mortgage: $2,176 Median monthly owner costs for units without a mortgage: $630
Residents with income below the poverty level in 2022:
This zip code:
3.3%
Whole state:
12.1%
Residents with income below 50% of the poverty level in 2022:
This zip code:
2.1%
Whole state:
6.2%
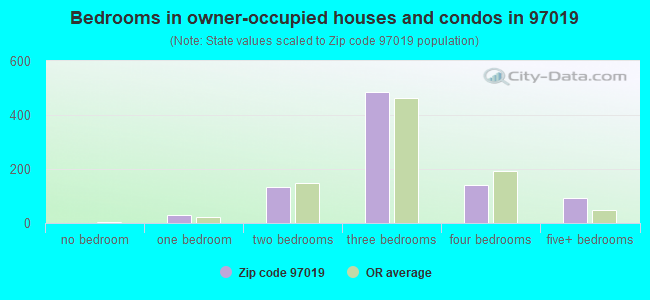
Median number of rooms in houses and condos:
Here:
7.5
State:
6.2
Median number of rooms in apartments:
Here:
6.1
State:
4.0
Notable locations in this zip code not listed on our city pages
Notable locations in zip code 97019: Latourell Recreation Site (A), Corbett Station (B), Trout Creek Camp (C), Wahkeena Falls Recreation Site (D), Multnomah County Rural Fire Protection District 14 Station 62 Corbett (E), Multnomah County Rural Fire Protection District 14 Station 63 Aims (F). Display/hide their locations on the map
Rivers and creeks: Dalton Creek (A), Henderson Creek (B), Gordon Creek (C), Donahue Creek (D), Cat Creek (E), Bull Run River (F), Buck Creek (G), Big Creek (H), Martin Creek (I). Display/hide their locations on the map
Parks in zip code 97019 include: Larch Mountain Corridor (1), Indian John Island Park (2), Crown Point State Park (3), George W Joseph State Park (4), Guy W Talbot State Park (5), Shepperds Dell State Park (6), Bridal Veil Falls State Park (7), Portland Womens Forum State Park (8). Display/hide their locations on the map
In group quarters: 8 (-1 institutionalized population)
Size of family households: 243 2-persons, 120 3-persons, 275 4-persons, 70 5-persons, 8 6-persons, 9 7-or-more-persons
Size of nonfamily households: 215 1-person, 26 2-persons, 22 3-persons
537 married couples with children.
43 single-parent households (43 men).
90.9% of residents of 97019 zip code speak English at home.
6.5% of residents speak Spanish at home (93% very well, 7% well).
1.4% of residents speak other Indo-European language at home (100% very well).
0.8% of residents speak Asian or Pacific Island language at home (100% very well).
0.4% of residents speak other language at home (100% very well).
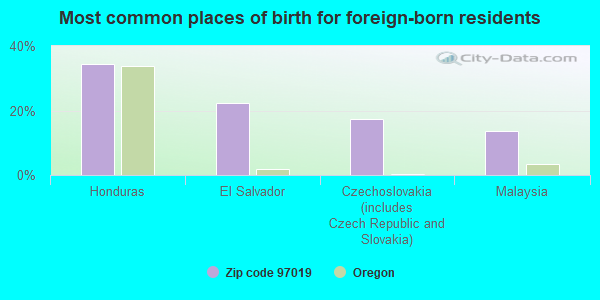
Foreign born population: 58 (2.0%) (46.3% of them are naturalized citizens)
This zip code:
2.0%
Whole state:
9.9%
34%Honduras
22%El Salvador
17%Czechoslovakia (includes Czech Republic and Slovakia)
14%Malaysia
14%German
12%American
5%French
3%Norwegian
3%English
3%Italian
3%European
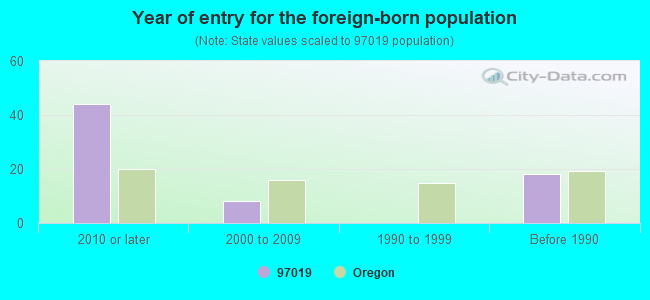
Year of entry for the foreign-born population
442010 or later
82000 to 2009
01990 to 1999
18Before 1990
Facilities with environmental interests located in this zip code:
COLUMBIA FOOD LABORATORIES INC (36740 E HISTORIC COLUMBIA RIV in CORBETT, OR)
STATE MASTER (Oregon inspections and permits database) - OR-HWMS-4460, SQG Small Quantity Generators, between 100 kg and 1000 kg of hazardous waste/month (Resource Conservation and Recovery Act (tracking hazardous waste)) - notification Business SIC classification: SEWERAGE SYSTEMS; TESTING LABORATORIES Organizations: COLUMBIA LABORATORIES INC (CONTACT/ HAZARDOUS WASTE)
, COLUMBIA FOOD LABORATORIES, INC. (CONTACT/ HAZARDOUS WASTE)
, LEIGH PROPERTIES (HAZARDOUS WASTE LAND OWNER)
, COLUMBIA LABORATORIES INC. (HAZARDOUS WASTE LAND OWNER)
, CLACKAMAS COUNTY BANK (HAZARDOUS WASTE LAND OWNER)
, COLUMBIA FOOD LABORATORIES, INC. (HAZARDOUS WASTE LEGAL OWNER)
, COLUMBIA LABORATORIES INC (HAZARDOUS WASTE SITE CONTACT)
CORBETT GRADE. SCHOOL (35800 E HIST COLUMBIA RIVER H in CORBETT, OR)
(National Center for Education Statistics) - STATE ID-968 Organizations: CORBETT SCH DIST 039 (SCHOOL DISTRICT)
CORBETT HIGH SCHOOL (35800 E HIST COLUMBIA RIVER H in CORBETT, OR)
(National Center for Education Statistics) - STATE ID-971 Organizations: CORBETT SCH DIST 039 (SCHOOL DISTRICT)
CORBETT MIDDLE SCHOOL (35800 E HIST COLUMBIA RIVER H in CORBETT, OR)
(National Center for Education Statistics) - STATE ID-969 Organizations: CORBETT SCH DIST 039 (SCHOOL DISTRICT)
CORBETT SD 39 (35800 E HISTORIC COLUMBIA RIV in CORBETT, OR)
COMPLIANCE ACTIVITY (Tracking inspections of insecticide, fungicide, and rodenticide, and toxic substances) Conditionally Exempt Small Quantity Generators, less than 100 kg/month of hazardous waste (Resource Conservation and Recovery Act (tracking hazardous waste)) - notification Organizations: CORBETT SCHOOL DISTRICT NO 39 (CONTACT/OPERATOR)
CORBETT RACK - POUNDER OIL SERVICES, INC. (36014 E. HISTORIC COLUMBIA RIVER HWY in CORBETT, OR)
ENFORCEMENT/COMPLIANCE ACTIVITY (Integrated Compliance Information System)
Housing units lacking complete kitchen facilities: 2.5%
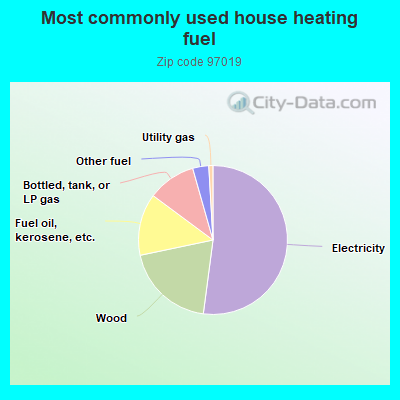
52.3%Electricity
19.7%Wood
13.5%Fuel oil, kerosene, etc.
10.5%Bottled, tank, or LP gas
3.5%Other fuel
0.9%Utility gas
Population in 1990: 2,355. Population change in the 1990s: +569 (+24.2%).
Place of birth for U.S.-born residents:
This state: 1,790
Northeast: 115
Midwest: 150
South: 85
West: 652
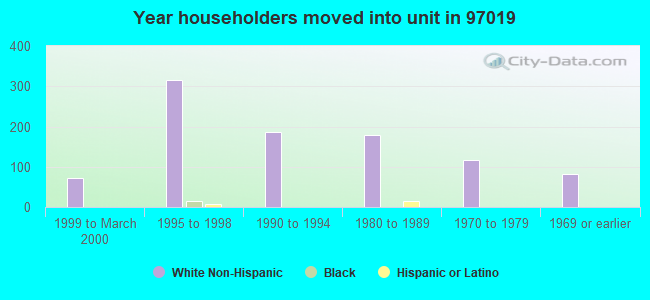
69% of the 97019 zip code residents lived in the same house 5 years ago. Out of people who lived in different houses, 74% lived in this county. Out of people who lived in different counties, 50% lived in Oregon.
89% of the 97019 zip code residents lived in the same house 1 year ago. Out of people who lived in different houses, 34% moved from this county. Out of people who lived in different houses, 72% moved from different county within same state. Out of people who lived in different houses, 0% moved from different state.
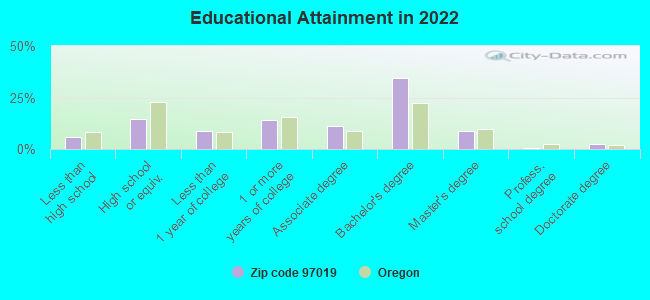
Private vs. public school enrollment:
Students in private schools in grades 1 to 8 (elementary and middle school): 45
Here:
14.5%
Oregon:
13.7%
Students in private schools in grades 9 to 12 (high school): 14
Here:
18.2%
Oregon:
8.8%
Students in private undergraduate colleges: 8
Here:
10.8%
Oregon:
17.7%
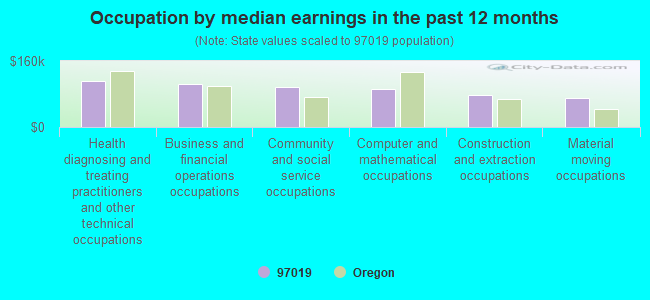
Occupation by median earnings in the past 12 months ($)
112,003Health diagnosing and treating practitioners and other technical occupations
103,990Business and financial operations occupations
96,046Community and social service occupations
91,336Computer and mathematical occupations
78,339Construction and extraction occupations
70,277Material moving occupations
Companies with federal contracts located in this zip code:
CROWN POINT REFUSE & RECYCLING (1525 NE CRESTVIEW LANE in CORBETT, OR; small business) : $190,090 in 20 contractsfrom 2002 to 2006
Contracts for Trash/Garbage Collection Services - Including Portable Sanitation Services by Army, U.S. Army Corps of Engineers - civil program financing only Signed by year:2000: $0; 2001: $0; 2002: $6,272; 2003: $47,265; 2004: $56,236; 2005: $50,198; 2006: $30,119.
Biggest contracts:
$30,119 with Army for Trash/Garbage Collection Services - Including Portable Sanitation Services. Signed on 2006-03-30. Completion date: 2006-09-30.
$25,099, same as above.Signed on 2005-04-05. Completion date: 2006-09-30.
$25,099 with U.S. Army Corps of Engineers - civil program financing only for Trash/Garbage Collection Services - Including Portable Sanitation Services. Signed on 2005-04-05. Completion date: 2006-09-30.
$22,588, same as above.Signed on 2004-01-30. Completion date: 2006-09-30.
COLUMBIA FOOD LABORATORIES INC (36740 HISTORIC COLUMBIA R in CORBETT, OR; small business) : $2,200 in 2 contractsin 2003
$5,000 with U.S. Army Corps of Engineers - civil program financing only for Environmental Studies and Assessments. Signed on 2003-06-13. Completion date: 2003-09-30.
-$2,800, same as above.Signed on 2003-09-24. Completion date: 2003-09-30.
Top industries in this zip code by the number of employees in 2005:
Other Services (except Public Administration): Religious Organizations (50-99 employees: 1 establishment, 5-9 employees: 1 establishment, 1-4 employees: 2 establishments)
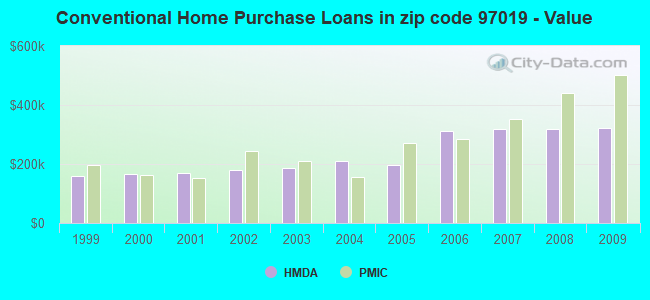
Detailed PMIC statistics for the following Tracts:0105.00
2002 - 2018 National Fire Incident Reporting System (NFIRS) incidents
According to the data from the years 2002 - 2018 the average number of fires per year is 16. The highest number of fires - 26 took place in 2004, and the least - 4 in 2017. The data has a dropping trend.
When looking into fire subcategories, the most reports belonged to: Structure Fires (39.8%), and Mobile Property/Vehicle Fires (31.6%).
Fire incident types reported to NFIRS in Zip Code 97019


 Nearest zip codes: 98671, 97060, 97009, 97080, 97055, 97022.


 According to the data from the years 2002 - 2018 the average number of fires per year is 16. The highest number of fires - 26 took place in 2004, and the least - 4 in 2017. The data has a dropping trend.
 When looking into fire subcategories, the most reports belonged to: Structure Fires (39.8%), and Mobile Property/Vehicle Fires (31.6%).