Estimated zip code population in 2022: 1,960 Zip code population in 2010: 1,899 Zip code population in 2000: 1,993
Houses and condos: 2,239 Renter-occupied apartments: 86
% of renters here:
10%
State:
37%
March 2022 cost of living index in zip code 97049: 103.8 (near average, U.S. average is 100)
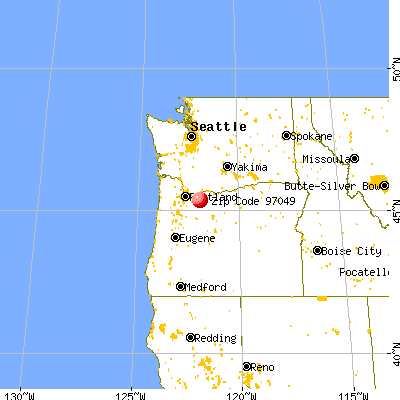
Land area: 153.8 sq. mi. Water area: 0.8 sq. mi.
Population density: 13 people per square mile
(very low).
OSM Map
General Map
Google Map
MSN Map
OSM Map
General Map
Google Map
MSN Map
OSM Map
General Map
Google Map
MSN Map
OSM Map
General Map
Google Map
MSN Map
Please wait while loading the map...
Real estate property taxes paid for housing units in 2022:
This zip code:
0.8% ($3,826)
Oregon:
0.8% ($3,646)
Median real estate property taxes paid for housing units with mortgages in 2022: $3,882 (0.8%) Median real estate property taxes paid for housing units with no mortgage in 2022: $3,145 (0.5%)
Business Search- 14 Million verified businesses
Males: 1,127
(57.5%)
Females: 833
(42.5%)
For population 25 years and over in 97049:
High school or higher: 98.0%
Bachelor's degree or higher: 35.9%
Graduate or professional degree: 12.0%
Unemployed: 2.8%
Mean travel time to work (commute): 34.4 minutes
For population 15 years and over in 97049:
Never married: 31.1%
Now married: 54.1%
Separated: 0.0%
Widowed: 2.2%
Divorced: 12.6%
Zip code 97049 compared to state average:
Black race population percentage significantly below state average.
Hispanic race population percentage significantly below state average.
Median age significantly above state average.
Foreign-born population percentage significantly below state average.
Renting percentage significantly below state average.
Length of stay since moving in significantly above state average.
Estimated median house/condo value in 2022: $498,194
97049:
$498,194
Oregon:
$475,600
Median resident age:
This zip code:
51.3 years
Oregon median age:
40.5 years
Average household size:
This zip code:
2.1 people
Oregon:
2.4 people
Averages for the 2020 tax year for zip code 97049, filed in 2021:
Average Adjusted Gross Income (AGI) in 2020: $65,004 (Individual Income Tax Returns)
Here:
$65,004
State:
$76,001
Salary/wage: $54,031 (reported on 80.5% of returns)
Here:
$54,031
State:
$61,959
(% of AGI for various income ranges: 1425.0% for AGIs below $25k, 3530.0% for AGIs $25k-50k, 6873.3% for AGIs $50k-75k, 11804.0% for AGIs $75k-100k, 18890.0% for AGIs $100k-200k)
Taxable interest for individuals: $804 (reported on 35.1% of returns)
This zip code:
$804
Oregon:
$1,628
(% of AGI for various income ranges: 14.2% for AGIs below $25k, 17.7% for AGIs $25k-50k, 60.0% for AGIs $50k-75k, 64.0% for AGIs $75k-100k, 113.8% for AGIs $100k-200k)
Ordinary dividends: $2,986 (reported on 18.2% of returns)
Here:
$2,986
State:
$7,165
(% of AGI for various income ranges: 52.3% for AGIs $25k-50k, 154.4% for AGIs $50k-75k, 263.8% for AGIs $100k-200k)
Net capital gain/loss in AGI: +$5,577 (reported on 16.9% of returns)
Here:
+$5,577
State:
+$23,403
(% of AGI for various income ranges: 65.4% for AGIs $25k-50k, 321.1% for AGIs $50k-75k, 438.8% for AGIs $100k-200k)
Profit/loss from business: +$12,592 (reported on 15.6% of returns)
Here:
+$12,592
State:
+$16,511
(% of AGI for various income ranges: 135.8% for AGIs below $25k, 126.2% for AGIs $25k-50k, 318.9% for AGIs $50k-75k, 1121.2% for AGIs $100k-200k)
Taxable individual retirement arrangement distribution: $16,900 (reported on 10.4% of returns)
97049:
$16,900
Oregon:
$20,730
(% of AGI for various income ranges: 130.8% for AGIs below $25k, 264.6% for AGIs $25k-50k, 1702.0% for AGIs $75k-100k)
Total itemized deductions: $27,282 (reported on 14.3% of returns)
Here:
$27,282
State:
$31,050
(% of AGI for various income ranges: 439.2% for AGIs $25k-50k, 732.2% for AGIs $50k-75k, 952.0% for AGIs $75k-100k, 1618.8% for AGIs $100k-200k)
Charity contributions: $2,700 (reported on 9.1% of returns)
Here:
$2,700
State:
$8,791
(% of AGI for various income ranges: 64.4% for AGIs $50k-75k, 163.8% for AGIs $100k-200k)
Taxes paid: $7,627 (reported on 14.3% of returns)
97049:
$7,627
State:
$8,487
(% of AGI for various income ranges: 115.8% for AGIs below $25k, 172.2% for AGIs $50k-75k, 350.0% for AGIs $75k-100k, 462.5% for AGIs $100k-200k)
Earned income credit: $1,900 (reported on 10.4% of returns)
Here:
$1,900
State:
$1,977
(% of AGI for various income ranges: 79.2% for AGIs below $25k, 43.8% for AGIs $25k-50k)
Percentage of individuals using paid preparers for their 2020 taxes: 94.8%
Here:
95%
State:
93%
(% for various income ranges: 95.0% for AGIs below $25k, 94.7% for AGIs $25k-50k, 92.9% for AGIs $50k-75k, 100.0% for AGIs $75k-100k, 93.3% for AGIs $100k-200k)
Averages for the 2012 tax year for zip code 97049, filed in 2013:
Average Adjusted Gross Income (AGI) in 2012: $48,378 (Individual Income Tax Returns)
Here:
$48,378
State:
$57,845
Salary/wage: $41,969 (reported on 79.7% of returns)
Here:
$41,969
State:
$47,723
(% of AGI for various income ranges: 77.3% for AGIs below $25k, 71.5% for AGIs $25k-50k, 73.5% for AGIs $50k-75k, 74.5% for AGIs $75k-100k, 59.6% for AGIs $100k-200k)
Taxable interest for individuals: $1,167 (reported on 28.1% of returns)
This zip code:
$1,167
Oregon:
$1,848
(% of AGI for various income ranges: 0.1% for AGIs below $25k, 1.2% for AGIs $25k-50k, 0.8% for AGIs $50k-75k, 0.2% for AGIs $75k-100k, 0.7% for AGIs $100k-200k)
Ordinary dividends: $1,983 (reported on 18.8% of returns)
Here:
$1,983
State:
$5,987
(% of AGI for various income ranges: 0.8% for AGIs below $25k, 1.6% for AGIs $25k-50k, 1.1% for AGIs $50k-75k, 0.5% for AGIs $100k-200k)
Net capital gain/loss in AGI: +$8,100 (reported on 12.5% of returns)
Here:
+$8,100
State:
+$13,095
(% of AGI for various income ranges: 0.3% for AGIs $50k-75k, 11.3% for AGIs $75k-100k)
Profit/loss from business: +$7,145 (reported on 17.2% of returns)
Here:
+$7,145
State:
+$13,871
(% of AGI for various income ranges: 7.3% for AGIs below $25k, 9.1% for AGIs $25k-50k, 1.3% for AGIs $75k-100k)
Taxable individual retirement arrangement distribution: $11,533 (reported on 9.4% of returns)
97049:
$11,533
Oregon:
$16,036
Total itemized deductions: $17,842 (25% of AGI, reported on 48.4% of returns)
Here:
$17,842
State:
$24,430
Here:
25.2% of AGI
State:
23.2% of AGI
(% of AGI for various income ranges: 13.8% for AGIs below $25k, 19.3% for AGIs $25k-50k, 19.5% for AGIs $50k-75k, 18.5% for AGIs $75k-100k, 16.7% for AGIs $100k-200k)
Charity contributions: $1,610 (reported on 31.2% of returns)
Here:
$1,610
State:
$3,648
(% of AGI for various income ranges: 1.1% for AGIs $25k-50k, 1.1% for AGIs $50k-75k, 1.1% for AGIs $75k-100k, 1.3% for AGIs $100k-200k)
Taxes paid: $6,665 (reported on 48.4% of returns)
97049:
$6,665
State:
$10,269
(% of AGI for various income ranges: 3.9% for AGIs below $25k, 5.1% for AGIs $25k-50k, 6.4% for AGIs $50k-75k, 7.7% for AGIs $75k-100k, 7.9% for AGIs $100k-200k)
Earned income credit: $1,456 (reported on 14.1% of returns)
Here:
$1,456
State:
$2,021
(% of AGI for various income ranges: 3.2% for AGIs below $25k, 0.8% for AGIs $25k-50k)
Percentage of individuals using paid preparers for their 2012 taxes: 46.9%
Here:
47%
State:
47%
(% for various income ranges: 34.8% for AGIs below $25k, 43.8% for AGIs $25k-50k, 72.7% for AGIs $50k-75k, 42.9% for AGIs $75k-100k, 57.1% for AGIs $100k-200k)
Averages for the 2004 tax year for zip code 97049, filed in 2005:
Average Adjusted Gross Income (AGI) in 2004: $43,228 (Individual Income Tax Returns)
Here:
$43,228
State:
$46,788
Salary/wage: $37,853 (reported on 85.1% of returns)
Here:
$37,853
State:
$39,788
(% of AGI for various income ranges: 105.9% for AGIs below $10k, 73.8% for AGIs $10k-25k, 79.2% for AGIs $25k-50k, 76.0% for AGIs $50k-75k, 73.6% for AGIs $75k-100k, 67.2% for AGIs over 100k)
Taxable interest for individuals: $916 (reported on 41.9% of returns)
This zip code:
$916
Oregon:
$2,126
(% of AGI for various income ranges: 0.5% for AGIs below $10k, 0.8% for AGIs $10k-25k, 1.4% for AGIs $25k-50k, 1.3% for AGIs $50k-75k, 0.7% for AGIs $75k-100k, 0.2% for AGIs over 100k)
Taxable dividends: $1,496 (reported on 19.1% of returns)
Here:
$1,496
State:
$3,427
(% of AGI for various income ranges: 1.2% for AGIs $10k-25k, 0.9% for AGIs $25k-50k, 0.3% for AGIs $50k-75k, 0.3% for AGIs $75k-100k, 0.9% for AGIs over 100k)
Net capital gain/loss: +$6,055 (reported on 14.6% of returns)
Here:
+$6,055
State:
+$12,447
(% of AGI for various income ranges: -1.5% for AGIs $10k-25k, -0.0% for AGIs $25k-50k, 0.9% for AGIs $50k-75k, 0.0% for AGIs $75k-100k, 8.1% for AGIs over 100k)
Profit/loss from business: +$7,767 (reported on 19.3% of returns)
Here:
+$7,767
State:
+$11,682
(% of AGI for various income ranges: 18.3% for AGIs below $10k, 4.4% for AGIs $10k-25k, 7.1% for AGIs $25k-50k, 2.4% for AGIs $50k-75k, 2.3% for AGIs over 100k)
IRA payment deduction: $1,750 (reported on 1.9% of returns)
97049:
$1,750
Oregon:
$3,035
Total itemized deductions: $17,171 (28% of AGI, reported on 54.4% of returns)
Here:
$17,171
State:
$20,209
Here:
27.9% of AGI
State:
24.7% of AGI
(% of AGI for various income ranges: 32.1% for AGIs below $10k, 20.0% for AGIs $10k-25k, 22.7% for AGIs $25k-50k, 22.4% for AGIs $50k-75k, 23.1% for AGIs $75k-100k, 18.6% for AGIs over 100k)
Charity contributions deductions: $1,633 (3% of AGI, reported on 44.6% of returns)
Here:
$1,633
State:
$3,145
Here:
2.5% of AGI
State:
3.6% of AGI
(% of AGI for various income ranges: 1.6% for AGIs $10k-25k, 1.8% for AGIs $25k-50k, 1.9% for AGIs $50k-75k, 1.6% for AGIs $75k-100k, 1.5% for AGIs over 100k)
Total tax: $5,246 (reported on 78.3% of returns)
97049:
$5,246
State:
$7,148
(% of AGI for various income ranges: 4.0% for AGIs below $10k, 5.0% for AGIs $10k-25k, 7.1% for AGIs $25k-50k, 8.8% for AGIs $50k-75k, 9.9% for AGIs $75k-100k, 14.3% for AGIs over 100k)
Earned income credit: $1,419 (reported on 11.9% of returns)
Here:
$1,419
State:
$1,605
Percentage of individuals using paid preparers for their 2004 taxes: 48.3%
Here:
48%
State:
53%
(% for various income ranges: 35.1% for AGIs below $10k, 44.1% for AGIs $10k-25k, 51.9% for AGIs $25k-50k, 46.9% for AGIs $50k-75k, 61.7% for AGIs $75k-100k, 69.6% for AGIs over 100k)
Household received Food Stamps/SNAP in the past 12 months: 117 Household did not receive Food Stamps/SNAP in the past 12 months: 783
Women who had a birth in the past 12 months: 28 (28 now married, 0 unmarried) Women who did not have a birth in the past 12 months: 326 (157 now married, 167 unmarried)
Housing units in zip code 97049 with a mortgage: 712 (63 second mortgage, 9 home equity loan, 55 both second mortgage and home equity loan) Median monthly owner costs for units with a mortgage: $2,030 Median monthly owner costs for units without a mortgage: $546
Residents with income below the poverty level in 2022:
This zip code:
8.4%
Whole state:
12.1%
Residents with income below 50% of the poverty level in 2022:
This zip code:
5.5%
Whole state:
6.2%
Median number of rooms in houses and condos:
Here:
6.3
State:
6.2
Median number of rooms in apartments:
Here:
3.4
State:
4.0
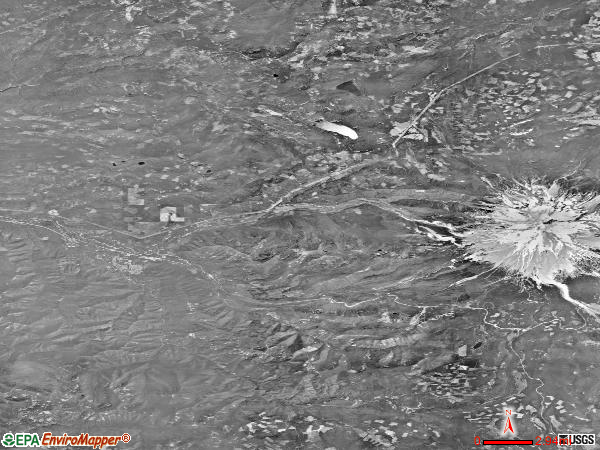
Notable locations in this zip code not listed on our city pages
Notable locations in zip code 97049: Zigzag East Lookout (A), Lost Creek Recreation Site (B), Kinzel Lake Campground (C), McNeil Recreation Site (D), Fir Tree Forest Camp (E), Devils Meadow Campground (F), Camp Creek Recreation Site (G), Paradise Park Shelter (H), Pioneer Tollgate Campground (I), Salmon River Guard Station (J), Lost Creek Camp (K), Tollgate Recreation Site (L), Riley Horse Camp (M), Camp Blossom (N), Upper Sandy Guard Station (O), Bald Mountain Shelter (P). Display/hide their locations on the map
Lakes, reservoirs, and swamps: Goodfellow Lakes (A), Hickman Lake (B), Hidden Lake (C), Bull Run Lake (D), Kinzel Lake (E), Veda Lake (F), Burnt Lake (G), Cast Lake (H). Display/hide their locations on the map
Streams, rivers, and creeks: Wolf Creek (A), Lady Creek (B), Zigzag River (C), Katy Creek (D), Muddy Fork (E), Horseshoe Creek (F), Swift Creek (G), Hickman Creek (H), Henry Creek (I). Display/hide their locations on the map
In group quarters: 35 (-1 institutionalized population)
Size of family households: 246 2-persons, 152 3-persons, 79 4-persons, 38 5-persons
Size of nonfamily households: 344 1-person, 40 2-persons, 5 3-persons
226 married couples with children.
33 single-parent households (21 men, 12 women).
95.3% of residents of 97049 zip code speak English at home.
2.1% of residents speak Spanish at home (57% very well, 42% not well).
1.1% of residents speak other Indo-European language at home (100% very well).
1.2% of residents speak Asian or Pacific Island language at home (100% very well).
Foreign born population: 58 (3.0%) (85.7% of them are naturalized citizens)
This zip code:
3.0%
Whole state:
9.9%
14%Serbia
12%Romania
17%Italian
16%American
14%Irish
14%European
8%German
4%English
4%Norwegian
Year of entry for the foreign-born population
92010 or later
122000 to 2009
91990 to 1999
26Before 1990
Housing units lacking complete plumbing facilities: 3.2% Housing units lacking complete kitchen facilities: 5.8%
51.9%Electricity
28.9%Wood
9.1%Bottled, tank, or LP gas
4.2%No fuel used
3.3%Other fuel
2.9%Utility gas
Population in 1990: 1,325. Population change in the 1990s: +668 (+50.4%).
Place of birth for U.S.-born residents:
This state: 933
Northeast: 76
Midwest: 391
South: 84
West: 406
37% of the 97049 zip code residents lived in the same house 5 years ago. Out of people who lived in different houses, 49% lived in this county. Out of people who lived in different counties, 50% lived in Oregon.
93% of the 97049 zip code residents lived in the same house 1 year ago. Out of people who lived in different houses, 54% moved from this county. Out of people who lived in different houses, 27% moved from different county within same state. Out of people who lived in different houses, 23% moved from different state.
Private vs. public school enrollment:
Students in private schools in grades 1 to 8 (elementary and middle school):
Here:
0.0%
Oregon:
13.7%
Students in private schools in grades 9 to 12 (high school):
Here:
0.0%
Oregon:
8.8%
Students in private undergraduate colleges:
Here:
0.0%
Oregon:
17.7%
Occupation by median earnings in the past 12 months ($)
122,480Health diagnosing and treating practitioners and other technical occupations
87,899Production occupations
60,875Management occupations
49,581Business and financial operations occupations
31,751Construction and extraction occupations
31,324Sales and related occupations
Top industries in this zip code by the number of employees in 2005:
Accommodation and Food Services: Limited-Service Restaurants (10-19 employees: 1 establishment)
Accommodation and Food Services: Full-Service Restaurants (10-19: 1)
Professional, Scientific, and Technical Services: Administrative Management and General Management Consulting Services (1-4: 1)
Educational Services: All Other Miscellaneous Schools and Instruction (1-4: 1)
Construction: New Single-Family Housing Construction (except Operative Builders) (1-4: 1)
Administrative and Support and Waste Management and Remediation Services: Convention and Trade Show Organizers (1-4: 1)
Construction: Siding Contractors (1-4: 1)
People in group quarters in 2000:
26 people in other workers' dormitories
Fatal accident statistics in 2013:
Fatal accident count: 1
Vehicles involved in fatal accidents: 1
Fatal accidents caused by drunken drivers: 0
Fatalities: 1
Persons involved in fatal accidents: 1
Pedestrians involved in fatal accidents: 0
Fatal accident statistics in 2010:
Fatal accident count: 1
Vehicles involved in fatal accidents: 1
Fatal accidents caused by drunken drivers: 1
Fatalities: 1
Persons involved in fatal accidents: 3
Pedestrians involved in fatal accidents: 0
Home Mortgage Disclosure Act Aggregated Statistics For Year 2009 (Based on 2 partial tracts)
A) FHA, FSA/RHS & VA Home Purchase Loans
B) Conventional Home Purchase Loans
C) Refinancings
D) Home Improvement Loans
F) Non-occupant Loans on < 5 Family Dwellings (A B C & D)
G) Loans On Manufactured Home Dwelling (A B C & D)
Number
Average Value
Number
Average Value
Number
Average Value
Number
Average Value
Number
Average Value
Number
Average Value
LOANS ORIGINATED
8
$197,638
42
$249,976
219
$220,452
11
$171,430
80
$238,655
10
$200,742
APPLICATIONS APPROVED, NOT ACCEPTED
0
$0
5
$147,846
28
$234,120
1
$188,740
10
$192,546
4
$46,358
APPLICATIONS DENIED
7
$209,670
11
$185,503
79
$234,959
6
$154,385
32
$209,408
3
$162,523
APPLICATIONS WITHDRAWN
1
$201,980
6
$198,258
51
$230,356
1
$171,350
15
$217,656
2
$190,395
FILES CLOSED FOR INCOMPLETENESS
0
$0
2
$128,310
10
$229,466
2
$70,365
5
$227,314
0
$0
Aggregated Statistics For Year 2008 (Based on 2 partial tracts)
A) FHA, FSA/RHS & VA Home Purchase Loans
B) Conventional Home Purchase Loans
C) Refinancings
D) Home Improvement Loans
F) Non-occupant Loans on < 5 Family Dwellings (A B C & D)
G) Loans On Manufactured Home Dwelling (A B C & D)
Number
Average Value
Number
Average Value
Number
Average Value
Number
Average Value
Number
Average Value
Number
Average Value
LOANS ORIGINATED
12
$211,641
65
$252,275
130
$224,811
7
$112,581
62
$257,299
14
$166,329
APPLICATIONS APPROVED, NOT ACCEPTED
2
$140,310
11
$232,386
19
$210,958
2
$50,495
10
$221,271
4
$85,262
APPLICATIONS DENIED
3
$271,243
27
$375,729
82
$214,047
12
$86,850
36
$292,719
12
$105,958
APPLICATIONS WITHDRAWN
2
$172,180
10
$253,390
34
$242,521
4
$162,455
11
$216,884
2
$127,480
FILES CLOSED FOR INCOMPLETENESS
0
$0
3
$527,310
6
$213,572
0
$0
2
$345,195
0
$0
Aggregated Statistics For Year 2007 (Based on 2 partial tracts)
A) FHA, FSA/RHS & VA Home Purchase Loans
B) Conventional Home Purchase Loans
C) Refinancings
D) Home Improvement Loans
F) Non-occupant Loans on < 5 Family Dwellings (A B C & D)
G) Loans On Manufactured Home Dwelling (A B C & D)
Number
Average Value
Number
Average Value
Number
Average Value
Number
Average Value
Number
Average Value
Number
Average Value
LOANS ORIGINATED
2
$170,115
112
$217,697
191
$222,149
13
$73,292
95
$253,969
22
$151,751
APPLICATIONS APPROVED, NOT ACCEPTED
1
$163,080
22
$184,148
48
$222,230
3
$103,200
26
$252,320
7
$159,056
APPLICATIONS DENIED
2
$188,325
60
$241,304
104
$253,745
17
$113,068
44
$266,420
16
$173,579
APPLICATIONS WITHDRAWN
1
$212,740
23
$233,044
55
$234,809
3
$190,947
23
$272,058
5
$133,110
FILES CLOSED FOR INCOMPLETENESS
0
$0
2
$196,190
12
$217,987
2
$96,440
2
$310,425
1
$99,340
Aggregated Statistics For Year 2006 (Based on 2 partial tracts)
A) FHA, FSA/RHS & VA Home Purchase Loans
B) Conventional Home Purchase Loans
C) Refinancings
D) Home Improvement Loans
F) Non-occupant Loans on < 5 Family Dwellings (A B C & D)
G) Loans On Manufactured Home Dwelling (A B C & D)
Number
Average Value
Number
Average Value
Number
Average Value
Number
Average Value
Number
Average Value
Number
Average Value
LOANS ORIGINATED
7
$180,343
247
$199,416
209
$199,242
15
$185,041
171
$221,991
21
$157,361
APPLICATIONS APPROVED, NOT ACCEPTED
1
$122,510
41
$171,637
41
$199,318
7
$120,031
17
$224,091
5
$171,024
APPLICATIONS DENIED
2
$142,795
50
$158,888
89
$187,873
16
$62,912
28
$198,849
20
$97,598
APPLICATIONS WITHDRAWN
1
$185,430
36
$168,618
58
$204,781
5
$103,806
24
$224,747
10
$144,617
FILES CLOSED FOR INCOMPLETENESS
0
$0
2
$241,720
16
$199,966
1
$248,340
2
$246,270
0
$0
Aggregated Statistics For Year 2005 (Based on 2 partial tracts)
A) FHA, FSA/RHS & VA Home Purchase Loans
B) Conventional Home Purchase Loans
C) Refinancings
D) Home Improvement Loans
F) Non-occupant Loans on < 5 Family Dwellings (A B C & D)
G) Loans On Manufactured Home Dwelling (A B C & D)
Number
Average Value
Number
Average Value
Number
Average Value
Number
Average Value
Number
Average Value
Number
Average Value
LOANS ORIGINATED
5
$166,056
273
$167,049
203
$168,594
21
$90,309
173
$190,858
17
$122,855
APPLICATIONS APPROVED, NOT ACCEPTED
0
$0
39
$125,889
46
$167,090
6
$84,298
25
$139,534
2
$225,575
APPLICATIONS DENIED
1
$174,670
55
$141,900
108
$169,745
20
$46,730
31
$176,348
19
$129,877
APPLICATIONS WITHDRAWN
2
$191,635
36
$143,876
65
$189,120
8
$113,201
18
$177,103
7
$142,854
FILES CLOSED FOR INCOMPLETENESS
0
$0
7
$187,201
45
$195,526
2
$233,855
7
$216,174
2
$162,665
Aggregated Statistics For Year 2004 (Based on 2 partial tracts)
A) FHA, FSA/RHS & VA Home Purchase Loans
B) Conventional Home Purchase Loans
C) Refinancings
D) Home Improvement Loans
F) Non-occupant Loans on < 5 Family Dwellings (A B C & D)
G) Loans On Manufactured Home Dwelling (A B C & D)
Number
Average Value
Number
Average Value
Number
Average Value
Number
Average Value
Number
Average Value
Number
Average Value
LOANS ORIGINATED
16
$143,416
185
$137,200
201
$147,999
17
$75,038
94
$151,276
23
$121,867
APPLICATIONS APPROVED, NOT ACCEPTED
5
$148,508
26
$115,828
46
$145,261
3
$46,910
11
$129,814
2
$161,005
APPLICATIONS DENIED
2
$112,165
36
$122,721
103
$151,785
16
$65,138
14
$178,331
17
$126,751
APPLICATIONS WITHDRAWN
2
$214,400
18
$173,930
65
$144,483
6
$72,570
10
$165,229
7
$151,843
FILES CLOSED FOR INCOMPLETENESS
0
$0
4
$302,975
13
$159,893
3
$126,377
5
$174,170
2
$92,300
Aggregated Statistics For Year 2003 (Based on 2 partial tracts)
A) FHA, FSA/RHS & VA Home Purchase Loans
B) Conventional Home Purchase Loans
C) Refinancings
D) Home Improvement Loans
F) Non-occupant Loans on < 5 Family Dwellings (A B C & D)
Number
Average Value
Number
Average Value
Number
Average Value
Number
Average Value
Number
Average Value
LOANS ORIGINATED
20
$151,860
143
$127,406
434
$141,750
8
$24,524
129
$139,353
APPLICATIONS APPROVED, NOT ACCEPTED
1
$126,650
19
$111,317
66
$154,460
1
$16,560
13
$152,315
APPLICATIONS DENIED
3
$164,733
35
$123,602
113
$152,901
7
$58,774
11
$158,035
APPLICATIONS WITHDRAWN
1
$100,990
17
$126,507
72
$132,701
3
$45,253
7
$153,024
FILES CLOSED FOR INCOMPLETENESS
1
$94,370
2
$216,055
12
$158,523
2
$33,110
3
$160,593
Aggregated Statistics For Year 2002 (Based on 2 partial tracts)
A) FHA, FSA/RHS & VA Home Purchase Loans
B) Conventional Home Purchase Loans
C) Refinancings
D) Home Improvement Loans
F) Non-occupant Loans on < 5 Family Dwellings (A B C & D)
Number
Average Value
Number
Average Value
Number
Average Value
Number
Average Value
Number
Average Value
LOANS ORIGINATED
14
$139,366
132
$123,819
284
$142,632
6
$64,430
83
$126,783
APPLICATIONS APPROVED, NOT ACCEPTED
1
$114,240
23
$136,695
36
$163,559
0
$0
7
$126,417
APPLICATIONS DENIED
3
$142,107
33
$111,101
81
$150,026
9
$28,606
11
$97,906
APPLICATIONS WITHDRAWN
1
$129,140
11
$166,839
51
$138,600
7
$48,130
8
$94,680
FILES CLOSED FOR INCOMPLETENESS
0
$0
6
$145,142
12
$143,623
1
$12,420
2
$146,105
Aggregated Statistics For Year 2001 (Based on 2 partial tracts)
A) FHA, FSA/RHS & VA Home Purchase Loans
B) Conventional Home Purchase Loans
C) Refinancings
D) Home Improvement Loans
E) Loans on Dwellings For 5+ Families
F) Non-occupant Loans on < 5 Family Dwellings (A B C & D)
Number
Average Value
Number
Average Value
Number
Average Value
Number
Average Value
Number
Average Value
Number
Average Value
LOANS ORIGINATED
10
$130,710
112
$128,073
223
$144,672
16
$25,248
1
$11,152,120
60
$142,064
APPLICATIONS APPROVED, NOT ACCEPTED
4
$130,585
7
$136,350
25
$157,944
2
$44,700
0
$0
4
$148,590
APPLICATIONS DENIED
3
$117,547
24
$91,782
75
$136,521
12
$31,870
0
$0
18
$141,646
APPLICATIONS WITHDRAWN
1
$92,710
12
$122,583
60
$135,442
5
$43,046
0
$0
9
$153,051
FILES CLOSED FOR INCOMPLETENESS
0
$0
6
$141,140
15
$184,158
1
$22,350
0
$0
2
$34,770
Aggregated Statistics For Year 2000 (Based on 2 partial tracts)
A) FHA, FSA/RHS & VA Home Purchase Loans
B) Conventional Home Purchase Loans
C) Refinancings
D) Home Improvement Loans
F) Non-occupant Loans on < 5 Family Dwellings (A B C & D)
Number
Average Value
Number
Average Value
Number
Average Value
Number
Average Value
Number
Average Value
LOANS ORIGINATED
8
$130,792
94
$132,149
84
$127,747
19
$28,407
31
$116,987
APPLICATIONS APPROVED, NOT ACCEPTED
2
$113,820
17
$95,051
17
$113,165
7
$37,724
7
$103,830
APPLICATIONS DENIED
1
$98,510
21
$127,915
45
$176,947
15
$26,159
11
$277,087
APPLICATIONS WITHDRAWN
4
$109,890
11
$126,126
10
$133,193
2
$52,980
3
$109,547
FILES CLOSED FOR INCOMPLETENESS
0
$0
3
$141,553
16
$145,486
0
$0
4
$148,590
Aggregated Statistics For Year 1999 (Based on 1 partial tract)
A) FHA, FSA/RHS & VA Home Purchase Loans
B) Conventional Home Purchase Loans
C) Refinancings
D) Home Improvement Loans
F) Non-occupant Loans on < 5 Family Dwellings (A B C & D)
Detailed PMIC statistics for the following Tracts:0243.01
2002 - 2018 National Fire Incident Reporting System (NFIRS) incidents
Based on the data from the years 2002 - 2018 the average number of fire incidents per year is 8. The highest number of fire incidents - 16 took place in 2005, and the least - 1 in 2002. The data has a rising trend.
When looking into fire subcategories, the most reports belonged to: Structure Fires (49.6%), and Outside Fires (22.9%).
Fire incident types reported to NFIRS in Zip Code 97049


 Nearest zip codes: 97028, 97011, 97067, 97041, 97014, 97055.


 Based on the data from the years 2002 - 2018 the average number of fire incidents per year is 8. The highest number of fire incidents - 16 took place in 2005, and the least - 1 in 2002. The data has a rising trend.
 When looking into fire subcategories, the most reports belonged to: Structure Fires (49.6%), and Outside Fires (22.9%).