Estimated zip code population in 2022: 868 Zip code population in 2010: 679 Zip code population in 2000: 666
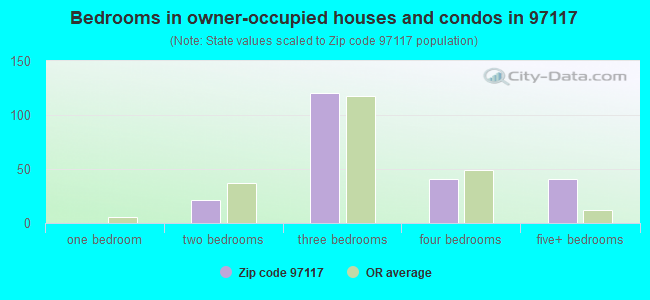
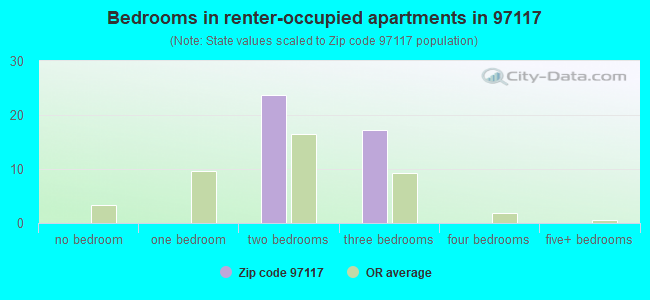
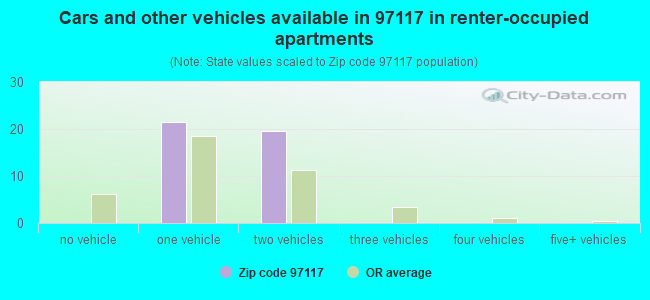
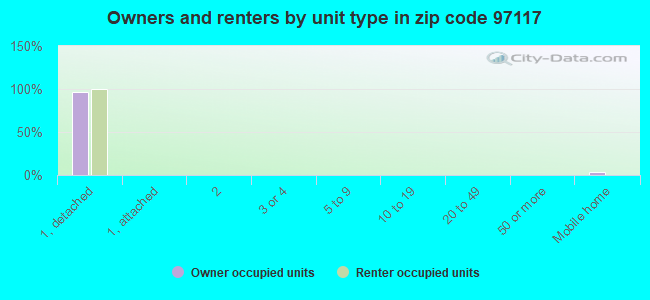
Houses and condos: 263 Renter-occupied apartments: 41
% of renters here:
16%
State:
37%
March 2022 cost of living index in zip code 97117: 95.9 (near average, U.S. average is 100)
Land area: 35.2 sq. mi. Water area: 0.0 sq. mi.
Population density: 25 people per square mile
(very low).
OSM Map
General Map
Google Map
MSN Map
OSM Map
General Map
Google Map
MSN Map
OSM Map
General Map
Google Map
MSN Map
OSM Map
General Map
Google Map
MSN Map
Please wait while loading the map...
Real estate property taxes paid for housing units in 2022:
This zip code:
0.5% ($3,605)
Oregon:
0.8% ($3,646)
Median real estate property taxes paid for housing units with mortgages in 2022: $3,885 (0.6%) Median real estate property taxes paid for housing units with no mortgage in 2022: $2,085 (0.4%)
Business Search- 14 Million verified businesses
Males: 401
(46.3%)
Females: 466
(53.7%)
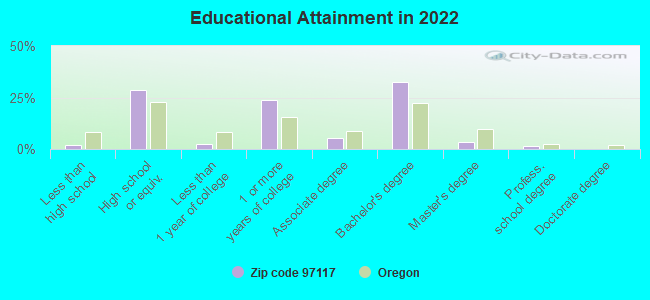
For population 25 years and over in 97117:
High school or higher: 97.9%
Bachelor's degree or higher: 37.7%
Graduate or professional degree: 5.4%
Unemployed: 1.6%
Mean travel time to work (commute): 26.7 minutes
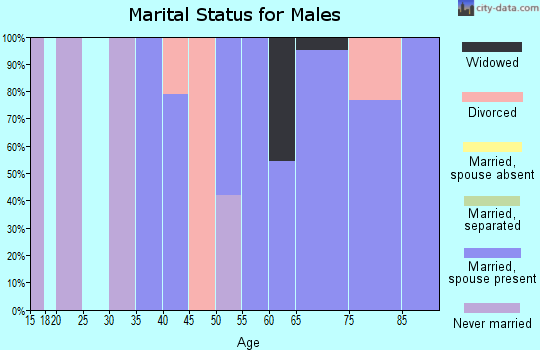
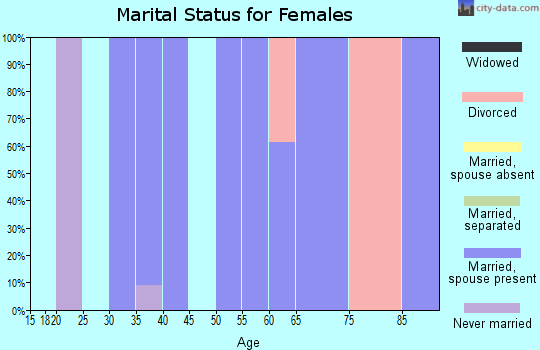
For population 15 years and over in 97117:
Never married: 16.4%
Now married: 75.8%
Separated: 1.5%
Widowed: 2.5%
Divorced: 3.8%
Zip code 97117 compared to state average:
Unemployed percentage below state average.
Black race population percentage significantly below state average.
Hispanic race population percentage significantly below state average.
Foreign-born population percentage significantly below state average.
Renting percentage significantly below state average.
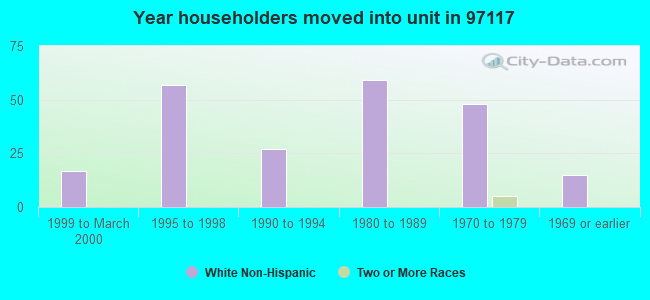
Length of stay since moving in significantly below state average.
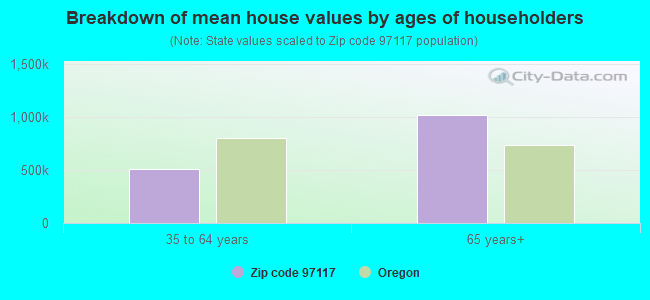
Estimated median house/condo value in 2022: $681,307
97117:
$681,307
Oregon:
$475,600
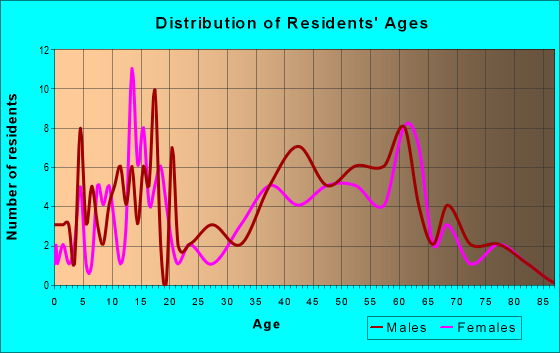
Median resident age:
This zip code:
37.3 years
Oregon median age:
40.5 years
Average household size:
This zip code:
3.3 people
Oregon:
2.4 people
Averages for the 2020 tax year for zip code 97117, filed in 2021:
Average Adjusted Gross Income (AGI) in 2020: $69,000 (Individual Income Tax Returns)
Here:
$69,000
State:
$76,001
Salary/wage: $68,852 (reported on 72.4% of returns)
Here:
$68,852
State:
$61,959
(% of AGI for various income ranges: 1534.0% for AGIs below $25k, 4492.5% for AGIs $25k-50k, 3315.0% for AGIs $50k-75k, 28190.0% for AGIs $100k-200k)
Taxable interest for individuals: $367 (reported on 31.0% of returns)
This zip code:
$367
Oregon:
$1,628
(% of AGI for various income ranges: 16.0% for AGIs below $25k, 22.5% for AGIs $50k-75k, 53.3% for AGIs $100k-200k)
Ordinary dividends: $1,383 (reported on 20.7% of returns)
Here:
$1,383
State:
$7,165
(% of AGI for various income ranges: 82.5% for AGIs $25k-50k, 166.7% for AGIs $100k-200k)
Net capital gain/loss in AGI: +$5,317 (reported on 20.7% of returns)
Here:
+$5,317
State:
+$23,403
(% of AGI for various income ranges: 102.5% for AGIs $25k-50k, 926.7% for AGIs $100k-200k)
Profit/loss from business: +$5,533 (reported on 10.3% of returns)
Here:
+$5,533
State:
+$16,511
(% of AGI for various income ranges: 415.0% for AGIs $25k-50k)
Taxable individual retirement arrangement distribution: $13,850 (reported on 6.9% of returns)
97117:
$13,850
Oregon:
$20,730
(% of AGI for various income ranges: 692.5% for AGIs $25k-50k)
Total itemized deductions: $26,325 (reported on 13.8% of returns)
Here:
$26,325
State:
$31,050
(% of AGI for various income ranges: 3510.0% for AGIs $100k-200k)
Charity contributions: $8,350 (reported on 6.9% of returns)
Here:
$8,350
State:
$8,791
(% of AGI for various income ranges: )
Taxes paid: $8,350 (reported on 13.8% of returns)
97117:
$8,350
State:
$8,487
(% of AGI for various income ranges: 1113.3% for AGIs $100k-200k)
Earned income credit: $2,400 (reported on 6.9% of returns)
Here:
$2,400
State:
$1,977
(% of AGI for various income ranges: 96.0% for AGIs below $25k)
Percentage of individuals using paid preparers for their 2020 taxes: 89.7%
Here:
90%
State:
93%
(% for various income ranges: 87.5% for AGIs below $25k, 85.7% for AGIs $25k-50k, 100.0% for AGIs $50k-75k, 100.0% for AGIs $75k-100k, 120.0% for AGIs $100k-200k, 0.0% for AGIs over 200k)
Averages for the 2012 tax year for zip code 97117, filed in 2013:
Average Adjusted Gross Income (AGI) in 2012: $50,840 (Individual Income Tax Returns)
Here:
$50,840
State:
$57,845
Salary/wage: $45,284 (reported on 76.0% of returns)
Here:
$45,284
State:
$47,723
(% of AGI for various income ranges: 64.4% for AGIs below $25k, 69.9% for AGIs $25k-50k, 62.8% for AGIs $50k-75k, 78.0% for AGIs $75k-100k, 63.7% for AGIs $100k-200k)
Taxable interest for individuals: $388 (reported on 32.0% of returns)
This zip code:
$388
Oregon:
$1,848
Ordinary dividends: $725 (reported on 16.0% of returns)
Here:
$725
State:
$5,987
Net capital gain/loss in AGI: +$1,500 (reported on 16.0% of returns)
Here:
+$1,500
State:
+$13,095
Profit/loss from business: +$6,033 (reported on 12.0% of returns)
Here:
+$6,033
State:
+$13,871
Taxable individual retirement arrangement distribution: $9,767 (reported on 12.0% of returns)
97117:
$9,767
Oregon:
$16,036
Total itemized deductions: $23,367 (27% of AGI, reported on 36.0% of returns)
Here:
$23,367
State:
$24,430
Here:
26.6% of AGI
State:
23.2% of AGI
(% of AGI for various income ranges: 41.2% for AGIs below $25k, 14.9% for AGIs $50k-75k, 21.8% for AGIs $75k-100k, 16.9% for AGIs $100k-200k)
Charity contributions: $1,443 (reported on 28.0% of returns)
Here:
$1,443
State:
$3,648
Taxes paid: $7,967 (reported on 36.0% of returns)
97117:
$7,967
State:
$10,269
(% of AGI for various income ranges: 8.4% for AGIs below $25k, 5.2% for AGIs $50k-75k, 6.6% for AGIs $75k-100k, 8.0% for AGIs $100k-200k)
Earned income credit: $1,900 (reported on 12.0% of returns)
Here:
$1,900
State:
$2,021
(% of AGI for various income ranges: 5.3% for AGIs below $25k)
Percentage of individuals using paid preparers for their 2012 taxes: 60.0%
Here:
60%
State:
47%
(% for various income ranges: 50.0% for AGIs below $25k, 50.0% for AGIs $25k-50k, 60.0% for AGIs $50k-75k, 166.7% for AGIs $75k-100k)
Averages for the 2004 tax year for zip code 97117, filed in 2005:
Average Adjusted Gross Income (AGI) in 2004: $46,314 (Individual Income Tax Returns)
Here:
$46,314
State:
$46,788
Salary/wage: $41,761 (reported on 82.6% of returns)
Here:
$41,761
State:
$39,788
(% of AGI for various income ranges: 98.3% for AGIs below $10k, 64.6% for AGIs $10k-25k, 75.3% for AGIs $25k-50k, 82.2% for AGIs $50k-75k, 77.8% for AGIs $75k-100k, 62.3% for AGIs over 100k)
Taxable interest for individuals: $755 (reported on 41.1% of returns)
This zip code:
$755
Oregon:
$2,126
(% of AGI for various income ranges: 2.2% for AGIs $10k-25k, 0.7% for AGIs $25k-50k, 0.4% for AGIs $50k-75k, 0.4% for AGIs $75k-100k, 0.6% for AGIs over 100k)
Taxable dividends: $508 (reported on 24.4% of returns)
Here:
$508
State:
$3,427
(% of AGI for various income ranges: 0.3% for AGIs $10k-25k, 0.2% for AGIs $25k-50k, 0.5% for AGIs $50k-75k, 0.3% for AGIs $75k-100k)
Net capital gain/loss: +$1,000 (reported on 19.4% of returns)
Here:
+$1,000
State:
+$12,447
Profit/loss from business: +$3,265 (reported on 13.2% of returns)
Here:
+$3,265
State:
+$11,682
Total itemized deductions: $17,640 (26% of AGI, reported on 44.2% of returns)
Here:
$17,640
State:
$20,209
Here:
26.5% of AGI
State:
24.7% of AGI
(% of AGI for various income ranges: 19.5% for AGIs $25k-50k, 15.1% for AGIs $50k-75k, 20.6% for AGIs $75k-100k, 19.4% for AGIs over 100k)
Charity contributions deductions: $2,100 (3% of AGI, reported on 34.9% of returns)
Here:
$2,100
State:
$3,145
Here:
3.1% of AGI
State:
3.6% of AGI
(% of AGI for various income ranges: 2.1% for AGIs $25k-50k, 1.5% for AGIs $50k-75k, 2.2% for AGIs $75k-100k, 1.1% for AGIs over 100k)
Total tax: $5,368 (reported on 79.1% of returns)
97117:
$5,368
State:
$7,148
(% of AGI for various income ranges: 4.3% for AGIs $10k-25k, 7.1% for AGIs $25k-50k, 8.2% for AGIs $50k-75k, 10.0% for AGIs $75k-100k, 14.7% for AGIs over 100k)
Earned income credit: $1,643 (reported on 5.4% of returns)
Here:
$1,643
State:
$1,605
Percentage of individuals using paid preparers for their 2004 taxes: 60.1%
Here:
60%
State:
53%
(% for various income ranges: 43.5% for AGIs below $10k, 51.7% for AGIs $10k-25k, 57.5% for AGIs $25k-50k, 66.0% for AGIs $50k-75k, 76.7% for AGIs $75k-100k, 76.5% for AGIs over 100k)
Household received Food Stamps/SNAP in the past 12 months: 22 Household did not receive Food Stamps/SNAP in the past 12 months: 241
Women who had a birth in the past 12 months: 5 (5 now married, 0 unmarried) Women who did not have a birth in the past 12 months: 181 (131 now married, 46 unmarried)
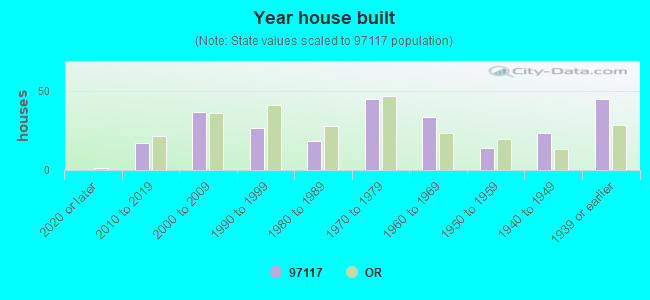
Housing units in zip code 97117 with a mortgage: 171 (14 second mortgage, 14 both second mortgage and home equity loan) Houses without a mortgage: 66
Median monthly owner costs for units with a mortgage: $1,906 Median monthly owner costs for units without a mortgage: $588
Residents with income below the poverty level in 2022:
This zip code:
4.1%
Whole state:
12.1%
Residents with income below 50% of the poverty level in 2022:
This zip code:
3.3%
Whole state:
6.2%
Median number of rooms in houses and condos:
Here:
6.5
State:
6.2
Median number of rooms in apartments:
Here:
5.8
State:
4.0
Notable locations in this zip code not listed on our city pages
Creeks: Bateman Creek (A), Beaver Creek (B), Clear Creek (C), Coffee Creek (D), Culver Creek (E), Deep Creek (F), Finger Creek (G), Fir Creek (H), Iler Creek (I). Display/hide their locations on the map
Size of family households: 105 2-persons, 29 3-persons, 11 4-persons, 20 5-persons, 15 6-persons, 28 7-or-more-persons
Size of nonfamily households: 47 1-person
316 married couples with children.
0 single-parent households ().
99.0% of residents of 97117 zip code speak English at home.
0.5% of residents speak Spanish at home (100% very well).
Foreign born population: 22 (2.6%) (100.0% of them are naturalized citizens)
This zip code:
2.6%
Whole state:
9.9%
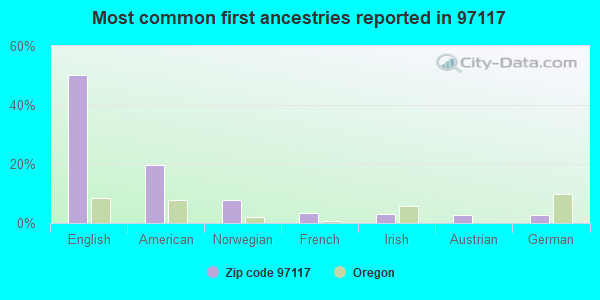
50%English
20%American
8%Norwegian
3%French
3%Irish
3%Austrian
3%German
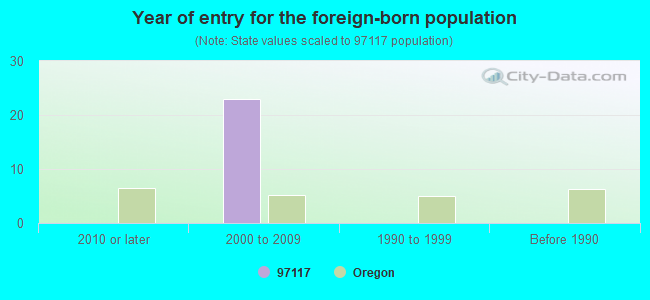
Year of entry for the foreign-born population
02010 or later
232000 to 2009
01990 to 1999
0Before 1990
Facilities with environmental interests located in this zip code:
GALES CREEK ELEM. SCHOOL (9125 NW SARGENT RD in GALES CREEK, OR)
(National Center for Education Statistics) - STATE ID-1131 Organizations: FOREST GROVE SCH DIST 015 (SCHOOL DISTRICT)
Housing units lacking complete kitchen facilities: 2.3%
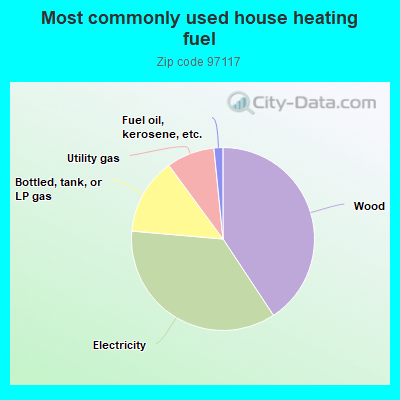
41.2%Wood
36.1%Electricity
13.7%Bottled, tank, or LP gas
8.6%Utility gas
1.6%Fuel oil, kerosene, etc.
Population in 1990: 374. Population change in the 1990s: +292 (+78.1%).
Place of birth for U.S.-born residents:
This state: 570
Midwest: 49
South: 44
West: 177
77% of the 97117 zip code residents lived in the same house 5 years ago. Out of people who lived in different houses, 67% lived in this county. Out of people who lived in different counties, 50% lived in Oregon.
93% of the 97117 zip code residents lived in the same house 1 year ago. Out of people who lived in different houses, 56% moved from this county. Out of people who lived in different houses, 53% moved from different county within same state.
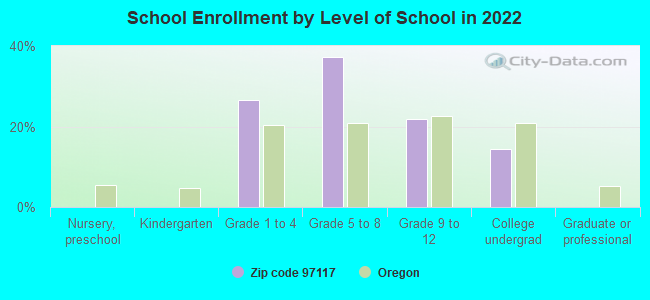
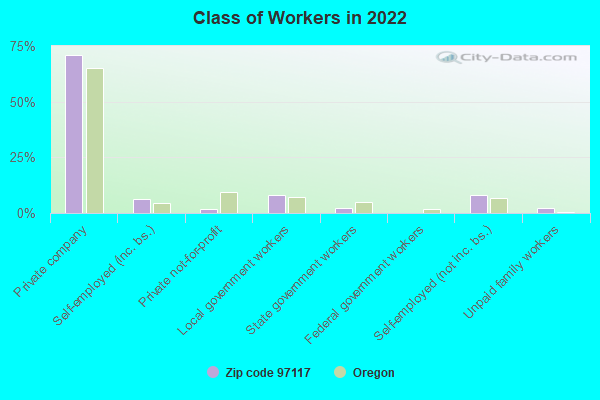
Private vs. public school enrollment:
Students in private schools in grades 1 to 8 (elementary and middle school): 169
Here:
74.9%
Oregon:
13.7%
Students in private schools in grades 9 to 12 (high school): 46
Here:
68.1%
Oregon:
8.8%
Students in private undergraduate colleges: 25
Here:
54.8%
Oregon:
17.7%
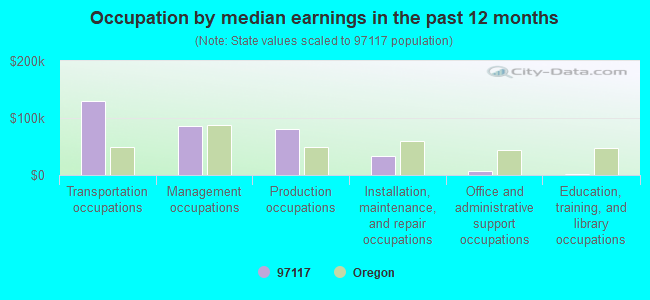
Occupation by median earnings in the past 12 months ($)
129,893Transportation occupations
86,349Management occupations
80,549Production occupations
33,056Installation, maintenance, and repair occupations
7,392Office and administrative support occupations
2,395Education, training, and library occupations
Top industries in this zip code by the number of employees in 2005:
Accommodation and Food Services: Full-Service Restaurants (5-9 employees: 2 establishments)
Administrative and Support and Waste Management and Remediation Services: Landscaping Services (5-9: 1)
Accommodation and Food Services: Drinking Places (Alcoholic Beverages) (5-9: 1)
Accommodation and Food Services: Snack and Nonalcoholic Beverage Bars (5-9: 1)
Construction: Plumbing, Heating, and Air-Conditioning Contractors (1-4: 2)
Construction: New Single-Family Housing Construction (except Operative Builders) (1-4: 2)
Professional, Scientific, and Technical Services: Human Resources and Executive Search Consulting Services (1-4: 1)
Fatal accident statistics in 2011:
Fatal accident count: 1
Vehicles involved in fatal accidents: 3
Fatal accidents caused by drunken drivers: 0
Fatalities: 1
Persons involved in fatal accidents: 7
Pedestrians involved in fatal accidents: 0
Home Mortgage Disclosure Act Aggregated Statistics For Year 2009 (Based on 4 partial tracts)
A) FHA, FSA/RHS & VA Home Purchase Loans
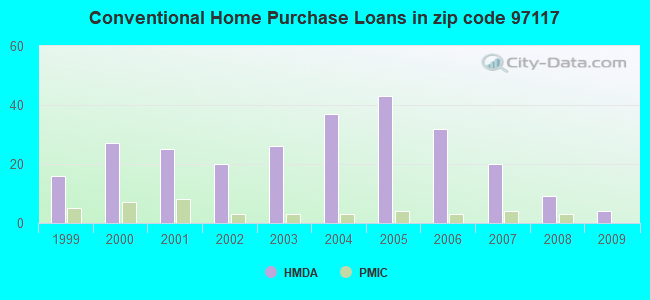
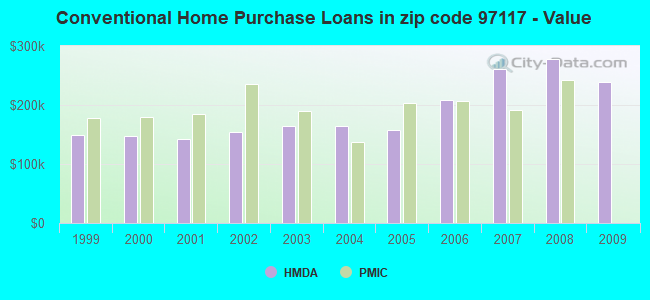
B) Conventional Home Purchase Loans
C) Refinancings
D) Home Improvement Loans
F) Non-occupant Loans on < 5 Family Dwellings (A B C & D)
G) Loans On Manufactured Home Dwelling (A B C & D)
Number
Average Value
Number
Average Value
Number
Average Value
Number
Average Value
Number
Average Value
Number
Average Value
LOANS ORIGINATED
5
$244,676
4
$238,370
51
$237,859
2
$150,555
1
$100,270
4
$172,762
APPLICATIONS APPROVED, NOT ACCEPTED
0
$0
1
$388,230
7
$212,691
1
$140,340
1
$149,560
1
$221,730
APPLICATIONS DENIED
2
$278,065
1
$383,850
20
$218,654
2
$132,255
0
$0
2
$189,185
APPLICATIONS WITHDRAWN
1
$323,280
1
$353,230
9
$261,393
0
$0
0
$0
1
$131,290
FILES CLOSED FOR INCOMPLETENESS
0
$0
0
$0
3
$263,340
0
$0
0
$0
0
$0
Aggregated Statistics For Year 2008 (Based on 4 partial tracts)
A) FHA, FSA/RHS & VA Home Purchase Loans
B) Conventional Home Purchase Loans
C) Refinancings
D) Home Improvement Loans
F) Non-occupant Loans on < 5 Family Dwellings (A B C & D)
G) Loans On Manufactured Home Dwelling (A B C & D)
Number
Average Value
Number
Average Value
Number
Average Value
Number
Average Value
Number
Average Value
Number
Average Value
LOANS ORIGINATED
3
$241,387
9
$278,447
35
$226,700
1
$137,960
1
$133,040
5
$185,836
APPLICATIONS APPROVED, NOT ACCEPTED
1
$155,620
3
$186,440
7
$236,203
0
$0
0
$0
1
$161,350
APPLICATIONS DENIED
1
$166,380
5
$156,504
15
$233,679
4
$145,675
1
$62,460
3
$60,850
APPLICATIONS WITHDRAWN
0
$0
2
$251,830
7
$236,237
1
$32,830
1
$205,660
0
$0
FILES CLOSED FOR INCOMPLETENESS
0
$0
0
$0
1
$190,430
1
$67,550
0
$0
0
$0
Aggregated Statistics For Year 2007 (Based on 4 partial tracts)
A) FHA, FSA/RHS & VA Home Purchase Loans
B) Conventional Home Purchase Loans
C) Refinancings
D) Home Improvement Loans
F) Non-occupant Loans on < 5 Family Dwellings (A B C & D)
G) Loans On Manufactured Home Dwelling (A B C & D)
Number
Average Value
Number
Average Value
Number
Average Value
Number
Average Value
Number
Average Value
Number
Average Value
LOANS ORIGINATED
1
$221,150
20
$260,775
37
$215,804
6
$102,100
2
$167,075
6
$182,932
APPLICATIONS APPROVED, NOT ACCEPTED
0
$0
3
$143,583
7
$201,607
1
$114,670
1
$138,240
2
$111,155
APPLICATIONS DENIED
0
$0
5
$191,402
29
$283,360
7
$155,326
3
$96,900
5
$173,884
APPLICATIONS WITHDRAWN
0
$0
4
$259,010
10
$246,896
3
$161,040
0
$0
2
$120,185
FILES CLOSED FOR INCOMPLETENESS
0
$0
1
$201,710
2
$259,250
1
$330,810
0
$0
0
$0
Aggregated Statistics For Year 2006 (Based on 4 partial tracts)
B) Conventional Home Purchase Loans
C) Refinancings
D) Home Improvement Loans
F) Non-occupant Loans on < 5 Family Dwellings (A B C & D)
G) Loans On Manufactured Home Dwelling (A B C & D)
Number
Average Value
Number
Average Value
Number
Average Value
Number
Average Value
Number
Average Value
LOANS ORIGINATED
32
$208,129
42
$198,692
6
$101,555
5
$207,490
4
$196,388
APPLICATIONS APPROVED, NOT ACCEPTED
5
$183,216
11
$187,797
1
$87,900
0
$0
2
$156,445
APPLICATIONS DENIED
8
$214,190
34
$194,072
5
$69,964
2
$154,035
5
$142,652
APPLICATIONS WITHDRAWN
3
$288,427
17
$195,427
1
$103,390
0
$0
1
$162,320
FILES CLOSED FOR INCOMPLETENESS
1
$353,690
5
$256,344
0
$0
0
$0
0
$0
Aggregated Statistics For Year 2005 (Based on 4 partial tracts)
B) Conventional Home Purchase Loans
C) Refinancings
D) Home Improvement Loans
F) Non-occupant Loans on < 5 Family Dwellings (A B C & D)
G) Loans On Manufactured Home Dwelling (A B C & D)
Number
Average Value
Number
Average Value
Number
Average Value
Number
Average Value
Number
Average Value
LOANS ORIGINATED
43
$158,426
50
$184,246
4
$122,368
5
$143,454
5
$163,758
APPLICATIONS APPROVED, NOT ACCEPTED
5
$138,860
9
$137,001
0
$0
0
$0
1
$66,180
APPLICATIONS DENIED
11
$180,694
35
$176,896
5
$151,614
2
$333,210
7
$139,383
APPLICATIONS WITHDRAWN
6
$207,495
29
$202,229
1
$280,960
1
$102,510
3
$129,500
FILES CLOSED FOR INCOMPLETENESS
2
$207,435
3
$218,907
0
$0
1
$201,290
0
$0
Aggregated Statistics For Year 2004 (Based on 4 partial tracts)
A) FHA, FSA/RHS & VA Home Purchase Loans
B) Conventional Home Purchase Loans
C) Refinancings
D) Home Improvement Loans
F) Non-occupant Loans on < 5 Family Dwellings (A B C & D)
G) Loans On Manufactured Home Dwelling (A B C & D)
Number
Average Value
Number
Average Value
Number
Average Value
Number
Average Value
Number
Average Value
Number
Average Value
LOANS ORIGINATED
2
$163,140
37
$164,720
43
$167,231
2
$101,170
5
$105,212
4
$140,160
APPLICATIONS APPROVED, NOT ACCEPTED
0
$0
5
$170,434
11
$158,471
0
$0
1
$175,250
1
$106,390
APPLICATIONS DENIED
1
$123,110
9
$134,162
29
$179,512
4
$144,155
2
$239,370
4
$143,035
APPLICATIONS WITHDRAWN
0
$0
6
$202,182
24
$180,059
0
$0
1
$52,020
1
$155,730
FILES CLOSED FOR INCOMPLETENESS
0
$0
1
$133,150
2
$246,250
0
$0
0
$0
0
$0
Aggregated Statistics For Year 2003 (Based on 4 partial tracts)
A) FHA, FSA/RHS & VA Home Purchase Loans
B) Conventional Home Purchase Loans
C) Refinancings
D) Home Improvement Loans
F) Non-occupant Loans on < 5 Family Dwellings (A B C & D)
Number
Average Value
Number
Average Value
Number
Average Value
Number
Average Value
Number
Average Value
LOANS ORIGINATED
4
$145,745
26
$164,504
118
$169,082
2
$47,305
4
$133,752
APPLICATIONS APPROVED, NOT ACCEPTED
0
$0
4
$136,325
18
$160,077
1
$8,190
0
$0
APPLICATIONS DENIED
1
$133,010
8
$169,390
33
$171,346
3
$44,140
1
$160,630
APPLICATIONS WITHDRAWN
0
$0
1
$283,960
21
$182,183
1
$21,700
0
$0
FILES CLOSED FOR INCOMPLETENESS
1
$140,770
0
$0
4
$232,295
0
$0
0
$0
Aggregated Statistics For Year 2002 (Based on 4 partial tracts)
A) FHA, FSA/RHS & VA Home Purchase Loans
B) Conventional Home Purchase Loans
C) Refinancings
D) Home Improvement Loans
F) Non-occupant Loans on < 5 Family Dwellings (A B C & D)
Number
Average Value
Number
Average Value
Number
Average Value
Number
Average Value
Number
Average Value
LOANS ORIGINATED
3
$177,977
20
$153,842
76
$164,682
3
$38,803
2
$145,205
APPLICATIONS APPROVED, NOT ACCEPTED
1
$93,460
4
$168,512
16
$184,085
0
$0
1
$183,630
APPLICATIONS DENIED
1
$57,730
4
$192,710
29
$156,563
2
$25,575
2
$144,335
APPLICATIONS WITHDRAWN
0
$0
3
$186,120
19
$145,714
0
$0
1
$17,640
FILES CLOSED FOR INCOMPLETENESS
0
$0
0
$0
4
$187,095
0
$0
0
$0
Aggregated Statistics For Year 2001 (Based on 4 partial tracts)
A) FHA, FSA/RHS & VA Home Purchase Loans
B) Conventional Home Purchase Loans
C) Refinancings
D) Home Improvement Loans
F) Non-occupant Loans on < 5 Family Dwellings (A B C & D)
Number
Average Value
Number
Average Value
Number
Average Value
Number
Average Value
Number
Average Value
LOANS ORIGINATED
5
$160,234
25
$142,603
66
$160,127
6
$35,003
1
$188,980
APPLICATIONS APPROVED, NOT ACCEPTED
0
$0
5
$132,700
8
$143,202
2
$45,525
0
$0
APPLICATIONS DENIED
1
$107,970
5
$124,670
20
$158,314
3
$46,037
1
$164,260
APPLICATIONS WITHDRAWN
1
$103,000
2
$184,945
18
$200,557
2
$28,785
1
$147,540
FILES CLOSED FOR INCOMPLETENESS
0
$0
2
$115,150
3
$164,327
1
$6,480
0
$0
Aggregated Statistics For Year 2000 (Based on 4 partial tracts)
A) FHA, FSA/RHS & VA Home Purchase Loans
B) Conventional Home Purchase Loans
C) Refinancings
D) Home Improvement Loans
F) Non-occupant Loans on < 5 Family Dwellings (A B C & D)
Number
Average Value
Number
Average Value
Number
Average Value
Number
Average Value
Number
Average Value
LOANS ORIGINATED
8
$147,962
27
$148,141
15
$137,750
4
$22,578
2
$102,085
APPLICATIONS APPROVED, NOT ACCEPTED
1
$124,190
3
$152,133
4
$140,952
3
$23,363
0
$0
APPLICATIONS DENIED
1
$198,190
5
$120,128
12
$140,494
3
$37,137
0
$0
APPLICATIONS WITHDRAWN
0
$0
2
$128,590
7
$155,687
0
$0
0
$0
FILES CLOSED FOR INCOMPLETENESS
0
$0
0
$0
2
$88,740
0
$0
0
$0
Aggregated Statistics For Year 1999 (Based on 2 partial tracts)
A) FHA, FSA/RHS & VA Home Purchase Loans
B) Conventional Home Purchase Loans
C) Refinancings
D) Home Improvement Loans
F) Non-occupant Loans on < 5 Family Dwellings (A B C & D)
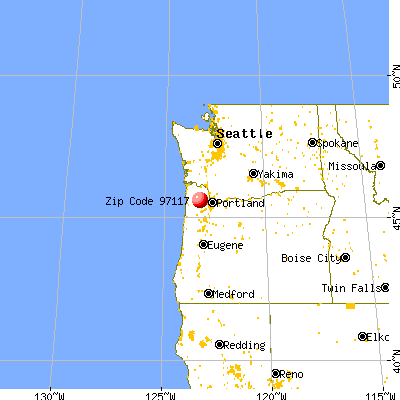


 Nearest zip codes: 97125, 97144, 97116, 97109, 97106, 97119.