Estimated zip code population in 2022: 4,402 Zip code population in 2010: 3,740 Zip code population in 2000: 2,660
Houses and condos: 1,472 Renter-occupied apartments: 166
% of renters here:
11%
State:
37%
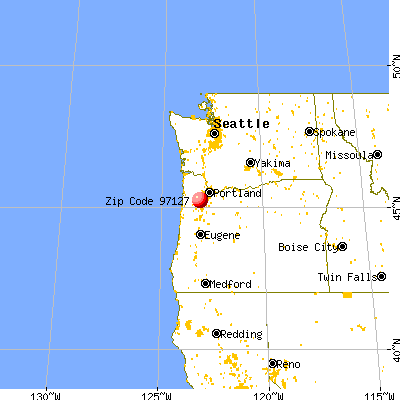
March 2022 cost of living index in zip code 97127: 100.7 (near average, U.S. average is 100)
Land area: 0.9 sq. mi. Water area: 0.0 sq. mi.
Population density: 4,982 people per square mile
(average).
OSM Map
General Map
Google Map
MSN Map
OSM Map
General Map
Google Map
MSN Map
OSM Map
General Map
Google Map
MSN Map
OSM Map
General Map
Google Map
MSN Map
Please wait while loading the map...
Real estate property taxes paid for housing units in 2022:
This zip code:
0.7% ($2,591)
Oregon:
0.8% ($3,646)
Median real estate property taxes paid for housing units with mortgages in 2022: $2,754 (0.7%) Median real estate property taxes paid for housing units with no mortgage in 2022: $1,705 (0.8%)
Business Search- 14 Million verified businesses
Males: 2,336
(53.1%)
Females: 2,066
(46.9%)
For population 25 years and over in 97127:
High school or higher: 90.0%
Bachelor's degree or higher: 18.6%
Graduate or professional degree: 4.3%
Unemployed: 3.4%
Mean travel time to work (commute): 35.0 minutes
For population 15 years and over in 97127:
Never married: 23.1%
Now married: 54.2%
Separated: 2.4%
Widowed: 1.4%
Divorced: 19.0%
Zip code 97127 compared to state average:
Black race population percentage significantly below state average.
Hispanic race population percentage above state average.
Median age below state average.
Renting percentage significantly below state average.
Length of stay since moving in significantly below state average.
House age below state average.
Percentage of population with a bachelor's degree or higher below state average.
Estimated median house/condo value in 2022: $397,701
97127:
$397,701
Oregon:
$475,600
Median resident age:
This zip code:
34.5 years
Oregon median age:
40.5 years
Average household size:
This zip code:
3.0 people
Oregon:
2.4 people
Averages for the 2020 tax year for zip code 97127, filed in 2021:
Average Adjusted Gross Income (AGI) in 2020: $56,341 (Individual Income Tax Returns)
Here:
$56,341
State:
$76,001
Salary/wage: $52,575 (reported on 89.1% of returns)
Here:
$52,575
State:
$61,959
(% of AGI for various income ranges: 1432.9% for AGIs below $25k, 4048.4% for AGIs $25k-50k, 6728.1% for AGIs $50k-75k, 10419.4% for AGIs $75k-100k, 20197.1% for AGIs $100k-200k)
Taxable interest for individuals: $309 (reported on 22.4% of returns)
This zip code:
$309
Oregon:
$1,628
(% of AGI for various income ranges: 7.4% for AGIs below $25k, 7.2% for AGIs $25k-50k, 4.4% for AGIs $50k-75k, 11.1% for AGIs $75k-100k, 28.2% for AGIs $100k-200k)
Ordinary dividends: $1,389 (reported on 9.5% of returns)
Here:
$1,389
State:
$7,165
(% of AGI for various income ranges: 16.1% for AGIs below $25k, 8.8% for AGIs $25k-50k, 19.6% for AGIs $50k-75k, 18.3% for AGIs $75k-100k, 46.5% for AGIs $100k-200k)
Net capital gain/loss in AGI: +$4,753 (reported on 9.5% of returns)
Here:
+$4,753
State:
+$23,403
(% of AGI for various income ranges: 7.9% for AGIs below $25k, 12.3% for AGIs $25k-50k, 18.5% for AGIs $50k-75k, 115.0% for AGIs $75k-100k, 331.2% for AGIs $100k-200k)
Profit/loss from business: +$7,925 (reported on 10.0% of returns)
Here:
+$7,925
State:
+$16,511
(% of AGI for various income ranges: 41.1% for AGIs below $25k, 100.9% for AGIs $25k-50k, 49.6% for AGIs $50k-75k, 251.1% for AGIs $75k-100k, 240.6% for AGIs $100k-200k)
Taxable individual retirement arrangement distribution: $14,480 (reported on 5.0% of returns)
97127:
$14,480
Oregon:
$20,730
(% of AGI for various income ranges: 61.3% for AGIs below $25k, 55.1% for AGIs $25k-50k, 112.6% for AGIs $50k-75k, 374.4% for AGIs $75k-100k)
Total itemized deductions: $24,460 (reported on 10.0% of returns)
Here:
$24,460
State:
$31,050
(% of AGI for various income ranges: 146.0% for AGIs $25k-50k, 347.8% for AGIs $50k-75k, 621.7% for AGIs $75k-100k, 1297.6% for AGIs $100k-200k)
Charity contributions: $4,658 (reported on 6.0% of returns)
Here:
$4,658
State:
$8,791
(% of AGI for various income ranges: 55.2% for AGIs $50k-75k, 54.4% for AGIs $75k-100k, 183.5% for AGIs $100k-200k)
Taxes paid: $7,745 (reported on 10.0% of returns)
97127:
$7,745
State:
$8,487
(% of AGI for various income ranges: 36.5% for AGIs $25k-50k, 117.0% for AGIs $50k-75k, 248.9% for AGIs $75k-100k, 369.4% for AGIs $100k-200k)
Earned income credit: $2,275 (reported on 13.9% of returns)
Here:
$2,275
State:
$1,977
(% of AGI for various income ranges: 87.1% for AGIs below $25k, 71.2% for AGIs $25k-50k)
Percentage of individuals using paid preparers for their 2020 taxes: 94.0%
Here:
94%
State:
93%
(% for various income ranges: 92.6% for AGIs below $25k, 93.0% for AGIs $25k-50k, 94.3% for AGIs $50k-75k, 96.0% for AGIs $75k-100k, 96.7% for AGIs $100k-200k)
Averages for the 2012 tax year for zip code 97127, filed in 2013:
Average Adjusted Gross Income (AGI) in 2012: $45,071 (Individual Income Tax Returns)
Here:
$45,071
State:
$57,845
Salary/wage: $41,170 (reported on 90.1% of returns)
Here:
$41,170
State:
$47,723
(% of AGI for various income ranges: 78.2% for AGIs below $25k, 81.4% for AGIs $25k-50k, 86.0% for AGIs $50k-75k, 85.9% for AGIs $75k-100k, 78.6% for AGIs $100k-200k)
Taxable interest for individuals: $983 (reported on 15.8% of returns)
This zip code:
$983
Oregon:
$1,848
(% of AGI for various income ranges: 0.4% for AGIs below $25k, 0.7% for AGIs $25k-50k, 0.2% for AGIs $50k-75k, 0.2% for AGIs $75k-100k, 0.3% for AGIs $100k-200k)
Ordinary dividends: $1,462 (reported on 8.6% of returns)
Here:
$1,462
State:
$5,987
(% of AGI for various income ranges: 0.6% for AGIs below $25k, 0.5% for AGIs $25k-50k, 0.2% for AGIs $50k-75k, 0.2% for AGIs $100k-200k)
Net capital gain/loss in AGI: +$1,600 (reported on 7.2% of returns)
Here:
+$1,600
State:
+$13,095
(% of AGI for various income ranges: 0.4% for AGIs $50k-75k, 0.7% for AGIs $100k-200k)
Profit/loss from business: +$6,740 (reported on 13.2% of returns)
Here:
+$6,740
State:
+$13,871
(% of AGI for various income ranges: 6.3% for AGIs below $25k, 3.5% for AGIs $25k-50k, 1.9% for AGIs $50k-75k, 0.3% for AGIs $75k-100k)
Taxable individual retirement arrangement distribution: $12,344 (reported on 5.9% of returns)
97127:
$12,344
Oregon:
$16,036
(% of AGI for various income ranges: 3.5% for AGIs below $25k, 1.6% for AGIs $25k-50k, 3.8% for AGIs $50k-75k)
Total itemized deductions: $18,652 (25% of AGI, reported on 38.2% of returns)
Here:
$18,652
State:
$24,430
Here:
25.5% of AGI
State:
23.2% of AGI
(% of AGI for various income ranges: 8.3% for AGIs below $25k, 13.7% for AGIs $25k-50k, 16.3% for AGIs $50k-75k, 18.3% for AGIs $75k-100k, 18.6% for AGIs $100k-200k)
Charity contributions: $2,380 (reported on 27.0% of returns)
Here:
$2,380
State:
$3,648
(% of AGI for various income ranges: 0.5% for AGIs below $25k, 1.1% for AGIs $25k-50k, 1.6% for AGIs $50k-75k, 1.8% for AGIs $75k-100k, 1.7% for AGIs $100k-200k)
Taxes paid: $6,667 (reported on 37.5% of returns)
97127:
$6,667
State:
$10,269
(% of AGI for various income ranges: 1.1% for AGIs below $25k, 3.8% for AGIs $25k-50k, 5.6% for AGIs $50k-75k, 6.7% for AGIs $75k-100k, 8.2% for AGIs $100k-200k)
Earned income credit: $2,359 (reported on 22.4% of returns)
Here:
$2,359
State:
$2,021
(% of AGI for various income ranges: 7.3% for AGIs below $25k, 1.7% for AGIs $25k-50k)
Percentage of individuals using paid preparers for their 2012 taxes: 44.7%
Here:
45%
State:
47%
(% for various income ranges: 39.7% for AGIs below $25k, 48.8% for AGIs $25k-50k, 46.2% for AGIs $50k-75k, 46.7% for AGIs $75k-100k, 50.0% for AGIs $100k-200k)
Averages for the 2004 tax year for zip code 97127, filed in 2005:
Average Adjusted Gross Income (AGI) in 2004: $35,293 (Individual Income Tax Returns)
Here:
$35,293
State:
$46,788
Salary/wage: $34,641 (reported on 87.3% of returns)
Here:
$34,641
State:
$39,788
(% of AGI for various income ranges: 120.1% for AGIs below $10k, 80.8% for AGIs $10k-25k, 88.7% for AGIs $25k-50k, 93.3% for AGIs $50k-75k, 88.7% for AGIs $75k-100k, 54.1% for AGIs over 100k)
Taxable interest for individuals: $628 (reported on 23.5% of returns)
This zip code:
$628
Oregon:
$2,126
(% of AGI for various income ranges: 3.4% for AGIs below $10k, 1.4% for AGIs $10k-25k, 0.1% for AGIs $25k-50k, 0.2% for AGIs $50k-75k, 0.1% for AGIs $75k-100k, 0.6% for AGIs over 100k)
Taxable dividends: $608 (reported on 7.9% of returns)
Here:
$608
State:
$3,427
(% of AGI for various income ranges: 0.8% for AGIs below $10k, 0.3% for AGIs $10k-25k, 0.1% for AGIs $25k-50k, 0.1% for AGIs $50k-75k, 0.3% for AGIs $75k-100k)
Net capital gain/loss: +$3,905 (reported on 6.9% of returns)
Here:
+$3,905
State:
+$12,447
(% of AGI for various income ranges: -0.2% for AGIs $10k-25k, 0.3% for AGIs $25k-50k, 0.0% for AGIs $50k-75k, 5.3% for AGIs $75k-100k)
Profit/loss from business: +$5,472 (reported on 13.3% of returns)
Here:
+$5,472
State:
+$11,682
(% of AGI for various income ranges: 11.3% for AGIs below $10k, 4.3% for AGIs $10k-25k, 2.7% for AGIs $25k-50k, 1.8% for AGIs $50k-75k, -0.5% for AGIs $75k-100k)
IRA payment deduction: $2,294 (reported on 1.4% of returns)
97127:
$2,294
Oregon:
$3,035
Total itemized deductions: $14,607 (26% of AGI, reported on 38.9% of returns)
Here:
$14,607
State:
$20,209
Here:
25.8% of AGI
State:
24.7% of AGI
(% of AGI for various income ranges: 12.5% for AGIs $10k-25k, 15.2% for AGIs $25k-50k, 19.3% for AGIs $50k-75k, 18.3% for AGIs $75k-100k, 14.5% for AGIs over 100k)
Charity contributions deductions: $1,657 (3% of AGI, reported on 28.9% of returns)
Here:
$1,657
State:
$3,145
Here:
2.8% of AGI
State:
3.6% of AGI
(% of AGI for various income ranges: 0.9% for AGIs $10k-25k, 1.3% for AGIs $25k-50k, 1.6% for AGIs $50k-75k, 1.5% for AGIs $75k-100k, 1.3% for AGIs over 100k)
Total tax: $3,847 (reported on 66.1% of returns)
97127:
$3,847
State:
$7,148
(% of AGI for various income ranges: 2.4% for AGIs below $10k, 3.3% for AGIs $10k-25k, 5.2% for AGIs $25k-50k, 7.3% for AGIs $50k-75k, 9.3% for AGIs $75k-100k, 16.1% for AGIs over 100k)
Earned income credit: $1,810 (reported on 19.4% of returns)
Here:
$1,810
State:
$1,605
Percentage of individuals using paid preparers for their 2004 taxes: 50.0%
Here:
50%
State:
53%
(% for various income ranges: 44.7% for AGIs below $10k, 42.5% for AGIs $10k-25k, 54.2% for AGIs $25k-50k, 53.7% for AGIs $50k-75k, 58.5% for AGIs $75k-100k, 70.4% for AGIs over 100k)
Household received Food Stamps/SNAP in the past 12 months: 285 Household did not receive Food Stamps/SNAP in the past 12 months: 1,197
Women who had a birth in the past 12 months: 17 (17 now married, 0 unmarried) Women who did not have a birth in the past 12 months: 1,043 (572 now married, 461 unmarried)
Housing units in zip code 97127 with a mortgage: 1,120 (72 second mortgage, 68 both second mortgage and home equity loan) Median monthly owner costs for units with a mortgage: $1,694 Median monthly owner costs for units without a mortgage: $619
Residents with income below the poverty level in 2022:
This zip code:
6.5%
Whole state:
12.1%
Residents with income below 50% of the poverty level in 2022:
This zip code:
3.5%
Whole state:
6.2%
Median number of rooms in houses and condos:
Here:
5.8
State:
6.2
Median number of rooms in apartments:
Here:
4.6
State:
4.0
Notable locations in this zip code not listed on our city pages
Notable locations in zip code 97127: Lafayette Sewage Treatment Plant (A), Lafayette Fire Department (B), Lafayette Public Works (C), Lafayette City Hall (D), Historic Lafayette Research Library and Museum (E), Lafayette Municipal Courthouse (F). Display/hide their locations on the map
Size of family households: 267 2-persons, 215 3-persons, 382 4-persons, 142 5-persons, 28 6-persons, 11 7-or-more-persons
Size of nonfamily households: 313 1-person, 98 2-persons
693 married couples with children.
200 single-parent households (55 men, 145 women).
78.3% of residents of 97127 zip code speak English at home.
20.7% of residents speak Spanish at home (75% very well, 7% well, 15% not well, 3% not at all).
Foreign born population: 421 (9.6%) (55.8% of them are naturalized citizens)
This zip code:
9.6%
Whole state:
9.9%
100%Honduras
12%English
8%German
7%American
3%Irish
3%Italian
2%Dutch
1%French
Year of entry for the foreign-born population
02010 or later
1402000 to 2009
2191990 to 1999
42Before 1990
Housing units lacking complete plumbing facilities: 0.1%
57.1%Utility gas
34.5%Electricity
5.8%Wood
2.6%Bottled, tank, or LP gas
Population in 1990: 1,315. Population change in the 1990s: +1,345 (+102.3%).
Place of birth for U.S.-born residents:
This state: 2,238
Northeast: 153
Midwest: 170
South: 208
West: 1,209
35% of the 97127 zip code residents lived in the same house 5 years ago. Out of people who lived in different houses, 41% lived in this county. Out of people who lived in different counties, 50% lived in Oregon.
94% of the 97127 zip code residents lived in the same house 1 year ago. Out of people who lived in different houses, 49% moved from this county. Out of people who lived in different houses, 22% moved from different county within same state. Out of people who lived in different houses, 35% moved from different state.
Private vs. public school enrollment:
Students in private schools in grades 1 to 8 (elementary and middle school): 84
Here:
19.0%
Oregon:
13.7%
Students in private schools in grades 9 to 12 (high school):
Here:
0.0%
Oregon:
8.8%
Students in private undergraduate colleges: 47
Here:
24.6%
Oregon:
17.7%
Occupation by median earnings in the past 12 months ($)
96,638Transportation occupations
80,185Health diagnosing and treating practitioners and other technical occupations
72,962Fire fighting and prevention, and other protective service workers including supervisors
70,546Management occupations
68,757Architecture and engineering occupations
68,677Computer and mathematical occupations
Top industries in this zip code by the number of employees in 2005:
Other Services (except Public Administration): Religious Organizations (10-19 employees: 1 establishment, 1-4 employees: 3 establishments)
Other Services (except Public Administration): Automotive Body, Paint, and Interior Repair and Maintenance (10-19: 1)
Accommodation and Food Services: Full-Service Restaurants (5-9: 1, 1-4: 1)
Construction: Other Building Finishing Contractors (5-9: 1)
Administrative and Support and Waste Management and Remediation Services: Landscaping Services (1-4: 1)
Home Mortgage Disclosure Act Aggregated Statistics For Year 2009 (Based on 2 partial tracts)
A) FHA, FSA/RHS & VA Home Purchase Loans
B) Conventional Home Purchase Loans
C) Refinancings
D) Home Improvement Loans
F) Non-occupant Loans on < 5 Family Dwellings (A B C & D)
G) Loans On Manufactured Home Dwelling (A B C & D)
Number
Average Value
Number
Average Value
Number
Average Value
Number
Average Value
Number
Average Value
Number
Average Value
LOANS ORIGINATED
4
$225,245
2
$338,905
27
$243,336
1
$135,680
1
$203,450
2
$148,230
APPLICATIONS APPROVED, NOT ACCEPTED
1
$121,030
0
$0
2
$272,400
0
$0
0
$0
0
$0
APPLICATIONS DENIED
2
$196,350
1
$157,360
9
$257,502
1
$197,050
0
$0
1
$97,700
APPLICATIONS WITHDRAWN
1
$189,760
1
$146,450
7
$274,006
0
$0
0
$0
1
$152,790
FILES CLOSED FOR INCOMPLETENESS
0
$0
0
$0
1
$427,570
0
$0
0
$0
0
$0
Aggregated Statistics For Year 2008 (Based on 2 partial tracts)
A) FHA, FSA/RHS & VA Home Purchase Loans
B) Conventional Home Purchase Loans
C) Refinancings
D) Home Improvement Loans
F) Non-occupant Loans on < 5 Family Dwellings (A B C & D)
G) Loans On Manufactured Home Dwelling (A B C & D)
Number
Average Value
Number
Average Value
Number
Average Value
Number
Average Value
Number
Average Value
Number
Average Value
LOANS ORIGINATED
3
$199,247
5
$287,038
15
$236,317
1
$237,180
1
$214,100
2
$175,205
APPLICATIONS APPROVED, NOT ACCEPTED
0
$0
1
$191,020
3
$267,993
0
$0
0
$0
0
$0
APPLICATIONS DENIED
1
$150,450
2
$188,140
11
$229,865
2
$141,795
1
$129,910
2
$106,355
APPLICATIONS WITHDRAWN
0
$0
1
$218,920
5
$240,818
0
$0
0
$0
0
$0
FILES CLOSED FOR INCOMPLETENESS
0
$0
0
$0
1
$222,220
0
$0
0
$0
0
$0
Aggregated Statistics For Year 2007 (Based on 2 partial tracts)
A) FHA, FSA/RHS & VA Home Purchase Loans
B) Conventional Home Purchase Loans
C) Refinancings
D) Home Improvement Loans
F) Non-occupant Loans on < 5 Family Dwellings (A B C & D)
G) Loans On Manufactured Home Dwelling (A B C & D)
Number
Average Value
Number
Average Value
Number
Average Value
Number
Average Value
Number
Average Value
Number
Average Value
LOANS ORIGINATED
1
$272,300
14
$208,989
21
$242,432
2
$105,530
3
$216,913
2
$168,645
APPLICATIONS APPROVED, NOT ACCEPTED
0
$0
2
$264,380
4
$201,992
0
$0
0
$0
1
$45,770
APPLICATIONS DENIED
0
$0
4
$270,655
13
$218,305
3
$96,557
1
$163,890
2
$145,945
APPLICATIONS WITHDRAWN
0
$0
2
$271,890
6
$212,400
0
$0
0
$0
0
$0
FILES CLOSED FOR INCOMPLETENESS
0
$0
0
$0
2
$193,845
0
$0
0
$0
0
$0
Aggregated Statistics For Year 2006 (Based on 2 partial tracts)
A) FHA, FSA/RHS & VA Home Purchase Loans
B) Conventional Home Purchase Loans
C) Refinancings
D) Home Improvement Loans
F) Non-occupant Loans on < 5 Family Dwellings (A B C & D)
G) Loans On Manufactured Home Dwelling (A B C & D)
Number
Average Value
Number
Average Value
Number
Average Value
Number
Average Value
Number
Average Value
Number
Average Value
LOANS ORIGINATED
1
$314,270
27
$178,781
22
$203,076
3
$102,053
3
$180,203
2
$193,400
APPLICATIONS APPROVED, NOT ACCEPTED
0
$0
4
$199,265
5
$173,234
1
$78,870
1
$111,080
1
$57,570
APPLICATIONS DENIED
0
$0
5
$185,458
12
$171,882
2
$78,330
1
$242,700
2
$139,130
APPLICATIONS WITHDRAWN
0
$0
3
$180,710
8
$163,620
1
$79,380
0
$0
0
$0
FILES CLOSED FOR INCOMPLETENESS
0
$0
0
$0
2
$165,125
0
$0
0
$0
0
$0
Aggregated Statistics For Year 2005 (Based on 2 partial tracts)
A) FHA, FSA/RHS & VA Home Purchase Loans
B) Conventional Home Purchase Loans
C) Refinancings
D) Home Improvement Loans
F) Non-occupant Loans on < 5 Family Dwellings (A B C & D)
G) Loans On Manufactured Home Dwelling (A B C & D)
Number
Average Value
Number
Average Value
Number
Average Value
Number
Average Value
Number
Average Value
Number
Average Value
LOANS ORIGINATED
2
$132,060
25
$159,228
23
$186,371
2
$92,150
2
$202,880
2
$178,820
APPLICATIONS APPROVED, NOT ACCEPTED
0
$0
2
$201,580
5
$132,480
0
$0
0
$0
1
$110,440
APPLICATIONS DENIED
0
$0
7
$174,477
16
$165,248
3
$84,133
1
$88,890
3
$129,020
APPLICATIONS WITHDRAWN
0
$0
4
$160,132
11
$174,973
1
$169,210
1
$154,060
1
$99,470
FILES CLOSED FOR INCOMPLETENESS
0
$0
1
$134,410
2
$186,490
0
$0
0
$0
0
$0
Aggregated Statistics For Year 2004 (Based on 2 partial tracts)
A) FHA, FSA/RHS & VA Home Purchase Loans
B) Conventional Home Purchase Loans
C) Refinancings
D) Home Improvement Loans
F) Non-occupant Loans on < 5 Family Dwellings (A B C & D)
G) Loans On Manufactured Home Dwelling (A B C & D)
Number
Average Value
Number
Average Value
Number
Average Value
Number
Average Value
Number
Average Value
Number
Average Value
LOANS ORIGINATED
2
$142,650
19
$153,962
20
$166,498
1
$119,890
2
$116,305
2
$102,740
APPLICATIONS APPROVED, NOT ACCEPTED
0
$0
3
$147,870
4
$181,830
0
$0
0
$0
1
$39,310
APPLICATIONS DENIED
0
$0
3
$131,703
12
$170,963
1
$51,990
0
$0
3
$94,233
APPLICATIONS WITHDRAWN
0
$0
3
$137,070
8
$173,621
0
$0
0
$0
0
$0
FILES CLOSED FOR INCOMPLETENESS
0
$0
0
$0
1
$259,500
0
$0
0
$0
0
$0
Aggregated Statistics For Year 2003 (Based on 2 partial tracts)
A) FHA, FSA/RHS & VA Home Purchase Loans
B) Conventional Home Purchase Loans
C) Refinancings
D) Home Improvement Loans
F) Non-occupant Loans on < 5 Family Dwellings (A B C & D)
Number
Average Value
Number
Average Value
Number
Average Value
Number
Average Value
Number
Average Value
LOANS ORIGINATED
4
$158,390
13
$159,232
42
$168,434
1
$48,310
2
$245,675
APPLICATIONS APPROVED, NOT ACCEPTED
0
$0
1
$227,730
6
$176,115
0
$0
0
$0
APPLICATIONS DENIED
0
$0
2
$117,510
12
$149,006
1
$6,470
1
$77,600
APPLICATIONS WITHDRAWN
0
$0
1
$202,250
7
$161,163
0
$0
0
$0
FILES CLOSED FOR INCOMPLETENESS
0
$0
1
$142,970
1
$155,010
0
$0
0
$0
Aggregated Statistics For Year 2002 (Based on 2 partial tracts)
A) FHA, FSA/RHS & VA Home Purchase Loans
B) Conventional Home Purchase Loans
C) Refinancings
D) Home Improvement Loans
F) Non-occupant Loans on < 5 Family Dwellings (A B C & D)
Number
Average Value
Number
Average Value
Number
Average Value
Number
Average Value
Number
Average Value
LOANS ORIGINATED
5
$127,790
11
$134,783
27
$171,610
1
$37,850
2
$122,170
APPLICATIONS APPROVED, NOT ACCEPTED
0
$0
2
$158,090
4
$163,412
0
$0
0
$0
APPLICATIONS DENIED
0
$0
1
$190,710
8
$152,596
1
$11,670
0
$0
APPLICATIONS WITHDRAWN
1
$84,580
1
$111,460
4
$131,920
0
$0
0
$0
FILES CLOSED FOR INCOMPLETENESS
0
$0
0
$0
2
$156,090
0
$0
0
$0
Aggregated Statistics For Year 2001 (Based on 2 partial tracts)
A) FHA, FSA/RHS & VA Home Purchase Loans
B) Conventional Home Purchase Loans
C) Refinancings
D) Home Improvement Loans
F) Non-occupant Loans on < 5 Family Dwellings (A B C & D)
Number
Average Value
Number
Average Value
Number
Average Value
Number
Average Value
Number
Average Value
LOANS ORIGINATED
2
$162,715
8
$158,809
25
$161,036
2
$52,020
2
$148,420
APPLICATIONS APPROVED, NOT ACCEPTED
0
$0
1
$150,000
3
$166,617
0
$0
0
$0
APPLICATIONS DENIED
0
$0
4
$77,840
8
$142,698
1
$33,730
0
$0
APPLICATIONS WITHDRAWN
0
$0
1
$144,810
4
$152,350
0
$0
0
$0
FILES CLOSED FOR INCOMPLETENESS
0
$0
0
$0
1
$182,590
0
$0
0
$0
Aggregated Statistics For Year 2000 (Based on 2 partial tracts)
A) FHA, FSA/RHS & VA Home Purchase Loans
B) Conventional Home Purchase Loans
C) Refinancings
D) Home Improvement Loans
F) Non-occupant Loans on < 5 Family Dwellings (A B C & D)
Number
Average Value
Number
Average Value
Number
Average Value
Number
Average Value
Number
Average Value
LOANS ORIGINATED
2
$119,320
8
$157,311
7
$136,681
3
$22,740
1
$125,660
APPLICATIONS APPROVED, NOT ACCEPTED
0
$0
1
$85,150
2
$103,090
1
$22,700
0
$0
APPLICATIONS DENIED
0
$0
3
$93,663
5
$104,078
2
$30,560
1
$52,940
APPLICATIONS WITHDRAWN
0
$0
1
$152,410
2
$111,300
0
$0
0
$0
FILES CLOSED FOR INCOMPLETENESS
0
$0
0
$0
1
$235,850
0
$0
0
$0
Aggregated Statistics For Year 1999 (Based on 1 partial tract)
A) FHA, FSA/RHS & VA Home Purchase Loans
B) Conventional Home Purchase Loans
C) Refinancings
D) Home Improvement Loans
F) Non-occupant Loans on < 5 Family Dwellings (A B C & D)
Detailed PMIC statistics for the following Tracts:0303.00
2002 - 2018 National Fire Incident Reporting System (NFIRS) incidents
Based on the data from the years 2002 - 2018 the average number of fire incidents per year is 7. The highest number of fires - 24 took place in 2015, and the least - 0 in 2017. The data has an increasing trend.
When looking into fire subcategories, the most reports belonged to: Structure Fires (59.7%), and Outside Fires (26.6%).
Fire incident types reported to NFIRS in Zip Code 97127


 Nearest zip codes: 97114, 97115, 97111, 97132, 97137, 97128.


 Based on the data from the years 2002 - 2018 the average number of fire incidents per year is 7. The highest number of fires - 24 took place in 2015, and the least - 0 in 2017. The data has an increasing trend.
 When looking into fire subcategories, the most reports belonged to: Structure Fires (59.7%), and Outside Fires (26.6%).