Estimated zip code population in 2022: 1,609 Zip code population in 2010: 1,076 Zip code population in 2000: 923
Houses and condos: 586 Renter-occupied apartments: 169
% of renters here:
29%
State:
37%
March 2022 cost of living index in zip code 97344: 94.2 (less than average, U.S. average is 100)
Land area: 11.0 sq. mi. Water area: 0.0 sq. mi.
Population density: 146 people per square mile
(very low).
OSM Map
General Map
Google Map
MSN Map
OSM Map
General Map
Google Map
MSN Map
OSM Map
General Map
Google Map
MSN Map
OSM Map
General Map
Google Map
MSN Map
Please wait while loading the map...
Real estate property taxes paid for housing units in 2022:
This zip code:
0.5% ($1,528)
Oregon:
0.8% ($3,646)
Median real estate property taxes paid for housing units with mortgages in 2022: $1,628 (0.5%) Median real estate property taxes paid for housing units with no mortgage in 2022: $1,346 (0.6%)
Averages for the 2020 tax year for zip code 97344, filed in 2021:
Average Adjusted Gross Income (AGI) in 2020: $45,387 (Individual Income Tax Returns)
Here:
$45,387
State:
$76,001
Salary/wage: $40,962 (reported on 83.0% of returns)
Here:
$40,962
State:
$61,959
(% of AGI for various income ranges: 1260.8% for AGIs below $25k, 3625.8% for AGIs $25k-50k, 7647.5% for AGIs $50k-75k, 9760.0% for AGIs $75k-100k, 20620.0% for AGIs $100k-200k)
Taxable interest for individuals: $500 (reported on 17.0% of returns)
This zip code:
$500
Oregon:
$1,628
(% of AGI for various income ranges: 0.8% for AGIs below $25k, 11.7% for AGIs $25k-50k, 83.3% for AGIs $75k-100k)
Ordinary dividends: $767 (reported on 6.4% of returns)
Here:
$767
State:
$7,165
(% of AGI for various income ranges: 19.2% for AGIs $25k-50k)
Net capital gain/loss in AGI: +$2,300 (reported on 8.5% of returns)
Here:
+$2,300
State:
+$23,403
(% of AGI for various income ranges: 76.7% for AGIs $25k-50k)
Profit/loss from business: +$7,560 (reported on 10.6% of returns)
Here:
+$7,560
State:
+$16,511
(% of AGI for various income ranges: 83.3% for AGIs below $25k, 231.7% for AGIs $25k-50k)
Earned income credit: $2,083 (reported on 25.5% of returns)
Here:
$2,083
State:
$1,977
(% of AGI for various income ranges: 120.8% for AGIs below $25k, 87.5% for AGIs $25k-50k)
Percentage of individuals using paid preparers for their 2020 taxes: 93.6%
Here:
94%
State:
93%
(% for various income ranges: 94.1% for AGIs below $25k, 93.3% for AGIs $25k-50k, 100.0% for AGIs $50k-75k, 80.0% for AGIs $75k-100k, 100.0% for AGIs $100k-200k)
Averages for the 2012 tax year for zip code 97344, filed in 2013:
Average Adjusted Gross Income (AGI) in 2012: $37,537 (Individual Income Tax Returns)
Here:
$37,537
State:
$57,845
Salary/wage: $32,906 (reported on 86.8% of returns)
Here:
$32,906
State:
$47,723
(% of AGI for various income ranges: 68.7% for AGIs below $25k, 79.2% for AGIs $25k-50k, 78.4% for AGIs $50k-75k, 83.2% for AGIs $75k-100k, 68.8% for AGIs $100k-200k)
Taxable interest for individuals: $314 (reported on 18.4% of returns)
This zip code:
$314
Oregon:
$1,848
Profit/loss from business: +$2,725 (reported on 10.5% of returns)
Here:
+$2,725
State:
+$13,871
Taxable individual retirement arrangement distribution: $8,633 (reported on 7.9% of returns)
97344:
$8,633
Oregon:
$16,036
Total itemized deductions: $16,408 (26% of AGI, reported on 31.6% of returns)
Here:
$16,408
State:
$24,430
Here:
26.5% of AGI
State:
23.2% of AGI
(% of AGI for various income ranges: 15.6% for AGIs $25k-50k, 15.7% for AGIs $50k-75k, 37.6% for AGIs $75k-100k)
Charity contributions: $1,878 (reported on 23.7% of returns)
Here:
$1,878
State:
$3,648
(% of AGI for various income ranges: 0.8% for AGIs below $25k, 1.9% for AGIs $50k-75k, 3.9% for AGIs $75k-100k)
Taxes paid: $5,300 (reported on 28.9% of returns)
97344:
$5,300
State:
$10,269
(% of AGI for various income ranges: 3.2% for AGIs $25k-50k, 4.9% for AGIs $50k-75k, 13.3% for AGIs $75k-100k)
Earned income credit: $1,991 (reported on 28.9% of returns)
Here:
$1,991
State:
$2,021
(% of AGI for various income ranges: 6.8% for AGIs below $25k, 1.8% for AGIs $25k-50k)
Percentage of individuals using paid preparers for their 2012 taxes: 36.8%
Here:
37%
State:
47%
(% for various income ranges: 33.3% for AGIs below $25k, 40.0% for AGIs $25k-50k, 40.0% for AGIs $50k-75k, 66.7% for AGIs $75k-100k)
Averages for the 2004 tax year for zip code 97344, filed in 2005:
Average Adjusted Gross Income (AGI) in 2004: $32,328 (Individual Income Tax Returns)
Here:
$32,328
State:
$46,788
Salary/wage: $29,991 (reported on 86.2% of returns)
Here:
$29,991
State:
$39,788
(% of AGI for various income ranges: 76.5% for AGIs below $10k, 79.3% for AGIs $10k-25k, 85.0% for AGIs $25k-50k, 88.6% for AGIs $50k-75k, 60.6% for AGIs $75k-100k)
Taxable interest for individuals: $518 (reported on 22.1% of returns)
This zip code:
$518
Oregon:
$2,126
(% of AGI for various income ranges: 3.8% for AGIs below $10k, 0.7% for AGIs $10k-25k, 0.1% for AGIs $25k-50k, 0.0% for AGIs $50k-75k, 0.4% for AGIs $75k-100k)
Taxable dividends: $733 (reported on 11.7% of returns)
Here:
$733
State:
$3,427
Net capital gain/loss: +$1,355 (reported on 8.1% of returns)
Here:
+$1,355
State:
+$12,447
Profit/loss from business: +$5,422 (reported on 11.7% of returns)
Here:
+$5,422
State:
+$11,682
Total itemized deductions: $14,587 (27% of AGI, reported on 31.5% of returns)
Here:
$14,587
State:
$20,209
Here:
26.8% of AGI
State:
24.7% of AGI
Charity contributions deductions: $1,647 (3% of AGI, reported on 22.1% of returns)
Here:
$1,647
State:
$3,145
Here:
2.9% of AGI
State:
3.6% of AGI
Total tax: $3,247 (reported on 66.4% of returns)
97344:
$3,247
State:
$7,148
(% of AGI for various income ranges: 2.6% for AGIs below $10k, 2.2% for AGIs $10k-25k, 5.2% for AGIs $25k-50k, 8.1% for AGIs $50k-75k, 10.6% for AGIs $75k-100k)
Earned income credit: $1,548 (reported on 24.2% of returns)
Here:
$1,548
State:
$1,605
Percentage of individuals using paid preparers for their 2004 taxes: 55.7%
Here:
56%
State:
53%
(% for various income ranges: 47.7% for AGIs below $10k, 59.8% for AGIs $10k-25k, 57.9% for AGIs $25k-50k, 46.6% for AGIs $50k-75k, 77.8% for AGIs $75k-100k)
Likely homosexual households (counted as self-reported same-sex unmarried-partner households)
Lesbian couples: 0.3% of all households
Gay men: 0.0% of all households
Household received Food Stamps/SNAP in the past 12 months: 262 Household did not receive Food Stamps/SNAP in the past 12 months: 326
Women who had a birth in the past 12 months: 1 (1 now married, 0 unmarried) Women who did not have a birth in the past 12 months: 389 (133 now married, 257 unmarried)
Housing units in zip code 97344 with a mortgage: 250 (17 second mortgage, 12 both second mortgage and home equity loan) Houses without a mortgage: 8
Median monthly owner costs for units with a mortgage: $1,217 Median monthly owner costs for units without a mortgage: $515
Residents with income below the poverty level in 2022:
This zip code:
16.7%
Whole state:
12.1%
Residents with income below 50% of the poverty level in 2022:
This zip code:
5.4%
Whole state:
6.2%
Median number of rooms in houses and condos:
Here:
5.8
State:
6.2
Median number of rooms in apartments:
Here:
5.0
State:
4.0
Notable locations in this zip code not listed on our city pages
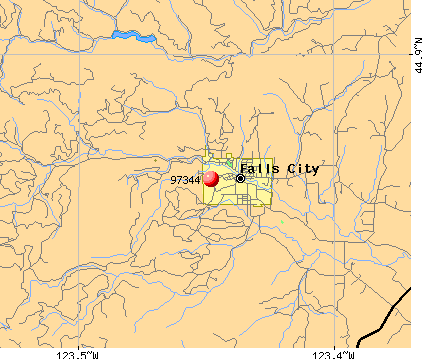
Notable locations in zip code 97344: Falls City Wastewater Treatment Plant (A), Camp Tapawingo (B), Falls City Fire Department (C), Falls City Public Works (D), Wagner Community Library (E), Falls City Community Building and Municipal Courthouse (F), Falls City City Hall (G), Southwest Polk County Rural Fire Protection District Station 120 (H). Display/hide their locations on the map
Parks in zip code 97344 include: Bridge Park (1), George Kitchen Upper Park (2), Michael Harding Park (3), Gerlinger County Park (4), Fran Wilson Riverside Park (5). Display/hide their locations on the map
Size of family households: 181 2-persons, 92 3-persons, 61 4-persons, 22 5-persons, 18 6-persons, 20 7-or-more-persons
Size of nonfamily households: 124 1-person, 46 2-persons, 2 3-persons
115 married couples with children.
87 single-parent households (24 men, 63 women).
95.3% of residents of 97344 zip code speak English at home.
2.9% of residents speak Spanish at home (46% very well, 39% well, 15% not well).
0.6% of residents speak other Indo-European language at home (100% very well).
0.7% of residents speak Asian or Pacific Island language at home (91% very well, 9% well).
Foreign born population: 35 (2.2%) (56.1% of them are naturalized citizens)
This zip code:
2.2%
Whole state:
9.9%
66%Honduras
6%Hong Kong
3%Taiwan
17%English
12%German
6%American
6%Norwegian
4%Irish
4%Scottish
3%European
Year of entry for the foreign-born population
162010 or later
22000 to 2009
51990 to 1999
26Before 1990
Facilities with environmental interests located in this zip code:
DALLAS ARSR SECTOR FIELD OFFICE I (NW1/4 SEC 32 T7S R7W in FALLS CITY, OR) . Federal Facility. FEDERAL AVIATION ADMINISTRATION
STATE MASTER (Oregon inspections and permits database) - OR-HWMS-3938, CESQG Conditionally Exempt Small Quantity Generators, less than 100 kg/month of hazardous waste (Resource Conservation and Recovery Act (tracking hazardous waste)) - notification Business SIC classification: REGULATION AND ADMINISTRATION OF TRANSPORTATION PROGRAMS Business NAICS classification: AIR TRAFFIC CONTROL.; AIR TRAFFIC CONTROL. Organizations: FEDERAL AVIATION ADMINISTRATION PNWSMO (CONTACT/ HAZARDOUS WASTE)
, DALLAS ARSR SECTOR FIELD OFFICE I USDOT (CONTACT/OPERATOR)
, FEDERAL AVIATION ADMINISTRATION (CONTACT/OWNER)
, USDOT FAA PORTLAND AIRWAYS FACILITIES (HAZARDOUS WASTE LAND OWNER)
, DALLAS ARSR SECTOR FIELD OFFICE I USDOT (HAZARDOUS WASTE OPERATOR)
Alternative names: USDOT FAA DALLAS ARSR, USDOT FAA DALLAS ARSR SECTOR FLD OFF I
FALLS CITY, CITY OF (R.M. 12 LITTLE LUCKIAMUTE in FALLS CITY, OR)
STATE MASTER (Oregon inspections and permits database) - OR-SIS-28830-100155, ONSITE WASTEWATER TREATMENT, OR-SIS-28830-100746, NPDES NON-MAJOR, OR-SIS-28830-101808, National Pollutant Discharge Elimination System NON-MAJOR (Tracking pollutant discharge elimination systems) - permit Business SIC classification: SEWERAGE SYSTEMS Organizations: CITY OF FALLS CITY (CONTACT/OWNER)
FALLS CITY ELEM. SCHOOL (177 PROSPECT AVE in FALLS CITY, OR)
(National Center for Education Statistics) - STATE ID-1005 Organizations: FALLS CITY SCH DIST 57 (SCHOOL DISTRICT)
FALLS CITY HIGH SCHOOL (111 N MAIN ST in FALLS CITY, OR)
(National Center for Education Statistics) - STATE ID-1006 Organizations: FALLS CITY SCH DIST 57 (SCHOOL DISTRICT)
Housing units lacking complete plumbing facilities: 1.6% Housing units lacking complete kitchen facilities: 3.6%
54.8%Electricity
38.8%Wood
2.9%Other fuel
1.6%Utility gas
0.9%Bottled, tank, or LP gas
0.7%Fuel oil, kerosene, etc.
0.7%No fuel used
Population in 1990: 957.
Place of birth for U.S.-born residents:
This state: 836
Northeast: 53
Midwest: 78
South: 132
West: 456
53% of the 97344 zip code residents lived in the same house 5 years ago. Out of people who lived in different houses, 53% lived in this county. Out of people who lived in different counties, 50% lived in Oregon.
93% of the 97344 zip code residents lived in the same house 1 year ago. Out of people who lived in different houses, 68% moved from this county. Out of people who lived in different houses, 27% moved from different county within same state. Out of people who lived in different houses, 5% moved from different state. Out of people who lived in different houses, 1% moved from abroad.
Private vs. public school enrollment:
Students in private schools in grades 1 to 8 (elementary and middle school): 27
Here:
15.6%
Oregon:
13.7%
Students in private schools in grades 9 to 12 (high school): 7
Here:
12.2%
Oregon:
8.8%
Students in private undergraduate colleges:
Here:
0.0%
Oregon:
17.7%
Occupation by median earnings in the past 12 months ($)
71,848Management occupations
59,287Health technologists and technicians
47,197Business and financial operations occupations
39,757Installation, maintenance, and repair occupations
39,105Arts, design, entertainment, sports, and media occupations
38,910Construction and extraction occupations
Top industries in this zip code by the number of employees in 2005:
Other Services (except Public Administration): Religious Organizations (1-4 employees: 3 establishments)
Accommodation and Food Services: Full-Service Restaurants (1-4: 1)
Home Mortgage Disclosure Act Aggregated Statistics For Year 2009 (Based on 2 partial tracts)
A) FHA, FSA/RHS & VA Home Purchase Loans
B) Conventional Home Purchase Loans
C) Refinancings
G) Loans On Manufactured Home Dwelling (A B C & D)
Number
Average Value
Number
Average Value
Number
Average Value
Number
Average Value
LOANS ORIGINATED
1
$118,730
0
$0
8
$193,748
2
$141,075
APPLICATIONS APPROVED, NOT ACCEPTED
0
$0
0
$0
1
$229,890
0
$0
APPLICATIONS DENIED
1
$120,590
1
$163,830
4
$157,940
1
$131,820
APPLICATIONS WITHDRAWN
0
$0
0
$0
3
$158,247
0
$0
FILES CLOSED FOR INCOMPLETENESS
0
$0
0
$0
1
$104,470
0
$0
Aggregated Statistics For Year 2008 (Based on 2 partial tracts)
A) FHA, FSA/RHS & VA Home Purchase Loans
B) Conventional Home Purchase Loans
C) Refinancings
D) Home Improvement Loans
F) Non-occupant Loans on < 5 Family Dwellings (A B C & D)
G) Loans On Manufactured Home Dwelling (A B C & D)
Number
Average Value
Number
Average Value
Number
Average Value
Number
Average Value
Number
Average Value
Number
Average Value
LOANS ORIGINATED
1
$171,280
2
$150,125
5
$209,426
1
$82,590
0
$0
2
$103,480
APPLICATIONS APPROVED, NOT ACCEPTED
0
$0
1
$99,870
1
$175,590
0
$0
0
$0
0
$0
APPLICATIONS DENIED
0
$0
1
$99,750
6
$180,730
1
$129,200
1
$60,300
1
$243,630
APPLICATIONS WITHDRAWN
0
$0
0
$0
1
$229,540
0
$0
0
$0
0
$0
FILES CLOSED FOR INCOMPLETENESS
0
$0
0
$0
1
$119,830
0
$0
0
$0
0
$0
Aggregated Statistics For Year 2007 (Based on 2 partial tracts)
A) FHA, FSA/RHS & VA Home Purchase Loans
B) Conventional Home Purchase Loans
C) Refinancings
D) Home Improvement Loans
F) Non-occupant Loans on < 5 Family Dwellings (A B C & D)
G) Loans On Manufactured Home Dwelling (A B C & D)
Number
Average Value
Number
Average Value
Number
Average Value
Number
Average Value
Number
Average Value
Number
Average Value
LOANS ORIGINATED
1
$142,650
4
$178,455
6
$183,155
1
$115,530
1
$144,340
2
$130,920
APPLICATIONS APPROVED, NOT ACCEPTED
0
$0
1
$168,550
2
$112,765
0
$0
0
$0
0
$0
APPLICATIONS DENIED
0
$0
2
$212,255
6
$156,538
2
$83,575
1
$90,150
2
$136,015
APPLICATIONS WITHDRAWN
0
$0
1
$171,280
2
$208,500
0
$0
0
$0
0
$0
FILES CLOSED FOR INCOMPLETENESS
0
$0
0
$0
1
$169,250
0
$0
0
$0
0
$0
Aggregated Statistics For Year 2006 (Based on 2 partial tracts)
A) FHA, FSA/RHS & VA Home Purchase Loans
B) Conventional Home Purchase Loans
C) Refinancings
D) Home Improvement Loans
F) Non-occupant Loans on < 5 Family Dwellings (A B C & D)
G) Loans On Manufactured Home Dwelling (A B C & D)
Number
Average Value
Number
Average Value
Number
Average Value
Number
Average Value
Number
Average Value
Number
Average Value
LOANS ORIGINATED
1
$75,190
5
$156,720
7
$156,467
1
$78,690
1
$152,020
2
$148,790
APPLICATIONS APPROVED, NOT ACCEPTED
0
$0
1
$154,990
2
$106,475
0
$0
0
$0
0
$0
APPLICATIONS DENIED
0
$0
2
$146,695
8
$115,752
2
$87,185
1
$77,290
2
$107,435
APPLICATIONS WITHDRAWN
0
$0
1
$162,610
3
$172,817
0
$0
0
$0
1
$67,980
FILES CLOSED FOR INCOMPLETENESS
0
$0
0
$0
1
$243,740
0
$0
0
$0
0
$0
Aggregated Statistics For Year 2005 (Based on 2 partial tracts)
A) FHA, FSA/RHS & VA Home Purchase Loans
B) Conventional Home Purchase Loans
C) Refinancings
D) Home Improvement Loans
F) Non-occupant Loans on < 5 Family Dwellings (A B C & D)
G) Loans On Manufactured Home Dwelling (A B C & D)
Number
Average Value
Number
Average Value
Number
Average Value
Number
Average Value
Number
Average Value
Number
Average Value
LOANS ORIGINATED
1
$94,630
6
$137,478
6
$152,853
1
$52,900
1
$136,770
2
$136,305
APPLICATIONS APPROVED, NOT ACCEPTED
0
$0
1
$68,910
2
$113,140
0
$0
0
$0
0
$0
APPLICATIONS DENIED
0
$0
3
$137,410
7
$127,433
1
$50,340
1
$121,700
2
$104,410
APPLICATIONS WITHDRAWN
0
$0
2
$114,305
4
$149,895
0
$0
0
$0
1
$72,400
FILES CLOSED FOR INCOMPLETENESS
0
$0
0
$0
1
$69,080
0
$0
0
$0
0
$0
Aggregated Statistics For Year 2004 (Based on 2 partial tracts)
A) FHA, FSA/RHS & VA Home Purchase Loans
B) Conventional Home Purchase Loans
C) Refinancings
D) Home Improvement Loans
F) Non-occupant Loans on < 5 Family Dwellings (A B C & D)
G) Loans On Manufactured Home Dwelling (A B C & D)
Number
Average Value
Number
Average Value
Number
Average Value
Number
Average Value
Number
Average Value
Number
Average Value
LOANS ORIGINATED
1
$86,190
5
$130,962
7
$138,931
1
$90,330
2
$101,005
2
$119,745
APPLICATIONS APPROVED, NOT ACCEPTED
0
$0
1
$107,030
2
$126,525
0
$0
0
$0
1
$78,860
APPLICATIONS DENIED
0
$0
2
$130,920
7
$127,324
1
$85,960
1
$76,010
2
$126,790
APPLICATIONS WITHDRAWN
0
$0
1
$193,750
4
$130,542
0
$0
1
$61,340
1
$83,340
FILES CLOSED FOR INCOMPLETENESS
0
$0
0
$0
0
$0
0
$0
0
$0
0
$0
Aggregated Statistics For Year 2003 (Based on 2 partial tracts)
A) FHA, FSA/RHS & VA Home Purchase Loans
B) Conventional Home Purchase Loans
C) Refinancings
D) Home Improvement Loans
F) Non-occupant Loans on < 5 Family Dwellings (A B C & D)
Number
Average Value
Number
Average Value
Number
Average Value
Number
Average Value
Number
Average Value
LOANS ORIGINATED
1
$102,260
4
$117,010
16
$122,816
1
$15,070
2
$71,730
APPLICATIONS APPROVED, NOT ACCEPTED
0
$0
1
$74,030
2
$128,475
0
$0
1
$60,700
APPLICATIONS DENIED
0
$0
2
$119,280
7
$121,364
1
$21,010
0
$0
APPLICATIONS WITHDRAWN
0
$0
1
$85,090
3
$156,093
0
$0
0
$0
FILES CLOSED FOR INCOMPLETENESS
0
$0
0
$0
1
$79,210
0
$0
0
$0
Aggregated Statistics For Year 2002 (Based on 2 partial tracts)
A) FHA, FSA/RHS & VA Home Purchase Loans
B) Conventional Home Purchase Loans
C) Refinancings
D) Home Improvement Loans
F) Non-occupant Loans on < 5 Family Dwellings (A B C & D)
Number
Average Value
Number
Average Value
Number
Average Value
Number
Average Value
Number
Average Value
LOANS ORIGINATED
1
$110,870
4
$113,170
9
$129,657
1
$34,220
1
$106,970
APPLICATIONS APPROVED, NOT ACCEPTED
0
$0
0
$0
1
$186,590
0
$0
0
$0
APPLICATIONS DENIED
0
$0
1
$118,150
4
$127,778
0
$0
0
$0
APPLICATIONS WITHDRAWN
0
$0
1
$61,810
3
$97,873
0
$0
0
$0
FILES CLOSED FOR INCOMPLETENESS
0
$0
0
$0
1
$164,300
0
$0
0
$0
Aggregated Statistics For Year 2001 (Based on 2 partial tracts)
A) FHA, FSA/RHS & VA Home Purchase Loans
B) Conventional Home Purchase Loans
C) Refinancings
D) Home Improvement Loans
Number
Average Value
Number
Average Value
Number
Average Value
Number
Average Value
LOANS ORIGINATED
1
$92,360
3
$103,907
8
$117,091
2
$22,030
APPLICATIONS APPROVED, NOT ACCEPTED
0
$0
1
$45,800
2
$88,840
0
$0
APPLICATIONS DENIED
0
$0
1
$90,730
5
$101,664
1
$13,500
APPLICATIONS WITHDRAWN
0
$0
0
$0
4
$104,935
0
$0
FILES CLOSED FOR INCOMPLETENESS
0
$0
0
$0
1
$95,910
0
$0
Aggregated Statistics For Year 2000 (Based on 2 partial tracts)
B) Conventional Home Purchase Loans
C) Refinancings
D) Home Improvement Loans
F) Non-occupant Loans on < 5 Family Dwellings (A B C & D)
Number
Average Value
Number
Average Value
Number
Average Value
Number
Average Value
LOANS ORIGINATED
2
$112,850
3
$112,150
1
$24,500
1
$36,380
APPLICATIONS APPROVED, NOT ACCEPTED
0
$0
1
$120,180
0
$0
0
$0
APPLICATIONS DENIED
1
$163,720
3
$99,017
1
$11,120
0
$0
APPLICATIONS WITHDRAWN
0
$0
1
$149,280
0
$0
0
$0
FILES CLOSED FOR INCOMPLETENESS
0
$0
1
$80,030
0
$0
0
$0
Aggregated Statistics For Year 1999 (Based on 1 partial tract)
Detailed PMIC statistics for the following Tracts:0204.00
2002 - 2018 National Fire Incident Reporting System (NFIRS) incidents
According to the data from the years 2002 - 2018 the average number of fires per year is 7. The highest number of reported fires - 29 took place in 2002, and the least - 1 in 2005. The data has a declining trend.
When looking into fire subcategories, the most incidents belonged to: Structure Fires (46.6%), and Outside Fires (40.7%).
Fire incident types reported to NFIRS in Zip Code 97344


 Nearest zip codes: 97338, 97361, 97378, 97396, 97347, 97326.


 . Federal Facility. FEDERAL AVIATION ADMINISTRATION


 According to the data from the years 2002 - 2018 the average number of fires per year is 7. The highest number of reported fires - 29 took place in 2002, and the least - 1 in 2005. The data has a declining trend.
 When looking into fire subcategories, the most incidents belonged to: Structure Fires (46.6%), and Outside Fires (40.7%).