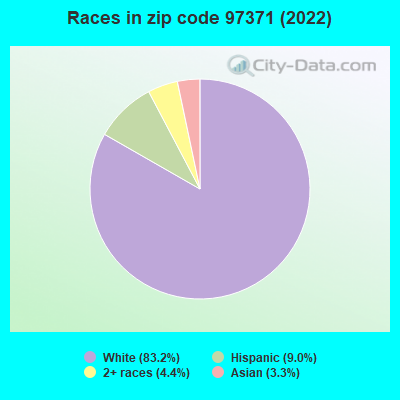
Estimated zip code population in 2022: 608 Zip code population in 2010: 730 Zip code population in 2000: 563
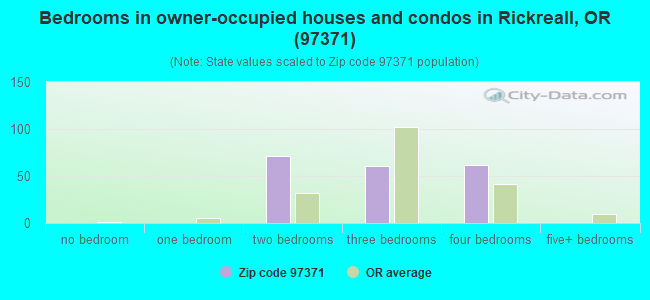
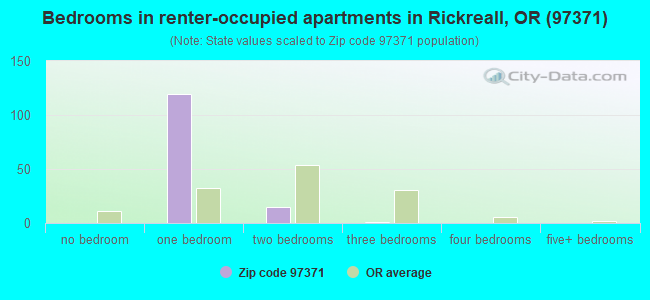
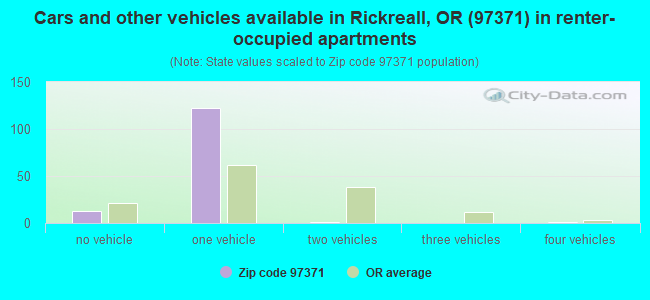
Houses and condos: 326 Renter-occupied apartments: 132
% of renters here:
41%
State:
37%
March 2022 cost of living index in zip code 97371: 91.7 (less than average, U.S. average is 100)
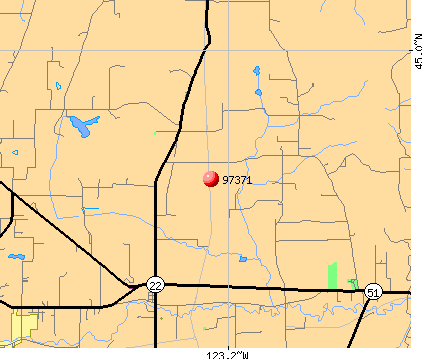
Land area: 42.8 sq. mi. Water area: 0.1 sq. mi.
Population density: 14 people per square mile
(very low).
OSM Map
General Map
Google Map
MSN Map
OSM Map
General Map
Google Map
MSN Map
OSM Map
General Map
Google Map
MSN Map
OSM Map
General Map
Google Map
MSN Map
Please wait while loading the map...
Real estate property taxes paid for housing units in 2022:
This zip code:
0.5% ($2,602)
Oregon:
0.8% ($3,646)
Median real estate property taxes paid for housing units with mortgages in 2022: $2,545 (0.6%) Median real estate property taxes paid for housing units with no mortgage in 2022: $2,638 (0.6%)
Business Search- 14 Million verified businesses
Males: 303
(49.8%)
Females: 305
(50.2%)
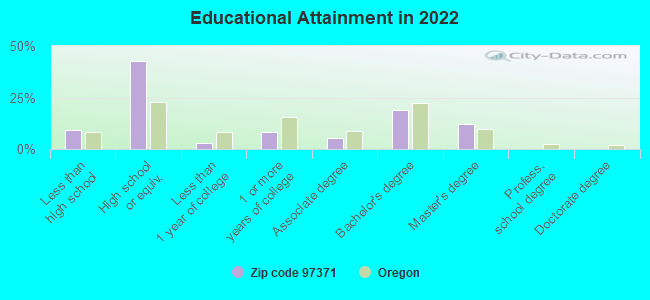
For population 25 years and over in 97371:
High school or higher: 90.3%
Bachelor's degree or higher: 31.3%
Graduate or professional degree: 12.4%
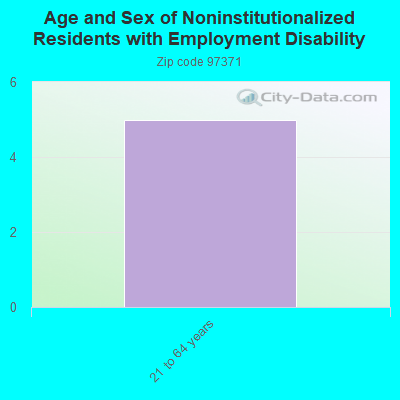
Unemployed: 4.5%
Mean travel time to work (commute): 17.1 minutes
For population 15 years and over in 97371:
Never married: 11.7%
Now married: 62.3%
Separated: 0.0%
Widowed: 4.0%
Divorced: 22.0%
Zip code 97371 compared to state average:
Median household income significantly below state average.
Black race population percentage significantly below state average.
Median age significantly above state average.
Foreign-born population percentage significantly above state average.
Length of stay since moving in significantly above state average.
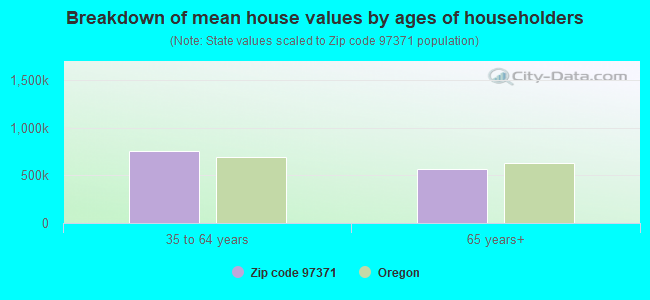
Estimated median house/condo value in 2022: $509,323
97371:
$509,323
Oregon:
$475,600
Median resident age:
This zip code:
55.3 years
Oregon median age:
40.5 years
Average household size:
This zip code:
1.9 people
Oregon:
2.4 people
Averages for the 2020 tax year for zip code 97371, filed in 2021:
Average Adjusted Gross Income (AGI) in 2020: $82,765 (Individual Income Tax Returns)
Here:
$82,765
State:
$76,001
Salary/wage: $58,159 (reported on 73.0% of returns)
Here:
$58,159
State:
$61,959
(% of AGI for various income ranges: 1738.3% for AGIs below $25k, 3742.0% for AGIs $25k-50k, 8945.0% for AGIs $50k-75k, 11925.0% for AGIs $75k-100k, 14845.0% for AGIs $100k-200k)
Taxable interest for individuals: $1,079 (reported on 37.8% of returns)
This zip code:
$1,079
Oregon:
$1,628
(% of AGI for various income ranges: 28.3% for AGIs below $25k, 30.0% for AGIs $25k-50k, 120.0% for AGIs $50k-75k, 237.5% for AGIs $100k-200k)
Ordinary dividends: $11,144 (reported on 24.3% of returns)
Here:
$11,144
State:
$7,165
(% of AGI for various income ranges: 75.0% for AGIs below $25k, 325.0% for AGIs $50k-75k, 2232.5% for AGIs $100k-200k)
Net capital gain/loss in AGI: +$14,288 (reported on 21.6% of returns)
Here:
+$14,288
State:
+$23,403
(% of AGI for various income ranges: 120.0% for AGIs below $25k, 45.0% for AGIs $50k-75k, 2655.0% for AGIs $100k-200k)
Profit/loss from business: +$8,183 (reported on 16.2% of returns)
Here:
+$8,183
State:
+$16,511
(% of AGI for various income ranges: 136.7% for AGIs below $25k, 1250.0% for AGIs $50k-75k, 397.5% for AGIs $100k-200k)
Taxable individual retirement arrangement distribution: $11,467 (reported on 8.1% of returns)
97371:
$11,467
Oregon:
$20,730
(% of AGI for various income ranges: 1720.0% for AGIs $50k-75k)
Total itemized deductions: $34,500 (reported on 16.2% of returns)
Here:
$34,500
State:
$31,050
(% of AGI for various income ranges: 1446.0% for AGIs $25k-50k, 3367.5% for AGIs $100k-200k)
Charity contributions: $22,100 (reported on 8.1% of returns)
Here:
$22,100
State:
$8,791
(% of AGI for various income ranges: 1657.5% for AGIs $100k-200k)
Taxes paid: $7,780 (reported on 13.5% of returns)
97371:
$7,780
State:
$8,487
(% of AGI for various income ranges: 248.0% for AGIs $25k-50k, 662.5% for AGIs $100k-200k)
Earned income credit: $2,125 (reported on 10.8% of returns)
Here:
$2,125
State:
$1,977
(% of AGI for various income ranges: 141.7% for AGIs below $25k)
Percentage of individuals using paid preparers for their 2020 taxes: 94.6%
Here:
95%
State:
93%
(% for various income ranges: 90.0% for AGIs below $25k, 87.5% for AGIs $25k-50k, 100.0% for AGIs $50k-75k, 100.0% for AGIs $75k-100k, 100.0% for AGIs $100k-200k, 100.0% for AGIs over 200k)
Averages for the 2012 tax year for zip code 97371, filed in 2013:
Average Adjusted Gross Income (AGI) in 2012: $57,453 (Individual Income Tax Returns)
Here:
$57,453
State:
$57,845
Salary/wage: $37,468 (reported on 77.8% of returns)
Here:
$37,468
State:
$47,723
(% of AGI for various income ranges: 74.4% for AGIs below $25k, 67.2% for AGIs $25k-50k, 70.9% for AGIs $50k-75k, 68.5% for AGIs $75k-100k, 23.4% for AGIs $100k-200k)
Taxable interest for individuals: $1,285 (reported on 36.1% of returns)
This zip code:
$1,285
Oregon:
$1,848
(% of AGI for various income ranges: 1.0% for AGIs below $25k, 1.2% for AGIs $25k-50k, 0.5% for AGIs $50k-75k, 0.5% for AGIs $75k-100k, 0.9% for AGIs $100k-200k)
Ordinary dividends: $4,475 (reported on 22.2% of returns)
Here:
$4,475
State:
$5,987
(% of AGI for various income ranges: 2.3% for AGIs $25k-50k, 1.5% for AGIs $50k-75k, 2.7% for AGIs $100k-200k)
Net capital gain/loss in AGI: +$16,188 (reported on 22.2% of returns)
Here:
+$16,188
State:
+$13,095
(% of AGI for various income ranges: 0.5% for AGIs $50k-75k, 15.1% for AGIs $100k-200k)
Profit/loss from business: +$2,629 (reported on 19.4% of returns)
Here:
+$2,629
State:
+$13,871
Taxable individual retirement arrangement distribution: $7,540 (reported on 13.9% of returns)
97371:
$7,540
Oregon:
$16,036
Total itemized deductions: $22,629 (24% of AGI, reported on 38.9% of returns)
Here:
$22,629
State:
$24,430
Here:
24.0% of AGI
State:
23.2% of AGI
(% of AGI for various income ranges: 18.9% for AGIs $25k-50k, 15.6% for AGIs $50k-75k, 14.3% for AGIs $75k-100k, 17.0% for AGIs $100k-200k)
Charity contributions: $4,700 (reported on 30.6% of returns)
Here:
$4,700
State:
$3,648
(% of AGI for various income ranges: 2.4% for AGIs below $25k, 1.8% for AGIs $50k-75k, 2.4% for AGIs $75k-100k, 3.8% for AGIs $100k-200k)
Taxes paid: $8,264 (reported on 38.9% of returns)
97371:
$8,264
State:
$10,269
(% of AGI for various income ranges: 4.9% for AGIs $25k-50k, 5.5% for AGIs $50k-75k, 5.0% for AGIs $75k-100k, 7.2% for AGIs $100k-200k)
Earned income credit: $1,800 (reported on 13.9% of returns)
Here:
$1,800
State:
$2,021
(% of AGI for various income ranges: 3.3% for AGIs below $25k, 1.2% for AGIs $25k-50k)
Percentage of individuals using paid preparers for their 2012 taxes: 61.1%
Here:
61%
State:
47%
(% for various income ranges: 46.2% for AGIs below $25k, 55.6% for AGIs $25k-50k, 66.7% for AGIs $50k-75k, 75.0% for AGIs $75k-100k, 100.0% for AGIs $100k-200k)
Averages for the 2004 tax year for zip code 97371, filed in 2005:
Average Adjusted Gross Income (AGI) in 2004: $43,460 (Individual Income Tax Returns)
Here:
$43,460
State:
$46,788
Salary/wage: $33,600 (reported on 74.8% of returns)
Here:
$33,600
State:
$39,788
(% of AGI for various income ranges: 99.7% for AGIs below $10k, 63.7% for AGIs $10k-25k, 63.6% for AGIs $25k-50k, 76.5% for AGIs $50k-75k, 73.2% for AGIs $75k-100k, 19.2% for AGIs over 100k)
Taxable interest for individuals: $2,350 (reported on 49.9% of returns)
This zip code:
$2,350
Oregon:
$2,126
(% of AGI for various income ranges: 14.2% for AGIs below $10k, 4.0% for AGIs $10k-25k, 3.6% for AGIs $25k-50k, 0.6% for AGIs $50k-75k, 2.1% for AGIs $75k-100k, 2.9% for AGIs over 100k)
Taxable dividends: $2,235 (reported on 23.5% of returns)
Here:
$2,235
State:
$3,427
(% of AGI for various income ranges: 8.6% for AGIs below $10k, 0.6% for AGIs $10k-25k, 1.3% for AGIs $25k-50k, 1.3% for AGIs $50k-75k, 1.6% for AGIs over 100k)
Net capital gain/loss: +$5,557 (reported on 21.9% of returns)
Here:
+$5,557
State:
+$12,447
(% of AGI for various income ranges: 0.8% for AGIs $10k-25k, 1.7% for AGIs $25k-50k, 2.8% for AGIs $50k-75k, 0.9% for AGIs $75k-100k, 6.1% for AGIs over 100k)
Profit/loss from business: +$4,130 (reported on 15.0% of returns)
Here:
+$4,130
State:
+$11,682
Total itemized deductions: $19,261 (26% of AGI, reported on 37.1% of returns)
Here:
$19,261
State:
$20,209
Here:
26.1% of AGI
State:
24.7% of AGI
(% of AGI for various income ranges: 16.4% for AGIs $10k-25k, 14.9% for AGIs $25k-50k, 18.0% for AGIs $50k-75k, 16.9% for AGIs $75k-100k, 17.3% for AGIs over 100k)
Charity contributions deductions: $2,813 (4% of AGI, reported on 29.6% of returns)
Here:
$2,813
State:
$3,145
Here:
3.5% of AGI
State:
3.6% of AGI
(% of AGI for various income ranges: 2.1% for AGIs $25k-50k, 2.1% for AGIs $50k-75k, 1.9% for AGIs $75k-100k, 2.5% for AGIs over 100k)
Total tax: $5,735 (reported on 79.5% of returns)
97371:
$5,735
State:
$7,148
(% of AGI for various income ranges: 4.4% for AGIs below $10k, 4.7% for AGIs $10k-25k, 6.8% for AGIs $25k-50k, 7.1% for AGIs $50k-75k, 10.4% for AGIs $75k-100k, 18.9% for AGIs over 100k)
Earned income credit: $1,621 (reported on 8.0% of returns)
Here:
$1,621
State:
$1,605
Percentage of individuals using paid preparers for their 2004 taxes: 59.3%
Here:
59%
State:
53%
(% for various income ranges: 52.8% for AGIs below $10k, 46.2% for AGIs $10k-25k, 66.2% for AGIs $25k-50k, 58.6% for AGIs $50k-75k, 74.4% for AGIs $75k-100k, 86.4% for AGIs over 100k)
Household received Food Stamps/SNAP in the past 12 months: 174 Household did not receive Food Stamps/SNAP in the past 12 months: 163
Women who did not have a birth in the past 12 months: 61 (54 now married, 5 unmarried)
Housing units in zip code 97371 with a mortgage: 113 (7 second mortgage) Median monthly owner costs for units with a mortgage: $1,961 Median monthly owner costs for units without a mortgage: $734
Residents with income below the poverty level in 2022:
This zip code:
18.3%
Whole state:
12.1%
Residents with income below 50% of the poverty level in 2022:
This zip code:
18.3%
Whole state:
6.2%
Median number of rooms in houses and condos:
Here:
6.3
State:
6.2
Median number of rooms in apartments:
Here:
2.0
State:
4.0
Notable locations in this zip code not listed on our city pages
Notable locations in zip code 97371: Dallas Sewage Treatment Plant (A), Polk County Fairgrounds (B), Finns Corner (C), Polk County Fairgrounds (D), Clow Corner (E), Derry (F), Walkers Corner (G), Oak Knoll Golf Course (H), Crowley (I), Willamette Biomass Processor's (J), Cherriots Rickreall Park and Ride (K), Orrs Corner (L), Southwest Polk County Rural Fire Protection District Station 130 (M), Polk County Museum (N). Display/hide their locations on the map
Reservoirs: Letteken Ponds (A), Martin Brothers Flashboard Reservoir (B), Stevens Reservoir (C), Ross Reservoir (D), Boeder Pond (E), Stewart Reservoir (F), Rohde Reservoir (G), Marx Reservoir (H). Display/hide their locations on the map
Streams, rivers, and creeks: Crowley Creek (A), Harland Slough (B), McMahan Branch (C), Mud Slough (D), Richards Creek (E), West Branch Ash Swale (F), McNary Branch (G). Display/hide their locations on the map
Size of family households: 131 2-persons, 24 4-persons, 8 5-persons, 17 6-persons
Size of nonfamily households: 139 1-person, 7 2-persons
113 married couples with children.
0 single-parent households ().
74.3% of residents of 97371 zip code speak English at home.
7.1% of residents speak Spanish at home (100% well).
16.6% of residents speak other Indo-European language at home (100% well).
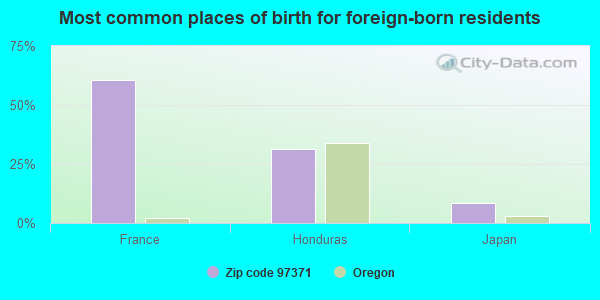
Foreign born population: 174 (28.7%) (100.0% of them are naturalized citizens)
This zip code:
28.7%
Whole state:
9.9%
61%France
31%Honduras
8%Japan
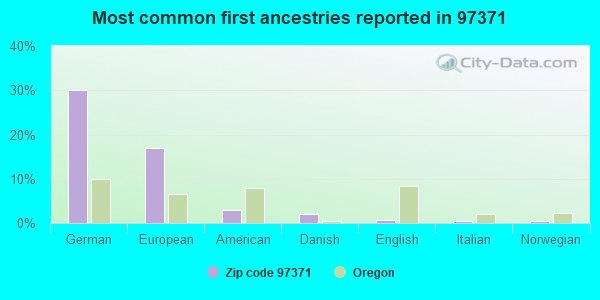
30%German
17%European
3%American
2%Danish
1%English
0%Italian
0%Norwegian
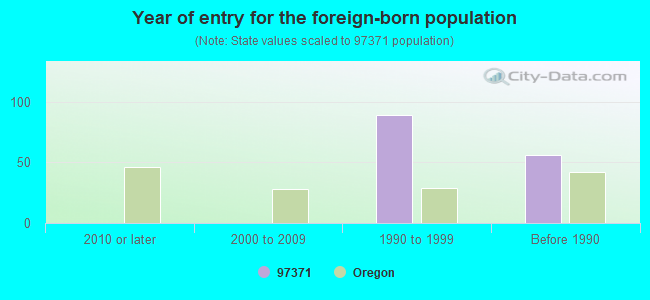
Year of entry for the foreign-born population
02010 or later
32000 to 2009
941990 to 1999
67Before 1990
Facilities with environmental interests located in this zip code:
AG WEST SUPPLY (9055 RICKREALL ROAD in RICKREALL, OR)
COMPLIANCE ACTIVITY (Tracking inspections of insecticide, fungicide, and rodenticide, and toxic substances) STATE MASTER (Oregon inspections and permits database) - OR-ECSI-1459, SUPERFUND, OR-LUST-27-98-4154, LEAKING STORAGE TANK, OR-HWMS-5013, CESQG Conditionally Exempt Small Quantity Generators, less than 100 kg/month of hazardous waste (Resource Conservation and Recovery Act (tracking hazardous waste)) - notification Business SIC classification: FERTILIZERS, MIXING ONLY; FARM AND GARDEN MACHINERY AND EQUIPMENT; PETROLEUM AND PETROLEUM PRODUCTS WHOLESALERS, EXCEPT BULK STATIONS AND TERMINALS; FARM SUPPLIES Business NAICS classification: FERTILIZER (MIXING ONLY) MANUFACTURING.; FERTILIZER (MIXING ONLY) MANUFACTURING. Organizations: POLK COUNTY FARMERS COOP (CONTACT/ HAZARDOUS WASTE)
, POLK COUNTY FARMERS CO-OP (HAZARDOUS WASTE LAND OWNER)
Alternative names: AG WEST SUPPLY DBA POLK CO FARM COOP, AG WEST SUPPLY DBA POLK CO FARMERS COOP
BURELBACH INDUSTRIES INC (10135 RICKREALL RD in RICKREALL, OR)
STATE MASTER (Oregon inspections and permits database) - OR-HWMS-3652, CESQG Conditionally Exempt Small Quantity Generators, less than 100 kg/month of hazardous waste (Resource Conservation and Recovery Act (tracking hazardous waste)) - notification Business SIC classification: WOODWORKING MACHINERY Organizations: CALVIN BAMFORD, JR. (CONTACT/OWNER)
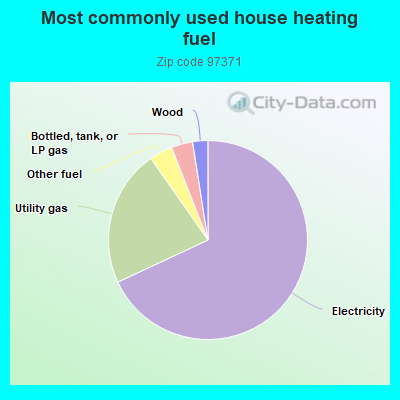
Housing units lacking complete kitchen facilities: 3.2%
68.6%Electricity
22.4%Utility gas
3.8%Other fuel
3.5%Bottled, tank, or LP gas
2.5%Wood
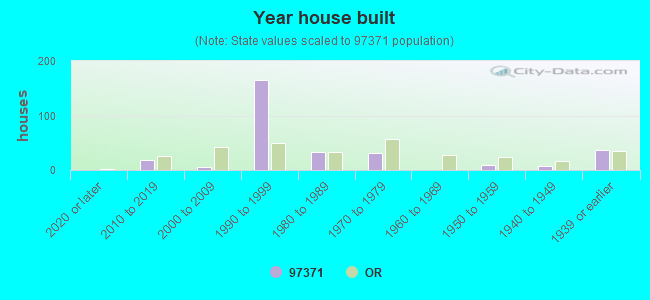
Population in 1990: 266. Population change in the 1990s: +297 (+111.7%).
Place of birth for U.S.-born residents:
This state: 291
Midwest: 32
West: 107
69% of the 97371 zip code residents lived in the same house 5 years ago. Out of people who lived in different houses, 70% lived in this county. Out of people who lived in different counties, 50% lived in Oregon.
101% of the 97371 zip code residents lived in the same house 1 year ago.
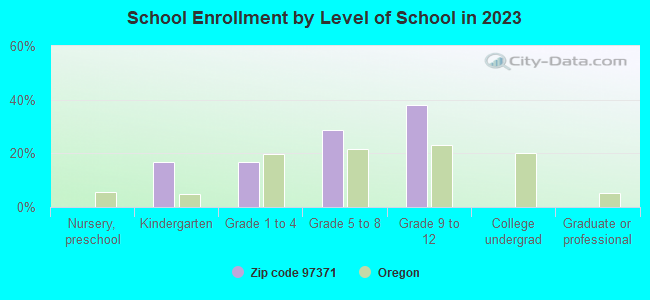
Private vs. public school enrollment:
Students in private schools in grades 1 to 8 (elementary and middle school):
Here:
0.0%
Oregon:
13.7%
Students in private schools in grades 9 to 12 (high school): 4
Here:
12.6%
Oregon:
8.8%
Students in private undergraduate colleges: 22
Here:
100.0%
Oregon:
17.7%
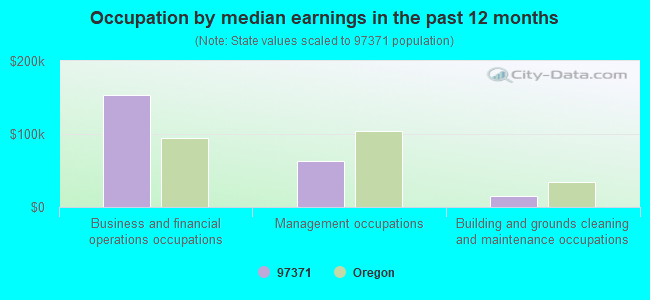
Occupation by median earnings in the past 12 months ($)
153,921Business and financial operations occupations
63,412Management occupations
15,446Building and grounds cleaning and maintenance occupations
Top industries in this zip code by the number of employees in 2005:
Accommodation and Food Services: Full-Service Restaurants (10-19 employees: 1 establishment)
Wholesale Trade: Farm and Garden Machinery and Equipment Merchant Wholesalers (10-19: 1)
Construction: Plumbing, Heating, and Air-Conditioning Contractors (5-9: 1, 1-4: 2)
Construction: Poured Concrete Foundation and Structure Contractors (5-9: 1)
Fatal accident statistics in 2012:
Fatal accident count: 1
Vehicles involved in fatal accidents: 2
Fatal accidents caused by drunken drivers: 0
Fatalities: 1
Persons involved in fatal accidents: 3
Pedestrians involved in fatal accidents: 0
Fatal accident statistics in 2011:
Fatal accident count: 1
Vehicles involved in fatal accidents: 2
Fatal accidents caused by drunken drivers: 0
Fatalities: 1
Persons involved in fatal accidents: 3
Pedestrians involved in fatal accidents: 0
Home Mortgage Disclosure Act Aggregated Statistics For Year 2009 (Based on 4 partial tracts)
A) FHA, FSA/RHS & VA Home Purchase Loans
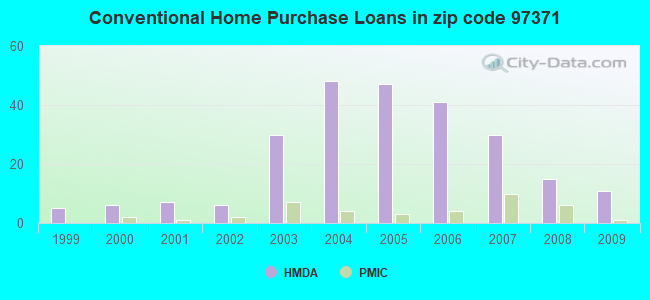
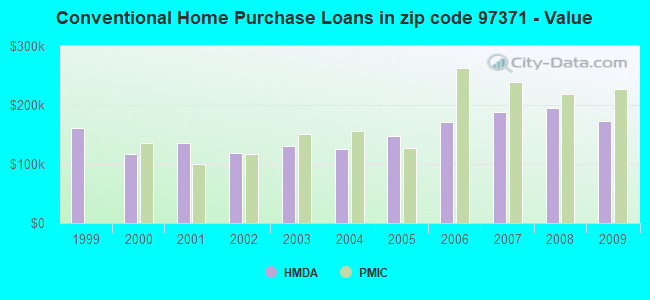
B) Conventional Home Purchase Loans
C) Refinancings
D) Home Improvement Loans
F) Non-occupant Loans on < 5 Family Dwellings (A B C & D)
G) Loans On Manufactured Home Dwelling (A B C & D)
Number
Average Value
Number
Average Value
Number
Average Value
Number
Average Value
Number
Average Value
Number
Average Value
LOANS ORIGINATED
10
$188,695
11
$173,418
62
$189,767
3
$150,527
4
$189,262
9
$152,762
APPLICATIONS APPROVED, NOT ACCEPTED
2
$145,925
1
$191,710
10
$222,729
0
$0
0
$0
0
$0
APPLICATIONS DENIED
3
$186,440
4
$142,812
25
$208,536
2
$136,600
2
$158,040
5
$93,032
APPLICATIONS WITHDRAWN
2
$148,395
1
$112,180
22
$235,940
1
$91,240
1
$804,870
2
$144,380
FILES CLOSED FOR INCOMPLETENESS
0
$0
1
$260,350
2
$501,280
0
$0
1
$773,020
0
$0
Aggregated Statistics For Year 2008 (Based on 4 partial tracts)
A) FHA, FSA/RHS & VA Home Purchase Loans
B) Conventional Home Purchase Loans
C) Refinancings
D) Home Improvement Loans
F) Non-occupant Loans on < 5 Family Dwellings (A B C & D)
G) Loans On Manufactured Home Dwelling (A B C & D)
Number
Average Value
Number
Average Value
Number
Average Value
Number
Average Value
Number
Average Value
Number
Average Value
LOANS ORIGINATED
4
$168,405
15
$194,559
37
$199,995
4
$158,795
4
$153,652
5
$150,226
APPLICATIONS APPROVED, NOT ACCEPTED
1
$155,150
3
$184,987
9
$194,230
1
$80,700
1
$262,200
3
$88,720
APPLICATIONS DENIED
2
$160,255
8
$221,659
30
$207,232
5
$91,112
1
$282,360
9
$141,256
APPLICATIONS WITHDRAWN
1
$186,430
2
$457,835
8
$226,279
1
$173,590
2
$469,830
1
$829,040
FILES CLOSED FOR INCOMPLETENESS
0
$0
1
$235,260
2
$245,705
0
$0
0
$0
0
$0
Aggregated Statistics For Year 2007 (Based on 4 partial tracts)
A) FHA, FSA/RHS & VA Home Purchase Loans
B) Conventional Home Purchase Loans
C) Refinancings
D) Home Improvement Loans
E) Loans on Dwellings For 5+ Families
F) Non-occupant Loans on < 5 Family Dwellings (A B C & D)
G) Loans On Manufactured Home Dwelling (A B C & D)
Number
Average Value
Number
Average Value
Number
Average Value
Number
Average Value
Number
Average Value
Number
Average Value
Number
Average Value
LOANS ORIGINATED
3
$149,547
30
$188,866
41
$179,127
7
$58,143
1
$824,160
6
$149,557
8
$137,592
APPLICATIONS APPROVED, NOT ACCEPTED
1
$220,700
3
$182,487
11
$155,685
0
$0
0
$0
2
$161,240
3
$134,353
APPLICATIONS DENIED
1
$155,810
7
$184,461
32
$190,596
8
$66,655
0
$0
1
$144,870
8
$108,931
APPLICATIONS WITHDRAWN
0
$0
4
$157,865
7
$158,023
2
$138,800
0
$0
2
$104,090
2
$123,105
FILES CLOSED FOR INCOMPLETENESS
0
$0
0
$0
4
$207,942
1
$90,940
0
$0
0
$0
1
$90,940
Aggregated Statistics For Year 2006 (Based on 4 partial tracts)
A) FHA, FSA/RHS & VA Home Purchase Loans
B) Conventional Home Purchase Loans
C) Refinancings
D) Home Improvement Loans
F) Non-occupant Loans on < 5 Family Dwellings (A B C & D)
G) Loans On Manufactured Home Dwelling (A B C & D)
Number
Average Value
Number
Average Value
Number
Average Value
Number
Average Value
Number
Average Value
Number
Average Value
LOANS ORIGINATED
4
$140,830
41
$171,588
45
$158,796
6
$62,152
5
$166,438
12
$133,922
APPLICATIONS APPROVED, NOT ACCEPTED
1
$119,900
7
$120,786
11
$150,858
0
$0
2
$110,780
3
$115,097
APPLICATIONS DENIED
1
$77,300
5
$135,824
28
$182,578
10
$71,466
1
$328,060
5
$113,942
APPLICATIONS WITHDRAWN
0
$0
7
$206,411
19
$211,320
2
$64,220
1
$256,520
1
$133,410
FILES CLOSED FOR INCOMPLETENESS
0
$0
1
$139,670
6
$180,200
0
$0
0
$0
0
$0
Aggregated Statistics For Year 2005 (Based on 4 partial tracts)
A) FHA, FSA/RHS & VA Home Purchase Loans
B) Conventional Home Purchase Loans
C) Refinancings
D) Home Improvement Loans
E) Loans on Dwellings For 5+ Families
F) Non-occupant Loans on < 5 Family Dwellings (A B C & D)
G) Loans On Manufactured Home Dwelling (A B C & D)
Number
Average Value
Number
Average Value
Number
Average Value
Number
Average Value
Number
Average Value
Number
Average Value
Number
Average Value
LOANS ORIGINATED
4
$123,938
47
$147,854
52
$164,169
3
$70,853
1
$1,037,610
9
$119,947
7
$117,380
APPLICATIONS APPROVED, NOT ACCEPTED
0
$0
6
$133,557
10
$134,920
0
$0
0
$0
0
$0
3
$55,887
APPLICATIONS DENIED
0
$0
15
$142,990
46
$165,782
7
$100,877
0
$0
3
$165,953
16
$108,870
APPLICATIONS WITHDRAWN
1
$76,420
7
$154,153
27
$181,922
1
$158,580
0
$0
1
$265,100
2
$160,685
FILES CLOSED FOR INCOMPLETENESS
1
$99,810
2
$88,915
4
$154,972
1
$62,590
0
$0
0
$0
0
$0
Aggregated Statistics For Year 2004 (Based on 4 partial tracts)
A) FHA, FSA/RHS & VA Home Purchase Loans
B) Conventional Home Purchase Loans
C) Refinancings
D) Home Improvement Loans
E) Loans on Dwellings For 5+ Families
F) Non-occupant Loans on < 5 Family Dwellings (A B C & D)
G) Loans On Manufactured Home Dwelling (A B C & D)
Number
Average Value
Number
Average Value
Number
Average Value
Number
Average Value
Number
Average Value
Number
Average Value
Number
Average Value
LOANS ORIGINATED
3
$147,133
48
$124,656
40
$137,932
4
$80,190
1
$418,340
5
$113,920
7
$121,613
APPLICATIONS APPROVED, NOT ACCEPTED
0
$0
5
$183,766
8
$139,511
1
$41,760
0
$0
1
$118,250
2
$145,110
APPLICATIONS DENIED
1
$92,560
8
$95,746
33
$132,985
5
$106,238
0
$0
1
$60,950
10
$83,531
APPLICATIONS WITHDRAWN
0
$0
4
$126,078
21
$155,625
1
$80,590
0
$0
0
$0
1
$95,990
FILES CLOSED FOR INCOMPLETENESS
0
$0
1
$416,640
1
$70,490
0
$0
0
$0
0
$0
0
$0
Aggregated Statistics For Year 2003 (Based on 4 partial tracts)
A) FHA, FSA/RHS & VA Home Purchase Loans
B) Conventional Home Purchase Loans
C) Refinancings
D) Home Improvement Loans
F) Non-occupant Loans on < 5 Family Dwellings (A B C & D)
Number
Average Value
Number
Average Value
Number
Average Value
Number
Average Value
Number
Average Value
LOANS ORIGINATED
6
$129,180
30
$130,440
105
$125,329
2
$494,340
7
$106,816
APPLICATIONS APPROVED, NOT ACCEPTED
0
$0
3
$100,483
13
$139,375
1
$12,500
1
$70,820
APPLICATIONS DENIED
1
$143,620
7
$111,447
32
$148,408
2
$24,745
1
$147,320
APPLICATIONS WITHDRAWN
2
$97,665
4
$127,512
16
$143,672
1
$76,560
0
$0
FILES CLOSED FOR INCOMPLETENESS
0
$0
1
$116,610
3
$109,297
0
$0
0
$0
Aggregated Statistics For Year 2002 (Based on 2 partial tracts)
A) FHA, FSA/RHS & VA Home Purchase Loans
B) Conventional Home Purchase Loans
C) Refinancings
D) Home Improvement Loans
F) Non-occupant Loans on < 5 Family Dwellings (A B C & D)
Number
Average Value
Number
Average Value
Number
Average Value
Number
Average Value
Number
Average Value
LOANS ORIGINATED
0
$0
6
$119,363
12
$158,299
1
$2,270
1
$19,890
APPLICATIONS APPROVED, NOT ACCEPTED
0
$0
1
$35,240
3
$151,953
1
$2,270
0
$0
APPLICATIONS DENIED
1
$101,740
3
$278,137
10
$135,052
1
$56,840
0
$0
APPLICATIONS WITHDRAWN
0
$0
2
$176,490
7
$159,720
0
$0
0
$0
FILES CLOSED FOR INCOMPLETENESS
0
$0
1
$54,570
1
$81,850
0
$0
0
$0
Aggregated Statistics For Year 2001 (Based on 2 partial tracts)
A) FHA, FSA/RHS & VA Home Purchase Loans
B) Conventional Home Purchase Loans
C) Refinancings
D) Home Improvement Loans
F) Non-occupant Loans on < 5 Family Dwellings (A B C & D)
Number
Average Value
Number
Average Value
Number
Average Value
Number
Average Value
Number
Average Value
LOANS ORIGINATED
1
$93,220
7
$135,766
19
$136,566
2
$46,325
1
$31,830
APPLICATIONS APPROVED, NOT ACCEPTED
0
$0
0
$0
3
$79,387
0
$0
0
$0
APPLICATIONS DENIED
1
$69,910
2
$91,510
17
$180,517
1
$14,210
2
$79,010
APPLICATIONS WITHDRAWN
0
$0
1
$209,740
7
$83,880
0
$0
0
$0
FILES CLOSED FOR INCOMPLETENESS
0
$0
0
$0
2
$126,755
1
$28,420
0
$0
Aggregated Statistics For Year 2000 (Based on 2 partial tracts)
A) FHA, FSA/RHS & VA Home Purchase Loans
B) Conventional Home Purchase Loans
C) Refinancings
D) Home Improvement Loans
F) Non-occupant Loans on < 5 Family Dwellings (A B C & D)
Number
Average Value
Number
Average Value
Number
Average Value
Number
Average Value
Number
Average Value
LOANS ORIGINATED
0
$0
6
$116,333
6
$152,900
1
$21,030
2
$144,375
APPLICATIONS APPROVED, NOT ACCEPTED
0
$0
2
$102,880
4
$159,720
1
$14,210
0
$0
APPLICATIONS DENIED
0
$0
6
$114,153
16
$202,990
2
$13,925
2
$180,750
APPLICATIONS WITHDRAWN
1
$22,170
1
$72,760
5
$148,238
0
$0
0
$0
FILES CLOSED FOR INCOMPLETENESS
0
$0
0
$0
2
$233,895
0
$0
0
$0
Aggregated Statistics For Year 1999 (Based on 1 partial tract)
B) Conventional Home Purchase Loans
C) Refinancings
D) Home Improvement Loans
F) Non-occupant Loans on < 5 Family Dwellings (A B C & D)

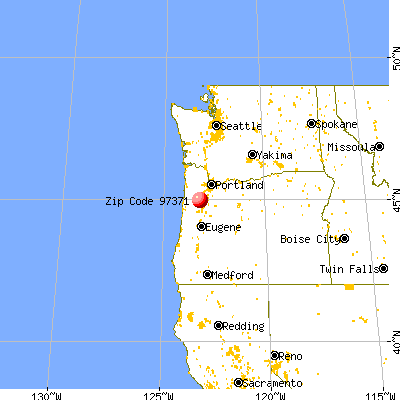


 Nearest zip codes: 97304, 97101, 97302, 97338, 97303, 97306.