Estimated zip code population in 2022: 894 Zip code population in 2010: 915 Zip code population in 2000: 850
Houses and condos: 701 Renter-occupied apartments: 167
% of renters here:
37%
State:
37%
March 2022 cost of living index in zip code 97413: 90.1 (less than average, U.S. average is 100)
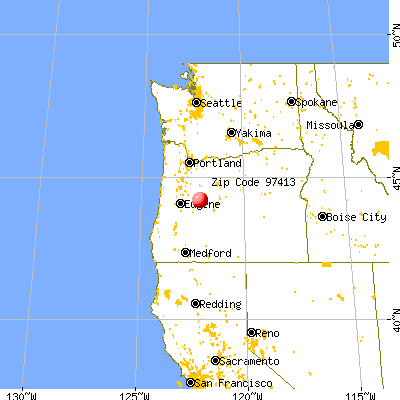
Land area: 539.2 sq. mi. Water area: 4.0 sq. mi.
Population density: 2 people per square mile
(very low).
OSM Map
General Map
Google Map
MSN Map
OSM Map
General Map
Google Map
MSN Map
OSM Map
General Map
Google Map
MSN Map
OSM Map
General Map
Google Map
MSN Map
Please wait while loading the map...
Real estate property taxes paid for housing units in 2022:
This zip code:
0.6% ($2,500)
Oregon:
0.8% ($3,646)
Median real estate property taxes paid for housing units with mortgages in 2022: $1,921 (0.6%) Median real estate property taxes paid for housing units with no mortgage in 2022: $2,979 (0.6%)
Business Search- 14 Million verified businesses
Males: 467
(52.3%)
Females: 426
(47.7%)
For population 25 years and over in 97413:
High school or higher: 93.9%
Bachelor's degree or higher: 34.4%
Graduate or professional degree: 10.0%
Unemployed: 5.6%
Mean travel time to work (commute): 33.7 minutes
For population 15 years and over in 97413:
Never married: 26.5%
Now married: 54.7%
Separated: 1.9%
Widowed: 6.3%
Divorced: 10.5%
Zip code 97413 compared to state average:
Black race population percentage significantly below state average.
Hispanic race population percentage significantly below state average.
Median age significantly above state average.
Foreign-born population percentage significantly below state average.
Number of college students significantly below state average.
Averages for the 2020 tax year for zip code 97413, filed in 2021:
Average Adjusted Gross Income (AGI) in 2020: $63,036 (Individual Income Tax Returns)
Here:
$63,036
State:
$76,001
Salary/wage: $40,825 (reported on 71.8% of returns)
Here:
$40,825
State:
$61,959
(% of AGI for various income ranges: 1113.8% for AGIs below $25k, 3015.7% for AGIs $25k-50k, 5658.0% for AGIs $50k-75k, 6503.3% for AGIs $75k-100k)
Taxable interest for individuals: $1,131 (reported on 41.0% of returns)
This zip code:
$1,131
Oregon:
$1,628
(% of AGI for various income ranges: 8.8% for AGIs below $25k, 28.6% for AGIs $25k-50k, 24.0% for AGIs $50k-75k)
Ordinary dividends: $4,729 (reported on 17.9% of returns)
Here:
$4,729
State:
$7,165
(% of AGI for various income ranges: 121.4% for AGIs $25k-50k, 820.0% for AGIs $75k-100k)
Net capital gain/loss in AGI: +$38,886 (reported on 17.9% of returns)
Here:
+$38,886
State:
+$23,403
(% of AGI for various income ranges: 31.4% for AGIs $25k-50k, 9000.0% for AGIs $75k-100k)
Profit/loss from business: +$6,443 (reported on 17.9% of returns)
Here:
+$6,443
State:
+$16,511
(% of AGI for various income ranges: 347.5% for AGIs below $25k, 346.0% for AGIs $50k-75k)
Taxable individual retirement arrangement distribution: $13,117 (reported on 15.4% of returns)
97413:
$13,117
Oregon:
$20,730
(% of AGI for various income ranges: 413.8% for AGIs below $25k, 912.0% for AGIs $50k-75k)
Total itemized deductions: $39,225 (reported on 10.3% of returns)
Here:
$39,225
State:
$31,050
(% of AGI for various income ranges: 5230.0% for AGIs $75k-100k)
Taxes paid: $7,067 (reported on 7.7% of returns)
97413:
$7,067
State:
$8,487
(% of AGI for various income ranges: 706.7% for AGIs $75k-100k)
Earned income credit: $1,529 (reported on 17.9% of returns)
Here:
$1,529
State:
$1,977
(% of AGI for various income ranges: 133.8% for AGIs below $25k)
Percentage of individuals using paid preparers for their 2020 taxes: 92.3%
Here:
92%
State:
93%
(% for various income ranges: 85.7% for AGIs below $25k, 90.0% for AGIs $25k-50k, 100.0% for AGIs $50k-75k, 100.0% for AGIs $75k-100k, 100.0% for AGIs $100k-200k)
Averages for the 2012 tax year for zip code 97413, filed in 2013:
Average Adjusted Gross Income (AGI) in 2012: $53,725 (Individual Income Tax Returns)
Here:
$53,725
State:
$57,845
Salary/wage: $35,666 (reported on 72.5% of returns)
Here:
$35,666
State:
$47,723
(% of AGI for various income ranges: 59.8% for AGIs below $25k, 58.6% for AGIs $25k-50k, 62.6% for AGIs $50k-75k, 51.0% for AGIs $75k-100k, 34.9% for AGIs $100k-200k)
Taxable interest for individuals: $1,000 (reported on 47.5% of returns)
This zip code:
$1,000
Oregon:
$1,848
(% of AGI for various income ranges: 1.0% for AGIs below $25k, 3.3% for AGIs $25k-50k, 0.6% for AGIs $50k-75k, 0.3% for AGIs $100k-200k)
Ordinary dividends: $3,367 (reported on 22.5% of returns)
Here:
$3,367
State:
$5,987
(% of AGI for various income ranges: 7.0% for AGIs below $25k, 2.6% for AGIs $50k-75k, 0.7% for AGIs $100k-200k)
Net capital gain/loss in AGI: +$5,075 (reported on 20.0% of returns)
Here:
+$5,075
State:
+$13,095
(% of AGI for various income ranges: 16.5% for AGIs $75k-100k)
Profit/loss from business: +$4,857 (reported on 17.5% of returns)
Here:
+$4,857
State:
+$13,871
Taxable individual retirement arrangement distribution: $16,283 (reported on 15.0% of returns)
97413:
$16,283
Oregon:
$16,036
Total itemized deductions: $20,888 (24% of AGI, reported on 40.0% of returns)
Here:
$20,888
State:
$24,430
Here:
24.4% of AGI
State:
23.2% of AGI
(% of AGI for various income ranges: 17.7% for AGIs below $25k, 13.5% for AGIs $25k-50k, 25.1% for AGIs $50k-75k, 16.4% for AGIs $100k-200k)
Charity contributions: $2,800 (reported on 27.5% of returns)
Here:
$2,800
State:
$3,648
(% of AGI for various income ranges: 2.5% for AGIs below $25k, 3.3% for AGIs $50k-75k, 1.4% for AGIs $100k-200k)
Taxes paid: $6,700 (reported on 37.5% of returns)
97413:
$6,700
State:
$10,269
(% of AGI for various income ranges: 2.4% for AGIs below $25k, 2.2% for AGIs $25k-50k, 6.8% for AGIs $50k-75k, 6.5% for AGIs $100k-200k)
Earned income credit: $1,712 (reported on 20.0% of returns)
Here:
$1,712
State:
$2,021
(% of AGI for various income ranges: 7.1% for AGIs below $25k)
Percentage of individuals using paid preparers for their 2012 taxes: 45.0%
Here:
45%
State:
47%
(% for various income ranges: 37.5% for AGIs below $25k, 40.0% for AGIs $25k-50k, 66.7% for AGIs $50k-75k, 80.0% for AGIs $100k-200k)
Averages for the 2004 tax year for zip code 97413, filed in 2005:
Average Adjusted Gross Income (AGI) in 2004: $38,310 (Individual Income Tax Returns)
Here:
$38,310
State:
$46,788
Salary/wage: $27,789 (reported on 73.0% of returns)
Here:
$27,789
State:
$39,788
(% of AGI for various income ranges: 82.8% for AGIs below $10k, 62.3% for AGIs $10k-25k, 68.5% for AGIs $25k-50k, 57.9% for AGIs $50k-75k, 49.0% for AGIs $75k-100k, 32.4% for AGIs over 100k)
Taxable interest for individuals: $1,597 (reported on 49.5% of returns)
This zip code:
$1,597
Oregon:
$2,126
(% of AGI for various income ranges: 9.1% for AGIs below $10k, 5.3% for AGIs $10k-25k, 1.4% for AGIs $25k-50k, 1.8% for AGIs $50k-75k, 1.5% for AGIs $75k-100k, 1.1% for AGIs over 100k)
Taxable dividends: $3,008 (reported on 25.5% of returns)
Here:
$3,008
State:
$3,427
(% of AGI for various income ranges: 2.1% for AGIs below $10k, 2.2% for AGIs $10k-25k, 2.9% for AGIs $25k-50k, 2.4% for AGIs $50k-75k, 1.8% for AGIs over 100k)
Net capital gain/loss: +$9,092 (reported on 21.0% of returns)
Here:
+$9,092
State:
+$12,447
(% of AGI for various income ranges: 4.8% for AGIs below $10k, -0.9% for AGIs $10k-25k, -0.6% for AGIs $25k-50k, 2.8% for AGIs $50k-75k, 15.2% for AGIs over 100k)
Profit/loss from business: +$5,662 (reported on 15.8% of returns)
Here:
+$5,662
State:
+$11,682
(% of AGI for various income ranges: 2.9% for AGIs below $10k, 10.2% for AGIs $10k-25k, 0.3% for AGIs $25k-50k, 1.7% for AGIs $50k-75k, 6.2% for AGIs $75k-100k)
Total itemized deductions: $18,756 (28% of AGI, reported on 36.0% of returns)
Here:
$18,756
State:
$20,209
Here:
27.5% of AGI
State:
24.7% of AGI
(% of AGI for various income ranges: 23.3% for AGIs $10k-25k, 16.5% for AGIs $25k-50k, 21.5% for AGIs $50k-75k, 17.5% for AGIs $75k-100k, 15.2% for AGIs over 100k)
Charity contributions deductions: $3,182 (4% of AGI, reported on 28.3% of returns)
Here:
$3,182
State:
$3,145
Here:
4.3% of AGI
State:
3.6% of AGI
(% of AGI for various income ranges: 2.1% for AGIs $10k-25k, 1.4% for AGIs $25k-50k, 3.2% for AGIs $50k-75k, 2.3% for AGIs $75k-100k, 2.8% for AGIs over 100k)
Total tax: $5,230 (reported on 69.8% of returns)
97413:
$5,230
State:
$7,148
(% of AGI for various income ranges: 1.2% for AGIs below $10k, 4.2% for AGIs $10k-25k, 6.5% for AGIs $25k-50k, 7.9% for AGIs $50k-75k, 10.9% for AGIs $75k-100k, 15.3% for AGIs over 100k)
Earned income credit: $1,302 (reported on 18.4% of returns)
Here:
$1,302
State:
$1,605
Percentage of individuals using paid preparers for their 2004 taxes: 42.2%
Here:
42%
State:
53%
(% for various income ranges: 32.8% for AGIs below $10k, 48.3% for AGIs $10k-25k, 39.1% for AGIs $25k-50k, 37.3% for AGIs $50k-75k, 52.0% for AGIs $75k-100k, 70.0% for AGIs over 100k)
Household received Food Stamps/SNAP in the past 12 months: 153 Household did not receive Food Stamps/SNAP in the past 12 months: 302
Women who did not have a birth in the past 12 months: 198 (55 now married, 145 unmarried)
Housing units in zip code 97413 with a mortgage: 117 (9 second mortgage, 10 both second mortgage and home equity loan) Median monthly owner costs for units with a mortgage: $1,675 Median monthly owner costs for units without a mortgage: $634
Residents with income below the poverty level in 2022:
This zip code:
15.6%
Whole state:
12.1%
Residents with income below 50% of the poverty level in 2022:
This zip code:
6.7%
Whole state:
6.2%
Median number of rooms in houses and condos:
Here:
6.3
State:
6.2
Median number of rooms in apartments:
Here:
4.1
State:
4.0
Notable locations in this zip code not listed on our city pages
Notable locations in zip code 97413: James Creek Shelter (A), Limberlost Recreation Site (B), Horse Lake Guard Station (C), Knobs Sheep Camp (D), Homestead Recreation Site (E), Ingram Camp (F), Horse Creek Group Camp (G), Box Canyon Horse Camp (H), Hamlin Boat Landing (I), Delta Recreation Site (J), Scott Lake Recreation Site (K), Hand Lake Shelter (L), Melakwa Boy Scout Camp (M), Roaring River Group Camp (N), Lakes End Recreation Site (O), Olallie Recreation Site (P), McKenzie Bridge Recreation Site (Q), Echo Campground (R), Ice Cap Creek Recreation Site (S), Mona Recreation Site (T). Display/hide their locations on the map
Lakes, reservoirs, and swamps: Glaze Lake (A), Nash Lake (B), Gnat Lake (C), Goose Lake (D), Hand Lake (E), Reese Lake (F), Irish Camp Lake (G), Island Lake (H). Display/hide their locations on the map
Streams, rivers, and creeks: Station Creek (A), Bull Creek (B), James Creek (C), West Lava Creek (D), Horse Creek (E), Honey Creek (F), Hinton Creek (G), Grasshopper Creek (H), Glacier Creek (I). Display/hide their locations on the map
Parks in zip code 97413 include: Blue River Community Park (1), McKenzie River Park (2), Forest Glen Landing County Park (3), Bronaugh Memorial Plaque (4), Montague Memorial Plaque (5), Prouty Memorial Plaque (6), H J Andrews Monument (7), Jennie B Harris County Park (8). Display/hide their locations on the map
Size of family households: 140 2-persons, 34 3-persons, 61 4-persons, 7 5-persons
Size of nonfamily households: 179 1-person, 30 2-persons
70 married couples with children.
23 single-parent households (4 men, 19 women).
100.2% of residents of 97413 zip code speak English at home.
0.4% of residents speak other Indo-European language at home (100% very well).
Foreign born population: 0 (0.0%)
:
0.0%
Whole state:
9.9%
28%English
21%American
17%Irish
4%British
4%German
3%Norwegian
2%Austrian
Facilities with environmental interests located in this zip code:
COUGAR DAM (S FORK MCKENZIE RIVER MILE 4.5 in BLUE RIVER, OR)
COMPLIANCE ACTIVITY (Tracking inspections of insecticide, fungicide, and rodenticide, and toxic substances)
DEXTER DAM (MIDDLE FORK WILLAMETTE RIVER MILE 18.0 in BLUE RIVER, OR)
COMPLIANCE ACTIVITY (Tracking inspections of insecticide, fungicide, and rodenticide, and toxic substances)
FORMER BLUE RIVER VENEER SAW MILL & POND (T16S R4E SEC29 in BLUE RIVER, OR)
SUPERFUND (Superfund database)
GREEN PETER DAM (MIDDLE SANTIAM RIVER MILE 5.5 in BLUE RIVER, OR)
COMPLIANCE ACTIVITY (Tracking inspections of insecticide, fungicide, and rodenticide, and toxic substances)
Housing units lacking complete plumbing facilities: 5.5% Housing units lacking complete kitchen facilities: 7.2%
52.7%Electricity
33.2%Wood
13.1%Bottled, tank, or LP gas
1.4%Utility gas
Population in 1990: 1,139.
Place of birth for U.S.-born residents:
This state: 302
Northeast: 54
Midwest: 100
South: 46
West: 391
64% of the 97413 zip code residents lived in the same house 5 years ago. Out of people who lived in different houses, 83% lived in this county. Out of people who lived in different counties, 50% lived in Oregon.
90% of the 97413 zip code residents lived in the same house 1 year ago. Out of people who lived in different houses, 82% moved from this county. Out of people who lived in different houses, 15% moved from different state.
Private vs. public school enrollment:
Students in private schools in grades 1 to 8 (elementary and middle school):
Here:
0.0%
Oregon:
13.7%
Students in private schools in grades 9 to 12 (high school):
Here:
0.0%
Oregon:
8.8%
Students in private undergraduate colleges:
Here:
0.0%
Oregon:
17.7%
Occupation by median earnings in the past 12 months ($)
82,485Management occupations
78,438Life, physical, and social science occupations
61,420Health diagnosing and treating practitioners and other technical occupations
52,368Office and administrative support occupations
34,898Education, training, and library occupations
30,881Healthcare support occupations
Companies with federal contracts located in this zip code:
HAMLIN & SON CONSTRUCTION INC (50389 MC KENZIE HWY in BLUE RIVER, OR; small business) 4 employees, $800000 revenue.
-$1,000 with Forest Service (disused code: now 12C2) for Other Natural Resources and Conservation Services. Signed on 1999-11-15. Completion date: 1999-12-15.
Top industries in this zip code by the number of employees in 2005:
Accommodation and Food Services: Hotels (except Casino Hotels) and Motels (20-49 employees: 1 establishment, 1-4 employees: 4 establishments)
Accommodation and Food Services: Limited-Service Restaurants (10-19: 1, 1-4: 1)
Arts, Entertainment, and Recreation: Golf Courses and Country Clubs (10-19: 1)
Construction: Highway, Street, and Bridge Construction (5-9: 1)
Health Care and Social Assistance: All Other Outpatient Care Centers (5-9: 1)
Other Services (except Public Administration): Religious Organizations (1-4: 3)
Construction: Site Preparation Contractors (1-4: 1)
People in group quarters in 2000:
2 people in religious group quarters
Fatal accident statistics in 2014:
Fatal accident count: 1
Vehicles involved in fatal accidents: 2
Fatal accidents caused by drunken drivers: 0
Fatalities: 1
Persons involved in fatal accidents: 2
Pedestrians involved in fatal accidents: 0
Fatal accident statistics in 2012:
Fatal accident count: 1
Vehicles involved in fatal accidents: 1
Fatal accidents caused by drunken drivers: 0
Fatalities: 1
Persons involved in fatal accidents: 2
Pedestrians involved in fatal accidents: 0
Home Mortgage Disclosure Act Aggregated Statistics For Year 2009 (Based on 2 partial tracts)
A) FHA, FSA/RHS & VA Home Purchase Loans
B) Conventional Home Purchase Loans
C) Refinancings
D) Home Improvement Loans
F) Non-occupant Loans on < 5 Family Dwellings (A B C & D)
G) Loans On Manufactured Home Dwelling (A B C & D)
Number
Average Value
Number
Average Value
Number
Average Value
Number
Average Value
Number
Average Value
Number
Average Value
LOANS ORIGINATED
7
$199,836
24
$289,731
214
$255,827
6
$157,172
29
$261,670
16
$172,894
APPLICATIONS APPROVED, NOT ACCEPTED
1
$227,910
5
$285,352
22
$300,795
1
$232,560
6
$359,305
0
$0
APPLICATIONS DENIED
3
$219,380
13
$322,722
72
$266,846
8
$171,368
10
$320,119
8
$137,356
APPLICATIONS WITHDRAWN
3
$227,520
6
$270,157
42
$251,608
0
$0
7
$222,427
2
$223,260
FILES CLOSED FOR INCOMPLETENESS
0
$0
3
$277,910
8
$148,839
0
$0
2
$187,790
1
$203,490
Aggregated Statistics For Year 2008 (Based on 2 partial tracts)
A) FHA, FSA/RHS & VA Home Purchase Loans
B) Conventional Home Purchase Loans
C) Refinancings
D) Home Improvement Loans
E) Loans on Dwellings For 5+ Families
F) Non-occupant Loans on < 5 Family Dwellings (A B C & D)
G) Loans On Manufactured Home Dwelling (A B C & D)
Number
Average Value
Number
Average Value
Number
Average Value
Number
Average Value
Number
Average Value
Number
Average Value
Number
Average Value
LOANS ORIGINATED
5
$225,584
23
$266,534
109
$274,186
13
$93,739
1
$951,170
16
$243,461
6
$206,010
APPLICATIONS APPROVED, NOT ACCEPTED
1
$374,420
7
$310,136
15
$288,839
1
$325,580
0
$0
5
$222,094
1
$29,070
APPLICATIONS DENIED
5
$142,326
14
$205,151
63
$292,878
7
$154,984
0
$0
12
$230,041
10
$148,838
APPLICATIONS WITHDRAWN
0
$0
30
$230,700
31
$258,742
3
$257,753
0
$0
7
$199,670
6
$147,288
FILES CLOSED FOR INCOMPLETENESS
0
$0
5
$348,840
5
$225,118
0
$0
0
$0
1
$248,840
0
$0
Aggregated Statistics For Year 2007 (Based on 2 partial tracts)
A) FHA, FSA/RHS & VA Home Purchase Loans
B) Conventional Home Purchase Loans
C) Refinancings
D) Home Improvement Loans
E) Loans on Dwellings For 5+ Families
F) Non-occupant Loans on < 5 Family Dwellings (A B C & D)
G) Loans On Manufactured Home Dwelling (A B C & D)
Number
Average Value
Number
Average Value
Number
Average Value
Number
Average Value
Number
Average Value
Number
Average Value
Number
Average Value
LOANS ORIGINATED
1
$259,300
59
$285,458
149
$242,346
17
$134,885
0
$0
31
$263,093
16
$174,420
APPLICATIONS APPROVED, NOT ACCEPTED
0
$0
20
$230,757
29
$229,873
5
$170,466
0
$0
6
$343,995
3
$165,117
APPLICATIONS DENIED
1
$205,820
27
$261,931
57
$224,114
17
$74,351
0
$0
6
$216,280
6
$93,993
APPLICATIONS WITHDRAWN
0
$0
6
$231,397
28
$188,332
2
$36,045
1
$239,540
1
$167,440
3
$138,760
FILES CLOSED FOR INCOMPLETENESS
0
$0
0
$0
13
$228,625
1
$26,740
0
$0
1
$248,840
0
$0
Aggregated Statistics For Year 2006 (Based on 2 partial tracts)
A) FHA, FSA/RHS & VA Home Purchase Loans
B) Conventional Home Purchase Loans
C) Refinancings
D) Home Improvement Loans
F) Non-occupant Loans on < 5 Family Dwellings (A B C & D)
G) Loans On Manufactured Home Dwelling (A B C & D)
Number
Average Value
Number
Average Value
Number
Average Value
Number
Average Value
Number
Average Value
Number
Average Value
LOANS ORIGINATED
3
$268,993
133
$214,917
140
$191,820
16
$106,978
48
$206,155
21
$144,520
APPLICATIONS APPROVED, NOT ACCEPTED
0
$0
31
$205,028
24
$215,990
2
$326,165
9
$175,712
7
$111,794
APPLICATIONS DENIED
1
$222,090
26
$304,877
55
$183,215
16
$153,344
12
$415,508
16
$139,028
APPLICATIONS WITHDRAWN
1
$238,370
21
$227,577
29
$216,000
3
$34,497
6
$376,553
5
$65,814
FILES CLOSED FOR INCOMPLETENESS
0
$0
5
$129,536
14
$197,261
2
$175,585
2
$224,420
2
$212,790
Aggregated Statistics For Year 2005 (Based on 2 partial tracts)
A) FHA, FSA/RHS & VA Home Purchase Loans
B) Conventional Home Purchase Loans
C) Refinancings
D) Home Improvement Loans
F) Non-occupant Loans on < 5 Family Dwellings (A B C & D)
G) Loans On Manufactured Home Dwelling (A B C & D)
Number
Average Value
Number
Average Value
Number
Average Value
Number
Average Value
Number
Average Value
Number
Average Value
LOANS ORIGINATED
2
$143,605
135
$206,866
155
$183,947
24
$140,408
44
$214,933
24
$134,012
APPLICATIONS APPROVED, NOT ACCEPTED
2
$178,490
22
$196,038
20
$256,804
1
$59,300
5
$149,304
5
$152,792
APPLICATIONS DENIED
0
$0
31
$228,134
60
$170,331
14
$80,067
14
$236,879
16
$161,774
APPLICATIONS WITHDRAWN
0
$0
19
$206,489
50
$178,722
7
$182,891
6
$244,575
9
$176,229
FILES CLOSED FOR INCOMPLETENESS
0
$0
6
$145,157
12
$158,625
0
$0
0
$0
0
$0
Aggregated Statistics For Year 2004 (Based on 2 partial tracts)
A) FHA, FSA/RHS & VA Home Purchase Loans
B) Conventional Home Purchase Loans
C) Refinancings
D) Home Improvement Loans
F) Non-occupant Loans on < 5 Family Dwellings (A B C & D)
G) Loans On Manufactured Home Dwelling (A B C & D)
Number
Average Value
Number
Average Value
Number
Average Value
Number
Average Value
Number
Average Value
Number
Average Value
LOANS ORIGINATED
6
$131,397
158
$181,816
205
$174,482
10
$144,652
49
$160,514
28
$119,311
APPLICATIONS APPROVED, NOT ACCEPTED
0
$0
20
$141,571
31
$191,899
3
$79,847
9
$172,611
7
$114,453
APPLICATIONS DENIED
1
$116,280
24
$137,356
76
$181,688
10
$92,443
5
$90,698
14
$108,057
APPLICATIONS WITHDRAWN
1
$134,880
21
$159,802
51
$170,430
6
$21,318
8
$166,571
7
$108,473
FILES CLOSED FOR INCOMPLETENESS
1
$148,840
3
$264,343
12
$273,258
0
$0
1
$133,720
2
$141,280
Aggregated Statistics For Year 2003 (Based on 2 partial tracts)
A) FHA, FSA/RHS & VA Home Purchase Loans
B) Conventional Home Purchase Loans
C) Refinancings
D) Home Improvement Loans
F) Non-occupant Loans on < 5 Family Dwellings (A B C & D)
Number
Average Value
Number
Average Value
Number
Average Value
Number
Average Value
Number
Average Value
LOANS ORIGINATED
5
$143,722
99
$152,714
423
$166,550
8
$46,076
51
$152,053
APPLICATIONS APPROVED, NOT ACCEPTED
0
$0
12
$88,179
56
$151,891
1
$63,950
6
$81,008
APPLICATIONS DENIED
0
$0
15
$114,419
115
$170,659
8
$78,052
14
$148,423
APPLICATIONS WITHDRAWN
2
$147,675
19
$280,602
81
$171,822
3
$20,930
6
$170,350
FILES CLOSED FOR INCOMPLETENESS
1
$172,090
8
$179,362
49
$159,802
0
$0
3
$126,747
Aggregated Statistics For Year 2002 (Based on 2 partial tracts)
A) FHA, FSA/RHS & VA Home Purchase Loans
B) Conventional Home Purchase Loans
C) Refinancings
D) Home Improvement Loans
F) Non-occupant Loans on < 5 Family Dwellings (A B C & D)
Number
Average Value
Number
Average Value
Number
Average Value
Number
Average Value
Number
Average Value
LOANS ORIGINATED
3
$152,327
86
$144,214
266
$162,447
9
$39,406
31
$139,461
APPLICATIONS APPROVED, NOT ACCEPTED
0
$0
8
$104,070
31
$209,116
2
$25,000
5
$69,768
APPLICATIONS DENIED
0
$0
19
$159,120
78
$169,992
8
$21,221
9
$114,083
APPLICATIONS WITHDRAWN
1
$91,860
2
$67,440
37
$190,951
9
$39,019
2
$150,585
FILES CLOSED FOR INCOMPLETENESS
0
$0
6
$161,823
16
$165,844
0
$0
1
$125,580
Aggregated Statistics For Year 2001 (Based on 2 partial tracts)
A) FHA, FSA/RHS & VA Home Purchase Loans
B) Conventional Home Purchase Loans
C) Refinancings
D) Home Improvement Loans
F) Non-occupant Loans on < 5 Family Dwellings (A B C & D)
Number
Average Value
Number
Average Value
Number
Average Value
Number
Average Value
Number
Average Value
LOANS ORIGINATED
1
$148,840
78
$158,469
198
$161,018
8
$31,541
21
$150,444
APPLICATIONS APPROVED, NOT ACCEPTED
1
$159,300
14
$70,681
21
$133,667
6
$55,620
2
$78,490
APPLICATIONS DENIED
1
$160,470
21
$409,970
62
$201,765
8
$36,482
6
$107,365
APPLICATIONS WITHDRAWN
1
$159,300
7
$117,110
45
$188,167
2
$30,815
6
$123,063
FILES CLOSED FOR INCOMPLETENESS
1
$159,300
3
$318,220
5
$133,024
0
$0
0
$0
Aggregated Statistics For Year 2000 (Based on 2 partial tracts)
A) FHA, FSA/RHS & VA Home Purchase Loans
B) Conventional Home Purchase Loans
C) Refinancings
D) Home Improvement Loans
F) Non-occupant Loans on < 5 Family Dwellings (A B C & D)
Number
Average Value
Number
Average Value
Number
Average Value
Number
Average Value
Number
Average Value
LOANS ORIGINATED
2
$109,305
72
$156,332
90
$132,998
12
$19,186
23
$137,109
APPLICATIONS APPROVED, NOT ACCEPTED
1
$63,950
33
$133,581
38
$136,874
6
$16,667
5
$99,768
APPLICATIONS DENIED
1
$56,980
84
$63,539
64
$119,859
7
$58,473
5
$84,186
APPLICATIONS WITHDRAWN
1
$143,020
23
$121,690
33
$94,610
3
$70,930
2
$212,210
FILES CLOSED FOR INCOMPLETENESS
0
$0
1
$97,680
14
$188,540
0
$0
1
$136,050
Aggregated Statistics For Year 1999 (Based on 1 partial tract)
A) FHA, FSA/RHS & VA Home Purchase Loans
B) Conventional Home Purchase Loans
C) Refinancings
D) Home Improvement Loans
F) Non-occupant Loans on < 5 Family Dwellings (A B C & D)
Detailed PMIC statistics for the following Tracts:0001.00
2002 - 2018 National Fire Incident Reporting System (NFIRS) incidents
According to the data from the years 2002 - 2018 the average number of fires per year is 9. The highest number of reported fire incidents - 23 took place in 2003, and the least - 0 in 2007. The data has a dropping trend.
When looking into fire subcategories, the most reports belonged to: Outside Fires (43.6%), and Structure Fires (29.5%).
Fire incident types reported to NFIRS in Zip Code 97413


 Nearest zip codes: 97488, 97759, 97329, 97463, 97350, 97489.


 According to the data from the years 2002 - 2018 the average number of fires per year is 9. The highest number of reported fire incidents - 23 took place in 2003, and the least - 0 in 2007. The data has a dropping trend.
 When looking into fire subcategories, the most reports belonged to: Outside Fires (43.6%), and Structure Fires (29.5%).