Estimated zip code population in 2022: 1,299 Zip code population in 2010: 1,191 Zip code population in 2000: 1,579
Houses and condos: 496 Renter-occupied apartments: 71
% of renters here:
15%
State:
37%
March 2022 cost of living index in zip code 97438: 90.9 (less than average, U.S. average is 100)
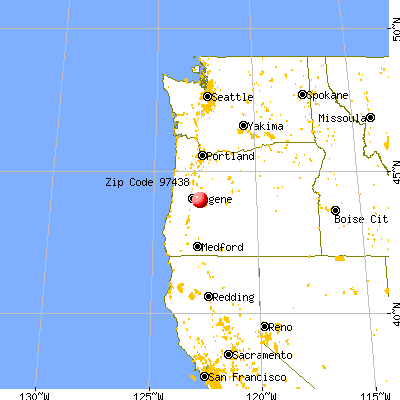
Land area: 103.9 sq. mi. Water area: 3.0 sq. mi.
Population density: 13 people per square mile
(very low).
OSM Map
General Map
Google Map
MSN Map
OSM Map
General Map
Google Map
MSN Map
OSM Map
General Map
Google Map
MSN Map
OSM Map
General Map
Google Map
MSN Map
Please wait while loading the map...
Real estate property taxes paid for housing units in 2022:
This zip code:
0.6% ($2,752)
Oregon:
0.8% ($3,646)
Median real estate property taxes paid for housing units with mortgages in 2022: $2,897 (0.6%) Median real estate property taxes paid for housing units with no mortgage in 2022: $2,442 (0.7%)
Business Search- 14 Million verified businesses
Males: 653
(50.3%)
Females: 645
(49.7%)
For population 25 years and over in 97438:
High school or higher: 91.8%
Bachelor's degree or higher: 17.5%
Graduate or professional degree: 5.6%
Mean travel time to work (commute): 27.2 minutes
For population 15 years and over in 97438:
Never married: 21.1%
Now married: 58.7%
Separated: 0.5%
Widowed: 4.1%
Divorced: 15.6%
Zip code 97438 compared to state average:
Unemployed percentage significantly below state average.
Black race population percentage significantly below state average.
Hispanic race population percentage significantly below state average.
Median age significantly above state average.
Foreign-born population percentage significantly below state average.
Renting percentage significantly below state average.
Length of stay since moving in significantly above state average.
Number of rooms per house above state average.
Number of college students significantly below state average.
Percentage of population with a bachelor's degree or higher below state average.
Estimated median house/condo value in 2022: $476,836
97438:
$476,836
Oregon:
$475,600
Median resident age:
This zip code:
48.5 years
Oregon median age:
40.5 years
Average household size:
This zip code:
2.7 people
Oregon:
2.4 people
Averages for the 2020 tax year for zip code 97438, filed in 2021:
Average Adjusted Gross Income (AGI) in 2020: $59,806 (Individual Income Tax Returns)
Here:
$59,806
State:
$76,001
Salary/wage: $47,944 (reported on 76.5% of returns)
Here:
$47,944
State:
$61,959
(% of AGI for various income ranges: 1081.8% for AGIs below $25k, 3425.6% for AGIs $25k-50k, 5476.0% for AGIs $50k-75k, 10916.7% for AGIs $75k-100k, 21030.0% for AGIs $100k-200k)
Taxable interest for individuals: $905 (reported on 39.2% of returns)
This zip code:
$905
Oregon:
$1,628
(% of AGI for various income ranges: 11.8% for AGIs below $25k, 34.4% for AGIs $25k-50k, 32.0% for AGIs $50k-75k, 20.0% for AGIs $75k-100k, 287.5% for AGIs $100k-200k)
Ordinary dividends: $1,429 (reported on 13.7% of returns)
Here:
$1,429
State:
$7,165
(% of AGI for various income ranges: 20.9% for AGIs below $25k, 54.0% for AGIs $50k-75k, 125.0% for AGIs $100k-200k)
Net capital gain/loss in AGI: +$14,212 (reported on 15.7% of returns)
Here:
+$14,212
State:
+$23,403
(% of AGI for various income ranges: 144.4% for AGIs $25k-50k, 2517.5% for AGIs $100k-200k)
Profit/loss from business: +$2,825 (reported on 15.7% of returns)
Here:
+$2,825
State:
+$16,511
(% of AGI for various income ranges: 125.5% for AGIs below $25k, 176.0% for AGIs $50k-75k)
Taxable individual retirement arrangement distribution: $19,300 (reported on 9.8% of returns)
97438:
$19,300
Oregon:
$20,730
(% of AGI for various income ranges: 377.8% for AGIs $25k-50k, 2083.3% for AGIs $75k-100k)
Total itemized deductions: $36,440 (reported on 9.8% of returns)
Here:
$36,440
State:
$31,050
(% of AGI for various income ranges: 1220.0% for AGIs $50k-75k, 3030.0% for AGIs $100k-200k)
Charity contributions: $3,925 (reported on 7.8% of returns)
Here:
$3,925
State:
$8,791
(% of AGI for various income ranges: 392.5% for AGIs $100k-200k)
Taxes paid: $8,200 (reported on 9.8% of returns)
97438:
$8,200
State:
$8,487
(% of AGI for various income ranges: 154.4% for AGIs $25k-50k, 677.5% for AGIs $100k-200k)
Earned income credit: $2,000 (reported on 15.7% of returns)
Here:
$2,000
State:
$1,977
(% of AGI for various income ranges: 79.1% for AGIs below $25k, 81.1% for AGIs $25k-50k)
Percentage of individuals using paid preparers for their 2020 taxes: 94.1%
Here:
94%
State:
93%
(% for various income ranges: 88.2% for AGIs below $25k, 100.0% for AGIs $25k-50k, 100.0% for AGIs $50k-75k, 100.0% for AGIs $75k-100k, 88.9% for AGIs $100k-200k)
Averages for the 2012 tax year for zip code 97438, filed in 2013:
Average Adjusted Gross Income (AGI) in 2012: $54,879 (Individual Income Tax Returns)
Here:
$54,879
State:
$57,845
Salary/wage: $44,888 (reported on 75.0% of returns)
Here:
$44,888
State:
$47,723
(% of AGI for various income ranges: 60.8% for AGIs below $25k, 72.3% for AGIs $25k-50k, 76.3% for AGIs $50k-75k, 62.3% for AGIs $75k-100k, 49.9% for AGIs $100k-200k)
Taxable interest for individuals: $1,290 (reported on 37.5% of returns)
This zip code:
$1,290
Oregon:
$1,848
(% of AGI for various income ranges: 1.2% for AGIs below $25k, 0.4% for AGIs $25k-50k, 0.3% for AGIs $50k-75k, 0.5% for AGIs $75k-100k, 1.4% for AGIs $100k-200k)
Ordinary dividends: $2,370 (reported on 17.9% of returns)
Here:
$2,370
State:
$5,987
(% of AGI for various income ranges: 2.1% for AGIs below $25k, 0.6% for AGIs $50k-75k, 1.2% for AGIs $75k-100k, 0.7% for AGIs $100k-200k)
Net capital gain/loss in AGI: +$26,643 (reported on 12.5% of returns)
Here:
+$26,643
State:
+$13,095
(% of AGI for various income ranges: 0.7% for AGIs below $25k, 1.1% for AGIs $50k-75k, 14.4% for AGIs $100k-200k)
Profit/loss from business: +$3,860 (reported on 17.9% of returns)
Here:
+$3,860
State:
+$13,871
(% of AGI for various income ranges: 14.9% for AGIs below $25k, 0.6% for AGIs $50k-75k)
Taxable individual retirement arrangement distribution: $12,557 (reported on 12.5% of returns)
97438:
$12,557
Oregon:
$16,036
Total itemized deductions: $22,714 (24% of AGI, reported on 39.3% of returns)
Here:
$22,714
State:
$24,430
Here:
23.9% of AGI
State:
23.2% of AGI
(% of AGI for various income ranges: 22.3% for AGIs $25k-50k, 13.2% for AGIs $50k-75k, 20.2% for AGIs $75k-100k, 16.8% for AGIs $100k-200k)
Charity contributions: $3,771 (reported on 30.4% of returns)
Here:
$3,771
State:
$3,648
(% of AGI for various income ranges: 2.2% for AGIs $25k-50k, 1.9% for AGIs $50k-75k, 2.2% for AGIs $75k-100k, 2.5% for AGIs $100k-200k)
Taxes paid: $7,900 (reported on 39.3% of returns)
97438:
$7,900
State:
$10,269
(% of AGI for various income ranges: 4.4% for AGIs $25k-50k, 4.4% for AGIs $50k-75k, 7.3% for AGIs $75k-100k, 7.1% for AGIs $100k-200k)
Earned income credit: $1,550 (reported on 17.9% of returns)
Here:
$1,550
State:
$2,021
(% of AGI for various income ranges: 4.7% for AGIs below $25k, 0.9% for AGIs $25k-50k)
Percentage of individuals using paid preparers for their 2012 taxes: 48.2%
Here:
48%
State:
47%
(% for various income ranges: 40.0% for AGIs below $25k, 46.2% for AGIs $25k-50k, 50.0% for AGIs $50k-75k, 66.7% for AGIs $75k-100k, 57.1% for AGIs $100k-200k)
Averages for the 2004 tax year for zip code 97438, filed in 2005:
Average Adjusted Gross Income (AGI) in 2004: $46,279 (Individual Income Tax Returns)
Here:
$46,279
State:
$46,788
Salary/wage: $37,079 (reported on 83.9% of returns)
Here:
$37,079
State:
$39,788
(% of AGI for various income ranges: 136.0% for AGIs below $10k, 74.8% for AGIs $10k-25k, 83.2% for AGIs $25k-50k, 80.1% for AGIs $50k-75k, 85.1% for AGIs $75k-100k, 37.7% for AGIs over 100k)
Taxable interest for individuals: $1,247 (reported on 43.8% of returns)
This zip code:
$1,247
Oregon:
$2,126
(% of AGI for various income ranges: 12.0% for AGIs below $10k, 2.5% for AGIs $10k-25k, 0.8% for AGIs $25k-50k, 0.6% for AGIs $50k-75k, 0.2% for AGIs $75k-100k, 1.5% for AGIs over 100k)
Taxable dividends: $1,434 (reported on 17.9% of returns)
Here:
$1,434
State:
$3,427
(% of AGI for various income ranges: 2.4% for AGIs below $10k, 0.8% for AGIs $10k-25k, 0.5% for AGIs $25k-50k, 0.4% for AGIs $50k-75k, 0.4% for AGIs $75k-100k, 0.6% for AGIs over 100k)
Net capital gain/loss: +$17,854 (reported on 17.4% of returns)
Here:
+$17,854
State:
+$12,447
(% of AGI for various income ranges: -2.7% for AGIs below $10k, 0.4% for AGIs $10k-25k, 0.9% for AGIs $25k-50k, 0.5% for AGIs $50k-75k, 8.2% for AGIs $75k-100k, 15.4% for AGIs over 100k)
Profit/loss from business: +$4,113 (reported on 16.4% of returns)
Here:
+$4,113
State:
+$11,682
(% of AGI for various income ranges: -5.1% for AGIs below $10k, 4.7% for AGIs $10k-25k, 1.5% for AGIs $25k-50k, 2.3% for AGIs $50k-75k, 1.0% for AGIs over 100k)
IRA payment deduction: $3,400 (reported on 2.5% of returns)
97438:
$3,400
Oregon:
$3,035
Total itemized deductions: $18,764 (23% of AGI, reported on 42.3% of returns)
Here:
$18,764
State:
$20,209
Here:
22.7% of AGI
State:
24.7% of AGI
(% of AGI for various income ranges: 18.2% for AGIs $10k-25k, 18.0% for AGIs $25k-50k, 20.7% for AGIs $50k-75k, 21.8% for AGIs $75k-100k, 12.7% for AGIs over 100k)
Charity contributions deductions: $2,385 (3% of AGI, reported on 36.0% of returns)
Here:
$2,385
State:
$3,145
Here:
2.7% of AGI
State:
3.6% of AGI
(% of AGI for various income ranges: 2.6% for AGIs $10k-25k, 2.1% for AGIs $25k-50k, 2.5% for AGIs $50k-75k, 2.5% for AGIs $75k-100k, 0.9% for AGIs over 100k)
Total tax: $5,277 (reported on 75.6% of returns)
97438:
$5,277
State:
$7,148
(% of AGI for various income ranges: 3.6% for AGIs below $10k, 4.2% for AGIs $10k-25k, 6.0% for AGIs $25k-50k, 7.6% for AGIs $50k-75k, 9.2% for AGIs $75k-100k, 11.8% for AGIs over 100k)
Earned income credit: $1,500 (reported on 11.2% of returns)
Here:
$1,500
State:
$1,605
Percentage of individuals using paid preparers for their 2004 taxes: 47.0%
Here:
47%
State:
53%
(% for various income ranges: 37.3% for AGIs below $10k, 37.0% for AGIs $10k-25k, 46.5% for AGIs $25k-50k, 55.9% for AGIs $50k-75k, 65.2% for AGIs $75k-100k, 71.1% for AGIs over 100k)
Household received Food Stamps/SNAP in the past 12 months: 79 Household did not receive Food Stamps/SNAP in the past 12 months: 396
Women who had a birth in the past 12 months: 2 (2 now married, 0 unmarried) Women who did not have a birth in the past 12 months: 228 (114 now married, 113 unmarried)
Housing units in zip code 97438 with a mortgage: 244 (22 second mortgage, 24 both second mortgage and home equity loan) Median monthly owner costs for units with a mortgage: $1,941 Median monthly owner costs for units without a mortgage: $456
Residents with income below the poverty level in 2022:
This zip code:
6.1%
Whole state:
12.1%
Residents with income below 50% of the poverty level in 2022:
This zip code:
0.5%
Whole state:
6.2%
Median number of rooms in houses and condos:
Here:
6.6
State:
6.2
Median number of rooms in apartments:
Here:
6.4
State:
4.0
Notable locations in this zip code not listed on our city pages
Notable locations in zip code 97438: North Shore Recreation Site (A), Fall Creek Station (B), Pengra (C), Little Fall Creek Picnic Area (D), Upper End Campground (E), Sky Camp (F), Pengra Access Boat Ramp (G), North Shore Boat Ramp Fall Creek Reservoir (H), Cascara Campground Boat Ramp (I), Winberry Day Use Area Boat Ramp (J), Lowell Volunteer Fire Protection District Station 2 (K). Display/hide their locations on the map
Creeks: Timber Creek (A), Murphy Creek (B), Hyde Creek (C), Small Creek (D), Nelson Creek (E), Andy Creek (F), North Fork Fall Creek (G), Norton Creek (H), Bannister Creek (I). Display/hide their locations on the map
Parks in zip code 97438 include: Fall Creek Reservoir State Park (1), Landax Landing Park (2), Fall Creek County Park (3), Lowell State Park (4). Display/hide their locations on the map
In group quarters: 23 (-1 institutionalized population)
Size of family households: 136 2-persons, 103 3-persons, 52 4-persons, 42 5-persons, 6 6-persons, 2 7-or-more-persons
Size of nonfamily households: 88 1-person, 38 2-persons
197 married couples with children.
27 single-parent households (5 men, 22 women).
98.1% of residents of 97438 zip code speak English at home.
0.9% of residents speak Spanish at home (91% very well, 9% not well).
0.3% of residents speak Asian or Pacific Island language at home (100% very well).
Foreign born population: 17 (1.3%) (93.9% of them are naturalized citizens)
This zip code:
1.3%
Whole state:
9.9%
35%Sweden
35%United Kingdom, excluding England and Scotland
12%Romania
12%Honduras
24%German
15%Swedish
9%American
7%English
3%French Canadian
3%Scotch-Irish
2%European
Year of entry for the foreign-born population
02010 or later
42000 to 2009
01990 to 1999
11Before 1990
Private high school in in this zip code not listed on the city page:
Facilities with environmental interests located in this zip code:
CASCADE PACIFIC INDUSTRIES INCORPORATED (37385 JASPER-LOWELL ROAD in JASPER, OR)
STATE MASTER (Oregon inspections and permits database) - OR-ECSI-56, SUPERFUND, OR-SIS-100097-101427, NPDES NON-MAJOR, OR-SIS-100097-102267, ONSITE WASTEWATER TREATMENT, OR-SIS-100097-11030, OR-HWMS-5445, SQG, OR-SIS-100097-100134, ONSITE WASTEWATER TREATMENT, OR-SIS-100097-101010, National Pollutant Discharge Elimination System NON-MAJOR (Tracking pollutant discharge elimination systems) - permit National Pollutant Discharge Elimination System NON-MAJOR (Tracking pollutant discharge elimination systems) - permit HAZARDOUS WASTE BIENNIAL REPORTER (Resource Conservation and Recovery Act (tracking hazardous waste)) (Resource Conservation and Recovery Act (tracking hazardous waste)) TRI REPORTER (Tracking of toxic chemicals releasing facilities) Business SIC classification: SAWMILLS AND PLANING MILLS, GENERAL; WOOD PRESERVING; TERMINAL AND JOINT TERMINAL MAINTENANCE FACILITIES FOR MOTOR FREIGHT TRANSPORTATION Business NAICS classification: SAWMILLS.; WOOD PRESERVATION.; WOOD PRESERVATION.; CUT STOCK, RESAWING LUMBER, AND PLANING.; OTHER MILLWORK (INCLUDING FLOORING ).; ALL OTHER MISCELLANEOUS WOOD PRODUCT MANUFACTURING. Organizations: CASCADE PACIFIC INDUST INC (CONTACT/OWNER)
, PATRICIA THOMPSON (CONTACT/OWNER)
, JASPER WOOD PRODUCTS, LLC (CONTACT/OWNER)
Alternative names: JASPER WOOD PRODUCTS, LLC
FALL CREEK STORAGE FOR DISPOSAL FACILITY (FALL CREEK STREAM MILE 2.5 in FALL CREEK, OR)
COMPLIANCE ACTIVITY (Tracking inspections of insecticide, fungicide, and rodenticide, and toxic substances)
Housing units lacking complete plumbing facilities: 2.7% Housing units lacking complete kitchen facilities: 3.0%
57.0%Electricity
39.2%Wood
1.7%Other fuel
1.3%Bottled, tank, or LP gas
1.1%No fuel used
Population in 1990: 1,581.
Place of birth for U.S.-born residents:
This state: 702
Midwest: 111
South: 96
West: 368
57% of the 97438 zip code residents lived in the same house 5 years ago. Out of people who lived in different houses, 69% lived in this county. Out of people who lived in different counties, 50% lived in Oregon.
94% of the 97438 zip code residents lived in the same house 1 year ago. Out of people who lived in different houses, 50% moved from this county. Out of people who lived in different houses, 35% moved from different county within same state. Out of people who lived in different houses, 19% moved from different state.
Private vs. public school enrollment:
Students in private schools in grades 1 to 8 (elementary and middle school): 5
Here:
5.3%
Oregon:
13.7%
Students in private schools in grades 9 to 12 (high school):
Here:
0.0%
Oregon:
8.8%
Students in private undergraduate colleges: 8
Here:
56.3%
Oregon:
17.7%
Occupation by median earnings in the past 12 months ($)
115,949Health diagnosing and treating practitioners and other technical occupations
88,196Construction and extraction occupations
84,315Production occupations
70,463Business and financial operations occupations
57,496Farming, fishing, and forestry occupations
54,206Management occupations
Top industries in this zip code by the number of employees in 2005:
Health Care and Social Assistance: Other Residential Care Facilities (50-99 employees: 1 establishment)
Construction: Land Subdivision (20-49: 1)
Professional, Scientific, and Technical Services: Administrative Management and General Management Consulting Services (10-19: 1)
Other Services (except Public Administration): Commercial and Industrial Machinery and Equipment (except Automotive and Electronic) Repair and Maintenance (5-9: 1)
Construction: Electrical Contractors (5-9: 1)
People in group quarters in 2010:
19 people in residential treatment centers for juveniles (non-correctional)
People in group quarters in 2000:
23 people in homes for abused, dependent, and neglected children
Fatal accident statistics in 2014:
Fatal accident count: 1
Vehicles involved in fatal accidents: 1
Fatal accidents caused by drunken drivers: 0
Fatalities: 1
Persons involved in fatal accidents: 1
Pedestrians involved in fatal accidents: 1
Fatal accident statistics in 2010:
Fatal accident count: 1
Vehicles involved in fatal accidents: 2
Fatal accidents caused by drunken drivers: 0
Fatalities: 1
Persons involved in fatal accidents: 2
Pedestrians involved in fatal accidents: 0
Home Mortgage Disclosure Act Aggregated Statistics For Year 2009 (Based on 2 partial tracts)
A) FHA, FSA/RHS & VA Home Purchase Loans
B) Conventional Home Purchase Loans
C) Refinancings
D) Home Improvement Loans
F) Non-occupant Loans on < 5 Family Dwellings (A B C & D)
G) Loans On Manufactured Home Dwelling (A B C & D)
Number
Average Value
Number
Average Value
Number
Average Value
Number
Average Value
Number
Average Value
Number
Average Value
LOANS ORIGINATED
8
$201,188
9
$199,339
82
$203,916
2
$154,175
5
$151,256
22
$169,599
APPLICATIONS APPROVED, NOT ACCEPTED
0
$0
1
$96,360
10
$199,202
1
$12,260
0
$0
2
$217,540
APPLICATIONS DENIED
2
$224,255
2
$170,820
25
$222,924
2
$65,115
3
$131,983
5
$119,954
APPLICATIONS WITHDRAWN
1
$85,260
4
$113,442
17
$200,312
1
$17,520
1
$119,720
2
$110,960
FILES CLOSED FOR INCOMPLETENESS
1
$94,610
0
$0
8
$177,974
1
$57,230
1
$109,790
0
$0
Aggregated Statistics For Year 2008 (Based on 2 partial tracts)
A) FHA, FSA/RHS & VA Home Purchase Loans
B) Conventional Home Purchase Loans
C) Refinancings
D) Home Improvement Loans
F) Non-occupant Loans on < 5 Family Dwellings (A B C & D)
G) Loans On Manufactured Home Dwelling (A B C & D)
Number
Average Value
Number
Average Value
Number
Average Value
Number
Average Value
Number
Average Value
Number
Average Value
LOANS ORIGINATED
9
$189,606
16
$206,225
45
$205,205
2
$75,920
7
$195,890
13
$154,176
APPLICATIONS APPROVED, NOT ACCEPTED
1
$76,500
3
$226,397
12
$255,062
4
$195,785
0
$0
4
$131,692
APPLICATIONS DENIED
2
$174,030
6
$164,980
38
$186,066
5
$182,208
2
$158,555
10
$144,014
APPLICATIONS WITHDRAWN
3
$151,647
6
$273,897
17
$216,973
1
$12,850
0
$0
8
$179,142
FILES CLOSED FOR INCOMPLETENESS
1
$75,920
1
$87,600
7
$213,077
1
$87,020
0
$0
0
$0
Aggregated Statistics For Year 2007 (Based on 2 partial tracts)
A) FHA, FSA/RHS & VA Home Purchase Loans
B) Conventional Home Purchase Loans
C) Refinancings
D) Home Improvement Loans
E) Loans on Dwellings For 5+ Families
F) Non-occupant Loans on < 5 Family Dwellings (A B C & D)
G) Loans On Manufactured Home Dwelling (A B C & D)
Number
Average Value
Number
Average Value
Number
Average Value
Number
Average Value
Number
Average Value
Number
Average Value
Number
Average Value
LOANS ORIGINATED
4
$156,220
20
$199,640
47
$192,086
6
$75,920
1
$122,060
5
$182,208
13
$149,369
APPLICATIONS APPROVED, NOT ACCEPTED
0
$0
5
$119,020
6
$243,430
1
$55,480
0
$0
0
$0
2
$77,380
APPLICATIONS DENIED
4
$155,490
12
$224,451
30
$248,745
4
$53,728
0
$0
1
$188,050
9
$173,253
APPLICATIONS WITHDRAWN
1
$106,870
4
$239,878
12
$188,242
2
$100,155
0
$0
1
$318,860
3
$160,407
FILES CLOSED FOR INCOMPLETENESS
0
$0
1
$233,020
4
$171,258
0
$0
0
$0
1
$221,340
1
$140,160
Aggregated Statistics For Year 2006 (Based on 2 partial tracts)
A) FHA, FSA/RHS & VA Home Purchase Loans
B) Conventional Home Purchase Loans
C) Refinancings
D) Home Improvement Loans
F) Non-occupant Loans on < 5 Family Dwellings (A B C & D)
G) Loans On Manufactured Home Dwelling (A B C & D)
Number
Average Value
Number
Average Value
Number
Average Value
Number
Average Value
Number
Average Value
Number
Average Value
LOANS ORIGINATED
3
$144,053
48
$181,016
60
$181,001
9
$65,019
11
$147,645
19
$131,338
APPLICATIONS APPROVED, NOT ACCEPTED
0
$0
6
$183,765
15
$160,522
1
$17,520
1
$163,520
3
$139,967
APPLICATIONS DENIED
1
$180,460
13
$209,701
32
$147,223
6
$96,068
4
$97,820
11
$109,102
APPLICATIONS WITHDRAWN
1
$163,520
8
$169,652
20
$191,756
1
$245,280
0
$0
5
$127,196
FILES CLOSED FOR INCOMPLETENESS
0
$0
0
$0
6
$181,332
0
$0
0
$0
1
$78,840
Aggregated Statistics For Year 2005 (Based on 2 partial tracts)
A) FHA, FSA/RHS & VA Home Purchase Loans
B) Conventional Home Purchase Loans
C) Refinancings
D) Home Improvement Loans
F) Non-occupant Loans on < 5 Family Dwellings (A B C & D)
G) Loans On Manufactured Home Dwelling (A B C & D)
Number
Average Value
Number
Average Value
Number
Average Value
Number
Average Value
Number
Average Value
Number
Average Value
LOANS ORIGINATED
5
$123,340
46
$136,758
60
$150,030
8
$76,796
9
$129,972
22
$126,675
APPLICATIONS APPROVED, NOT ACCEPTED
1
$82,340
7
$82,844
10
$137,532
3
$25,113
1
$323,540
3
$124,197
APPLICATIONS DENIED
2
$149,505
8
$142,861
44
$147,115
6
$91,688
4
$153,300
11
$112,340
APPLICATIONS WITHDRAWN
2
$108,915
10
$133,678
27
$155,257
6
$176,855
2
$135,195
8
$126,144
FILES CLOSED FOR INCOMPLETENESS
0
$0
2
$49,930
8
$163,958
0
$0
1
$105,120
1
$153,590
Aggregated Statistics For Year 2004 (Based on 2 partial tracts)
A) FHA, FSA/RHS & VA Home Purchase Loans
B) Conventional Home Purchase Loans
C) Refinancings
D) Home Improvement Loans
F) Non-occupant Loans on < 5 Family Dwellings (A B C & D)
G) Loans On Manufactured Home Dwelling (A B C & D)
Number
Average Value
Number
Average Value
Number
Average Value
Number
Average Value
Number
Average Value
Number
Average Value
LOANS ORIGINATED
4
$141,912
47
$133,065
62
$150,088
5
$35,858
8
$149,212
15
$130,505
APPLICATIONS APPROVED, NOT ACCEPTED
1
$149,500
8
$104,974
18
$117,903
2
$123,810
1
$60,150
6
$125,950
APPLICATIONS DENIED
2
$158,555
18
$104,017
40
$137,634
4
$61,905
2
$189,510
10
$97,762
APPLICATIONS WITHDRAWN
0
$0
4
$198,122
30
$153,514
1
$17,520
1
$115,630
2
$117,675
FILES CLOSED FOR INCOMPLETENESS
0
$0
2
$123,515
5
$127,662
1
$62,490
0
$0
1
$216,080
Aggregated Statistics For Year 2003 (Based on 2 partial tracts)
A) FHA, FSA/RHS & VA Home Purchase Loans
B) Conventional Home Purchase Loans
C) Refinancings
D) Home Improvement Loans
F) Non-occupant Loans on < 5 Family Dwellings (A B C & D)
Number
Average Value
Number
Average Value
Number
Average Value
Number
Average Value
Number
Average Value
LOANS ORIGINATED
4
$159,870
32
$152,132
154
$142,837
4
$28,032
8
$139,284
APPLICATIONS APPROVED, NOT ACCEPTED
0
$0
5
$126,028
17
$118,758
1
$16,940
1
$148,340
APPLICATIONS DENIED
0
$0
11
$139,364
55
$134,915
3
$43,607
1
$115,630
APPLICATIONS WITHDRAWN
1
$77,090
3
$177,730
30
$135,975
2
$84,095
2
$218,125
FILES CLOSED FOR INCOMPLETENESS
0
$0
0
$0
3
$129,843
0
$0
0
$0
Aggregated Statistics For Year 2002 (Based on 2 partial tracts)
A) FHA, FSA/RHS & VA Home Purchase Loans
B) Conventional Home Purchase Loans
C) Refinancings
D) Home Improvement Loans
F) Non-occupant Loans on < 5 Family Dwellings (A B C & D)
Number
Average Value
Number
Average Value
Number
Average Value
Number
Average Value
Number
Average Value
LOANS ORIGINATED
9
$109,078
35
$132,735
86
$129,607
4
$23,215
5
$119,720
APPLICATIONS APPROVED, NOT ACCEPTED
2
$98,990
5
$114,814
13
$130,322
1
$73,580
1
$121,470
APPLICATIONS DENIED
1
$61,900
16
$121,399
29
$112,833
0
$0
2
$193,010
APPLICATIONS WITHDRAWN
0
$0
6
$178,315
23
$141,480
1
$32,120
1
$101,030
FILES CLOSED FOR INCOMPLETENESS
0
$0
1
$105,120
6
$122,640
0
$0
0
$0
Aggregated Statistics For Year 2001 (Based on 2 partial tracts)
A) FHA, FSA/RHS & VA Home Purchase Loans
B) Conventional Home Purchase Loans
C) Refinancings
D) Home Improvement Loans
F) Non-occupant Loans on < 5 Family Dwellings (A B C & D)
Number
Average Value
Number
Average Value
Number
Average Value
Number
Average Value
Number
Average Value
LOANS ORIGINATED
6
$115,048
34
$131,383
101
$141,513
5
$29,434
5
$108,974
APPLICATIONS APPROVED, NOT ACCEPTED
1
$133,740
7
$105,787
12
$135,975
2
$73,585
1
$99,280
APPLICATIONS DENIED
1
$136,070
5
$66,692
28
$129,648
2
$9,930
1
$261,630
APPLICATIONS WITHDRAWN
0
$0
6
$131,303
20
$157,651
2
$97,235
1
$33,870
FILES CLOSED FOR INCOMPLETENESS
0
$0
1
$148,920
6
$131,983
0
$0
1
$23,360
Aggregated Statistics For Year 2000 (Based on 2 partial tracts)
A) FHA, FSA/RHS & VA Home Purchase Loans
B) Conventional Home Purchase Loans
C) Refinancings
D) Home Improvement Loans
F) Non-occupant Loans on < 5 Family Dwellings (A B C & D)
Number
Average Value
Number
Average Value
Number
Average Value
Number
Average Value
Number
Average Value
LOANS ORIGINATED
6
$121,180
26
$127,087
30
$102,044
16
$19,856
3
$58,400
APPLICATIONS APPROVED, NOT ACCEPTED
0
$0
11
$107,615
5
$104,068
2
$11,390
1
$9,930
APPLICATIONS DENIED
1
$122,640
16
$100,740
26
$102,222
5
$32,938
1
$127,900
APPLICATIONS WITHDRAWN
1
$55,480
2
$249,660
13
$111,589
0
$0
0
$0
FILES CLOSED FOR INCOMPLETENESS
1
$66,580
2
$79,715
8
$92,418
0
$0
1
$63,070
Aggregated Statistics For Year 1999 (Based on 1 partial tract)
A) FHA, FSA/RHS & VA Home Purchase Loans
B) Conventional Home Purchase Loans
C) Refinancings
D) Home Improvement Loans
F) Non-occupant Loans on < 5 Family Dwellings (A B C & D)
Detailed PMIC statistics for the following Tracts:0016.00
2002 - 2016 National Fire Incident Reporting System (NFIRS) incidents
According to the data from the years 2002 - 2016 the average number of fires per year is 9. The highest number of fire incidents - 14 took place in 2002, and the least - 4 in 2014. The data has a declining trend.
When looking into fire subcategories, the most incidents belonged to: Structure Fires (46.3%), and Outside Fires (44.1%).
Fire incident types reported to NFIRS in Zip Code 97438


 Nearest zip codes: 97452, 97431, 97478, 97489, 97455, 97492.


 (Students: 2, Location: 37466 JASPER LOWELL RD, Grades: 10)


 According to the data from the years 2002 - 2016 the average number of fires per year is 9. The highest number of fire incidents - 14 took place in 2002, and the least - 4 in 2014. The data has a declining trend.
 When looking into fire subcategories, the most incidents belonged to: Structure Fires (46.3%), and Outside Fires (44.1%).