Estimated zip code population in 2022: 2,581 Zip code population in 2010: 2,473 Zip code population in 2000: 2,277
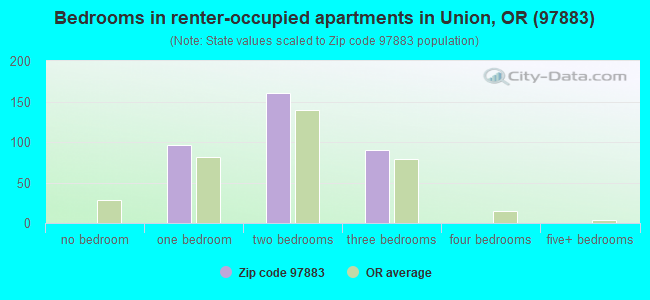
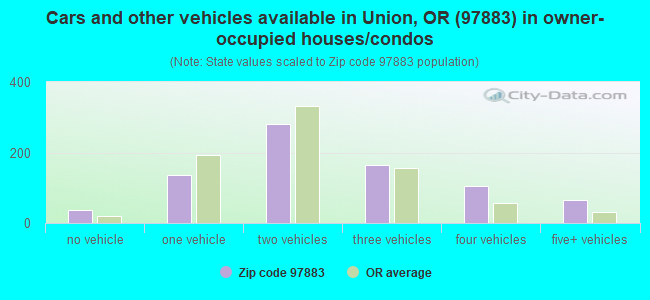
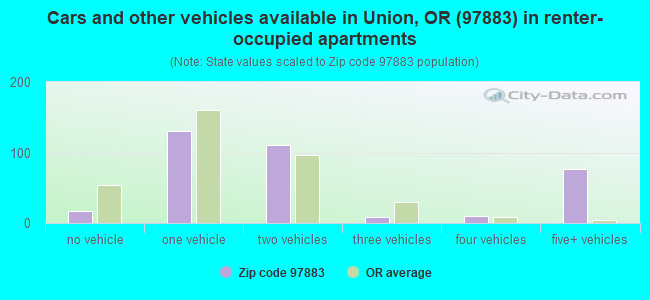
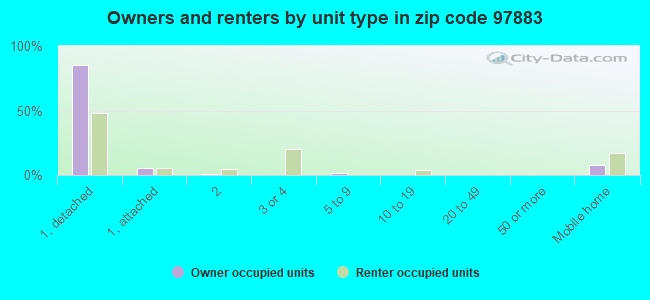
Houses and condos: 1,262 Renter-occupied apartments: 348
% of renters here:
31%
State:
37%
March 2022 cost of living index in zip code 97883: 87.7 (less than average, U.S. average is 100)
Land area: 266.8 sq. mi. Water area: 0.2 sq. mi.
Population density: 10 people per square mile
(very low).
OSM Map
General Map
Google Map
MSN Map
OSM Map
General Map
Google Map
MSN Map
OSM Map
General Map
Google Map
MSN Map
OSM Map
General Map
Google Map
MSN Map
Please wait while loading the map...
Real estate property taxes paid for housing units in 2022:
This zip code:
0.6% ($1,543)
Oregon:
0.8% ($3,646)
Median real estate property taxes paid for housing units with mortgages in 2022: $1,693 (0.7%) Median real estate property taxes paid for housing units with no mortgage in 2022: $1,244 (0.6%)
Business Search- 14 Million verified businesses
Males: 1,342
(52.0%)
Females: 1,239
(48.0%)
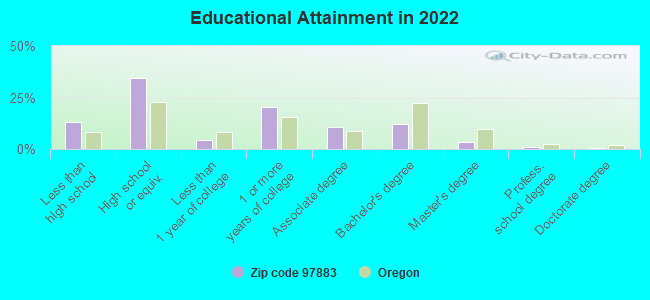
For population 25 years and over in 97883:
High school or higher: 86.5%
Bachelor's degree or higher: 16.8%
Graduate or professional degree: 4.7%
Unemployed: 1.7%
Mean travel time to work (commute): 22.1 minutes
For population 15 years and over in 97883:
Never married: 24.8%
Now married: 53.4%
Separated: 1.8%
Widowed: 6.9%
Divorced: 13.1%
Zip code 97883 compared to state average:
Median house value below state average.
Unemployed percentage below state average.
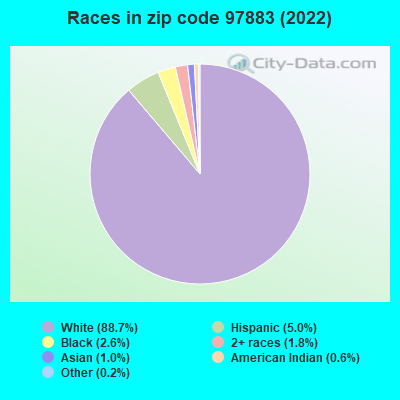
Hispanic race population percentage below state average.
Foreign-born population percentage significantly below state average.
House age above state average.
Percentage of population with a bachelor's degree or higher below state average.
Averages for the 2020 tax year for zip code 97883, filed in 2021:
Average Adjusted Gross Income (AGI) in 2020: $55,409 (Individual Income Tax Returns)
Here:
$55,409
State:
$76,001
Salary/wage: $47,031 (reported on 79.3% of returns)
Here:
$47,031
State:
$61,959
(% of AGI for various income ranges: 1288.3% for AGIs below $25k, 3473.9% for AGIs $25k-50k, 6571.7% for AGIs $50k-75k, 9718.9% for AGIs $75k-100k, 19715.7% for AGIs $100k-200k)
Taxable interest for individuals: $1,115 (reported on 30.6% of returns)
This zip code:
$1,115
Oregon:
$1,628
(% of AGI for various income ranges: 30.9% for AGIs below $25k, 27.0% for AGIs $25k-50k, 60.8% for AGIs $50k-75k, 48.9% for AGIs $75k-100k, 184.3% for AGIs $100k-200k)
Ordinary dividends: $2,423 (reported on 11.7% of returns)
Here:
$2,423
State:
$7,165
(% of AGI for various income ranges: 17.4% for AGIs below $25k, 6.5% for AGIs $25k-50k, 30.0% for AGIs $50k-75k, 61.1% for AGIs $75k-100k, 241.4% for AGIs $100k-200k)
Net capital gain/loss in AGI: +$11,176 (reported on 15.3% of returns)
Here:
+$11,176
State:
+$23,403
(% of AGI for various income ranges: 22.2% for AGIs below $25k, 9.6% for AGIs $25k-50k, 258.3% for AGIs $50k-75k, 97.8% for AGIs $75k-100k, 2041.4% for AGIs $100k-200k)
Profit/loss from business: +$6,833 (reported on 13.5% of returns)
Here:
+$6,833
State:
+$16,511
(% of AGI for various income ranges: 118.7% for AGIs below $25k, 187.5% for AGIs $50k-75k, 795.7% for AGIs $100k-200k)
Taxable individual retirement arrangement distribution: $14,633 (reported on 10.8% of returns)
97883:
$14,633
Oregon:
$20,730
(% of AGI for various income ranges: 113.5% for AGIs below $25k, 206.1% for AGIs $25k-50k, 1134.4% for AGIs $75k-100k)
Total itemized deductions: $25,862 (reported on 7.2% of returns)
Here:
$25,862
State:
$31,050
(% of AGI for various income ranges: 247.8% for AGIs $25k-50k, 692.2% for AGIs $75k-100k, 1251.4% for AGIs $100k-200k)
Charity contributions: $9,120 (reported on 4.5% of returns)
Here:
$9,120
State:
$8,791
(% of AGI for various income ranges: 155.8% for AGIs $50k-75k, 384.3% for AGIs $100k-200k)
Taxes paid: $7,012 (reported on 7.2% of returns)
97883:
$7,012
State:
$8,487
(% of AGI for various income ranges: 70.9% for AGIs $25k-50k, 164.4% for AGIs $75k-100k, 357.1% for AGIs $100k-200k)
Earned income credit: $2,050 (reported on 16.2% of returns)
Here:
$2,050
State:
$1,977
(% of AGI for various income ranges: 82.2% for AGIs below $25k, 78.3% for AGIs $25k-50k)
Percentage of individuals using paid preparers for their 2020 taxes: 94.6%
Here:
95%
State:
93%
(% for various income ranges: 91.4% for AGIs below $25k, 93.3% for AGIs $25k-50k, 94.4% for AGIs $50k-75k, 100.0% for AGIs $75k-100k, 100.0% for AGIs $100k-200k)
Averages for the 2012 tax year for zip code 97883, filed in 2013:
Average Adjusted Gross Income (AGI) in 2012: $43,116 (Individual Income Tax Returns)
Here:
$43,116
State:
$57,845
Salary/wage: $36,815 (reported on 79.0% of returns)
Here:
$36,815
State:
$47,723
(% of AGI for various income ranges: 65.7% for AGIs below $25k, 76.2% for AGIs $25k-50k, 76.3% for AGIs $50k-75k, 70.8% for AGIs $75k-100k, 50.0% for AGIs $100k-200k)
Taxable interest for individuals: $900 (reported on 35.0% of returns)
This zip code:
$900
Oregon:
$1,848
(% of AGI for various income ranges: 2.7% for AGIs below $25k, 0.6% for AGIs $25k-50k, 0.3% for AGIs $50k-75k, 0.2% for AGIs $75k-100k, 0.7% for AGIs $100k-200k)
Ordinary dividends: $2,060 (reported on 15.0% of returns)
Here:
$2,060
State:
$5,987
(% of AGI for various income ranges: 0.8% for AGIs below $25k, 0.3% for AGIs $25k-50k, 0.6% for AGIs $50k-75k, 1.6% for AGIs $100k-200k)
Net capital gain/loss in AGI: +$983 (reported on 12.0% of returns)
Here:
+$983
State:
+$13,095
(% of AGI for various income ranges: 0.3% for AGIs below $25k, 0.2% for AGIs $25k-50k, 0.7% for AGIs $100k-200k)
Profit/loss from business: +$4,268 (reported on 19.0% of returns)
Here:
+$4,268
State:
+$13,871
(% of AGI for various income ranges: 4.8% for AGIs below $25k, 2.6% for AGIs $25k-50k, 2.8% for AGIs $50k-75k, 0.3% for AGIs $75k-100k)
Taxable individual retirement arrangement distribution: $11,242 (reported on 12.0% of returns)
97883:
$11,242
Oregon:
$16,036
(% of AGI for various income ranges: 4.9% for AGIs below $25k, 2.8% for AGIs $25k-50k, 3.2% for AGIs $50k-75k, 7.1% for AGIs $75k-100k)
Total itemized deductions: $18,607 (25% of AGI, reported on 29.0% of returns)
Here:
$18,607
State:
$24,430
Here:
24.9% of AGI
State:
23.2% of AGI
(% of AGI for various income ranges: 13.4% for AGIs below $25k, 8.9% for AGIs $25k-50k, 13.9% for AGIs $50k-75k, 14.2% for AGIs $75k-100k, 13.0% for AGIs $100k-200k)
Charity contributions: $3,428 (reported on 18.0% of returns)
Here:
$3,428
State:
$3,648
(% of AGI for various income ranges: 1.2% for AGIs below $25k, 0.9% for AGIs $25k-50k, 1.7% for AGIs $50k-75k, 1.3% for AGIs $75k-100k, 1.9% for AGIs $100k-200k)
Taxes paid: $6,183 (reported on 29.0% of returns)
97883:
$6,183
State:
$10,269
(% of AGI for various income ranges: 1.4% for AGIs below $25k, 2.0% for AGIs $25k-50k, 4.1% for AGIs $50k-75k, 4.6% for AGIs $75k-100k, 7.2% for AGIs $100k-200k)
Earned income credit: $2,167 (reported on 18.0% of returns)
Here:
$2,167
State:
$2,021
(% of AGI for various income ranges: 5.0% for AGIs below $25k, 1.3% for AGIs $25k-50k)
Percentage of individuals using paid preparers for their 2012 taxes: 61.0%
Here:
61%
State:
47%
(% for various income ranges: 56.1% for AGIs below $25k, 55.6% for AGIs $25k-50k, 64.7% for AGIs $50k-75k, 75.0% for AGIs $75k-100k, 85.7% for AGIs $100k-200k)
Averages for the 2004 tax year for zip code 97883, filed in 2005:
Average Adjusted Gross Income (AGI) in 2004: $33,168 (Individual Income Tax Returns)
Here:
$33,168
State:
$46,788
Salary/wage: $30,667 (reported on 80.5% of returns)
Here:
$30,667
State:
$39,788
(% of AGI for various income ranges: 94.9% for AGIs below $10k, 64.0% for AGIs $10k-25k, 81.2% for AGIs $25k-50k, 77.7% for AGIs $50k-75k, 83.3% for AGIs $75k-100k, 44.5% for AGIs over 100k)
Taxable interest for individuals: $1,305 (reported on 44.8% of returns)
This zip code:
$1,305
Oregon:
$2,126
(% of AGI for various income ranges: 5.9% for AGIs below $10k, 3.2% for AGIs $10k-25k, 1.3% for AGIs $25k-50k, 1.8% for AGIs $50k-75k, 0.4% for AGIs $75k-100k, 1.9% for AGIs over 100k)
Taxable dividends: $1,289 (reported on 18.3% of returns)
Here:
$1,289
State:
$3,427
(% of AGI for various income ranges: 2.7% for AGIs below $10k, 1.0% for AGIs $10k-25k, 0.6% for AGIs $25k-50k, 0.3% for AGIs $50k-75k, 0.2% for AGIs $75k-100k, 1.8% for AGIs over 100k)
Net capital gain/loss: +$2,143 (reported on 18.9% of returns)
Here:
+$2,143
State:
+$12,447
(% of AGI for various income ranges: -3.7% for AGIs below $10k, 0.4% for AGIs $10k-25k, 0.1% for AGIs $25k-50k, 1.5% for AGIs $50k-75k, 3.1% for AGIs $75k-100k, 3.2% for AGIs over 100k)
Profit/loss from business: +$5,737 (reported on 19.1% of returns)
Here:
+$5,737
State:
+$11,682
(% of AGI for various income ranges: 5.2% for AGIs below $10k, 6.5% for AGIs $10k-25k, 2.8% for AGIs $25k-50k, 4.3% for AGIs $50k-75k, 1.8% for AGIs $75k-100k)
IRA payment deduction: $2,600 (reported on 2.9% of returns)
97883:
$2,600
Oregon:
$3,035
Total itemized deductions: $15,259 (27% of AGI, reported on 30.5% of returns)
Here:
$15,259
State:
$20,209
Here:
26.7% of AGI
State:
24.7% of AGI
(% of AGI for various income ranges: 15.9% for AGIs below $10k, 10.1% for AGIs $10k-25k, 10.8% for AGIs $25k-50k, 17.1% for AGIs $50k-75k, 20.2% for AGIs $75k-100k, 12.1% for AGIs over 100k)
Charity contributions deductions: $2,631 (4% of AGI, reported on 22.4% of returns)
Here:
$2,631
State:
$3,145
Here:
4.3% of AGI
State:
3.6% of AGI
(% of AGI for various income ranges: 1.0% for AGIs $10k-25k, 1.2% for AGIs $25k-50k, 2.2% for AGIs $50k-75k, 2.8% for AGIs $75k-100k, 2.3% for AGIs over 100k)
Total tax: $3,746 (reported on 67.4% of returns)
97883:
$3,746
State:
$7,148
(% of AGI for various income ranges: 2.4% for AGIs below $10k, 3.4% for AGIs $10k-25k, 5.2% for AGIs $25k-50k, 7.7% for AGIs $50k-75k, 9.1% for AGIs $75k-100k, 17.9% for AGIs over 100k)
Earned income credit: $1,546 (reported on 19.7% of returns)
Here:
$1,546
State:
$1,605
Percentage of individuals using paid preparers for their 2004 taxes: 62.2%
Here:
62%
State:
53%
(% for various income ranges: 46.7% for AGIs below $10k, 68.9% for AGIs $10k-25k, 63.3% for AGIs $25k-50k, 67.1% for AGIs $50k-75k, 71.7% for AGIs $75k-100k, 73.9% for AGIs over 100k)
Household received Food Stamps/SNAP in the past 12 months: 149 Household did not receive Food Stamps/SNAP in the past 12 months: 989
Women who had a birth in the past 12 months: 35 (23 now married, 11 unmarried) Women who did not have a birth in the past 12 months: 584 (250 now married, 333 unmarried)
Housing units in zip code 97883 with a mortgage: 530 (4 second mortgage) Houses without a mortgage: 10
Median monthly owner costs for units with a mortgage: $1,344 Median monthly owner costs for units without a mortgage: $434
Residents with income below the poverty level in 2022:
This zip code:
17.7%
Whole state:
12.1%
Residents with income below 50% of the poverty level in 2022:
This zip code:
12.5%
Whole state:
6.2%
Median number of rooms in houses and condos:
Here:
6.0
State:
6.2
Median number of rooms in apartments:
Here:
3.8
State:
4.0
Notable locations in this zip code not listed on our city pages
Notable locations in zip code 97883: Union Junction (A), Buck Creek Trailhead (B), North Fork Catherine Creek Recreation Site (C), North Fork Picnic Area (D), Flat Rock Forest Camp (E), West Eagle Horse Camp (F), Crooks (G), Catherine Creek Guard Station (H), Catherine Creek Cabin (I), Eastern Oregon Livestock Show (J), Union Sewer Treatment Plant (K), Union Wastewater Treatment Plant (L), Buck Creek Recreation Site (M), Union Rural Fire Protection District (N), Union City Fire Department (O), Union Public Works (P), Union Carnegie Public Library (Q), Union City Hall (R), Union County Museum (S). Display/hide their locations on the map
Lakes and reservoirs: Little Pop Lake (A), Pop Lake (B), Glacier Lake (C), Heart Lake (D), Hidden Lake (E), Tombstone Lake (F), Little Frazier Lake (G), Olive Lake (H). Display/hide their locations on the map
Streams, rivers, and creeks: Knight Creek (A), Jim Creek (B), Middle Fork Catherine Creek (C), French Creek (D), Little Creek (E), McDow Creek (F), Dodge Creek (G), Dennis Creek (H), North Fork Catherine Creek (I). Display/hide their locations on the map
Parks in zip code 97883 include: Union City Park (1), Eastern Oregon Livestock Exposition Grounds (2), Catherine Creek State Park (3). Display/hide their locations on the map
In group quarters: 9 (-1 institutionalized population)
Size of family households: 388 2-persons, 123 3-persons, 109 4-persons, 43 5-persons, 33 7-or-more-persons
Size of nonfamily households: 338 1-person, 107 2-persons
297 married couples with children.
238 single-parent households (151 men, 87 women).
97.6% of residents of 97883 zip code speak English at home.
1.2% of residents speak Spanish at home (100% very well).
1.1% of residents speak other Indo-European language at home (89% very well, 11% well).
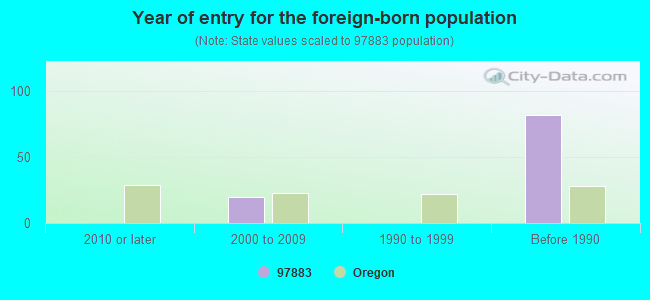
Foreign born population: 60 (2.4%) (65.7% of them are naturalized citizens)
This zip code:
2.4%
Whole state:
9.9%
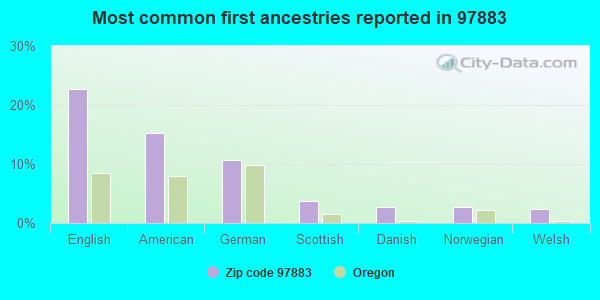
5%Japan
3%France
23%English
15%American
11%German
4%Scottish
3%Danish
3%Norwegian
2%Welsh
Year of entry for the foreign-born population
02010 or later
202000 to 2009
01990 to 1999
82Before 1990
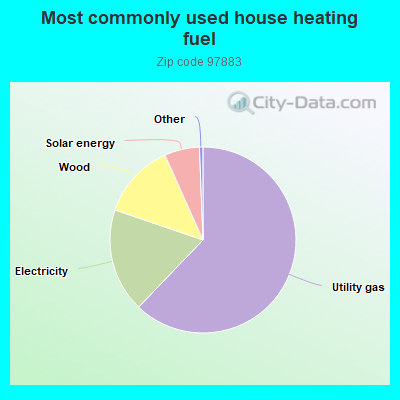
Housing units lacking complete plumbing facilities: 6.3% Housing units lacking complete kitchen facilities: 6.1%
62.3%Utility gas
18.1%Electricity
13.1%Wood
6.1%Solar energy
Population in 1990: 2,463.
Place of birth for U.S.-born residents:
This state: 1,490
Northeast: 42
Midwest: 130
South: 134
West: 669
65% of the 97883 zip code residents lived in the same house 5 years ago. Out of people who lived in different houses, 55% lived in this county. Out of people who lived in different counties, 50% lived in Oregon.
90% of the 97883 zip code residents lived in the same house 1 year ago. Out of people who lived in different houses, 81% moved from this county. Out of people who lived in different houses, 12% moved from different county within same state. Out of people who lived in different houses, 5% moved from different state.
Private vs. public school enrollment:
Students in private schools in grades 1 to 8 (elementary and middle school): 31
Here:
12.5%
Oregon:
13.7%
Students in private schools in grades 9 to 12 (high school): 1
Here:
1.2%
Oregon:
8.8%
Students in private undergraduate colleges: 17
Here:
30.8%
Oregon:
17.7%
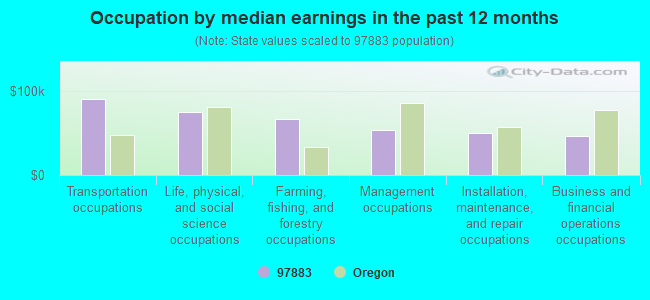
Occupation by median earnings in the past 12 months ($)
90,115Transportation occupations
75,262Life, physical, and social science occupations
66,060Farming, fishing, and forestry occupations
53,006Management occupations
50,086Installation, maintenance, and repair occupations
46,209Business and financial operations occupations
Top industries in this zip code by the number of employees in 2005:
Construction: Drywall and Insulation Contractors (10-19: 1)
Accommodation and Food Services: Limited-Service Restaurants (5-9: 1, 1-4: 1)
Other Services (except Public Administration): Religious Organizations (1-4: 2)
People in group quarters in 2010:
9 people in group homes intended for adults
2 people in group homes for juveniles (non-correctional)
2002 - 2018 National Fire Incident Reporting System (NFIRS) incidents
Based on the data from the years 2002 - 2018 the average number of fires per year is 13. The highest number of fires - 27 took place in 2015, and the least - 2 in 2017. The data has a rising trend.
When looking into fire subcategories, the most reports belonged to: Outside Fires (50.0%), and Structure Fires (34.7%).
Fire incident types reported to NFIRS in Zip Code 97883


 Nearest zip codes: 97824, 97857, 97867, 97814, 97841, 97827.
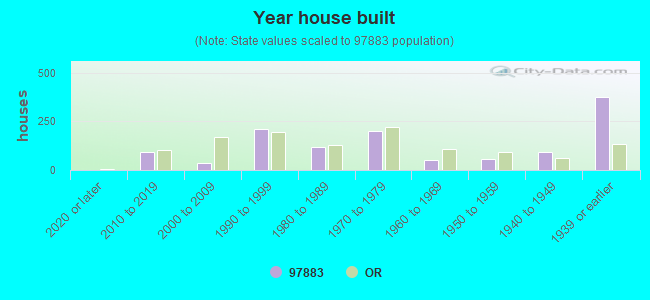


 Based on the data from the years 2002 - 2018 the average number of fires per year is 13. The highest number of fires - 27 took place in 2015, and the least - 2 in 2017. The data has a rising trend.
 When looking into fire subcategories, the most reports belonged to: Outside Fires (50.0%), and Structure Fires (34.7%).