Estimated zip code population in 2022: 50,938 Zip code population in 2010: 43,924 Zip code population in 2000: 38,963
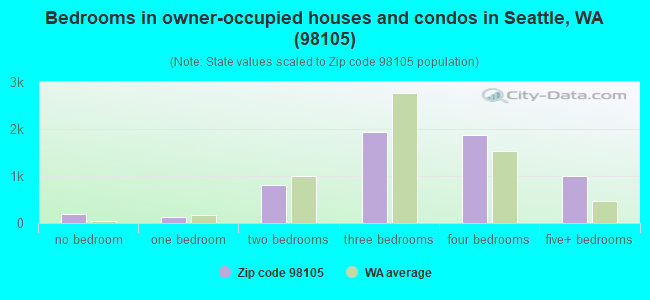
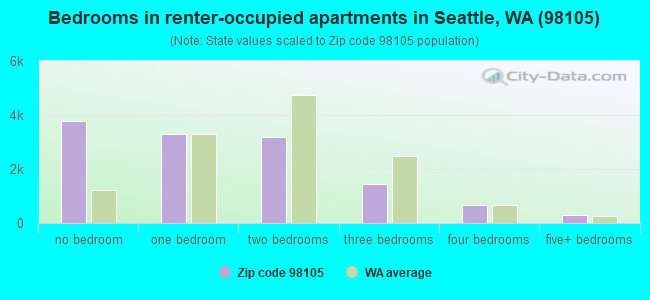
Houses and condos: 20,542 Renter-occupied apartments: 12,476
% of renters here:
68%
State:
36%
March 2022 cost of living index in zip code 98105: 128.5 (high, U.S. average is 100)
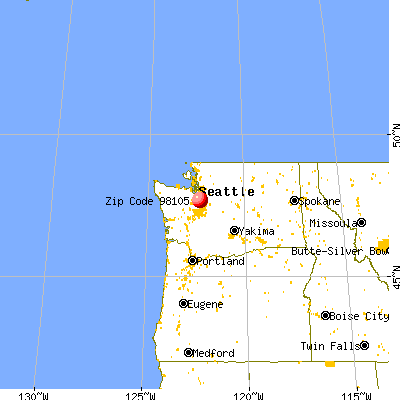
Land area: 4.1 sq. mi. Water area: 2.5 sq. mi.
Population density: 12,353 people per square mile
(very high).
OSM Map
General Map
Google Map
MSN Map
OSM Map
General Map
Google Map
MSN Map
OSM Map
General Map
Google Map
MSN Map
OSM Map
General Map
Google Map
MSN Map
Please wait while loading the map...
Real estate property taxes paid for housing units in 2022:
This zip code:
0.7% ($9,885)
Washington:
0.8% ($4,283)
Median real estate property taxes paid for housing units with mortgages in 2022: $9,627 (0.6%) Median real estate property taxes paid for housing units with no mortgage in 2022: $10,314 (0.7%)
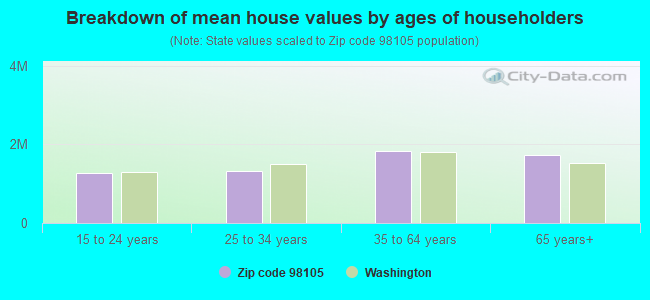
Estimated median house/condo value in 2022: $1,508,080
98105:
$1,508,080
Washington:
$569,500
According to our research of Washington and other state lists, there were 29 registered sex offenders living in 98105 zip code as of May 14, 2024. The ratio of all residents to sex offenders in zip code 98105 is 1,627 to 1. The ratio of registered sex offenders to all residents in this zip code is lower than the state average.
Median resident age:
This zip code:
24.6 years
Washington median age:
38.4 years
Average household size:
This zip code:
2.3 people
Washington:
2.5 people
Averages for the 2020 tax year for zip code 98105, filed in 2021:
Average Adjusted Gross Income (AGI) in 2020: $192,314 (Individual Income Tax Returns)
Here:
$192,314
State:
$99,264
Salary/wage: $131,550 (reported on 84.8% of returns)
Here:
$131,550
State:
$80,347
(% of AGI for various income ranges: 1173.7% for AGIs below $25k, 3697.8% for AGIs $25k-50k, 6782.7% for AGIs $50k-75k, 10461.3% for AGIs $75k-100k, 19732.7% for AGIs $100k-200k, 160309.2% for AGIs over 200k)
Taxable interest for individuals: $4,483 (reported on 44.1% of returns)
This zip code:
$4,483
Washington:
$2,077
(% of AGI for various income ranges: 13.4% for AGIs below $25k, 19.7% for AGIs $25k-50k, 50.1% for AGIs $50k-75k, 125.3% for AGIs $75k-100k, 270.0% for AGIs $100k-200k, 3300.4% for AGIs over 200k)
Ordinary dividends: $24,573 (reported on 39.5% of returns)
Here:
$24,573
State:
$10,013
(% of AGI for various income ranges: 46.9% for AGIs below $25k, 74.5% for AGIs $25k-50k, 207.5% for AGIs $50k-75k, 445.9% for AGIs $75k-100k, 1100.4% for AGIs $100k-200k, 16843.7% for AGIs over 200k)
Net capital gain/loss in AGI: +$104,356 (reported on 37.6% of returns)
Here:
+$104,356
State:
+$40,092
(% of AGI for various income ranges: 36.5% for AGIs below $25k, 76.6% for AGIs $25k-50k, 234.6% for AGIs $50k-75k, 465.4% for AGIs $75k-100k, 1262.8% for AGIs $100k-200k, 76064.2% for AGIs over 200k)
Profit/loss from business: +$44,769 (reported on 15.4% of returns)
Here:
+$44,769
State:
+$18,312
(% of AGI for various income ranges: 88.3% for AGIs below $25k, 172.4% for AGIs $25k-50k, 272.2% for AGIs $50k-75k, 519.7% for AGIs $75k-100k, 991.4% for AGIs $100k-200k, 10704.5% for AGIs over 200k)
Taxable individual retirement arrangement distribution: $39,615 (reported on 7.4% of returns)
98105:
$39,615
Washington:
$24,221
(% of AGI for various income ranges: 23.1% for AGIs below $25k, 65.7% for AGIs $25k-50k, 164.1% for AGIs $50k-75k, 404.0% for AGIs $75k-100k, 1011.8% for AGIs $100k-200k, 3558.0% for AGIs over 200k)
Self-employed (Keogh) retirement plans: $28,321 (reported on 2.0% of returns)
98105:
$28,321
Washington:
$24,166
(% of AGI for various income ranges: 33.6% for AGIs $50k-75k, 78.7% for AGIs $100k-200k, 981.3% for AGIs over 200k)
Total itemized deductions: $54,464 (reported on 17.4% of returns)
Here:
$54,464
State:
$39,068
(% of AGI for various income ranges: 43.4% for AGIs below $25k, 85.3% for AGIs $25k-50k, 299.7% for AGIs $50k-75k, 560.4% for AGIs $75k-100k, 1729.0% for AGIs $100k-200k, 15214.3% for AGIs over 200k)
Charity contributions: $25,782 (reported on 14.9% of returns)
Here:
$25,782
State:
$15,331
(% of AGI for various income ranges: 2.6% for AGIs below $25k, 10.3% for AGIs $25k-50k, 39.1% for AGIs $50k-75k, 76.9% for AGIs $75k-100k, 318.0% for AGIs $100k-200k, 7145.2% for AGIs over 200k)
Taxes paid: $9,089 (reported on 17.2% of returns)
98105:
$9,089
State:
$7,774
(% of AGI for various income ranges: 9.5% for AGIs below $25k, 20.1% for AGIs $25k-50k, 75.7% for AGIs $50k-75k, 157.6% for AGIs $75k-100k, 426.6% for AGIs $100k-200k, 2199.5% for AGIs over 200k)
Earned income credit: $1,111 (reported on 5.1% of returns)
Here:
$1,111
State:
$2,020
(% of AGI for various income ranges: 18.7% for AGIs below $25k, 10.4% for AGIs $25k-50k)
Percentage of individuals using paid preparers for their 2020 taxes: 92.5%
Here:
92%
State:
93%
(% for various income ranges: 91.6% for AGIs below $25k, 92.9% for AGIs $25k-50k, 92.1% for AGIs $50k-75k, 91.9% for AGIs $75k-100k, 92.7% for AGIs $100k-200k, 93.8% for AGIs over 200k)
Averages for the 2012 tax year for zip code 98105, filed in 2013:
Average Adjusted Gross Income (AGI) in 2012: $105,613 (Individual Income Tax Returns)
Here:
$105,613
State:
$69,533
Salary/wage: $75,031 (reported on 84.7% of returns)
Here:
$75,031
State:
$57,267
(% of AGI for various income ranges: 85.0% for AGIs below $25k, 81.7% for AGIs $25k-50k, 75.8% for AGIs $50k-75k, 71.0% for AGIs $75k-100k, 73.1% for AGIs $100k-200k, 50.1% for AGIs over 200k)
Taxable interest for individuals: $4,161 (reported on 46.6% of returns)
This zip code:
$4,161
Washington:
$1,816
(% of AGI for various income ranges: 1.1% for AGIs below $25k, 0.7% for AGIs $25k-50k, 1.2% for AGIs $50k-75k, 1.2% for AGIs $75k-100k, 1.0% for AGIs $100k-200k, 2.3% for AGIs over 200k)
Ordinary dividends: $22,189 (reported on 35.3% of returns)
Here:
$22,189
State:
$8,163
(% of AGI for various income ranges: 4.3% for AGIs below $25k, 2.6% for AGIs $25k-50k, 3.2% for AGIs $50k-75k, 3.3% for AGIs $75k-100k, 3.7% for AGIs $100k-200k, 9.9% for AGIs over 200k)
Net capital gain/loss in AGI: +$33,749 (reported on 30.2% of returns)
Here:
+$33,749
State:
+$21,568
(% of AGI for various income ranges: 0.6% for AGIs below $25k, 1.1% for AGIs $25k-50k, 1.5% for AGIs $50k-75k, 1.6% for AGIs $75k-100k, 2.6% for AGIs $100k-200k, 14.6% for AGIs over 200k)
Profit/loss from business: +$33,063 (reported on 16.0% of returns)
Here:
+$33,063
State:
+$16,521
(% of AGI for various income ranges: 5.4% for AGIs below $25k, 4.6% for AGIs $25k-50k, 4.7% for AGIs $50k-75k, 5.0% for AGIs $75k-100k, 5.2% for AGIs $100k-200k, 5.0% for AGIs over 200k)
Taxable individual retirement arrangement distribution: $28,916 (reported on 9.3% of returns)
98105:
$28,916
Washington:
$18,648
(% of AGI for various income ranges: 1.6% for AGIs below $25k, 2.1% for AGIs $25k-50k, 3.0% for AGIs $50k-75k, 3.9% for AGIs $75k-100k, 3.5% for AGIs $100k-200k, 2.3% for AGIs over 200k)
Self-employment retirement plans: $26,129 (reported on 2.5% of returns)
98105:
$26,129
Washington:
$20,087
(% of AGI for various income ranges: 0.2% for AGIs below $25k, 0.2% for AGIs $50k-75k, 0.3% for AGIs $75k-100k, 0.5% for AGIs $100k-200k, 0.8% for AGIs over 200k)
Total itemized deductions: $37,968 (15% of AGI, reported on 31.7% of returns)
Here:
$37,968
State:
$23,872
Here:
14.6% of AGI
State:
18.2% of AGI
(% of AGI for various income ranges: 6.7% for AGIs below $25k, 7.6% for AGIs $25k-50k, 11.6% for AGIs $50k-75k, 14.5% for AGIs $75k-100k, 14.6% for AGIs $100k-200k, 10.9% for AGIs over 200k)
Charity contributions: $9,274 (reported on 28.2% of returns)
Here:
$9,274
State:
$4,465
(% of AGI for various income ranges: 0.4% for AGIs below $25k, 0.6% for AGIs $25k-50k, 1.2% for AGIs $50k-75k, 1.8% for AGIs $75k-100k, 2.1% for AGIs $100k-200k, 3.1% for AGIs over 200k)
Taxes paid: $11,180 (reported on 31.3% of returns)
98105:
$11,180
State:
$6,400
(% of AGI for various income ranges: 1.6% for AGIs below $25k, 2.0% for AGIs $25k-50k, 3.2% for AGIs $50k-75k, 4.3% for AGIs $75k-100k, 4.5% for AGIs $100k-200k, 3.1% for AGIs over 200k)
Earned income credit: $1,002 (reported on 7.1% of returns)
Here:
$1,002
State:
$2,073
(% of AGI for various income ranges: 1.3% for AGIs below $25k, 0.2% for AGIs $25k-50k)
Percentage of individuals using paid preparers for their 2012 taxes: 32.9%
Here:
33%
State:
43%
(% for various income ranges: 20.6% for AGIs below $25k, 23.2% for AGIs $25k-50k, 36.1% for AGIs $50k-75k, 42.6% for AGIs $75k-100k, 46.2% for AGIs $100k-200k, 69.1% for AGIs over 200k)
Averages for the 2004 tax year for zip code 98105, filed in 2005:
Average Adjusted Gross Income (AGI) in 2004: $79,294 (Individual Income Tax Returns)
Here:
$79,294
State:
$54,331
Salary/wage: $56,142 (reported on 84.3% of returns)
Here:
$56,142
State:
$45,761
(% of AGI for various income ranges: 187.6% for AGIs below $10k, 84.3% for AGIs $10k-25k, 83.4% for AGIs $25k-50k, 76.0% for AGIs $50k-75k, 74.9% for AGIs $75k-100k, 50.9% for AGIs over 100k)
Taxable interest for individuals: $4,009 (reported on 50.1% of returns)
This zip code:
$4,009
Washington:
$2,110
(% of AGI for various income ranges: 8.2% for AGIs below $10k, 1.6% for AGIs $10k-25k, 1.5% for AGIs $25k-50k, 2.1% for AGIs $50k-75k, 1.8% for AGIs $75k-100k, 2.8% for AGIs over 100k)
Taxable dividends: $18,861 (reported on 37.3% of returns)
Here:
$18,861
State:
$5,879
(% of AGI for various income ranges: 12.0% for AGIs below $10k, 2.9% for AGIs $10k-25k, 2.4% for AGIs $25k-50k, 3.4% for AGIs $50k-75k, 4.1% for AGIs $75k-100k, 11.0% for AGIs over 100k)
Net capital gain/loss: +$27,958 (reported on 31.4% of returns)
Here:
+$27,958
State:
+$15,835
(% of AGI for various income ranges: -3.8% for AGIs below $10k, 1.4% for AGIs $10k-25k, 1.2% for AGIs $25k-50k, 2.1% for AGIs $50k-75k, 3.1% for AGIs $75k-100k, 14.6% for AGIs over 100k)
Profit/loss from business: +$26,360 (reported on 15.0% of returns)
Here:
+$26,360
State:
+$13,994
(% of AGI for various income ranges: 9.6% for AGIs below $10k, 4.1% for AGIs $10k-25k, 4.1% for AGIs $25k-50k, 5.3% for AGIs $50k-75k, 5.9% for AGIs $75k-100k, 5.0% for AGIs over 100k)
IRA payment deduction: $2,907 (reported on 2.6% of returns)
98105:
$2,907
Washington:
$3,001
(% of AGI for various income ranges: 0.4% for AGIs below $10k, 0.3% for AGIs $10k-25k, 0.3% for AGIs $25k-50k, 0.2% for AGIs $50k-75k, 0.2% for AGIs $75k-100k, 0.0% for AGIs over 100k)
Self-employed pension: $19,005 (reported on 2.7% of returns)
Here:
$19,005
Washington:
$14,244
(% of AGI for various income ranges: 0.6% for AGIs below $10k, 0.2% for AGIs $25k-50k, 0.3% for AGIs $50k-75k, 0.5% for AGIs $75k-100k, 0.8% for AGIs over 100k)
Total itemized deductions: $32,196 (17% of AGI, reported on 32.0% of returns)
Here:
$32,196
State:
$19,669
Here:
17.0% of AGI
State:
20.7% of AGI
(% of AGI for various income ranges: 18.8% for AGIs below $10k, 8.2% for AGIs $10k-25k, 10.4% for AGIs $25k-50k, 15.9% for AGIs $50k-75k, 17.9% for AGIs $75k-100k, 12.9% for AGIs over 100k)
Charity contributions deductions: $10,639 (5% of AGI, reported on 28.4% of returns)
Here:
$10,639
State:
$3,569
Here:
5.2% of AGI
State:
3.5% of AGI
(% of AGI for various income ranges: 0.9% for AGIs below $10k, 0.7% for AGIs $10k-25k, 1.0% for AGIs $25k-50k, 1.7% for AGIs $50k-75k, 2.0% for AGIs $75k-100k, 4.8% for AGIs over 100k)
Total tax: $18,085 (reported on 78.3% of returns)
98105:
$18,085
State:
$9,065
(% of AGI for various income ranges: 5.0% for AGIs below $10k, 5.5% for AGIs $10k-25k, 9.2% for AGIs $25k-50k, 11.7% for AGIs $50k-75k, 12.2% for AGIs $75k-100k, 21.0% for AGIs over 100k)
Earned income credit: $839 (reported on 5.6% of returns)
Here:
$839
State:
$1,607
Percentage of individuals using paid preparers for their 2004 taxes: 35.7%
Here:
36%
State:
49%
(% for various income ranges: 24.6% for AGIs below $10k, 27.4% for AGIs $10k-25k, 31.4% for AGIs $25k-50k, 41.6% for AGIs $50k-75k, 43.2% for AGIs $75k-100k, 63.0% for AGIs over 100k)
Likely homosexual households (counted as self-reported same-sex unmarried-partner households)
Lesbian couples: 0.1% of all households
Gay men: 0.3% of all households
Household received Food Stamps/SNAP in the past 12 months: 1,079 Household did not receive Food Stamps/SNAP in the past 12 months: 17,377
Women who had a birth in the past 12 months: 269 (257 now married, 17 unmarried) Women who did not have a birth in the past 12 months: 18,761 (3,173 now married, 15,741 unmarried)
Housing units in zip code 98105 with a mortgage: 3,738 (494 second mortgage, 481 both second mortgage and home equity loan) Houses without a mortgage: 92
Median monthly owner costs for units with a mortgage: $3,961 Median monthly owner costs for units without a mortgage: $1,350
Residents with income below the poverty level in 2022:
This zip code:
26.9%
Whole state:
10.0%
Residents with income below 50% of the poverty level in 2022:
This zip code:
7.1%
Whole state:
4.6%
Median number of rooms in houses and condos:
Here:
8.0
State:
6.5
Median number of rooms in apartments:
Here:
2.9
State:
3.9
Notable locations in this zip code not listed on our city pages
Notable locations in zip code 98105: Red Square (A), University of Washington Golf Driving Range (B), Climbing Rock (C), Gate 3 (D), Gate 4 (E), Gate 8 (F), University Substation (G), University Village (H), West Point Light (I), Webster Point Light (J), Boat Street Marina (K), Executive Moorage (L), Seattle Boat Company Marina (M), Russian House (N), Savery Hall (O), Schmitz Hall (P), Seattle Fire Department Station 17 U District (Q), Seattle Fire Department Station 38 Magnuson Park and Ravenna (R), Seattle Metro Pumping Station (S), Sieg Hall (T). Display/hide their locations on the map
Churches in zip code 98105 include: Saint Stephens Episcopal Church (A), Ravenna United Methodist Church (B), Saint Bridget Church (C), Seattle Community Church (D), Blessed Sacrament Church (E), The Church of Jesus Christ of Latter Day Saints (F), Third Church of Christ Scientist (G), University Baptist Church (H), University Christian Church (I). Display/hide their locations on the map
Parks in zip code 98105 include: Windermere Park (1), Laurelhurst Park (2), Ravenna Park (3), Denny Yard (4), University of Washington Tennis Courts (5), Drumheller Fountain (6), Intramural Sports Field Number 3 (7), Union Bay Natural Area (8), University of Washington Baseball Stadium (9). Display/hide their locations on the map
Tourist attractions (not listed on the city page) : Closecombat Gaming Center (Amusement & Theme Parks; 5228 University Way Northeast) (1), Boreson Barbara J & Associates (Tours & Charters; 925 Northeast Boat Street) (2). Display/hide their approximate locations on the map
4,542 married couples with children.
676 single-parent households (115 men, 561 women).
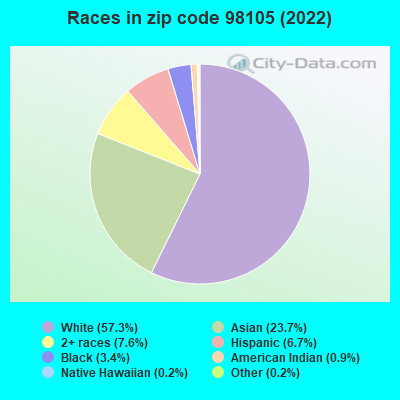
70.8% of residents of 98105 zip code speak English at home.
4.3% of residents speak Spanish at home (87% very well, 10% well, 2% not well).
5.8% of residents speak other Indo-European language at home (88% very well, 5% well, 5% not well, 3% not at all).
16.9% of residents speak Asian or Pacific Island language at home (69% very well, 25% well, 5% not well, 2% not at all).
2.4% of residents speak other language at home (87% very well, 7% well, 6% not well).
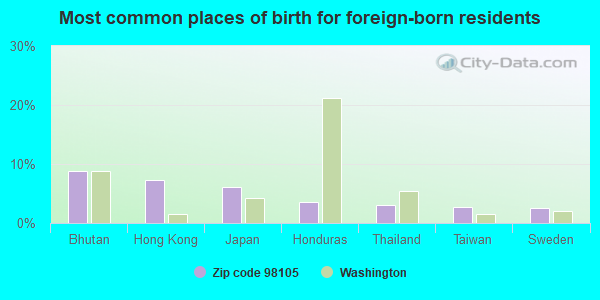
Foreign born population: 11,608 (22.8%) (28.4% of them are naturalized citizens)
Major facilities with environmental interests located in this zip code:
15TH AVE NE DRUG LAB (4337 15TH AVE NE 501 in SEATTLE, WA)
Conditionally Exempt Small Quantity Generators, less than 100 kg/month of hazardous waste (Resource Conservation and Recovery Act (tracking hazardous waste)) STATE MASTER (Washington State Department of Ecology's Facility/Site identification system) - HAZWASTE-WAD988510988, CESQG Business SIC classification: NONCLASSIFIABLE ESTABLISHMENTS Organizations: WA ECY (CONTACT/ HAZARDOUS WASTE)
, KAREN RENNAKER (CONTACT/OPERATOR)
CHEVRON 90129 (4700 BROOKLYN AVE NE in SEATTLE, WA)
(Resource Conservation and Recovery Act (tracking hazardous waste)) STATE MASTER (Washington State Department of Ecology's Facility/Site identification system) - TOXICS-5046, LEAKING STORAGE TANK, UNDERGROUND STORAGE TANK PROGRAM, HAZWASTE-WAD988489480, EPCRA, HAZARDOUS WASTE PROGRAM Business SIC classification: GASOLINE SERVICE STATIONS Organizations: APSI (CONTACT/OPERATOR)
, CHEVRON PRODUCTS CO (CONTACT/OWNER)
Alternative names: CHEVRON 0129
ARNE LARSSON MARINE LLC (1005 NE BOAT STREET in SEATTLE, WA)
National Pollutant Discharge Elimination System NON-MAJOR (Tracking pollutant discharge elimination systems) - permit STATE MASTER (Washington State Department of Ecology's Facility/Site identification system) - WATQUAL-WAG030004, National Pollutant Discharge Elimination System Permit Business SIC classification: DAIRY FARMS; BOAT BUILDING AND REPAIRING Alternative names: ARNE LARSON MARINE, ARNE LARSSON MARINE PAINTING & DRYDOCK, ARNE LARSSON MARINE PD BOAT ST
CALVARY CEMETERY (5041 35TH AVE NE in SEATTLE, WA)
(Resource Conservation and Recovery Act (tracking hazardous waste)) STATE MASTER (Washington State Department of Ecology's Facility/Site identification system) - TOXICS-4982, UNDERGROUND STORAGE TANK PROGRAM Business SIC classification: CEMETERY SUBDIVIDERS AND DEVELOPERS Organizations: MARTIN MURPHY (CONTACT/OPERATOR)
, ARCHDIOCESE OF SEATTLE (CONTACT/OWNER)
CARSON CLEANERS INC (4701 BROOKLYN AVE NE in SEATTLE, WA)
(Resource Conservation and Recovery Act (tracking hazardous waste)) STATE MASTER (Washington State Department of Ecology's Facility/Site identification system) - HAZWASTE-WAD027417716, CESQG Business SIC classification: DRYCLEANING PLANTS, EXCEPT RUG CLEANING Organizations: ROBERT CARSON (CONTACT/OPERATOR)
CHIHULY INCORPORATED (509 NE NORTHLAKE WAY in SEATTLE, WA)
(Resource Conservation and Recovery Act (tracking hazardous waste)) STATE MASTER (Washington State Department of Ecology's Facility/Site identification system) - HAZWASTE-WAR000011676, HAZARDOUS WASTE PROGRAM Business SIC classification: PRESSED AND BLOWN GLASS AND GLASSWARE; BOAT BUILDING AND REPAIRING Business NAICS classification: OTHER PRESSED AND BLOWN GLASS AND GLASSWARE MANUFACTURING.; OTHER PRESSED AND BLOWN GLASS AND GLASSWARE MANUFACTURING. Organizations: MARK BENNETT (CONTACT/OPERATOR)
Alternative names: POCOCK RACING SHELLS INC
BP SERVICE STATION 11061 (5100 25TH AVENUE NORTHEAST in SEATTLE, WA)
Conditionally Exempt Small Quantity Generators, less than 100 kg/month of hazardous waste (Resource Conservation and Recovery Act (tracking hazardous waste)) STATE MASTER (Washington State Department of Ecology's Facility/Site identification system) - TOXICS-10162, LEAKING STORAGE TANK, UNDERGROUND STORAGE TANK PROGRAM, HAZWASTE-WAD988487138, EPCRA, HAZARDOUS WASTE PROGRAM Business SIC classification: GASOLINE SERVICE STATIONS Organizations: MOHAMMED KHAN (CONTACT/OPERATOR)
, CONOCOPHILLIPS COMPANY (CONTACT/OWNER)
Alternative names: TOSCO 1106130125
CAMPUS CLEANERS (4100 ROOSEVELT WAY NE in SEATTLE, WA)
USED OIL PROGRAM (Resource Conservation and Recovery Act (tracking hazardous waste)) STATE MASTER (Washington State Department of Ecology's Facility/Site identification system) - HAZWASTE-WAD144253283, CESQG Business SIC classification: POWER LAUNDRIES, FAMILY AND COMMERCIAL; DRYCLEANING PLANTS, EXCEPT RUG CLEANING; LAUNDRY AND GARMENT SERVICES Organizations: EDWARD KIM (CONTACT/OPERATOR)
CARLS FOREIGN CAR SERVICE INC (2605 NE 55TH ST in SEATTLE, WA)
Conditionally Exempt Small Quantity Generators, less than 100 kg/month of hazardous waste (Resource Conservation and Recovery Act (tracking hazardous waste)) - notification STATE MASTER (Washington State Department of Ecology's Facility/Site identification system) - HAZWASTE-WAD988492153, CESQG Business SIC classification: GENERAL AUTOMOTIVE REPAIR SHOPS Business NAICS classification: GENERAL AUTOMOTIVE REPAIR.; GENERAL AUTOMOTIVE REPAIR. Organizations: CARL HATCHER (CONTACT/OPERATOR)
CHILDRENS HOSPITAL & REGIONAL MED CTR (4800 SANDPOINT WAY NE in SEATTLE, WA)
Small Quantity Generators, between 100 kg and 1000 kg of hazardous waste/month (Resource Conservation and Recovery Act (tracking hazardous waste)) - notification STATE MASTER (Washington State Department of Ecology's Facility/Site identification system) - HAZWASTE-WAD048682157, EPCRA, HAZARDOUS WASTE PROGRAM, SQG Business SIC classification: SPECIALTY HOSPITALS, EXCEPT PSYCHIATRIC Organizations: JANICE HIGHTOWER (CONTACT/OPERATOR)
, CHILDRENS HOSPITAL & REGIONAL MEDICAL CT (CONTACT/OWNER)
COMMERCIAL BLDG (1104 NE 47TH ST 4700 THRU 04 11TH AVE NE in SEATTLE, WA)
(Integrated Compliance Information System) - ICIS-10-1988-0009, FORMAL ENFORCEMENT ACTION
ABHE SVOBODA INC FUHRMAN AVE (L SIDE OF FUHRMAN AVE .5 BLCK in SEATTLE, WA)
BERNIES CAMERA (4770 UNIVERSITY VLG PL NE in SEATTLE, WA)
(Resource Conservation and Recovery Act (tracking hazardous waste)) Business NAICS classification: PHOTOGRAPHIC FILM, PAPER, PLATE, AND CHEMICAL MANUFACTURING. Organizations: BERNARD TONKON (CONTACT/OPERATOR)
Housing units lacking complete plumbing facilities: 0.7% Housing units lacking complete kitchen facilities: 5.2%
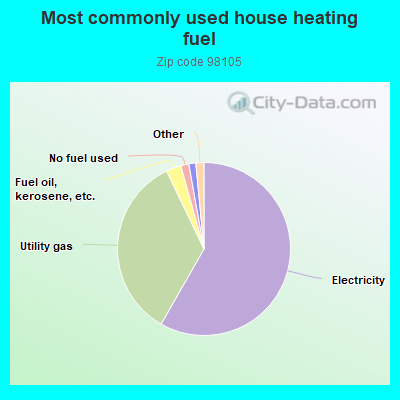
58.2%Electricity
34.6%Utility gas
2.8%Fuel oil, kerosene, etc.
1.5%No fuel used
1.3%Bottled, tank, or LP gas
0.7%Solar energy
0.5%Wood
Population in 1990: 37,120. Population change in the 1990s: +1,843 (+5.0%).
Place of birth for U.S.-born residents:
This state: 18,389
Northeast: 3,143
Midwest: 3,860
South: 3,121
West: 10,096
31% of the 98105 zip code residents lived in the same house 5 years ago. Out of people who lived in different houses, 44% lived in this county. Out of people who lived in different counties, 50% lived in Washington.
77% of the 98105 zip code residents lived in the same house 1 year ago. Out of people who lived in different houses, 49% moved from this county. Out of people who lived in different houses, 7% moved from different county within same state. Out of people who lived in different houses, 32% moved from different state. Out of people who lived in different houses, 11% moved from abroad.
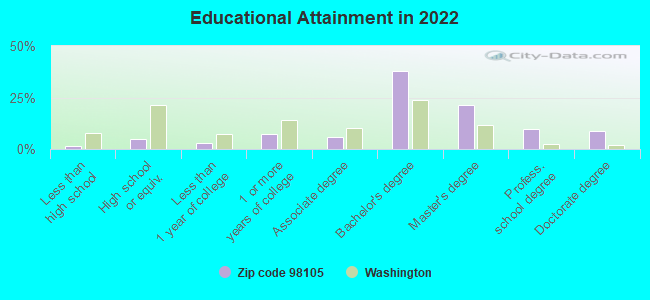
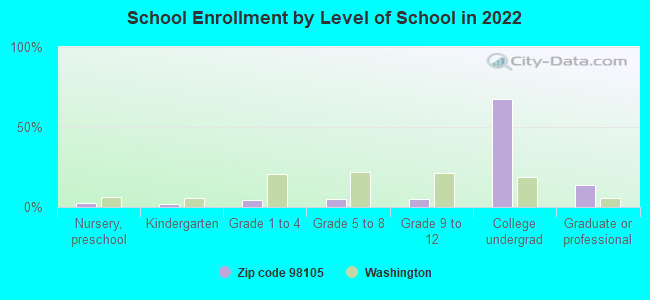
Private vs. public school enrollment:
Students in private schools in grades 1 to 8 (elementary and middle school): 897
Here:
39.3%
Washington:
12.4%
Students in private schools in grades 9 to 12 (high school): 247
Here:
20.9%
Washington:
9.2%
Students in private undergraduate colleges: 1,405
Here:
8.7%
Washington:
16.5%
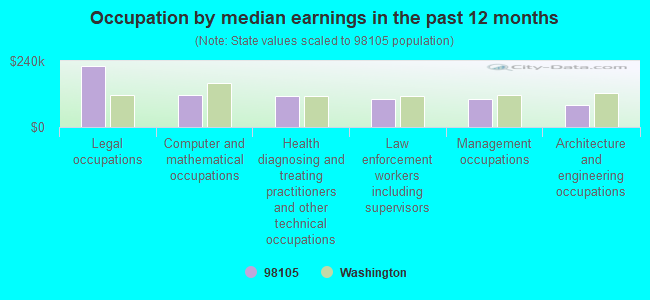
Occupation by median earnings in the past 12 months ($)
223,058Legal occupations
115,726Computer and mathematical occupations
113,608Health diagnosing and treating practitioners and other technical occupations
103,086Law enforcement workers including supervisors
102,614Management occupations
81,279Architecture and engineering occupations
Companies with biggest federal contracts located in this zip code (SEATTLE, WA):
BATTELLE (4500 SAND POINT WAY, N.E.) : $3,814,723 in 32 contractsfrom 2004 to 2006
Contracts for Health Services -- Applied Research and Exploratory Development (R&D), Health Services -- Basic Research (R&D) by Centers for Disease Control and Prevention Signed by year:2000: $0; 2001: $0; 2002: $0; 2003: $0; 2004: $400,875; 2005: $1,496,125; 2006: $1,917,723.
Biggest contracts:
$1,892,155 with Centers for Disease Control and Prevention for Health Services -- Applied Research and Exploratory Development (R&D). Signed on 2006-03-07. Completion date: 2006-04-30.
$1,000,000, same as above.Signed on 2005-10-12. Completion date: 2006-10-06.
$185,000, same as above.Signed on 2005-09-16. Completion date: 2006-10-31.
$103,965, same as above.Signed on 2004-08-19. Completion date: 2010-07-19.
TUG MASTER, INC (653 NE NORTHLAKE WAY) : $672,400 in 2 contractsin 2003
$347,400 with Navy for Marine Charter for Things. Signed on 2003-07-23. Completion date: 2003-03-21.
$325,000, same as above.Signed on 2003-08-21. Completion date: 2003-03-28.
BECHRIS INCORPORATED (4350 53RD NE; small business) : $387,250 in 5 contractsfrom 2001 to 2004
Contracts for Safety and Rescue Equipment, Miscellaneous Printed Matter by Defense Logistics Agency Signed by year:2000: $0; 2001: $65,275; 2002: $0; 2003: $0; 2004: $321,975; 2005: $0; 2006: $0.
Biggest contracts:
$99,000 with Defense Logistics Agency for Safety and Rescue Equipment. Signed on 2004-08-20. Completion date: 2004-08-30.
$88,000 with Defense Logistics Agency for Miscellaneous Printed Matter. Signed on 2004-01-20. Completion date: 2004-02-29.
$70,400 with Defense Logistics Agency for Safety and Rescue Equipment. Signed on 2004-03-06. Completion date: 2004-03-16.
$65,275 with Defense Logistics Agency for Miscellaneous Printed Matter. Signed on 2001-06-22. Completion date: 2001-08-29.
MAMMOGRAPHY REPORTING SYSTEM, (4526 11TH AVENUE NE; small business) : $367,618 in 70 contractsfrom 2002 to 2006
Contracts for Medical and Surgical Instruments, Equipment, and Supplies, ADP Software, Other Education and Training Services, Radiology Services, and moreby Army, Department of Veterans Affairs, Navy, Air Force, and others Signed by year:2000: $0; 2001: $0; 2002: $10,385; 2003: $46,825; 2004: $74,745; 2005: $217,088; 2006: $18,575.
Biggest contracts:
$46,650 with Army for Medical and Surgical Instruments, Equipment, and Supplies. Taking place in TX. Signed on 2005-09-19. Completion date: 2005-10-31.
$26,500 with Department of Veterans Affairs for Medical and Surgical Instruments, Equipment, and Supplies. Signed on 2003-11-12. Completion date: 2003-12-12.
$22,000 with Navy for ADP Software. Signed on 2005-05-25. Completion date: 2005-05-23.
$16,500, same as above.Signed on 2005-07-12. Completion date: 2005-07-12.
MIDDLE EAST INTERNATIONAL SERVICES (4900 9TH AVE NE STE 300)
$90,000 with Offices, Boards and Divisions (includes Attorney General, Deputy Attorney General, etc.) for Legal Services. Taking place in NY. Signed on 2004-10-30. Completion date: 2005-09-30.
AIKEN DESIGN (5002 20TH AVENUE N E; small business) : $47,390 in 7 contractsfrom 2002 to 2004
Contracts for Other Professional Services, Personal Care Services (includes such services as barber and beauty shop, shoe repairs, tailoring, etc.) by Navy Signed by year:2000: $0; 2001: $0; 2002: $23,660; 2003: $17,780; 2004: $5,950; 2005: $0; 2006: $0.
Biggest contracts:
$13,200 with Navy for Other Professional Services. Taking place in CA. Signed on 2002-07-19. Completion date: 2003-07-14.
$12,350, same as above.Signed on 2003-07-02. Completion date: 2004-07-02.
$10,460, same as above.Signed on 2002-09-25. Completion date: 2003-07-14.
$3,400 with Navy for Other Professional Services. Signed on 2004-03-16. Completion date: 2004-07-19.
SEATOWN, INC (840 NE 56TH ST; small business) : $42,092 in 2 contractsin 2003
$21,046 with U.S. Army Corps of Engineers - civil program financing only for Communications Security Equipment and Components. Signed on 2003-01-29. Completion date: 2003-03-28.
$21,046 with U.S. Army Corps of Engineers - civil program financing only for Miscellaneous Alarm, Signal and Security Detection Systems. Signed on 2003-02-28. Completion date: 2003-03-26.
KENDON YACHT SERVICE (205 NE NORTHLAKE WAY; small business)
$41,000 with Navy for Cable, Cord, and Wire Assemblies: Communications Equipment. Signed on 2001-05-29. Completion date: 2001-05-31.
WALID B. FARHOUD (; small business)
$35,000 with Offices, Boards and Divisions (includes Attorney General, Deputy Attorney General, etc.) for Expert Witness. Signed on 2004-03-01. Completion date: 2004-12-31.
PETOSA ACCORDIONS INC (313 NE 45TH ST; small business) : $20,150 in 2 contractsfrom 2004 to 2005
$10,500 with Army for Musical Instruments. Taking place in VA. Signed on 2004-09-16. Completion date: 2004-10-18.
$9,650 with Navy for Musical Instrument Parts and Accessories. Taking place in VA. Signed on 2005-08-31. Completion date: 2006-03-30.
Top industries in this zip code by the number of employees in 2005:
Health Care and Social Assistance: General Medical and Surgical Hospitals (over 1000 employees: 2 establishments)
Professional, Scientific, and Technical Services: Research and Development in the Physical, Engineering, and Life Sciences (100-249: 2, 20-49: 2, 5-9: 2)
Administrative and Support and Waste Management and Remediation Services: Office Administrative Services (250-499: 1, 10-19: 1, 1-4: 3)
People in group quarters in 2010:
8,554 people in college/university student housing
294 people in group homes intended for adults
100 people in other noninstitutional facilities
90 people in emergency and transitional shelters (with sleeping facilities) for people experiencing homelessness
29 people in local jails and other municipal confinement facilities
26 people in residential treatment centers for adults
12 people in workers' group living quarters and job corps centers
2 people in hospitals with patients who have no usual home elsewhere
People in group quarters in 2000:
7,221 people in college dormitories (includes college quarters off campus)
150 people in other noninstitutional group quarters
86 people in other group homes
13 people in homes or halfway houses for drug/alcohol abuse
Fatal accident statistics in 2013:
Fatal accident count: 1
Vehicles involved in fatal accidents: 2
Fatal accidents caused by drunken drivers: 0
Fatalities: 1
Persons involved in fatal accidents: 4
Pedestrians involved in fatal accidents: 0
Fatal accident statistics in 2011:
Fatal accident count: 1
Vehicles involved in fatal accidents: 1
Fatal accidents caused by drunken drivers: 0
Fatalities: 1
Persons involved in fatal accidents: 2
Pedestrians involved in fatal accidents: 1
Home Mortgage Disclosure Act Aggregated Statistics For Year 2009 (Based on 1 full and 14 partial tracts)
A) FHA, FSA/RHS & VA Home Purchase Loans
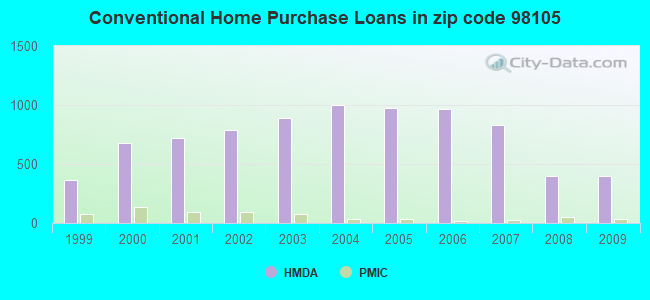
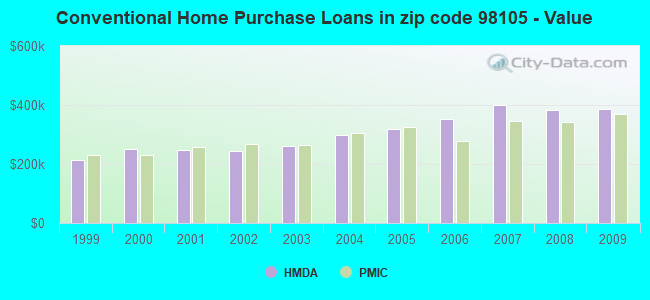
B) Conventional Home Purchase Loans
C) Refinancings
D) Home Improvement Loans
E) Loans on Dwellings For 5+ Families
F) Non-occupant Loans on < 5 Family Dwellings (A B C & D)
G) Loans On Manufactured Home Dwelling (A B C & D)
Number
Average Value
Number
Average Value
Number
Average Value
Number
Average Value
Number
Average Value
Number
Average Value
Number
Average Value
LOANS ORIGINATED
68
$374,714
400
$386,347
1,722
$336,488
50
$231,427
12
$2,556,982
244
$298,763
1
$635,100
APPLICATIONS APPROVED, NOT ACCEPTED
7
$332,219
39
$387,802
149
$319,154
5
$129,968
0
$0
36
$303,374
0
$0
APPLICATIONS DENIED
8
$333,185
67
$409,297
293
$400,159
18
$181,022
4
$755,235
74
$330,349
0
$0
APPLICATIONS WITHDRAWN
11
$349,925
36
$465,731
220
$370,504
8
$233,161
0
$0
34
$328,081
0
$0
FILES CLOSED FOR INCOMPLETENESS
2
$248,770
5
$286,054
56
$348,882
8
$291,394
0
$0
10
$248,842
0
$0
Aggregated Statistics For Year 2008 (Based on 1 full and 14 partial tracts)
A) FHA, FSA/RHS & VA Home Purchase Loans
B) Conventional Home Purchase Loans
C) Refinancings
D) Home Improvement Loans
E) Loans on Dwellings For 5+ Families
F) Non-occupant Loans on < 5 Family Dwellings (A B C & D)
Number
Average Value
Number
Average Value
Number
Average Value
Number
Average Value
Number
Average Value
Number
Average Value
LOANS ORIGINATED
26
$391,595
401
$382,567
712
$376,924
51
$227,695
41
$1,966,668
213
$345,318
APPLICATIONS APPROVED, NOT ACCEPTED
0
$0
54
$373,494
89
$364,655
6
$255,255
0
$0
35
$288,897
APPLICATIONS DENIED
6
$373,293
42
$374,039
208
$405,867
34
$255,663
4
$754,772
75
$332,883
APPLICATIONS WITHDRAWN
3
$252,883
45
$405,414
152
$383,214
11
$120,692
0
$0
33
$322,268
FILES CLOSED FOR INCOMPLETENESS
0
$0
5
$574,120
14
$389,042
5
$137,878
0
$0
3
$93,497
Aggregated Statistics For Year 2007 (Based on 1 full and 12 partial tracts)
B) Conventional Home Purchase Loans
C) Refinancings
D) Home Improvement Loans
E) Loans on Dwellings For 5+ Families
F) Non-occupant Loans on < 5 Family Dwellings (A B C & D)
G) Loans On Manufactured Home Dwelling (A B C & D)
Number
Average Value
Number
Average Value
Number
Average Value
Number
Average Value
Number
Average Value
Number
Average Value
LOANS ORIGINATED
834
$398,430
684
$383,107
81
$170,055
31
$4,177,229
306
$349,772
0
$0
APPLICATIONS APPROVED, NOT ACCEPTED
128
$361,949
85
$307,117
15
$239,781
2
$323,020
49
$299,775
0
$0
APPLICATIONS DENIED
147
$387,985
177
$353,393
32
$221,927
0
$0
95
$362,450
4
$10,228
APPLICATIONS WITHDRAWN
74
$364,137
74
$372,713
11
$121,945
8
$9,867,100
17
$372,786
0
$0
FILES CLOSED FOR INCOMPLETENESS
20
$346,886
32
$416,368
5
$230,914
0
$0
8
$322,769
0
$0
Aggregated Statistics For Year 2006 (Based on 1 full and 14 partial tracts)
A) FHA, FSA/RHS & VA Home Purchase Loans
B) Conventional Home Purchase Loans
C) Refinancings
D) Home Improvement Loans
E) Loans on Dwellings For 5+ Families
F) Non-occupant Loans on < 5 Family Dwellings (A B C & D)
G) Loans On Manufactured Home Dwelling (A B C & D)
Number
Average Value
Number
Average Value
Number
Average Value
Number
Average Value
Number
Average Value
Number
Average Value
Number
Average Value
LOANS ORIGINATED
0
$0
968
$351,575
694
$329,031
96
$207,266
31
$2,417,983
324
$314,038
0
$0
APPLICATIONS APPROVED, NOT ACCEPTED
0
$0
99
$304,389
87
$303,915
13
$131,489
0
$0
35
$271,451
0
$0
APPLICATIONS DENIED
0
$0
108
$335,009
147
$351,908
36
$174,625
7
$459,874
56
$358,324
0
$0
APPLICATIONS WITHDRAWN
2
$258,380
94
$339,638
125
$323,168
13
$123,660
2
$288,415
44
$332,690
2
$218,560
FILES CLOSED FOR INCOMPLETENESS
0
$0
12
$266,469
33
$249,279
6
$190,115
0
$0
3
$290,587
0
$0
Aggregated Statistics For Year 2005 (Based on 1 full and 14 partial tracts)
A) FHA, FSA/RHS & VA Home Purchase Loans
B) Conventional Home Purchase Loans
C) Refinancings
D) Home Improvement Loans
E) Loans on Dwellings For 5+ Families
F) Non-occupant Loans on < 5 Family Dwellings (A B C & D)
G) Loans On Manufactured Home Dwelling (A B C & D)
Number
Average Value
Number
Average Value
Number
Average Value
Number
Average Value
Number
Average Value
Number
Average Value
Number
Average Value
LOANS ORIGINATED
0
$0
978
$319,997
992
$329,481
70
$212,774
28
$1,085,641
354
$326,639
1
$114,530
APPLICATIONS APPROVED, NOT ACCEPTED
0
$0
94
$299,039
106
$309,026
9
$133,906
5
$366,036
38
$327,033
2
$90,755
APPLICATIONS DENIED
0
$0
118
$303,040
195
$330,296
25
$250,426
2
$1,153,650
80
$304,891
0
$0
APPLICATIONS WITHDRAWN
1
$186,930
100
$315,192
157
$295,804
25
$159,557
2
$830,630
45
$359,473
0
$0
FILES CLOSED FOR INCOMPLETENESS
0
$0
21
$295,824
65
$314,063
6
$126,847
0
$0
13
$310,695
0
$0
Aggregated Statistics For Year 2004 (Based on 1 full and 14 partial tracts)
A) FHA, FSA/RHS & VA Home Purchase Loans
B) Conventional Home Purchase Loans
C) Refinancings
D) Home Improvement Loans
E) Loans on Dwellings For 5+ Families
F) Non-occupant Loans on < 5 Family Dwellings (A B C & D)
Number
Average Value
Number
Average Value
Number
Average Value
Number
Average Value
Number
Average Value
Number
Average Value
LOANS ORIGINATED
8
$212,330
997
$297,984
1,111
$279,860
89
$117,160
37
$842,404
365
$258,262
APPLICATIONS APPROVED, NOT ACCEPTED
0
$0
100
$283,031
121
$290,909
7
$141,199
3
$1,608,313
34
$272,556
APPLICATIONS DENIED
0
$0
122
$298,346
203
$290,238
10
$126,874
0
$0
78
$266,018
APPLICATIONS WITHDRAWN
0
$0
84
$301,163
132
$267,782
12
$128,642
1
$715,120
35
$309,168
FILES CLOSED FOR INCOMPLETENESS
0
$0
8
$385,941
65
$267,487
9
$135,753
0
$0
10
$299,051
Aggregated Statistics For Year 2003 (Based on 1 full and 14 partial tracts)
A) FHA, FSA/RHS & VA Home Purchase Loans
B) Conventional Home Purchase Loans
C) Refinancings
D) Home Improvement Loans
E) Loans on Dwellings For 5+ Families
F) Non-occupant Loans on < 5 Family Dwellings (A B C & D)
Number
Average Value
Number
Average Value
Number
Average Value
Number
Average Value
Number
Average Value
Number
Average Value
LOANS ORIGINATED
12
$217,772
893
$260,991
3,556
$240,529
58
$67,431
38
$1,047,634
582
$216,036
APPLICATIONS APPROVED, NOT ACCEPTED
0
$0
73
$248,801
278
$243,662
18
$81,744
2
$511,205
56
$228,959
APPLICATIONS DENIED
3
$256,780
97
$268,059
358
$268,453
18
$43,534
5
$1,055,908
76
$274,877
APPLICATIONS WITHDRAWN
4
$197,062
80
$255,454
282
$235,619
6
$21,443
6
$943,640
55
$246,703
FILES CLOSED FOR INCOMPLETENESS
0
$0
18
$193,976
62
$229,691
1
$50,810
0
$0
14
$239,274
Aggregated Statistics For Year 2002 (Based on 1 full and 14 partial tracts)
A) FHA, FSA/RHS & VA Home Purchase Loans
B) Conventional Home Purchase Loans
C) Refinancings
D) Home Improvement Loans
E) Loans on Dwellings For 5+ Families
F) Non-occupant Loans on < 5 Family Dwellings (A B C & D)
Number
Average Value
Number
Average Value
Number
Average Value
Number
Average Value
Number
Average Value
Number
Average Value
LOANS ORIGINATED
13
$182,118
784
$245,426
2,394
$246,315
50
$39,862
38
$924,219
385
$219,697
APPLICATIONS APPROVED, NOT ACCEPTED
2
$136,900
67
$221,151
243
$253,638
12
$55,168
2
$188,430
43
$244,822
APPLICATIONS DENIED
0
$0
46
$248,136
262
$241,553
24
$46,852
4
$822,760
72
$256,125
APPLICATIONS WITHDRAWN
0
$0
58
$266,492
216
$252,486
2
$20,455
3
$690,807
40
$209,274
FILES CLOSED FOR INCOMPLETENESS
0
$0
15
$277,414
57
$240,308
2
$36,150
0
$0
15
$226,911
Aggregated Statistics For Year 2001 (Based on 1 full and 12 partial tracts)
A) FHA, FSA/RHS & VA Home Purchase Loans
B) Conventional Home Purchase Loans
C) Refinancings
D) Home Improvement Loans
E) Loans on Dwellings For 5+ Families
F) Non-occupant Loans on < 5 Family Dwellings (A B C & D)
Number
Average Value
Number
Average Value
Number
Average Value
Number
Average Value
Number
Average Value
Number
Average Value
LOANS ORIGINATED
15
$207,166
719
$248,470
1,712
$236,073
139
$48,459
20
$1,127,391
306
$222,532
APPLICATIONS APPROVED, NOT ACCEPTED
0
$0
68
$233,106
155
$218,083
19
$46,532
3
$628,587
24
$173,444
APPLICATIONS DENIED
2
$192,875
46
$227,590
228
$225,502
42
$48,111
2
$61,530
54
$195,972
APPLICATIONS WITHDRAWN
4
$185,965
38
$233,453
178
$224,094
6
$80,673
0
$0
25
$232,976
FILES CLOSED FOR INCOMPLETENESS
0
$0
14
$379,419
84
$208,177
5
$83,382
3
$569,467
19
$236,016
Aggregated Statistics For Year 2000 (Based on 1 full and 12 partial tracts)
A) FHA, FSA/RHS & VA Home Purchase Loans
B) Conventional Home Purchase Loans
C) Refinancings
D) Home Improvement Loans
E) Loans on Dwellings For 5+ Families
F) Non-occupant Loans on < 5 Family Dwellings (A B C & D)
Number
Average Value
Number
Average Value
Number
Average Value
Number
Average Value
Number
Average Value
Number
Average Value
LOANS ORIGINATED
15
$183,427
677
$250,537
335
$215,871
154
$46,292
27
$596,589
157
$210,242
APPLICATIONS APPROVED, NOT ACCEPTED
2
$129,210
57
$258,049
52
$220,422
35
$41,573
1
$400,000
30
$253,304
APPLICATIONS DENIED
0
$0
65
$230,927
113
$241,954
52
$71,736
0
$0
54
$252,401
APPLICATIONS WITHDRAWN
4
$167,405
52
$236,217
65
$222,244
13
$93,686
0
$0
20
$311,615
FILES CLOSED FOR INCOMPLETENESS
2
$118,085
12
$265,108
28
$196,361
0
$0
0
$0
7
$260,461
Aggregated Statistics For Year 1999 (Based on 1 full and 7 partial tracts)
A) FHA, FSA/RHS & VA Home Purchase Loans
B) Conventional Home Purchase Loans
C) Refinancings
D) Home Improvement Loans
E) Loans on Dwellings For 5+ Families
F) Non-occupant Loans on < 5 Family Dwellings (A B C & D)
2003 - 2018 National Fire Incident Reporting System (NFIRS) incidents
Based on the data from the years 2003 - 2018 the average number of fires per year is 86. The highest number of fire incidents - 131 took place in 2004, and the least - 15 in 2003. The data has a growing trend.
When looking into fire subcategories, the most incidents belonged to: Outside Fires (55.3%), and Structure Fires (25.9%).
Fire incident types reported to NFIRS in Zip Code 98105


 Nearest zip codes: 98115, 98112, 98195, 98102, 98122, 98039.


 Based on the data from the years 2003 - 2018 the average number of fires per year is 86. The highest number of fire incidents - 131 took place in 2004, and the least - 15 in 2003. The data has a growing trend.
 When looking into fire subcategories, the most incidents belonged to: Outside Fires (55.3%), and Structure Fires (25.9%).