Estimated zip code population in 2022: 3,325 Zip code population in 2010: 3,001 Zip code population in 2000: 2,339
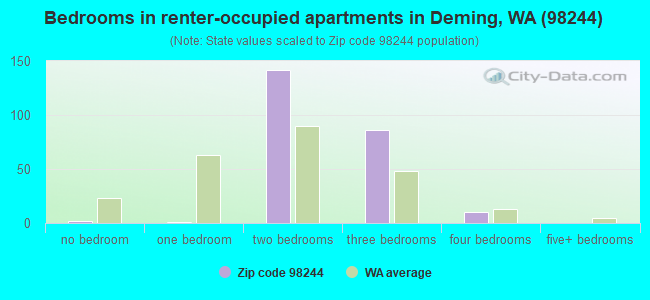
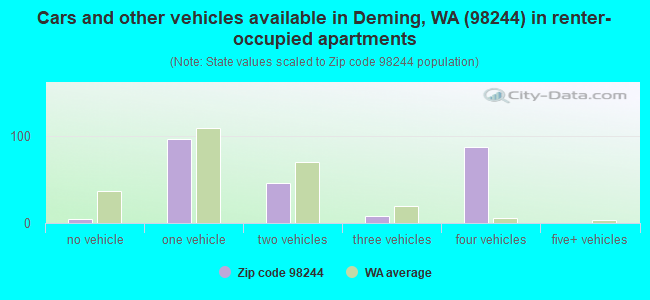
Houses and condos: 2,032 Renter-occupied apartments: 245
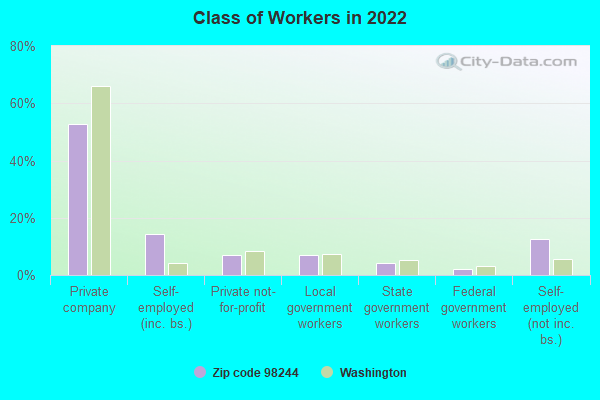
% of renters here:
18%
State:
36%
March 2022 cost of living index in zip code 98244: 90.4 (less than average, U.S. average is 100)
Land area: 488.0 sq. mi. Water area: 5.0 sq. mi.
Population density: 7 people per square mile
(very low).
OSM Map
General Map
Google Map
MSN Map
OSM Map
General Map
Google Map
MSN Map
OSM Map
General Map
Google Map
MSN Map
OSM Map
General Map
Google Map
MSN Map
Please wait while loading the map...
Real estate property taxes paid for housing units in 2022:
This zip code:
0.6% ($3,141)
Washington:
0.8% ($4,283)
Median real estate property taxes paid for housing units with mortgages in 2022: $3,464 (0.7%) Median real estate property taxes paid for housing units with no mortgage in 2022: $2,146 (0.6%)
Business Search- 14 Million verified businesses
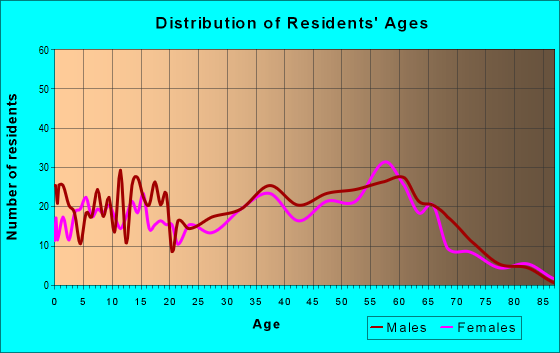
Males: 1,563
(47.0%)
Females: 1,761
(53.0%)
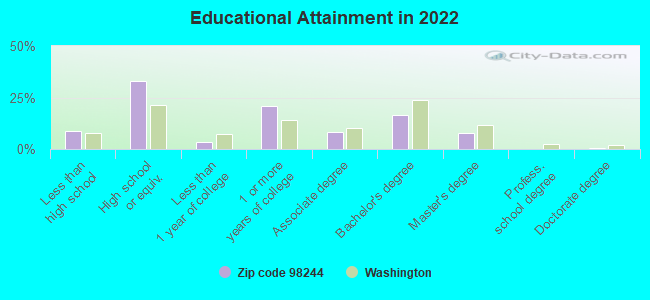
For population 25 years and over in 98244:
High school or higher: 89.9%
Bachelor's degree or higher: 24.8%
Graduate or professional degree: 8.5%
Unemployed: 0.4%
Mean travel time to work (commute): 29.3 minutes
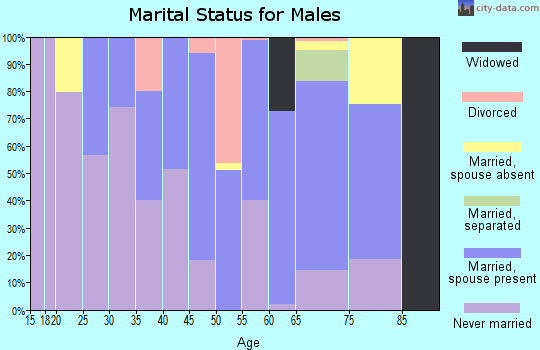
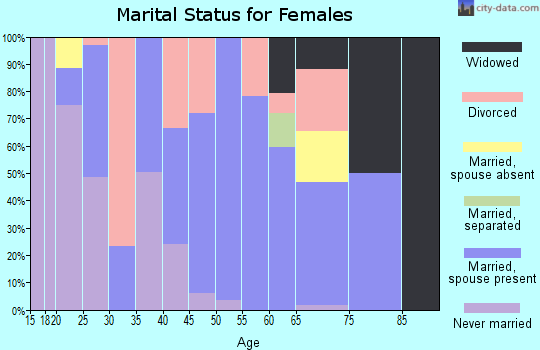
For population 15 years and over in 98244:
Never married: 28.0%
Now married: 47.0%
Separated: 0.5%
Widowed: 10.3%
Divorced: 14.2%
Zip code 98244 compared to state average:
Unemployed percentage significantly below state average.
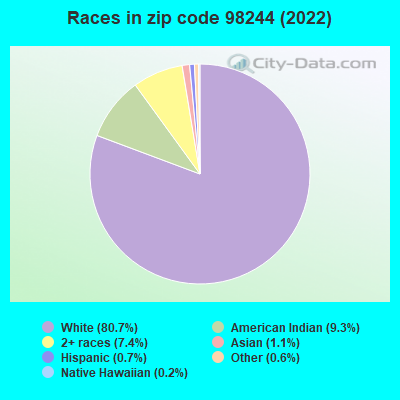
Black race population percentage significantly below state average.
Hispanic race population percentage significantly below state average.
Median age significantly above state average.
Foreign-born population percentage significantly below state average.
Renting percentage below state average.
Length of stay since moving in significantly above state average.
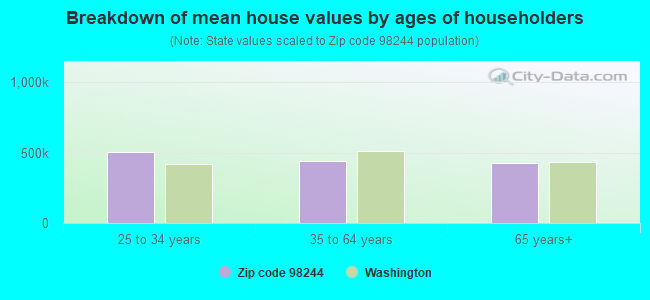
Estimated median house/condo value in 2022: $491,546
98244:
$491,546
Washington:
$569,500
According to our research of Washington and other state lists, there were 3 registered sex offenders living in 98244 zip code as of May 13, 2024. The ratio of all residents to sex offenders in zip code 98244 is 1,051 to 1. The ratio of registered sex offenders to all residents in this zip code is near the state average.
Median resident age:
This zip code:
48.8 years
Washington median age:
38.4 years
Average household size:
This zip code:
2.5 people
Washington:
2.5 people
Averages for the 2020 tax year for zip code 98244, filed in 2021:
Average Adjusted Gross Income (AGI) in 2020: $70,205 (Individual Income Tax Returns)
Here:
$70,205
State:
$99,264
Salary/wage: $52,292 (reported on 75.9% of returns)
Here:
$52,292
State:
$80,347
(% of AGI for various income ranges: 1165.8% for AGIs below $25k, 3314.8% for AGIs $25k-50k, 6292.7% for AGIs $50k-75k, 9537.0% for AGIs $75k-100k, 16120.0% for AGIs $100k-200k)
Taxable interest for individuals: $1,678 (reported on 33.8% of returns)
This zip code:
$1,678
Washington:
$2,077
(% of AGI for various income ranges: 30.0% for AGIs below $25k, 43.2% for AGIs $25k-50k, 27.3% for AGIs $50k-75k, 45.0% for AGIs $75k-100k, 144.0% for AGIs $100k-200k)
Ordinary dividends: $4,485 (reported on 19.5% of returns)
Here:
$4,485
State:
$10,013
(% of AGI for various income ranges: 65.8% for AGIs below $25k, 35.6% for AGIs $25k-50k, 80.0% for AGIs $50k-75k, 241.0% for AGIs $75k-100k, 211.0% for AGIs $100k-200k)
Net capital gain/loss in AGI: +$36,327 (reported on 19.5% of returns)
Here:
+$36,327
State:
+$40,092
(% of AGI for various income ranges: 37.3% for AGIs below $25k, 63.6% for AGIs $25k-50k, 329.3% for AGIs $50k-75k, 259.0% for AGIs $75k-100k, 1307.0% for AGIs $100k-200k)
Profit/loss from business: +$9,382 (reported on 16.5% of returns)
Here:
+$9,382
State:
+$18,312
(% of AGI for various income ranges: 171.2% for AGIs below $25k, 190.4% for AGIs $25k-50k, 319.3% for AGIs $50k-75k, 403.0% for AGIs $75k-100k, 261.0% for AGIs $100k-200k)
Taxable individual retirement arrangement distribution: $18,791 (reported on 8.3% of returns)
98244:
$18,791
Washington:
$24,221
(% of AGI for various income ranges: 251.2% for AGIs $25k-50k, 331.0% for AGIs $75k-100k, 1108.0% for AGIs $100k-200k)
Total itemized deductions: $34,000 (reported on 6.0% of returns)
Here:
$34,000
State:
$39,068
(% of AGI for various income ranges: 771.3% for AGIs $50k-75k, 1563.0% for AGIs $100k-200k)
Charity contributions: $5,675 (reported on 3.0% of returns)
Here:
$5,675
State:
$15,331
(% of AGI for various income ranges: 227.0% for AGIs $100k-200k)
Taxes paid: $6,088 (reported on 6.0% of returns)
98244:
$6,088
State:
$7,774
(% of AGI for various income ranges: 104.7% for AGIs $50k-75k, 330.0% for AGIs $100k-200k)
Earned income credit: $1,850 (reported on 12.0% of returns)
Here:
$1,850
State:
$2,020
(% of AGI for various income ranges: 74.6% for AGIs below $25k, 40.8% for AGIs $25k-50k)
Percentage of individuals using paid preparers for their 2020 taxes: 89.5%
Here:
89%
State:
93%
(% for various income ranges: 87.2% for AGIs below $25k, 88.2% for AGIs $25k-50k, 90.9% for AGIs $50k-75k, 87.5% for AGIs $75k-100k, 94.4% for AGIs $100k-200k, 100.0% for AGIs over 200k)
Averages for the 2012 tax year for zip code 98244, filed in 2013:
Average Adjusted Gross Income (AGI) in 2012: $46,613 (Individual Income Tax Returns)
Here:
$46,613
State:
$69,533
Salary/wage: $41,123 (reported on 80.0% of returns)
Here:
$41,123
State:
$57,267
(% of AGI for various income ranges: 77.0% for AGIs below $25k, 74.6% for AGIs $25k-50k, 75.4% for AGIs $50k-75k, 75.5% for AGIs $75k-100k, 60.3% for AGIs $100k-200k)
Taxable interest for individuals: $930 (reported on 34.4% of returns)
This zip code:
$930
Washington:
$1,816
(% of AGI for various income ranges: 1.3% for AGIs below $25k, 0.5% for AGIs $25k-50k, 0.4% for AGIs $50k-75k, 0.4% for AGIs $75k-100k, 1.0% for AGIs $100k-200k)
Ordinary dividends: $2,925 (reported on 16.0% of returns)
Here:
$2,925
State:
$8,163
(% of AGI for various income ranges: 2.0% for AGIs below $25k, 0.9% for AGIs $25k-50k, 0.4% for AGIs $50k-75k, 0.4% for AGIs $75k-100k, 1.5% for AGIs $100k-200k)
Net capital gain/loss in AGI: +$6,740 (reported on 12.0% of returns)
Here:
+$6,740
State:
+$21,568
(% of AGI for various income ranges: 0.3% for AGIs $50k-75k, 2.2% for AGIs $75k-100k, 4.3% for AGIs $100k-200k)
Profit/loss from business: +$9,527 (reported on 17.6% of returns)
Here:
+$9,527
State:
+$16,521
(% of AGI for various income ranges: 8.4% for AGIs below $25k, 5.0% for AGIs $25k-50k, 3.5% for AGIs $50k-75k, 3.6% for AGIs $75k-100k, 1.3% for AGIs $100k-200k)
Taxable individual retirement arrangement distribution: $14,880 (reported on 8.0% of returns)
98244:
$14,880
Washington:
$18,648
(% of AGI for various income ranges: 4.9% for AGIs below $25k, 4.6% for AGIs $50k-75k, 3.1% for AGIs $100k-200k)
Total itemized deductions: $18,494 (24% of AGI, reported on 24.8% of returns)
Here:
$18,494
State:
$23,872
Here:
23.7% of AGI
State:
18.2% of AGI
(% of AGI for various income ranges: 8.8% for AGIs below $25k, 8.5% for AGIs $25k-50k, 10.9% for AGIs $50k-75k, 11.3% for AGIs $75k-100k, 9.7% for AGIs $100k-200k)
Charity contributions: $2,270 (reported on 16.0% of returns)
Here:
$2,270
State:
$4,465
(% of AGI for various income ranges: 0.6% for AGIs below $25k, 0.6% for AGIs $25k-50k, 0.9% for AGIs $50k-75k, 0.7% for AGIs $75k-100k, 0.9% for AGIs $100k-200k)
Taxes paid: $4,332 (reported on 24.8% of returns)
98244:
$4,332
State:
$6,400
(% of AGI for various income ranges: 1.5% for AGIs below $25k, 1.8% for AGIs $25k-50k, 2.5% for AGIs $50k-75k, 2.3% for AGIs $75k-100k, 2.7% for AGIs $100k-200k)
Earned income credit: $1,768 (reported on 17.6% of returns)
Here:
$1,768
State:
$2,073
(% of AGI for various income ranges: 4.9% for AGIs below $25k, 0.9% for AGIs $25k-50k)
Percentage of individuals using paid preparers for their 2012 taxes: 42.4%
Here:
42%
State:
43%
(% for various income ranges: 34.0% for AGIs below $25k, 41.2% for AGIs $25k-50k, 45.5% for AGIs $50k-75k, 50.0% for AGIs $75k-100k, 66.7% for AGIs $100k-200k)
Averages for the 2004 tax year for zip code 98244, filed in 2005:
Average Adjusted Gross Income (AGI) in 2004: $40,263 (Individual Income Tax Returns)
Here:
$40,263
State:
$54,331
Salary/wage: $34,523 (reported on 83.0% of returns)
Here:
$34,523
State:
$45,761
(% of AGI for various income ranges: 82.4% for AGIs below $10k, 79.4% for AGIs $10k-25k, 81.2% for AGIs $25k-50k, 82.9% for AGIs $50k-75k, 73.2% for AGIs $75k-100k, 44.8% for AGIs over 100k)
Taxable interest for individuals: $1,462 (reported on 42.7% of returns)
This zip code:
$1,462
Washington:
$2,110
(% of AGI for various income ranges: 8.0% for AGIs below $10k, 2.9% for AGIs $10k-25k, 1.8% for AGIs $25k-50k, 0.7% for AGIs $50k-75k, 0.8% for AGIs $75k-100k, 1.5% for AGIs over 100k)
Taxable dividends: $1,632 (reported on 21.4% of returns)
Here:
$1,632
State:
$5,879
(% of AGI for various income ranges: 6.5% for AGIs below $10k, 1.3% for AGIs $10k-25k, 0.9% for AGIs $25k-50k, 0.5% for AGIs $50k-75k, 0.6% for AGIs $75k-100k, 0.7% for AGIs over 100k)
Net capital gain/loss: +$13,930 (reported on 18.9% of returns)
Here:
+$13,930
State:
+$15,835
(% of AGI for various income ranges: -3.4% for AGIs below $10k, 1.0% for AGIs $10k-25k, 0.8% for AGIs $25k-50k, 1.6% for AGIs $50k-75k, 8.3% for AGIs $75k-100k, 19.1% for AGIs over 100k)
Profit/loss from business: +$7,963 (reported on 17.8% of returns)
Here:
+$7,963
State:
+$13,994
(% of AGI for various income ranges: 15.8% for AGIs below $10k, 5.6% for AGIs $10k-25k, 2.7% for AGIs $25k-50k, 3.3% for AGIs $50k-75k, 2.7% for AGIs $75k-100k, 3.1% for AGIs over 100k)
IRA payment deduction: $3,417 (reported on 2.0% of returns)
98244:
$3,417
Washington:
$3,001
Total itemized deductions: $15,136 (21% of AGI, reported on 26.6% of returns)
Here:
$15,136
State:
$19,669
Here:
20.9% of AGI
State:
20.7% of AGI
(% of AGI for various income ranges: 15.9% for AGIs below $10k, 8.6% for AGIs $10k-25k, 9.1% for AGIs $25k-50k, 11.3% for AGIs $50k-75k, 13.6% for AGIs $75k-100k, 8.0% for AGIs over 100k)
Charity contributions deductions: $2,000 (2% of AGI, reported on 20.1% of returns)
Here:
$2,000
State:
$3,569
Here:
2.5% of AGI
State:
3.5% of AGI
(% of AGI for various income ranges: 1.0% for AGIs $10k-25k, 0.9% for AGIs $25k-50k, 0.8% for AGIs $50k-75k, 1.2% for AGIs $75k-100k, 1.3% for AGIs over 100k)
Total tax: $5,566 (reported on 75.1% of returns)
98244:
$5,566
State:
$9,065
(% of AGI for various income ranges: 3.7% for AGIs below $10k, 4.2% for AGIs $10k-25k, 6.6% for AGIs $25k-50k, 8.8% for AGIs $50k-75k, 10.2% for AGIs $75k-100k, 18.6% for AGIs over 100k)
Earned income credit: $1,569 (reported on 16.2% of returns)
Here:
$1,569
State:
$1,607
Percentage of individuals using paid preparers for their 2004 taxes: 46.6%
Here:
47%
State:
49%
(% for various income ranges: 39.3% for AGIs below $10k, 41.8% for AGIs $10k-25k, 44.4% for AGIs $25k-50k, 52.9% for AGIs $50k-75k, 55.4% for AGIs $75k-100k, 75.0% for AGIs over 100k)
Household received Food Stamps/SNAP in the past 12 months: 361 Household did not receive Food Stamps/SNAP in the past 12 months: 981
Women who had a birth in the past 12 months: 8 (2 now married, 6 unmarried) Women who did not have a birth in the past 12 months: 636 (335 now married, 299 unmarried)
Housing units in zip code 98244 with a mortgage: 726 (9 second mortgage, 9 both second mortgage and home equity loan) Houses without a mortgage: 8
Median monthly owner costs for units with a mortgage: $1,826 Median monthly owner costs for units without a mortgage: $505
Residents with income below the poverty level in 2022:
This zip code:
11.5%
Whole state:
10.0%
Residents with income below 50% of the poverty level in 2022:
This zip code:
5.9%
Whole state:
4.6%
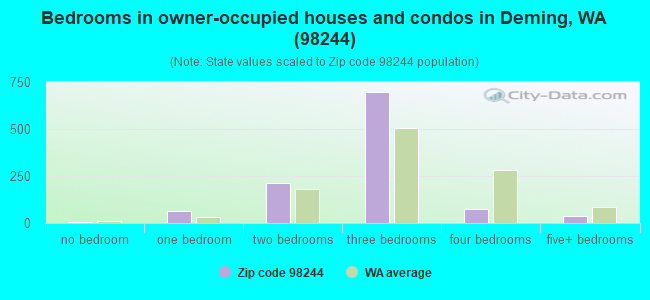
Median number of rooms in houses and condos:
Here:
5.5
State:
6.5
Median number of rooms in apartments:
Here:
4.2
State:
3.9
Notable locations in this zip code not listed on our city pages
Notable locations in zip code 98244: Vista Viewpoint (A), Schriebers Meadow Trailhead (B), Shuksan (C), Nooksack Power Plant (D), Mount Baker Ski Resort (E), Mount Baker Trailhead (F), Mount Baker Vista Picnic Area (G), Galena Camp (H), Glacier Public Service Center (I), Kulshan Cabin (J), Camp Kiser (K), Black Mountain Boy Scout Camp (L), Silver Fir Campground (M), Dillard Point Lookout (N), Sulphur Point Lookout (O), Mount Baker Lodge (P), Nooksack Falls Viewpoint (Q), Case (R), Nooksack Lookout (S), Park Butte Lookout (T). Display/hide their locations on the map
Churches in zip code 98244 include: River of Life Community Church (A), Church of the Nazarene (B), Deming Presbyterian Church (C), Saint Peter Catholic Church (D). Display/hide their locations on the map
Lakes and swamps: Tuckway Lake (A), Pinus Lake (B), Arbuthnet Lake (C), Iceberg Lake (D), Lake Wiseman (E), Williams Lake (F), Jorgensen Lake (G), Lake Doreen (H). Display/hide their locations on the map
Streams, rivers, and creeks: Bar Creek (A), Barometer Creek (B), Black Slough (C), Boulder Creek (D), Cascade Creek (E), Clearwater Creek (F), Cornell Creek (G), Davis Creek (H), Deep Creek (I). Display/hide their locations on the map
308 married couples with children.
25 single-parent households (9 men, 16 women).
95.0% of residents of 98244 zip code speak English at home.
0.4% of residents speak Spanish at home (92% very well, 8% not well).
1.9% of residents speak other Indo-European language at home (100% very well).
1.9% of residents speak Asian or Pacific Island language at home (97% very well, 3% not well).
0.4% of residents speak other language at home (92% very well, 8% well).
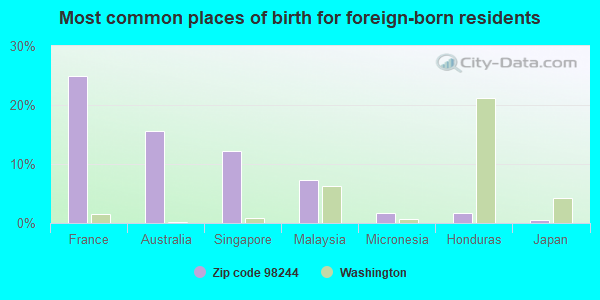
Foreign born population: 180 (5.4%) (50.6% of them are naturalized citizens)
This zip code:
5.4%
Whole state:
15.3%
25%France
16%Australia
12%Singapore
7%Malaysia
2%Micronesia
2%Honduras
1%Japan
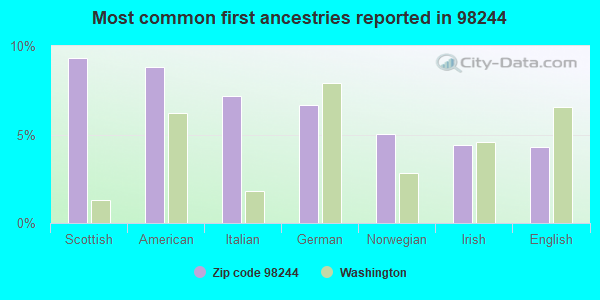
9%Scottish
9%American
7%Italian
7%German
5%Norwegian
4%Irish
4%English
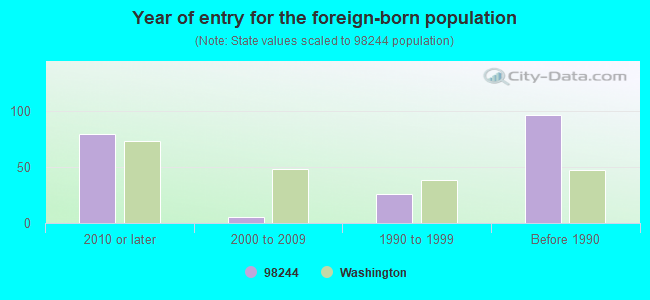
Year of entry for the foreign-born population
792010 or later
52000 to 2009
261990 to 1999
96Before 1990
Housing units lacking complete plumbing facilities: 8.0% Housing units lacking complete kitchen facilities: 8.2%
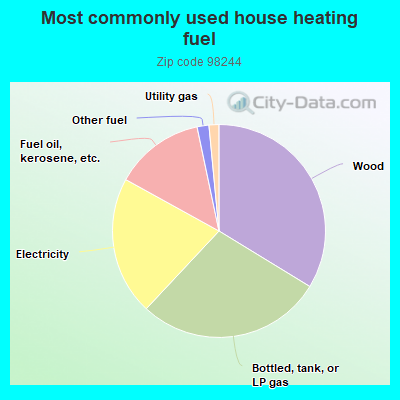
33.8%Wood
28.3%Bottled, tank, or LP gas
21.1%Electricity
13.7%Fuel oil, kerosene, etc.
1.8%Other fuel
1.5%Utility gas
Population in 1990: 2,110. Population change in the 1990s: +229 (+10.9%).
Place of birth for U.S.-born residents:
This state: 2,163
Northeast: 140
Midwest: 252
South: 91
West: 461
59% of the 98244 zip code residents lived in the same house 5 years ago. Out of people who lived in different houses, 69% lived in this county. Out of people who lived in different counties, 50% lived in Washington.
95% of the 98244 zip code residents lived in the same house 1 year ago. Out of people who lived in different houses, 81% moved from this county. Out of people who lived in different houses, 14% moved from different county within same state. Out of people who lived in different houses, 11% moved from different state.
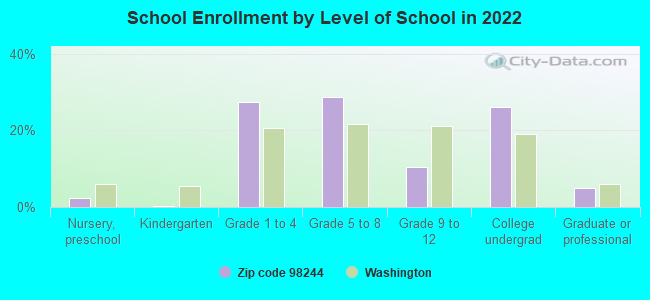
Private vs. public school enrollment:
Students in private schools in grades 1 to 8 (elementary and middle school): 60
Here:
21.9%
Washington:
12.4%
Students in private schools in grades 9 to 12 (high school):
Here:
0.0%
Washington:
9.2%
Students in private undergraduate colleges: 2
Here:
2.0%
Washington:
16.5%
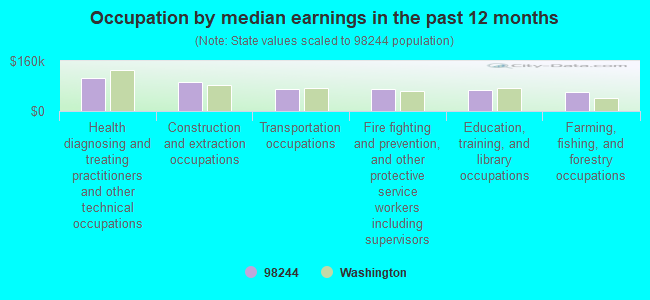
Occupation by median earnings in the past 12 months ($)
106,161Health diagnosing and treating practitioners and other technical occupations
93,825Construction and extraction occupations
71,390Transportation occupations
68,855Fire fighting and prevention, and other protective service workers including supervisors
67,731Education, training, and library occupations
62,116Farming, fishing, and forestry occupations
Companies with federal contracts located in this zip code:
MARTINSON TRUCKING (5276 MOSQUITO LAKE RD in DEMING, WA; small business) : $2,100 in 2 contractsin 2003
$1,050 with U.S. Army Corps of Engineers - civil program financing only for Construction of Structures and Facilities -- Highways, Roads, Streets, Bridges, and Railways (includes resurfacing). Signed on 2003-11-18. Completion date: 2003-10-23.
$1,050 with Army for Construction of Structures and Facilities -- Highways, Roads, Streets, Bridges, and Railways (includes resurfacing). Signed on 2003-11-18. Completion date: 2003-10-23.
Top industries in this zip code by the number of employees in 2005:
Other Services (except Public Administration): Other Similar Organizations (except Business, Professional, Labor, and Political Organizations) (10-19: 2, 1-4: 2)
Accommodation and Food Services: Full-Service Restaurants (10-19: 1, 1-4: 1)
Construction: New Single-Family Housing Construction (except Operative Builders) (5-9: 1, 1-4: 5)
Professional, Scientific, and Technical Services: Engineering Services (10-19: 1)
Construction: New Housing Operative Builders (10-19: 1)
Fatal accident statistics in 2014:
Fatal accident count: 2
Vehicles involved in fatal accidents: 3
Fatal accidents caused by drunken drivers: 1
Fatalities: 3
Persons involved in fatal accidents: 5
Pedestrians involved in fatal accidents: 0
Fatal accident statistics in 2013:
Fatal accident count: 1
Vehicles involved in fatal accidents: 1
Fatal accidents caused by drunken drivers: 0
Fatalities: 1
Persons involved in fatal accidents: 1
Pedestrians involved in fatal accidents: 0
Home Mortgage Disclosure Act Aggregated Statistics For Year 2009 (Based on 2 partial tracts)
A) FHA, FSA/RHS & VA Home Purchase Loans
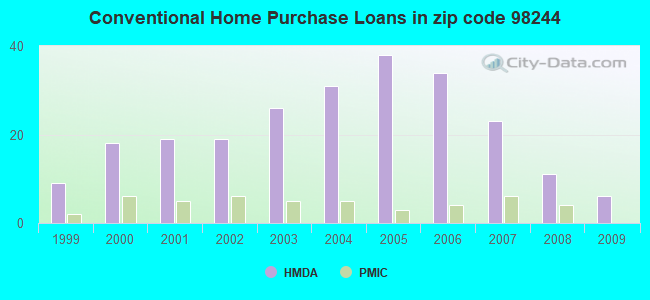
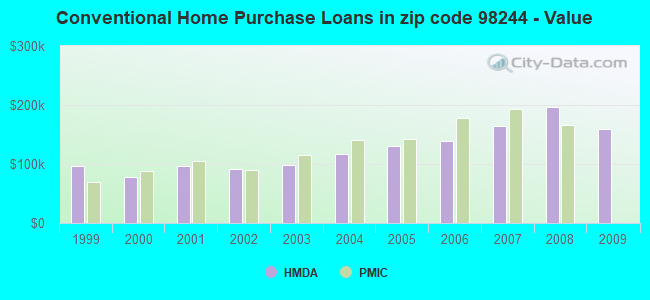
B) Conventional Home Purchase Loans
C) Refinancings
D) Home Improvement Loans
F) Non-occupant Loans on < 5 Family Dwellings (A B C & D)
G) Loans On Manufactured Home Dwelling (A B C & D)
Number
Average Value
Number
Average Value
Number
Average Value
Number
Average Value
Number
Average Value
Number
Average Value
LOANS ORIGINATED
6
$162,973
6
$159,095
42
$184,355
2
$149,720
9
$158,619
8
$118,675
APPLICATIONS APPROVED, NOT ACCEPTED
0
$0
1
$210,560
5
$199,706
0
$0
1
$153,520
1
$130,900
APPLICATIONS DENIED
2
$146,895
2
$121,040
16
$169,680
1
$302,840
2
$113,360
4
$128,270
APPLICATIONS WITHDRAWN
1
$120,880
1
$246,120
10
$211,874
0
$0
1
$202,810
1
$146,890
FILES CLOSED FOR INCOMPLETENESS
0
$0
0
$0
1
$186,650
0
$0
1
$112,640
0
$0
Aggregated Statistics For Year 2008 (Based on 2 partial tracts)
A) FHA, FSA/RHS & VA Home Purchase Loans
B) Conventional Home Purchase Loans
C) Refinancings
D) Home Improvement Loans
F) Non-occupant Loans on < 5 Family Dwellings (A B C & D)
G) Loans On Manufactured Home Dwelling (A B C & D)
Number
Average Value
Number
Average Value
Number
Average Value
Number
Average Value
Number
Average Value
Number
Average Value
LOANS ORIGINATED
3
$220,047
11
$196,535
28
$187,837
3
$103,047
9
$190,544
8
$148,772
APPLICATIONS APPROVED, NOT ACCEPTED
0
$0
2
$176,710
4
$166,368
0
$0
2
$189,395
1
$105,040
APPLICATIONS DENIED
1
$243,850
3
$154,003
16
$171,811
5
$127,438
3
$145,657
5
$136,972
APPLICATIONS WITHDRAWN
1
$73,040
1
$354,550
11
$172,897
1
$53,000
2
$274,155
3
$126,047
FILES CLOSED FOR INCOMPLETENESS
0
$0
0
$0
1
$282,960
0
$0
0
$0
1
$76,110
Aggregated Statistics For Year 2007 (Based on 2 partial tracts)
A) FHA, FSA/RHS & VA Home Purchase Loans
B) Conventional Home Purchase Loans
C) Refinancings
D) Home Improvement Loans
F) Non-occupant Loans on < 5 Family Dwellings (A B C & D)
G) Loans On Manufactured Home Dwelling (A B C & D)
Number
Average Value
Number
Average Value
Number
Average Value
Number
Average Value
Number
Average Value
Number
Average Value
LOANS ORIGINATED
4
$128,592
23
$164,038
30
$163,852
8
$101,565
12
$159,728
11
$113,957
APPLICATIONS APPROVED, NOT ACCEPTED
0
$0
4
$157,922
5
$154,618
1
$128,630
2
$103,180
2
$90,740
APPLICATIONS DENIED
1
$106,820
7
$163,793
17
$162,142
6
$135,420
3
$171,243
5
$112,636
APPLICATIONS WITHDRAWN
0
$0
2
$176,385
8
$154,854
1
$125,400
1
$139,140
3
$104,287
FILES CLOSED FOR INCOMPLETENESS
0
$0
0
$0
2
$145,115
0
$0
0
$0
0
$0
Aggregated Statistics For Year 2006 (Based on 2 partial tracts)
A) FHA, FSA/RHS & VA Home Purchase Loans
B) Conventional Home Purchase Loans
C) Refinancings
D) Home Improvement Loans
F) Non-occupant Loans on < 5 Family Dwellings (A B C & D)
G) Loans On Manufactured Home Dwelling (A B C & D)
Number
Average Value
Number
Average Value
Number
Average Value
Number
Average Value
Number
Average Value
Number
Average Value
LOANS ORIGINATED
4
$129,400
34
$139,504
36
$145,350
7
$70,920
15
$147,939
10
$128,407
APPLICATIONS APPROVED, NOT ACCEPTED
1
$90,980
7
$109,034
6
$127,260
0
$0
2
$86,535
2
$170,405
APPLICATIONS DENIED
0
$0
10
$140,544
20
$121,604
6
$84,275
3
$135,207
7
$93,659
APPLICATIONS WITHDRAWN
0
$0
3
$195,697
13
$137,572
1
$80,800
2
$103,745
2
$119,990
FILES CLOSED FOR INCOMPLETENESS
0
$0
0
$0
3
$176,143
0
$0
0
$0
0
$0
Aggregated Statistics For Year 2005 (Based on 2 partial tracts)
A) FHA, FSA/RHS & VA Home Purchase Loans
B) Conventional Home Purchase Loans
C) Refinancings
D) Home Improvement Loans
F) Non-occupant Loans on < 5 Family Dwellings (A B C & D)
G) Loans On Manufactured Home Dwelling (A B C & D)
Number
Average Value
Number
Average Value
Number
Average Value
Number
Average Value
Number
Average Value
Number
Average Value
LOANS ORIGINATED
4
$107,665
38
$130,904
37
$136,447
6
$73,825
15
$119,218
11
$116,764
APPLICATIONS APPROVED, NOT ACCEPTED
0
$0
8
$90,678
7
$113,420
1
$39,430
1
$62,860
3
$99,493
APPLICATIONS DENIED
1
$63,830
8
$119,846
28
$131,635
4
$52,115
3
$116,890
7
$104,001
APPLICATIONS WITHDRAWN
1
$113,440
4
$111,302
19
$137,998
3
$96,690
1
$157,720
4
$102,292
FILES CLOSED FOR INCOMPLETENESS
0
$0
1
$80,640
5
$128,440
0
$0
0
$0
1
$126,210
Aggregated Statistics For Year 2004 (Based on 2 partial tracts)
A) FHA, FSA/RHS & VA Home Purchase Loans
B) Conventional Home Purchase Loans
C) Refinancings
D) Home Improvement Loans
F) Non-occupant Loans on < 5 Family Dwellings (A B C & D)
G) Loans On Manufactured Home Dwelling (A B C & D)
Number
Average Value
Number
Average Value
Number
Average Value
Number
Average Value
Number
Average Value
Number
Average Value
LOANS ORIGINATED
5
$93,566
31
$116,613
28
$112,202
4
$44,560
11
$92,700
10
$93,841
APPLICATIONS APPROVED, NOT ACCEPTED
0
$0
5
$109,984
7
$120,023
1
$28,600
1
$77,080
3
$72,237
APPLICATIONS DENIED
1
$135,740
8
$108,414
27
$115,005
4
$53,045
4
$90,415
7
$81,954
APPLICATIONS WITHDRAWN
0
$0
4
$148,470
15
$129,581
1
$14,540
1
$152,390
3
$100,353
FILES CLOSED FOR INCOMPLETENESS
0
$0
1
$146,410
6
$114,602
0
$0
0
$0
1
$102,290
Aggregated Statistics For Year 2003 (Based on 2 partial tracts)
A) FHA, FSA/RHS & VA Home Purchase Loans
B) Conventional Home Purchase Loans
C) Refinancings
D) Home Improvement Loans
F) Non-occupant Loans on < 5 Family Dwellings (A B C & D)
Number
Average Value
Number
Average Value
Number
Average Value
Number
Average Value
Number
Average Value
LOANS ORIGINATED
5
$97,994
26
$98,918
58
$116,828
1
$37,010
14
$86,133
APPLICATIONS APPROVED, NOT ACCEPTED
0
$0
3
$138,923
6
$115,437
1
$38,460
1
$96,640
APPLICATIONS DENIED
0
$0
8
$97,465
22
$118,622
2
$14,465
4
$104,030
APPLICATIONS WITHDRAWN
0
$0
4
$129,562
12
$116,527
0
$0
1
$96,310
FILES CLOSED FOR INCOMPLETENESS
0
$0
1
$85,970
2
$143,180
0
$0
0
$0
Aggregated Statistics For Year 2002 (Based on 2 partial tracts)
A) FHA, FSA/RHS & VA Home Purchase Loans
B) Conventional Home Purchase Loans
C) Refinancings
D) Home Improvement Loans
F) Non-occupant Loans on < 5 Family Dwellings (A B C & D)
Number
Average Value
Number
Average Value
Number
Average Value
Number
Average Value
Number
Average Value
LOANS ORIGINATED
3
$102,187
19
$91,669
38
$110,517
3
$20,523
7
$80,939
APPLICATIONS APPROVED, NOT ACCEPTED
0
$0
3
$90,550
6
$112,232
0
$0
2
$60,760
APPLICATIONS DENIED
0
$0
6
$107,598
22
$99,715
1
$69,970
1
$113,600
APPLICATIONS WITHDRAWN
0
$0
3
$66,257
13
$124,320
0
$0
0
$0
FILES CLOSED FOR INCOMPLETENESS
0
$0
1
$49,770
2
$155,620
0
$0
0
$0
Aggregated Statistics For Year 2001 (Based on 2 partial tracts)
A) FHA, FSA/RHS & VA Home Purchase Loans
B) Conventional Home Purchase Loans
C) Refinancings
D) Home Improvement Loans
F) Non-occupant Loans on < 5 Family Dwellings (A B C & D)
Number
Average Value
Number
Average Value
Number
Average Value
Number
Average Value
Number
Average Value
LOANS ORIGINATED
5
$104,716
19
$97,189
32
$104,757
2
$21,010
7
$86,503
APPLICATIONS APPROVED, NOT ACCEPTED
0
$0
4
$61,288
5
$104,264
1
$13,900
0
$0
APPLICATIONS DENIED
1
$98,090
5
$75,208
17
$96,228
3
$15,943
2
$54,620
APPLICATIONS WITHDRAWN
0
$0
3
$101,107
13
$100,602
1
$54,460
1
$59,630
FILES CLOSED FOR INCOMPLETENESS
0
$0
0
$0
4
$95,870
0
$0
0
$0
Aggregated Statistics For Year 2000 (Based on 2 partial tracts)
A) FHA, FSA/RHS & VA Home Purchase Loans
B) Conventional Home Purchase Loans
C) Refinancings
D) Home Improvement Loans
F) Non-occupant Loans on < 5 Family Dwellings (A B C & D)
Number
Average Value
Number
Average Value
Number
Average Value
Number
Average Value
Number
Average Value
LOANS ORIGINATED
2
$95,020
18
$78,466
13
$97,569
3
$21,063
5
$70,780
APPLICATIONS APPROVED, NOT ACCEPTED
0
$0
3
$81,340
3
$100,137
1
$21,650
0
$0
APPLICATIONS DENIED
1
$112,800
8
$77,911
16
$96,455
3
$20,360
1
$29,410
APPLICATIONS WITHDRAWN
1
$72,880
3
$84,840
6
$77,353
1
$33,770
0
$0
FILES CLOSED FOR INCOMPLETENESS
0
$0
0
$0
3
$114,413
0
$0
0
$0
Aggregated Statistics For Year 1999 (Based on 1 partial tract)
A) FHA, FSA/RHS & VA Home Purchase Loans
B) Conventional Home Purchase Loans
C) Refinancings
D) Home Improvement Loans
F) Non-occupant Loans on < 5 Family Dwellings (A B C & D)
Detailed PMIC statistics for the following Tracts:0101.00
2002 - 2018 National Fire Incident Reporting System (NFIRS) incidents
Based on the data from the years 2002 - 2018 the average number of fires per year is 15. The highest number of reported fires - 30 took place in 2004, and the least - 1 in 2002. The data has a growing trend.
When looking into fire subcategories, the most incidents belonged to: Outside Fires (44.2%), and Structure Fires (35.9%).
Fire incident types reported to NFIRS in Zip Code 98244


 Nearest zip codes: 98266, 98220, 98295, 98255, 98263, 98284.
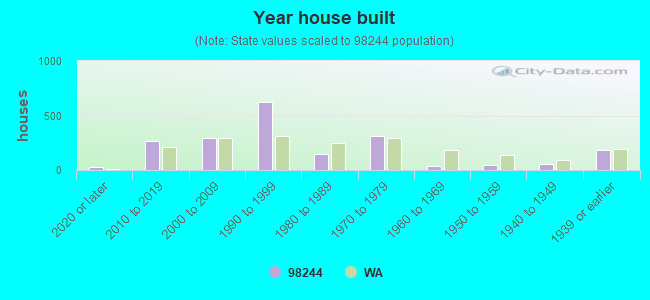


 : $2,100 in 2 contracts in 2003
 Based on the data from the years 2002 - 2018 the average number of fires per year is 15. The highest number of reported fires - 30 took place in 2004, and the least - 1 in 2002. The data has a growing trend.
 When looking into fire subcategories, the most incidents belonged to: Outside Fires (44.2%), and Structure Fires (35.9%).