Estimated zip code population in 2022: 4,762 Zip code population in 2010: 4,567 Zip code population in 2000: 4,181
Houses and condos: 2,259 Renter-occupied apartments: 307
% of renters here:
16%
State:
36%
March 2022 cost of living index in zip code 98251: 112.1 (more than average, U.S. average is 100)
Land area: 152.5 sq. mi. Water area: 2.5 sq. mi.
Population density: 31 people per square mile
(very low).
OSM Map
General Map
Google Map
MSN Map
OSM Map
General Map
Google Map
MSN Map
OSM Map
General Map
Google Map
MSN Map
OSM Map
General Map
Google Map
MSN Map
Please wait while loading the map...
Real estate property taxes paid for housing units in 2022:
This zip code:
0.6% ($2,836)
Washington:
0.8% ($4,283)
Median real estate property taxes paid for housing units with mortgages in 2022: $2,841 (0.6%) Median real estate property taxes paid for housing units with no mortgage in 2022: $2,836 (0.8%)
Business Search- 14 Million verified businesses
Males: 2,460
(51.7%)
Females: 2,301
(48.3%)
For population 25 years and over in 98251:
High school or higher: 85.2%
Bachelor's degree or higher: 15.2%
Graduate or professional degree: 5.0%
Unemployed: 5.5%
Mean travel time to work (commute): 43.9 minutes
For population 15 years and over in 98251:
Never married: 28.2%
Now married: 54.4%
Separated: 1.2%
Widowed: 4.4%
Divorced: 11.8%
Zip code 98251 compared to state average:
Black race population percentage below state average.
Foreign-born population percentage below state average.
Renting percentage below state average.
Length of stay since moving in above state average.
Percentage of population with a bachelor's degree or higher significantly below state average.
Averages for the 2020 tax year for zip code 98251, filed in 2021:
Average Adjusted Gross Income (AGI) in 2020: $63,627 (Individual Income Tax Returns)
Here:
$63,627
State:
$99,264
Salary/wage: $57,807 (reported on 84.9% of returns)
Here:
$57,807
State:
$80,347
(% of AGI for various income ranges: 1096.5% for AGIs below $25k, 3403.1% for AGIs $25k-50k, 6084.2% for AGIs $50k-75k, 8839.2% for AGIs $75k-100k, 15459.6% for AGIs $100k-200k)
Taxable interest for individuals: $394 (reported on 20.1% of returns)
This zip code:
$394
Washington:
$2,077
(% of AGI for various income ranges: 3.0% for AGIs below $25k, 8.0% for AGIs $25k-50k, 12.6% for AGIs $50k-75k, 7.9% for AGIs $75k-100k, 17.6% for AGIs $100k-200k)
Ordinary dividends: $1,338 (reported on 10.0% of returns)
Here:
$1,338
State:
$10,013
(% of AGI for various income ranges: 3.9% for AGIs below $25k, 15.3% for AGIs $25k-50k, 20.8% for AGIs $50k-75k, 32.5% for AGIs $75k-100k, 19.6% for AGIs $100k-200k)
Net capital gain/loss in AGI: +$17,960 (reported on 10.5% of returns)
Here:
+$17,960
State:
+$40,092
(% of AGI for various income ranges: 0.7% for AGIs below $25k, 26.7% for AGIs $25k-50k, 68.2% for AGIs $50k-75k, 81.2% for AGIs $75k-100k, 248.8% for AGIs $100k-200k)
Profit/loss from business: +$8,645 (reported on 9.2% of returns)
Here:
+$8,645
State:
+$18,312
(% of AGI for various income ranges: 24.1% for AGIs below $25k, 90.2% for AGIs $25k-50k, 183.2% for AGIs $50k-75k, 261.2% for AGIs $100k-200k)
Taxable individual retirement arrangement distribution: $14,575 (reported on 5.0% of returns)
98251:
$14,575
Washington:
$24,221
(% of AGI for various income ranges: 37.8% for AGIs below $25k, 57.8% for AGIs $25k-50k, 176.1% for AGIs $50k-75k, 249.2% for AGIs $100k-200k)
Total itemized deductions: $25,824 (reported on 7.1% of returns)
Here:
$25,824
State:
$39,068
(% of AGI for various income ranges: 133.7% for AGIs $25k-50k, 247.4% for AGIs $50k-75k, 420.8% for AGIs $75k-100k, 714.0% for AGIs $100k-200k)
Charity contributions: $4,380 (reported on 4.2% of returns)
Here:
$4,380
State:
$15,331
(% of AGI for various income ranges: 27.6% for AGIs $50k-75k, 28.7% for AGIs $75k-100k, 105.6% for AGIs $100k-200k)
Taxes paid: $5,335 (reported on 7.1% of returns)
98251:
$5,335
State:
$7,774
(% of AGI for various income ranges: 21.8% for AGIs $25k-50k, 56.1% for AGIs $50k-75k, 82.5% for AGIs $75k-100k, 155.6% for AGIs $100k-200k)
Earned income credit: $1,860 (reported on 10.5% of returns)
Here:
$1,860
State:
$2,020
(% of AGI for various income ranges: 61.1% for AGIs below $25k, 37.6% for AGIs $25k-50k)
Percentage of individuals using paid preparers for their 2020 taxes: 92.9%
Here:
93%
State:
93%
(% for various income ranges: 89.8% for AGIs below $25k, 91.7% for AGIs $25k-50k, 95.8% for AGIs $50k-75k, 93.3% for AGIs $75k-100k, 94.4% for AGIs $100k-200k, 100.0% for AGIs over 200k)
Averages for the 2012 tax year for zip code 98251, filed in 2013:
Average Adjusted Gross Income (AGI) in 2012: $47,142 (Individual Income Tax Returns)
Here:
$47,142
State:
$69,533
Salary/wage: $44,079 (reported on 85.9% of returns)
Here:
$44,079
State:
$57,267
(% of AGI for various income ranges: 72.4% for AGIs below $25k, 78.4% for AGIs $25k-50k, 84.3% for AGIs $50k-75k, 83.6% for AGIs $75k-100k, 78.6% for AGIs $100k-200k)
Taxable interest for individuals: $392 (reported on 26.8% of returns)
This zip code:
$392
Washington:
$1,816
(% of AGI for various income ranges: 0.4% for AGIs below $25k, 0.2% for AGIs $25k-50k, 0.2% for AGIs $50k-75k, 0.2% for AGIs $75k-100k, 0.1% for AGIs $100k-200k)
Ordinary dividends: $1,350 (reported on 11.1% of returns)
Here:
$1,350
State:
$8,163
(% of AGI for various income ranges: 0.8% for AGIs below $25k, 0.6% for AGIs $25k-50k, 0.3% for AGIs $50k-75k, 0.1% for AGIs $75k-100k, 0.1% for AGIs $100k-200k)
Net capital gain/loss in AGI: +$479 (reported on 7.1% of returns)
Here:
+$479
State:
+$21,568
(% of AGI for various income ranges: 0.4% for AGIs $100k-200k)
Profit/loss from business: +$9,926 (reported on 11.6% of returns)
Here:
+$9,926
State:
+$16,521
(% of AGI for various income ranges: 5.7% for AGIs below $25k, 3.9% for AGIs $25k-50k, 1.8% for AGIs $50k-75k, 1.3% for AGIs $75k-100k, 1.6% for AGIs $100k-200k)
Taxable individual retirement arrangement distribution: $13,223 (reported on 6.6% of returns)
98251:
$13,223
Washington:
$18,648
(% of AGI for various income ranges: 2.1% for AGIs below $25k, 1.4% for AGIs $25k-50k, 1.7% for AGIs $50k-75k, 4.9% for AGIs $75k-100k)
Total itemized deductions: $17,382 (24% of AGI, reported on 32.8% of returns)
Here:
$17,382
State:
$23,872
Here:
23.6% of AGI
State:
18.2% of AGI
(% of AGI for various income ranges: 10.3% for AGIs below $25k, 11.0% for AGIs $25k-50k, 12.6% for AGIs $50k-75k, 13.3% for AGIs $75k-100k, 12.3% for AGIs $100k-200k)
Charity contributions: $1,855 (reported on 21.2% of returns)
Here:
$1,855
State:
$4,465
(% of AGI for various income ranges: 0.6% for AGIs below $25k, 0.6% for AGIs $25k-50k, 1.0% for AGIs $50k-75k, 0.8% for AGIs $75k-100k, 0.9% for AGIs $100k-200k)
Taxes paid: $3,946 (reported on 31.8% of returns)
98251:
$3,946
State:
$6,400
(% of AGI for various income ranges: 1.7% for AGIs below $25k, 2.4% for AGIs $25k-50k, 2.6% for AGIs $50k-75k, 3.0% for AGIs $75k-100k, 3.0% for AGIs $100k-200k)
Earned income credit: $1,890 (reported on 15.7% of returns)
Here:
$1,890
State:
$2,073
(% of AGI for various income ranges: 5.0% for AGIs below $25k, 0.8% for AGIs $25k-50k)
Percentage of individuals using paid preparers for their 2012 taxes: 41.9%
Here:
42%
State:
43%
(% for various income ranges: 34.3% for AGIs below $25k, 42.6% for AGIs $25k-50k, 42.9% for AGIs $50k-75k, 52.4% for AGIs $75k-100k, 55.6% for AGIs $100k-200k)
Averages for the 2004 tax year for zip code 98251, filed in 2005:
Average Adjusted Gross Income (AGI) in 2004: $39,946 (Individual Income Tax Returns)
Here:
$39,946
State:
$54,331
Salary/wage: $37,945 (reported on 89.0% of returns)
Here:
$37,945
State:
$45,761
(% of AGI for various income ranges: 133.3% for AGIs below $10k, 76.8% for AGIs $10k-25k, 87.5% for AGIs $25k-50k, 87.0% for AGIs $50k-75k, 89.6% for AGIs $75k-100k, 68.4% for AGIs over 100k)
Taxable interest for individuals: $577 (reported on 29.1% of returns)
This zip code:
$577
Washington:
$2,110
(% of AGI for various income ranges: 3.4% for AGIs below $10k, 1.1% for AGIs $10k-25k, 0.3% for AGIs $25k-50k, 0.5% for AGIs $50k-75k, 0.2% for AGIs $75k-100k, 0.2% for AGIs over 100k)
Taxable dividends: $1,187 (reported on 14.0% of returns)
Here:
$1,187
State:
$5,879
(% of AGI for various income ranges: 3.3% for AGIs below $10k, 0.8% for AGIs $10k-25k, 0.4% for AGIs $25k-50k, 0.3% for AGIs $50k-75k, 0.2% for AGIs $75k-100k, 0.6% for AGIs over 100k)
Net capital gain/loss: +$7,010 (reported on 10.3% of returns)
Here:
+$7,010
State:
+$15,835
(% of AGI for various income ranges: 4.1% for AGIs below $10k, 0.3% for AGIs $10k-25k, 0.3% for AGIs $25k-50k, 0.8% for AGIs $50k-75k, 1.0% for AGIs $75k-100k, 8.7% for AGIs over 100k)
Profit/loss from business: +$7,535 (reported on 12.2% of returns)
Here:
+$7,535
State:
+$13,994
(% of AGI for various income ranges: 6.6% for AGIs below $10k, 4.6% for AGIs $10k-25k, 3.1% for AGIs $25k-50k, 1.3% for AGIs $50k-75k, 2.1% for AGIs $75k-100k, 1.3% for AGIs over 100k)
IRA payment deduction: $1,727 (reported on 1.2% of returns)
98251:
$1,727
Washington:
$3,001
Total itemized deductions: $15,510 (26% of AGI, reported on 39.7% of returns)
Here:
$15,510
State:
$19,669
Here:
25.7% of AGI
State:
20.7% of AGI
(% of AGI for various income ranges: 25.5% for AGIs below $10k, 12.8% for AGIs $10k-25k, 14.5% for AGIs $25k-50k, 17.8% for AGIs $50k-75k, 15.1% for AGIs $75k-100k, 13.8% for AGIs over 100k)
Charity contributions deductions: $1,595 (3% of AGI, reported on 27.6% of returns)
Here:
$1,595
State:
$3,569
Here:
2.5% of AGI
State:
3.5% of AGI
(% of AGI for various income ranges: 0.8% for AGIs $10k-25k, 0.8% for AGIs $25k-50k, 1.4% for AGIs $50k-75k, 0.8% for AGIs $75k-100k, 1.7% for AGIs over 100k)
Total tax: $4,400 (reported on 78.1% of returns)
98251:
$4,400
State:
$9,065
(% of AGI for various income ranges: 4.3% for AGIs below $10k, 4.2% for AGIs $10k-25k, 6.7% for AGIs $25k-50k, 7.8% for AGIs $50k-75k, 10.4% for AGIs $75k-100k, 15.0% for AGIs over 100k)
Earned income credit: $1,502 (reported on 13.7% of returns)
Here:
$1,502
State:
$1,607
Percentage of individuals using paid preparers for their 2004 taxes: 45.8%
Here:
46%
State:
49%
(% for various income ranges: 37.2% for AGIs below $10k, 46.6% for AGIs $10k-25k, 48.7% for AGIs $25k-50k, 44.9% for AGIs $50k-75k, 48.7% for AGIs $75k-100k, 52.8% for AGIs over 100k)
Likely homosexual households (counted as self-reported same-sex unmarried-partner households)
Lesbian couples: 0.0% of all households
Gay men: 0.6% of all households
Household received Food Stamps/SNAP in the past 12 months: 132 Household did not receive Food Stamps/SNAP in the past 12 months: 1,793
Women who had a birth in the past 12 months: 69 (61 now married, 8 unmarried) Women who did not have a birth in the past 12 months: 1,019 (482 now married, 536 unmarried)
Housing units in zip code 98251 with a mortgage: 1,161 (103 second mortgage, 84 both second mortgage and home equity loan) Median monthly owner costs for units with a mortgage: $1,887 Median monthly owner costs for units without a mortgage: $585
Residents with income below the poverty level in 2022:
This zip code:
10.5%
Whole state:
10.0%
Residents with income below 50% of the poverty level in 2022:
This zip code:
4.6%
Whole state:
4.6%
Median number of rooms in houses and condos:
Here:
5.7
State:
6.5
Median number of rooms in apartments:
Here:
4.4
State:
3.9
Notable locations in this zip code not listed on our city pages
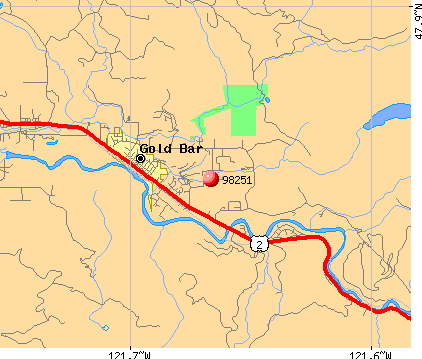
Notable locations in zip code 98251: Garland Mineral Springs (A), Mineral City (B), Olney Park Recreation Area (C), Troublesome Creek Campground (D), Snohomish County Fire Protection District 26 Station 54 (E), Snohomish County Fire District 26 Station 53 (F). Display/hide their locations on the map
Lakes: Virgin Lake (A), Gulch Lakes (B), Shaw Lake (C), Lake Serene (D), Snowfall Lake (E), Rose Lake (F), One Acre Lake (G), Cecelia Lake (H). Display/hide their locations on the map
Rivers and creeks: Barclay Creek (A), Boss Creek (B), Boulder Creek (C), Elk Creek (D), Excelsior Creek (E), Greider Creek (F), Howard Creek (G), Lost Creek (H), May Creek (I). Display/hide their locations on the map
In group quarters: 21 (-1 institutionalized population)
Size of family households: 550 2-persons, 173 3-persons, 266 4-persons, 116 5-persons, 91 6-persons
Size of nonfamily households: 642 1-person, 81 2-persons, 5 3-persons
754 married couples with children.
175 single-parent households (41 men, 134 women).
88.8% of residents of 98251 zip code speak English at home.
8.6% of residents speak Spanish at home (63% very well, 25% well, 11% not well).
1.3% of residents speak other Indo-European language at home (98% very well, 2% not well).
0.2% of residents speak Asian or Pacific Island language at home (100% well).
Foreign born population: 456 (9.6%) (35.5% of them are naturalized citizens)
This zip code:
9.6%
Whole state:
15.3%
29%Liberia
26%Honduras
9%Costa Rica
9%Malaysia
8%El Salvador
4%Sweden
4%United Kingdom, excluding England and Scotland
15%German
14%American
10%English
7%Nigerian
6%Italian
5%Irish
4%Scottish
Year of entry for the foreign-born population
2402010 or later
832000 to 2009
621990 to 1999
162Before 1990
Facilities with environmental interests located in this zip code:
CADMAN INC GOLD BAR (HWY 2 - 3 MI EAST OF GOLD BAR in GOLD BAR, WA)
National Pollutant Discharge Elimination System NON-MAJOR (Tracking pollutant discharge elimination systems) - permit Business SIC classification: CONSTRUCTION SAND AND GRAVEL Organizations: CADMAN GRAVEL CO (CONTACT/OPERATOR)
Alternative names: CADMAN GRAVEL CO
CADMAN INC (44716 STATE RT 2 in GOLD BAR, WA)
AIR MINOR (AIRS/AFS) Business SIC classification: READY-MIXED CONCRETE
CASCADE CEDAR SUPPLY (17002 415TH ST in GOLD BAR, WA)
COMPLIANCE ACTIVITY (Tracking inspections of insecticide, fungicide, and rodenticide, and toxic substances)
Housing units lacking complete plumbing facilities: 4.1% Housing units lacking complete kitchen facilities: 3.8%
54.8%Electricity
19.0%Wood
14.2%Utility gas
8.3%Bottled, tank, or LP gas
1.8%Fuel oil, kerosene, etc.
1.6%Other fuel
0.6%No fuel used
Place of birth for U.S.-born residents:
This state: 2,550
Northeast: 138
Midwest: 319
South: 190
West: 1,015
49% of the 98251 zip code residents lived in the same house 5 years ago. Out of people who lived in different houses, 48% lived in this county. Out of people who lived in different counties, 50% lived in Washington.
88% of the 98251 zip code residents lived in the same house 1 year ago. Out of people who lived in different houses, 48% moved from this county. Out of people who lived in different houses, 38% moved from different county within same state. Out of people who lived in different houses, 13% moved from different state.
Private vs. public school enrollment:
Students in private schools in grades 1 to 8 (elementary and middle school): 72
Here:
17.0%
Washington:
12.4%
Students in private schools in grades 9 to 12 (high school):
Here:
0.0%
Washington:
9.2%
Students in private undergraduate colleges: 15
Here:
9.6%
Washington:
16.5%
Occupation by median earnings in the past 12 months ($)
216,508Computer and mathematical occupations
131,090Business and financial operations occupations
83,076Architecture and engineering occupations
80,282Education, training, and library occupations
77,682Management occupations
72,839Personal care and service occupations
Top industries in this zip code by the number of employees in 2005:
Professional, Scientific, and Technical Services: Administrative Management and General Management Consulting Services (20-49 employees: 1 establishment)
Accommodation and Food Services: Full-Service Restaurants (10-19: 1, 5-9: 1)
Mining: Construction Sand and Gravel Mining (10-19: 1)
Other Services (except Public Administration): Religious Organizations (10-19: 1)
Arts, Entertainment, and Recreation: Fitness and Recreational Sports Centers (10-19: 1)
Construction: New Single-Family Housing Construction (except Operative Builders) (1-4: 5)
Construction: Drywall and Insulation Contractors (5-9: 1, 1-4: 1)
Accommodation and Food Services: Snack and Nonalcoholic Beverage Bars (5-9: 1)
People in group quarters in 2010:
20 people in group homes intended for adults
People in group quarters in 2000:
13 people in homes or halfway houses for drug/alcohol abuse
Fatal accident statistics in 2013:
Fatal accident count: 1
Vehicles involved in fatal accidents: 4
Fatal accidents caused by drunken drivers: 1
Fatalities: 1
Persons involved in fatal accidents: 4
Pedestrians involved in fatal accidents: 0
Fatal accident statistics in 2011:
Fatal accident count: 2
Vehicles involved in fatal accidents: 3
Fatal accidents caused by drunken drivers: 1
Fatalities: 2
Persons involved in fatal accidents: 9
Pedestrians involved in fatal accidents: 0
Home Mortgage Disclosure Act Aggregated Statistics For Year 2009 (Based on 2 partial tracts)
A) FHA, FSA/RHS & VA Home Purchase Loans
B) Conventional Home Purchase Loans
C) Refinancings
D) Home Improvement Loans
E) Loans on Dwellings For 5+ Families
F) Non-occupant Loans on < 5 Family Dwellings (A B C & D)
G) Loans On Manufactured Home Dwelling (A B C & D)
Number
Average Value
Number
Average Value
Number
Average Value
Number
Average Value
Number
Average Value
Number
Average Value
Number
Average Value
LOANS ORIGINATED
45
$219,723
15
$236,028
152
$207,410
5
$194,162
0
$0
16
$201,051
28
$146,201
APPLICATIONS APPROVED, NOT ACCEPTED
3
$226,417
3
$170,167
28
$220,656
1
$12,820
0
$0
6
$279,993
3
$119,617
APPLICATIONS DENIED
16
$230,221
1
$209,330
67
$216,198
2
$137,240
1
$400,500
1
$177,290
14
$181,255
APPLICATIONS WITHDRAWN
4
$194,110
2
$342,830
52
$227,874
2
$181,560
0
$0
2
$158,065
7
$186,747
FILES CLOSED FOR INCOMPLETENESS
2
$228,550
1
$445,360
9
$205,174
3
$42,720
0
$0
0
$0
3
$199,717
Aggregated Statistics For Year 2008 (Based on 2 partial tracts)
A) FHA, FSA/RHS & VA Home Purchase Loans
B) Conventional Home Purchase Loans
C) Refinancings
D) Home Improvement Loans
F) Non-occupant Loans on < 5 Family Dwellings (A B C & D)
G) Loans On Manufactured Home Dwelling (A B C & D)
Number
Average Value
Number
Average Value
Number
Average Value
Number
Average Value
Number
Average Value
Number
Average Value
LOANS ORIGINATED
42
$235,341
27
$247,895
137
$234,781
15
$123,033
18
$295,361
40
$164,499
APPLICATIONS APPROVED, NOT ACCEPTED
3
$199,360
9
$170,524
21
$175,559
2
$184,230
3
$250,623
10
$98,042
APPLICATIONS DENIED
16
$240,634
17
$171,822
120
$250,206
17
$83,115
10
$152,724
29
$143,517
APPLICATIONS WITHDRAWN
2
$306,515
6
$190,282
72
$247,539
6
$272,518
3
$207,193
10
$201,104
FILES CLOSED FOR INCOMPLETENESS
1
$393,020
0
$0
11
$251,175
1
$42,720
0
$0
2
$162,335
Aggregated Statistics For Year 2007 (Based on 2 partial tracts)
A) FHA, FSA/RHS & VA Home Purchase Loans
B) Conventional Home Purchase Loans
C) Refinancings
D) Home Improvement Loans
F) Non-occupant Loans on < 5 Family Dwellings (A B C & D)
G) Loans On Manufactured Home Dwelling (A B C & D)
Number
Average Value
Number
Average Value
Number
Average Value
Number
Average Value
Number
Average Value
Number
Average Value
LOANS ORIGINATED
11
$234,572
105
$226,365
195
$215,977
15
$132,788
23
$189,175
37
$189,498
APPLICATIONS APPROVED, NOT ACCEPTED
0
$0
9
$249,200
44
$216,683
7
$77,201
2
$475,795
6
$163,938
APPLICATIONS DENIED
3
$157,707
29
$196,696
170
$208,769
27
$128,753
9
$299,633
29
$161,599
APPLICATIONS WITHDRAWN
0
$0
9
$155,453
57
$214,068
6
$86,508
6
$217,517
10
$131,257
FILES CLOSED FOR INCOMPLETENESS
0
$0
3
$257,387
37
$215,188
1
$389,820
2
$209,860
6
$189,748
Aggregated Statistics For Year 2006 (Based on 2 partial tracts)
A) FHA, FSA/RHS & VA Home Purchase Loans
B) Conventional Home Purchase Loans
C) Refinancings
D) Home Improvement Loans
F) Non-occupant Loans on < 5 Family Dwellings (A B C & D)
G) Loans On Manufactured Home Dwelling (A B C & D)
Number
Average Value
Number
Average Value
Number
Average Value
Number
Average Value
Number
Average Value
Number
Average Value
LOANS ORIGINATED
33
$194,862
179
$167,885
235
$182,028
26
$88,932
27
$213,719
52
$163,117
APPLICATIONS APPROVED, NOT ACCEPTED
2
$187,970
20
$172,802
41
$180,648
3
$54,113
7
$192,697
6
$150,588
APPLICATIONS DENIED
7
$167,219
60
$196,672
152
$175,370
34
$73,221
7
$158,369
29
$122,599
APPLICATIONS WITHDRAWN
1
$336,420
37
$163,202
119
$175,215
9
$76,066
12
$129,940
7
$150,436
FILES CLOSED FOR INCOMPLETENESS
0
$0
7
$198,190
12
$172,660
0
$0
0
$0
0
$0
Aggregated Statistics For Year 2005 (Based on 2 partial tracts)
A) FHA, FSA/RHS & VA Home Purchase Loans
B) Conventional Home Purchase Loans
C) Refinancings
D) Home Improvement Loans
F) Non-occupant Loans on < 5 Family Dwellings (A B C & D)
G) Loans On Manufactured Home Dwelling (A B C & D)
Number
Average Value
Number
Average Value
Number
Average Value
Number
Average Value
Number
Average Value
Number
Average Value
LOANS ORIGINATED
26
$161,802
192
$143,624
225
$152,306
25
$86,935
33
$145,863
46
$134,220
APPLICATIONS APPROVED, NOT ACCEPTED
2
$127,625
22
$122,335
32
$167,242
2
$113,210
4
$159,665
3
$139,197
APPLICATIONS DENIED
3
$191,883
46
$127,626
176
$141,097
31
$77,585
9
$146,553
31
$118,031
APPLICATIONS WITHDRAWN
1
$268,070
27
$107,354
112
$163,833
13
$88,972
5
$70,916
15
$127,163
FILES CLOSED FOR INCOMPLETENESS
1
$230,690
3
$159,133
43
$151,954
2
$30,440
1
$133,500
7
$146,926
Aggregated Statistics For Year 2004 (Based on 2 partial tracts)
A) FHA, FSA/RHS & VA Home Purchase Loans
B) Conventional Home Purchase Loans
C) Refinancings
D) Home Improvement Loans
F) Non-occupant Loans on < 5 Family Dwellings (A B C & D)
G) Loans On Manufactured Home Dwelling (A B C & D)
Number
Average Value
Number
Average Value
Number
Average Value
Number
Average Value
Number
Average Value
Number
Average Value
LOANS ORIGINATED
26
$156,051
162
$138,398
190
$147,401
16
$67,751
22
$117,431
40
$133,153
APPLICATIONS APPROVED, NOT ACCEPTED
1
$136,700
25
$122,393
48
$143,446
2
$173,550
5
$82,450
12
$127,359
APPLICATIONS DENIED
7
$154,707
63
$117,243
179
$137,116
28
$39,287
10
$149,627
33
$120,878
APPLICATIONS WITHDRAWN
2
$84,370
31
$140,838
104
$149,335
0
$0
7
$111,834
5
$130,936
FILES CLOSED FOR INCOMPLETENESS
0
$0
3
$212,533
26
$149,068
0
$0
0
$0
2
$144,715
Aggregated Statistics For Year 2003 (Based on 2 partial tracts)
A) FHA, FSA/RHS & VA Home Purchase Loans
B) Conventional Home Purchase Loans
C) Refinancings
D) Home Improvement Loans
F) Non-occupant Loans on < 5 Family Dwellings (A B C & D)
Number
Average Value
Number
Average Value
Number
Average Value
Number
Average Value
Number
Average Value
LOANS ORIGINATED
29
$152,319
89
$139,812
440
$136,371
14
$51,111
29
$132,395
APPLICATIONS APPROVED, NOT ACCEPTED
2
$138,840
19
$134,343
78
$133,034
3
$16,733
1
$91,850
APPLICATIONS DENIED
6
$131,898
18
$136,763
185
$137,304
11
$34,273
6
$185,832
APPLICATIONS WITHDRAWN
6
$146,138
7
$127,703
88
$143,962
5
$52,118
2
$144,715
FILES CLOSED FOR INCOMPLETENESS
0
$0
0
$0
20
$136,544
0
$0
1
$87,580
Aggregated Statistics For Year 1999 (Based on 1 partial tract)
A) FHA, FSA/RHS & VA Home Purchase Loans
B) Conventional Home Purchase Loans
C) Refinancings
D) Home Improvement Loans
F) Non-occupant Loans on < 5 Family Dwellings (A B C & D)
Detailed PMIC statistics for the following Tracts:0538.03
2002 - 2018 National Fire Incident Reporting System (NFIRS) incidents
Based on the data from the years 2002 - 2018 the average number of fire incidents per year is 17. The highest number of reported fires - 33 took place in 2005, and the least - 3 in 2016. The data has a decreasing trend.
When looking into fire subcategories, the most reports belonged to: Structure Fires (39.4%), and Outside Fires (33.4%).
Fire incident types reported to NFIRS in Zip Code 98251

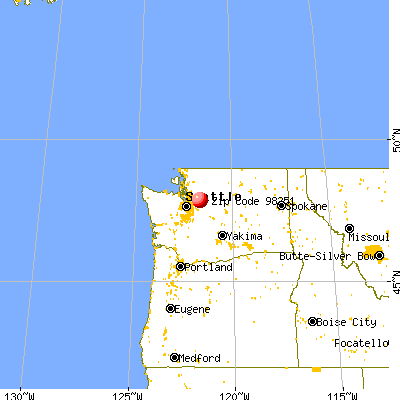


 Nearest zip codes: 98294, 98252, 98256, 98272, 98019, 98224.


 Based on the data from the years 2002 - 2018 the average number of fire incidents per year is 17. The highest number of reported fires - 33 took place in 2005, and the least - 3 in 2016. The data has a decreasing trend.
 When looking into fire subcategories, the most reports belonged to: Structure Fires (39.4%), and Outside Fires (33.4%).