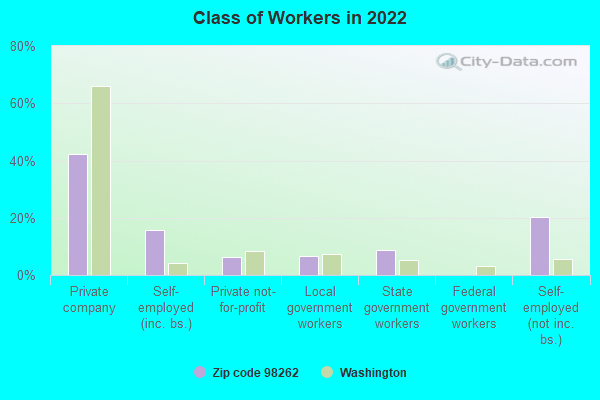
Estimated zip code population in 2022: 977 Zip code population in 2010: 964 Zip code population in 2000: 812
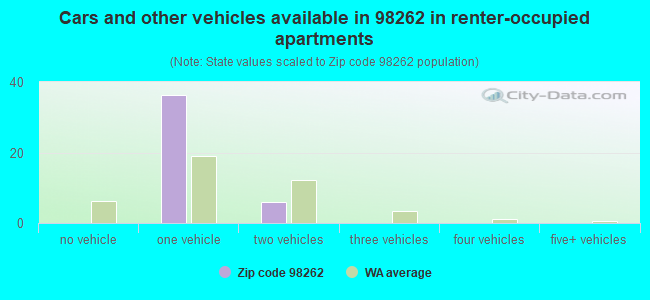
Houses and condos: 958 Renter-occupied apartments: 40
% of renters here:
8%
State:
36%
March 2022 cost of living index in zip code 98262: 90.2 (less than average, U.S. average is 100)
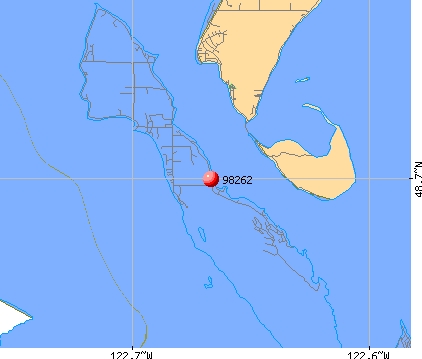
Land area: 9.2 sq. mi. Water area: 0.3 sq. mi.
Population density: 106 people per square mile
(very low).
OSM Map
General Map
Google Map
MSN Map
OSM Map
General Map
Google Map
MSN Map
OSM Map
General Map
Google Map
MSN Map
OSM Map
General Map
Google Map
MSN Map
Please wait while loading the map...
Real estate property taxes paid for housing units in 2022:
This zip code:
0.5% ($3,175)
Washington:
0.8% ($4,283)
Median real estate property taxes paid for housing units with mortgages in 2022: $3,175 (0.5%) Median real estate property taxes paid for housing units with no mortgage in 2022: $3,204 (0.6%)
Business Search- 14 Million verified businesses
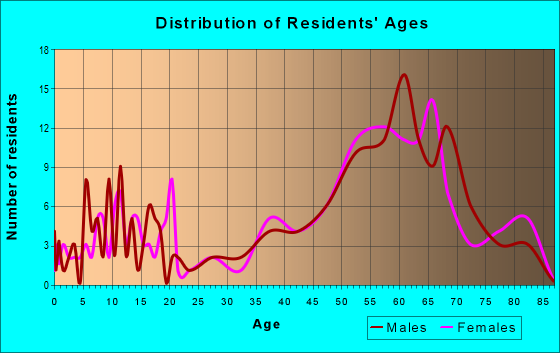
Males: 545
(55.8%)
Females: 432
(44.2%)
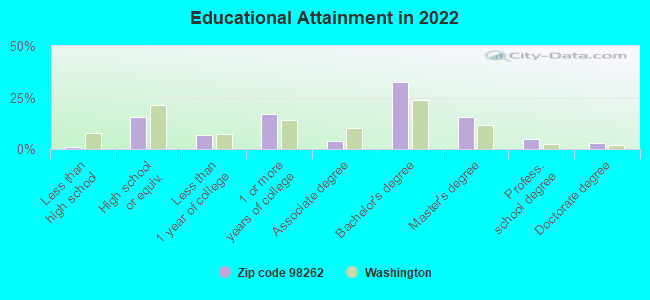
For population 25 years and over in 98262:
High school or higher: 99.6%
Bachelor's degree or higher: 56.2%
Graduate or professional degree: 23.7%
Mean travel time to work (commute): 25.7 minutes
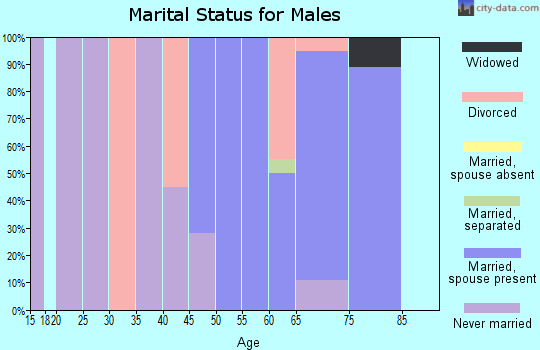
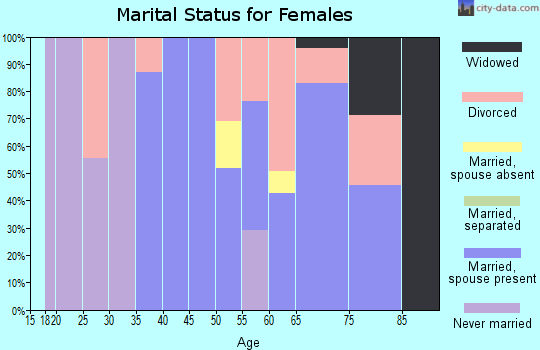
For population 15 years and over in 98262:
Never married: 19.1%
Now married: 54.1%
Separated: 0.0%
Widowed: 11.5%
Divorced: 15.3%
Zip code 98262 compared to state average:
Unemployed percentage significantly below state average.
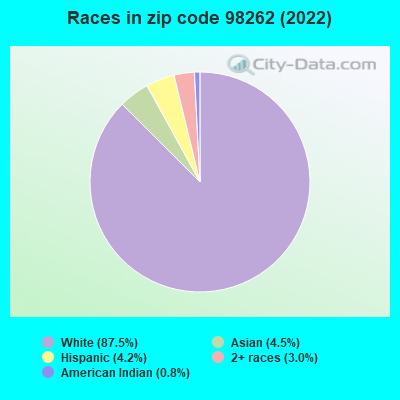
Black race population percentage significantly below state average.
Hispanic race population percentage significantly below state average.
Median age significantly above state average.
Renting percentage significantly below state average.
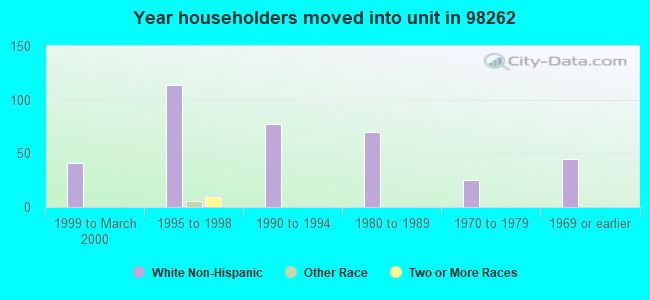
Length of stay since moving in significantly above state average.
Percentage of population with a bachelor's degree or higher above state average.
Estimated median house/condo value in 2022: $626,282
98262:
$626,282
Washington:
$569,500
Median resident age:
This zip code:
62.9 years
Washington median age:
38.4 years
Average household size:
This zip code:
1.9 people
Washington:
2.5 people
Averages for the 2020 tax year for zip code 98262, filed in 2021:
Average Adjusted Gross Income (AGI) in 2020: $93,054 (Individual Income Tax Returns)
Here:
$93,054
State:
$99,264
Salary/wage: $67,383 (reported on 57.7% of returns)
Here:
$67,383
State:
$80,347
(% of AGI for various income ranges: 1130.0% for AGIs below $25k, 2818.3% for AGIs $25k-50k, 4572.0% for AGIs $50k-75k, 8773.3% for AGIs $75k-100k, 12530.0% for AGIs $100k-200k)
Taxable interest for individuals: $2,834 (reported on 61.5% of returns)
This zip code:
$2,834
Washington:
$2,077
(% of AGI for various income ranges: 100.0% for AGIs below $25k, 86.7% for AGIs $25k-50k, 138.0% for AGIs $50k-75k, 233.3% for AGIs $75k-100k, 325.0% for AGIs $100k-200k)
Ordinary dividends: $8,215 (reported on 38.5% of returns)
Here:
$8,215
State:
$10,013
(% of AGI for various income ranges: 205.0% for AGIs below $25k, 203.3% for AGIs $25k-50k, 378.0% for AGIs $50k-75k, 240.0% for AGIs $75k-100k, 1205.0% for AGIs $100k-200k)
Net capital gain/loss in AGI: +$25,889 (reported on 36.5% of returns)
Here:
+$25,889
State:
+$40,092
(% of AGI for various income ranges: 223.3% for AGIs $25k-50k, 178.0% for AGIs $50k-75k, 306.7% for AGIs $75k-100k, 2032.5% for AGIs $100k-200k)
Profit/loss from business: +$17,887 (reported on 28.8% of returns)
Here:
+$17,887
State:
+$18,312
(% of AGI for various income ranges: 265.0% for AGIs below $25k, 600.0% for AGIs $25k-50k, 968.0% for AGIs $50k-75k, 993.3% for AGIs $75k-100k, 3455.0% for AGIs $100k-200k)
Taxable individual retirement arrangement distribution: $28,791 (reported on 21.2% of returns)
98262:
$28,791
Washington:
$24,221
(% of AGI for various income ranges: 718.3% for AGIs $25k-50k, 1094.0% for AGIs $50k-75k, 5472.5% for AGIs $100k-200k)
Total itemized deductions: $39,014 (reported on 13.5% of returns)
Here:
$39,014
State:
$39,068
(% of AGI for various income ranges: 983.3% for AGIs below $25k, 2706.7% for AGIs $75k-100k)
Charity contributions: $11,800 (reported on 9.6% of returns)
Here:
$11,800
State:
$15,331
(% of AGI for various income ranges: 1475.0% for AGIs $100k-200k)
Taxes paid: $7,829 (reported on 13.5% of returns)
98262:
$7,829
State:
$7,774
(% of AGI for various income ranges: 1116.7% for AGIs $75k-100k)
Earned income credit: $1,700 (reported on 7.7% of returns)
Here:
$1,700
State:
$2,020
(% of AGI for various income ranges: 113.3% for AGIs below $25k)
Percentage of individuals using paid preparers for their 2020 taxes: 86.5%
Here:
87%
State:
93%
(% for various income ranges: 76.9% for AGIs below $25k, 81.8% for AGIs $25k-50k, 88.9% for AGIs $50k-75k, 83.3% for AGIs $75k-100k, 100.0% for AGIs $100k-200k, 100.0% for AGIs over 200k)
Averages for the 2012 tax year for zip code 98262, filed in 2013:
Average Adjusted Gross Income (AGI) in 2012: $59,480 (Individual Income Tax Returns)
Here:
$59,480
State:
$69,533
Salary/wage: $50,262 (reported on 63.0% of returns)
Here:
$50,262
State:
$57,267
(% of AGI for various income ranges: 44.3% for AGIs below $25k, 55.1% for AGIs $25k-50k, 51.6% for AGIs $50k-75k, 59.0% for AGIs $75k-100k, 53.5% for AGIs $100k-200k)
Taxable interest for individuals: $1,612 (reported on 54.3% of returns)
This zip code:
$1,612
Washington:
$1,816
(% of AGI for various income ranges: 2.2% for AGIs below $25k, 0.8% for AGIs $25k-50k, 2.0% for AGIs $50k-75k, 1.2% for AGIs $75k-100k, 1.4% for AGIs $100k-200k)
Ordinary dividends: $5,981 (reported on 34.8% of returns)
Here:
$5,981
State:
$8,163
(% of AGI for various income ranges: 8.6% for AGIs below $25k, 4.3% for AGIs $50k-75k, 4.0% for AGIs $100k-200k)
Net capital gain/loss in AGI: +$8,807 (reported on 30.4% of returns)
Here:
+$8,807
State:
+$21,568
(% of AGI for various income ranges: 0.9% for AGIs $50k-75k, 8.9% for AGIs $100k-200k)
Profit/loss from business: +$12,979 (reported on 30.4% of returns)
Here:
+$12,979
State:
+$16,521
(% of AGI for various income ranges: 21.2% for AGIs below $25k, 14.0% for AGIs $25k-50k, 10.4% for AGIs $50k-75k, 3.0% for AGIs $100k-200k)
Taxable individual retirement arrangement distribution: $17,210 (reported on 21.7% of returns)
98262:
$17,210
Washington:
$18,648
(% of AGI for various income ranges: 14.0% for AGIs below $25k, 10.8% for AGIs $50k-75k, 6.3% for AGIs $100k-200k)
Total itemized deductions: $25,394 (28% of AGI, reported on 39.1% of returns)
Here:
$25,394
State:
$23,872
Here:
27.5% of AGI
State:
18.2% of AGI
(% of AGI for various income ranges: 22.8% for AGIs below $25k, 14.2% for AGIs $25k-50k, 18.9% for AGIs $50k-75k, 17.3% for AGIs $75k-100k, 15.4% for AGIs $100k-200k)
Charity contributions: $4,327 (reported on 32.6% of returns)
Here:
$4,327
State:
$4,465
(% of AGI for various income ranges: 1.8% for AGIs below $25k, 2.8% for AGIs $50k-75k, 3.4% for AGIs $100k-200k)
Taxes paid: $6,706 (reported on 39.1% of returns)
98262:
$6,706
State:
$6,400
(% of AGI for various income ranges: 4.2% for AGIs below $25k, 4.2% for AGIs $25k-50k, 5.3% for AGIs $50k-75k, 4.7% for AGIs $75k-100k, 4.1% for AGIs $100k-200k)
Earned income credit: $1,350 (reported on 13.0% of returns)
Here:
$1,350
State:
$2,073
(% of AGI for various income ranges: 3.9% for AGIs below $25k)
Percentage of individuals using paid preparers for their 2012 taxes: 50.0%
Here:
50%
State:
43%
(% for various income ranges: 38.9% for AGIs below $25k, 37.5% for AGIs $25k-50k, 87.5% for AGIs $50k-75k, 75.0% for AGIs $100k-200k)
Averages for the 2004 tax year for zip code 98262, filed in 2005:
Average Adjusted Gross Income (AGI) in 2004: $50,389 (Individual Income Tax Returns)
Here:
$50,389
State:
$54,331
Salary/wage: $38,034 (reported on 63.0% of returns)
Here:
$38,034
State:
$45,761
(% of AGI for various income ranges: 113.2% for AGIs below $10k, 55.1% for AGIs $10k-25k, 56.8% for AGIs $25k-50k, 55.7% for AGIs $50k-75k, 49.6% for AGIs $75k-100k, 37.1% for AGIs over 100k)
Taxable interest for individuals: $1,790 (reported on 62.0% of returns)
This zip code:
$1,790
Washington:
$2,110
(% of AGI for various income ranges: 9.0% for AGIs below $10k, 4.8% for AGIs $10k-25k, 2.9% for AGIs $25k-50k, 1.7% for AGIs $50k-75k, 2.4% for AGIs $75k-100k, 1.4% for AGIs over 100k)
Taxable dividends: $3,274 (reported on 40.6% of returns)
Here:
$3,274
State:
$5,879
(% of AGI for various income ranges: 12.5% for AGIs below $10k, 4.0% for AGIs $10k-25k, 2.5% for AGIs $25k-50k, 2.5% for AGIs $50k-75k, 3.4% for AGIs $75k-100k, 1.9% for AGIs over 100k)
Net capital gain/loss: +$9,091 (reported on 39.7% of returns)
Here:
+$9,091
State:
+$15,835
(% of AGI for various income ranges: -17.7% for AGIs below $10k, 4.2% for AGIs $10k-25k, 6.8% for AGIs $25k-50k, 0.9% for AGIs $50k-75k, 5.5% for AGIs $75k-100k, 11.3% for AGIs over 100k)
Profit/loss from business: +$10,121 (reported on 31.8% of returns)
Here:
+$10,121
State:
+$13,994
(% of AGI for various income ranges: 10.8% for AGIs below $10k, 10.4% for AGIs $10k-25k, 9.5% for AGIs $25k-50k, 8.7% for AGIs $50k-75k, 7.8% for AGIs $75k-100k, 3.0% for AGIs over 100k)
IRA payment deduction: $2,800 (reported on 2.1% of returns)
98262:
$2,800
Washington:
$3,001
Total itemized deductions: $17,416 (22% of AGI, reported on 39.5% of returns)
Here:
$17,416
State:
$19,669
Here:
22.0% of AGI
State:
20.7% of AGI
(% of AGI for various income ranges: 95.1% for AGIs below $10k, 17.0% for AGIs $10k-25k, 13.9% for AGIs $25k-50k, 20.5% for AGIs $50k-75k, 13.7% for AGIs $75k-100k, 8.3% for AGIs over 100k)
Charity contributions deductions: $2,555 (3% of AGI, reported on 33.1% of returns)
Here:
$2,555
State:
$3,569
Here:
3.0% of AGI
State:
3.5% of AGI
(% of AGI for various income ranges: 2.8% for AGIs below $10k, 2.0% for AGIs $10k-25k, 1.3% for AGIs $25k-50k, 1.6% for AGIs $50k-75k, 1.2% for AGIs $75k-100k, 1.9% for AGIs over 100k)
Total tax: $6,808 (reported on 81.4% of returns)
98262:
$6,808
State:
$9,065
(% of AGI for various income ranges: 8.3% for AGIs below $10k, 5.0% for AGIs $10k-25k, 7.2% for AGIs $25k-50k, 10.0% for AGIs $50k-75k, 12.1% for AGIs $75k-100k, 13.6% for AGIs over 100k)
Earned income credit: $1,393 (reported on 13.0% of returns)
Here:
$1,393
State:
$1,607
Percentage of individuals using paid preparers for their 2004 taxes: 56.4%
Here:
56%
State:
49%
(% for various income ranges: 45.4% for AGIs below $10k, 49.6% for AGIs $10k-25k, 57.1% for AGIs $25k-50k, 63.2% for AGIs $50k-75k, 66.7% for AGIs $75k-100k, 77.8% for AGIs over 100k)
Household received Food Stamps/SNAP in the past 12 months: 22 Household did not receive Food Stamps/SNAP in the past 12 months: 485
Women who had a birth in the past 12 months: 1 (2 now married, 0 unmarried) Women who did not have a birth in the past 12 months: 101 (46 now married, 55 unmarried)
Housing units in zip code 98262 with a mortgage: 300 (20 second mortgage, 20 both second mortgage and home equity loan) Median monthly owner costs for units with a mortgage: $2,017 Median monthly owner costs for units without a mortgage: $753
Residents with income below the poverty level in 2022:
This zip code:
10.4%
Whole state:
10.0%
Residents with income below 50% of the poverty level in 2022:
This zip code:
5.5%
Whole state:
4.6%
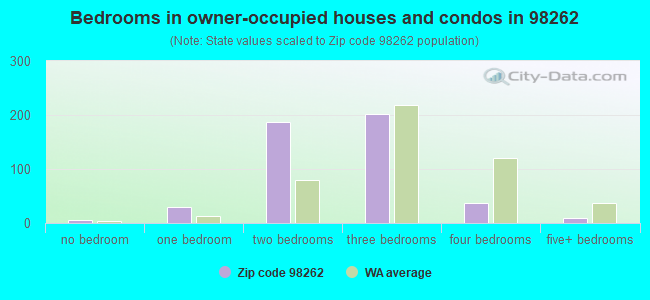
Median number of rooms in houses and condos:
Here:
5.7
State:
6.5
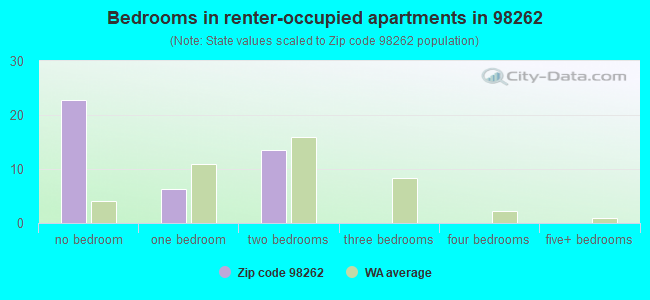
Median number of rooms in apartments:
Here:
1.5
State:
3.9
Notable locations in this zip code not listed on our city pages
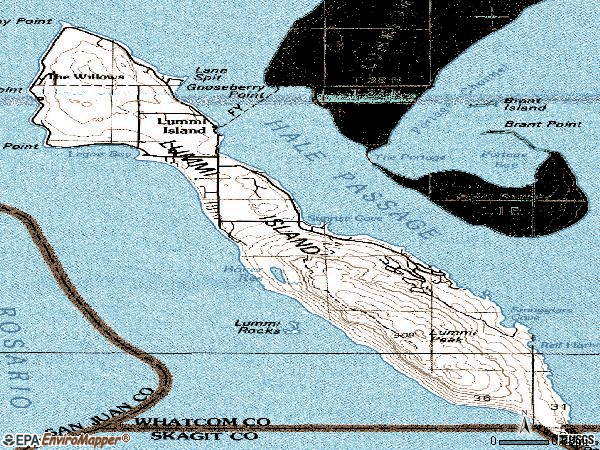
Notable locations in zip code 98262: Loganita Lodge (A), The Willows (B), Echo Lodge (C), Whatcom County Fire District 11 Lummi Island (D), Lummi Island Library (E). Display/hide their locations on the map
Size of family households: 174 2-persons, 43 3-persons, 41 4-persons
Size of nonfamily households: 225 1-person, 20 2-persons, 5 3-persons
50 married couples with children.
0 single-parent households ().
90.3% of residents of 98262 zip code speak English at home.
4.2% of residents speak Spanish at home (100% very well).
0.4% of residents speak other Indo-European language at home (100% very well).
6.5% of residents speak Asian or Pacific Island language at home (22% very well, 25% well, 52% not at all).
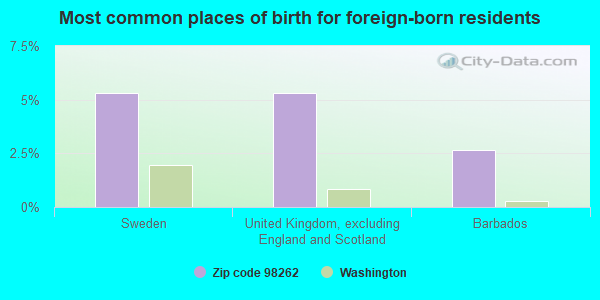
Foreign born population: 112 (11.5%) (7.5% of them are naturalized citizens)
This zip code:
11.5%
Whole state:
15.3%
5%Sweden
5%United Kingdom, excluding England and Scotland
3%Barbados
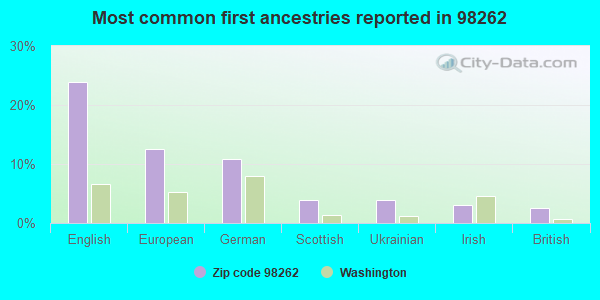
24%English
12%European
11%German
4%Scottish
4%Ukrainian
3%Irish
2%British
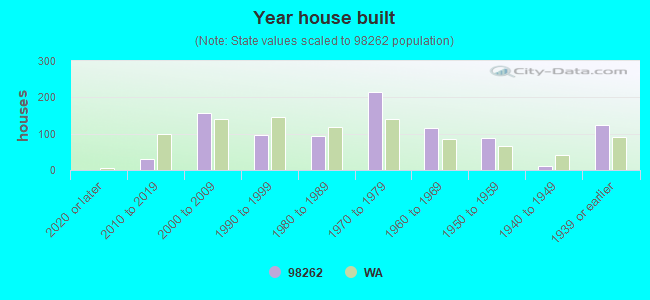
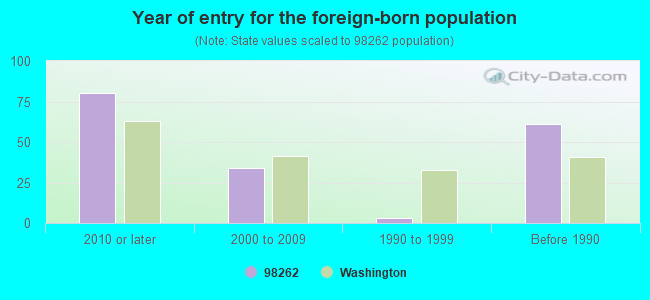
Year of entry for the foreign-born population
802010 or later
342000 to 2009
31990 to 1999
61Before 1990
Housing units lacking complete plumbing facilities: 7.2% Housing units lacking complete kitchen facilities: 5.5%
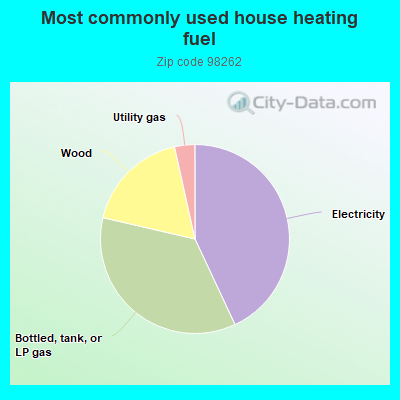
43.3%Electricity
35.8%Bottled, tank, or LP gas
18.0%Wood
3.5%Utility gas
Population in 1990: 628. Population change in the 1990s: +184 (+29.3%).
Place of birth for U.S.-born residents:
This state: 359
Northeast: 103
Midwest: 71
South: 43
West: 226
61% of the 98262 zip code residents lived in the same house 5 years ago. Out of people who lived in different houses, 53% lived in this county. Out of people who lived in different counties, 50% lived in Washington.
92% of the 98262 zip code residents lived in the same house 1 year ago. Out of people who lived in different houses, 17% moved from different county within same state. Out of people who lived in different houses, 43% moved from different state. Out of people who lived in different houses, 54% moved from abroad.
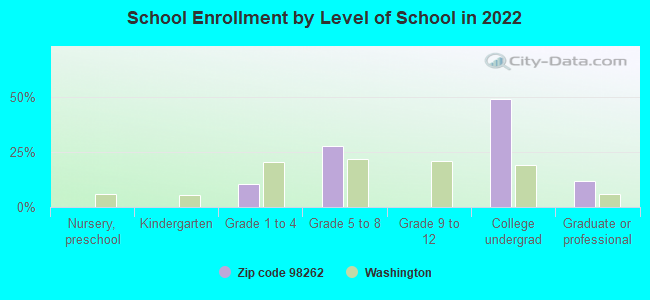
Private vs. public school enrollment:
Students in private schools in grades 1 to 8 (elementary and middle school):
Here:
0.0%
Washington:
12.4%
Students in private undergraduate colleges: 8
Here:
21.2%
Washington:
16.5%
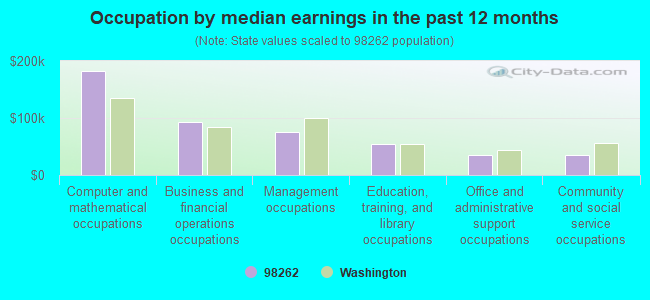
Occupation by median earnings in the past 12 months ($)
181,946Computer and mathematical occupations
93,775Business and financial operations occupations
75,594Management occupations
54,000Education, training, and library occupations
34,380Office and administrative support occupations
34,373Community and social service occupations
Top industries in this zip code by the number of employees in 2005:
Accommodation and Food Services: Bed-and-Breakfast Inns (10-19 employees: 1 establishment)
Accommodation and Food Services: Full-Service Restaurants (10-19: 1)
Construction: Framing Contractors (5-9: 1)
Construction: Residential Remodelers (1-4: 2)
Construction: Site Preparation Contractors (1-4: 2)
Construction: New Single-Family Housing Construction (except Operative Builders) (1-4: 2)
Construction: Drywall and Insulation Contractors (1-4: 1)
Administrative and Support and Waste Management and Remediation Services: Carpet and Upholstery Cleaning Services (1-4: 1)
Home Mortgage Disclosure Act Aggregated Statistics For Year 2009 (Based on 1 full tract)
A) FHA, FSA/RHS & VA Home Purchase Loans
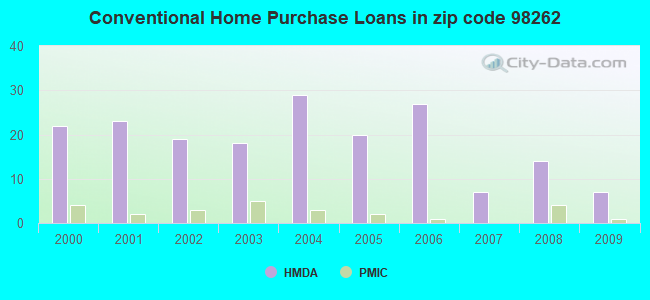
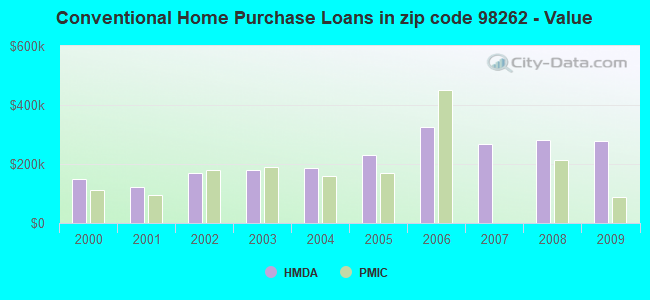
B) Conventional Home Purchase Loans
C) Refinancings
D) Home Improvement Loans
F) Non-occupant Loans on < 5 Family Dwellings (A B C & D)
G) Loans On Manufactured Home Dwelling (A B C & D)
Number
Average Value
Number
Average Value
Number
Average Value
Number
Average Value
Number
Average Value
Number
Average Value
LOANS ORIGINATED
1
$132,000
7
$278,714
60
$235,317
2
$258,500
26
$258,500
2
$112,000
APPLICATIONS APPROVED, NOT ACCEPTED
0
$0
1
$299,000
7
$269,714
0
$0
0
$0
0
$0
APPLICATIONS DENIED
0
$0
0
$0
14
$257,143
0
$0
3
$249,000
0
$0
APPLICATIONS WITHDRAWN
0
$0
0
$0
9
$225,778
0
$0
1
$222,000
1
$87,000
FILES CLOSED FOR INCOMPLETENESS
0
$0
0
$0
1
$55,000
0
$0
0
$0
0
$0
Aggregated Statistics For Year 2008 (Based on 1 full tract)
B) Conventional Home Purchase Loans
C) Refinancings
D) Home Improvement Loans
F) Non-occupant Loans on < 5 Family Dwellings (A B C & D)
G) Loans On Manufactured Home Dwelling (A B C & D)
Number
Average Value
Number
Average Value
Number
Average Value
Number
Average Value
Number
Average Value
LOANS ORIGINATED
14
$282,357
25
$289,800
5
$196,800
14
$271,357
1
$195,000
APPLICATIONS APPROVED, NOT ACCEPTED
3
$445,667
2
$133,000
0
$0
3
$445,667
0
$0
APPLICATIONS DENIED
0
$0
7
$247,429
4
$421,750
0
$0
2
$92,000
APPLICATIONS WITHDRAWN
1
$200,000
1
$260,000
1
$417,000
1
$260,000
0
$0
FILES CLOSED FOR INCOMPLETENESS
1
$270,000
0
$0
0
$0
0
$0
0
$0
Aggregated Statistics For Year 2007 (Based on 1 full tract)
B) Conventional Home Purchase Loans
C) Refinancings
D) Home Improvement Loans
F) Non-occupant Loans on < 5 Family Dwellings (A B C & D)
G) Loans On Manufactured Home Dwelling (A B C & D)
Number
Average Value
Number
Average Value
Number
Average Value
Number
Average Value
Number
Average Value
LOANS ORIGINATED
7
$267,286
31
$252,161
6
$142,333
9
$255,444
3
$136,333
APPLICATIONS APPROVED, NOT ACCEPTED
1
$380,000
1
$130,000
0
$0
0
$0
0
$0
APPLICATIONS DENIED
0
$0
13
$234,769
1
$350,000
6
$221,500
1
$75,000
APPLICATIONS WITHDRAWN
1
$284,000
5
$245,000
1
$26,000
1
$155,000
0
$0
FILES CLOSED FOR INCOMPLETENESS
0
$0
0
$0
0
$0
0
$0
0
$0
Aggregated Statistics For Year 2006 (Based on 1 full tract)
B) Conventional Home Purchase Loans
C) Refinancings
D) Home Improvement Loans
F) Non-occupant Loans on < 5 Family Dwellings (A B C & D)
G) Loans On Manufactured Home Dwelling (A B C & D)
Number
Average Value
Number
Average Value
Number
Average Value
Number
Average Value
Number
Average Value
LOANS ORIGINATED
27
$326,741
30
$251,933
9
$85,333
20
$304,400
1
$173,000
APPLICATIONS APPROVED, NOT ACCEPTED
1
$260,000
4
$235,250
0
$0
0
$0
0
$0
APPLICATIONS DENIED
9
$238,667
2
$230,000
2
$147,500
3
$282,333
0
$0
APPLICATIONS WITHDRAWN
0
$0
3
$161,000
3
$58,667
1
$117,000
0
$0
FILES CLOSED FOR INCOMPLETENESS
0
$0
1
$40,000
1
$200,000
1
$200,000
0
$0
Aggregated Statistics For Year 2005 (Based on 1 full tract)
A) FHA, FSA/RHS & VA Home Purchase Loans
B) Conventional Home Purchase Loans
C) Refinancings
D) Home Improvement Loans
F) Non-occupant Loans on < 5 Family Dwellings (A B C & D)
G) Loans On Manufactured Home Dwelling (A B C & D)
Number
Average Value
Number
Average Value
Number
Average Value
Number
Average Value
Number
Average Value
Number
Average Value
LOANS ORIGINATED
1
$180,000
20
$230,300
38
$196,079
1
$38,000
21
$202,476
2
$142,000
APPLICATIONS APPROVED, NOT ACCEPTED
0
$0
2
$162,000
4
$197,500
0
$0
2
$130,000
0
$0
APPLICATIONS DENIED
0
$0
0
$0
13
$224,615
1
$25,000
1
$255,000
0
$0
APPLICATIONS WITHDRAWN
0
$0
3
$158,333
4
$339,750
2
$233,000
0
$0
0
$0
FILES CLOSED FOR INCOMPLETENESS
0
$0
1
$392,000
4
$159,750
0
$0
0
$0
0
$0
Aggregated Statistics For Year 2004 (Based on 1 full tract)
A) FHA, FSA/RHS & VA Home Purchase Loans
B) Conventional Home Purchase Loans
C) Refinancings
D) Home Improvement Loans
F) Non-occupant Loans on < 5 Family Dwellings (A B C & D)
G) Loans On Manufactured Home Dwelling (A B C & D)
Number
Average Value
Number
Average Value
Number
Average Value
Number
Average Value
Number
Average Value
Number
Average Value
LOANS ORIGINATED
2
$108,500
29
$185,345
29
$182,552
7
$111,000
15
$213,733
5
$110,600
APPLICATIONS APPROVED, NOT ACCEPTED
0
$0
2
$120,000
4
$186,250
0
$0
3
$141,667
1
$50,000
APPLICATIONS DENIED
0
$0
4
$203,750
18
$239,833
1
$25,000
3
$264,000
1
$133,000
APPLICATIONS WITHDRAWN
0
$0
2
$246,500
7
$133,714
1
$35,000
1
$368,000
1
$44,000
FILES CLOSED FOR INCOMPLETENESS
0
$0
2
$233,000
3
$306,667
0
$0
2
$233,000
1
$146,000
Aggregated Statistics For Year 2003 (Based on 1 full tract)
A) FHA, FSA/RHS & VA Home Purchase Loans
B) Conventional Home Purchase Loans
C) Refinancings
D) Home Improvement Loans
F) Non-occupant Loans on < 5 Family Dwellings (A B C & D)
Number
Average Value
Number
Average Value
Number
Average Value
Number
Average Value
Number
Average Value
LOANS ORIGINATED
1
$143,000
18
$179,778
85
$158,424
1
$30,000
20
$163,450
APPLICATIONS APPROVED, NOT ACCEPTED
0
$0
2
$158,500
7
$174,857
1
$25,000
1
$157,000
APPLICATIONS DENIED
0
$0
1
$200,000
14
$206,571
1
$17,000
4
$226,250
APPLICATIONS WITHDRAWN
0
$0
2
$205,000
13
$166,846
0
$0
4
$137,750
FILES CLOSED FOR INCOMPLETENESS
0
$0
1
$155,000
0
$0
0
$0
0
$0
Aggregated Statistics For Year 2002 (Based on 1 full tract)
B) Conventional Home Purchase Loans
C) Refinancings
D) Home Improvement Loans
F) Non-occupant Loans on < 5 Family Dwellings (A B C & D)
Number
Average Value
Number
Average Value
Number
Average Value
Number
Average Value
LOANS ORIGINATED
19
$169,316
55
$165,855
3
$59,667
24
$134,125
APPLICATIONS APPROVED, NOT ACCEPTED
3
$181,667
3
$91,000
0
$0
2
$105,000
APPLICATIONS DENIED
0
$0
9
$287,444
1
$100,000
0
$0
APPLICATIONS WITHDRAWN
1
$185,000
5
$188,400
1
$49,000
1
$185,000
FILES CLOSED FOR INCOMPLETENESS
2
$100,000
1
$75,000
1
$30,000
0
$0
Aggregated Statistics For Year 2001 (Based on 1 full tract)
A) FHA, FSA/RHS & VA Home Purchase Loans
B) Conventional Home Purchase Loans
C) Refinancings
D) Home Improvement Loans
F) Non-occupant Loans on < 5 Family Dwellings (A B C & D)
Number
Average Value
Number
Average Value
Number
Average Value
Number
Average Value
Number
Average Value
LOANS ORIGINATED
0
$0
23
$123,174
30
$156,000
2
$17,000
12
$108,833
APPLICATIONS APPROVED, NOT ACCEPTED
0
$0
1
$79,000
2
$126,500
1
$39,000
0
$0
APPLICATIONS DENIED
1
$53,000
0
$0
9
$175,444
2
$67,500
1
$10,000
APPLICATIONS WITHDRAWN
0
$0
1
$71,000
12
$122,667
0
$0
2
$67,500
FILES CLOSED FOR INCOMPLETENESS
0
$0
0
$0
1
$212,000
1
$33,000
0
$0
Aggregated Statistics For Year 2000 (Based on 1 full tract)
B) Conventional Home Purchase Loans
C) Refinancings
D) Home Improvement Loans
F) Non-occupant Loans on < 5 Family Dwellings (A B C & D)
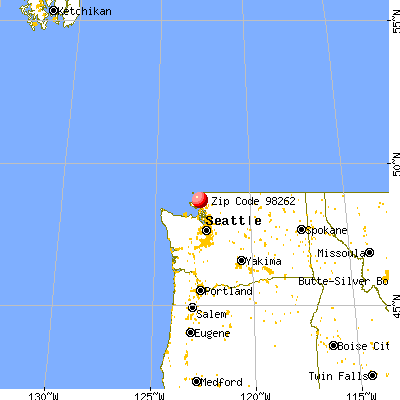


 Nearest zip codes: 98225, 98221, 98279, 98248, 98222, 98245.