Estimated zip code population in 2022: 9,459 Zip code population in 2010: 9,133 Zip code population in 2000: 8,317
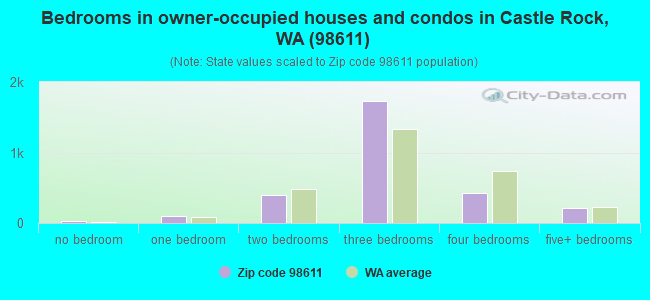
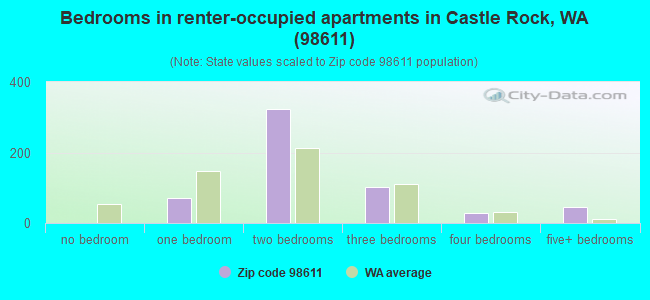
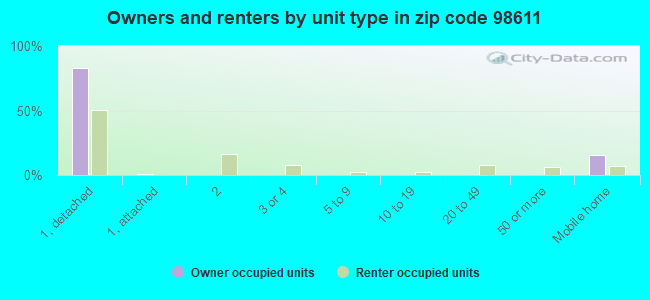
Houses and condos: 3,588 Renter-occupied apartments: 564
% of renters here:
16%
State:
36%
March 2022 cost of living index in zip code 98611: 89.0 (less than average, U.S. average is 100)
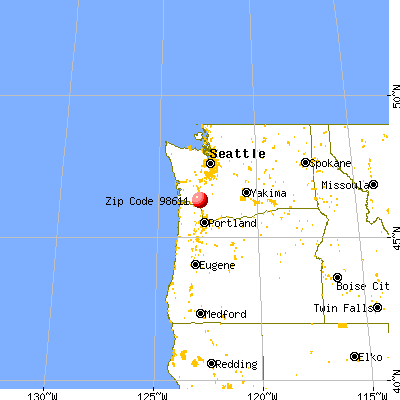
Land area: 124.6 sq. mi. Water area: 1.7 sq. mi.
Population density: 76 people per square mile
(very low).
OSM Map
General Map
Google Map
MSN Map
OSM Map
General Map
Google Map
MSN Map
OSM Map
General Map
Google Map
MSN Map
OSM Map
General Map
Google Map
MSN Map
Please wait while loading the map...
Real estate property taxes paid for housing units in 2022:
This zip code:
0.6% ($2,630)
Washington:
0.8% ($4,283)
Median real estate property taxes paid for housing units with mortgages in 2022: $2,637 (0.6%) Median real estate property taxes paid for housing units with no mortgage in 2022: $2,625 (0.7%)
Business Search- 14 Million verified businesses
Males: 4,516
(47.7%)
Females: 4,942
(52.3%)
For population 25 years and over in 98611:
High school or higher: 89.7%
Bachelor's degree or higher: 13.4%
Graduate or professional degree: 5.9%
Unemployed: 3.4%
Mean travel time to work (commute): 29.7 minutes
For population 15 years and over in 98611:
Never married: 21.7%
Now married: 57.6%
Separated: 2.1%
Widowed: 8.2%
Divorced: 10.3%
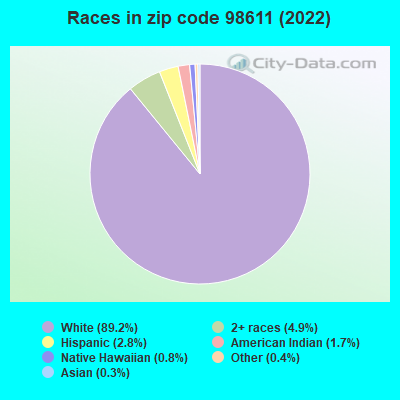
Zip code 98611 compared to state average:
Black race population percentage significantly below state average.
Hispanic race population percentage significantly below state average.
Median age above state average.
Foreign-born population percentage significantly below state average.
Renting percentage below state average.
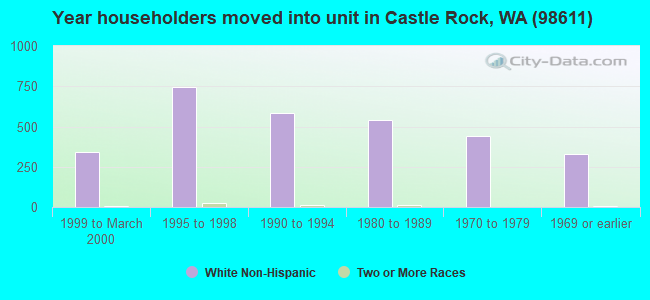
Length of stay since moving in significantly above state average.
Percentage of population with a bachelor's degree or higher significantly below state average.
Estimated median house/condo value in 2022: $421,170
98611:
$421,170
Washington:
$569,500
According to our research of Washington and other state lists, there were 6 registered sex offenders living in 98611 zip code as of May 28, 2024. The ratio of all residents to sex offenders in zip code 98611 is 1,720 to 1. The ratio of registered sex offenders to all residents in this zip code is lower than the state average.
Median resident age:
This zip code:
42.4 years
Washington median age:
38.4 years
Average household size:
This zip code:
2.7 people
Washington:
2.5 people
Averages for the 2020 tax year for zip code 98611, filed in 2021:
Average Adjusted Gross Income (AGI) in 2020: $71,336 (Individual Income Tax Returns)
Here:
$71,336
State:
$99,264
Salary/wage: $62,278 (reported on 77.2% of returns)
Here:
$62,278
State:
$80,347
(% of AGI for various income ranges: 1071.8% for AGIs below $25k, 2979.6% for AGIs $25k-50k, 5830.0% for AGIs $50k-75k, 8496.3% for AGIs $75k-100k, 16008.0% for AGIs $100k-200k, 72202.5% for AGIs over 200k)
Taxable interest for individuals: $1,239 (reported on 37.5% of returns)
This zip code:
$1,239
Washington:
$2,077
(% of AGI for various income ranges: 29.9% for AGIs below $25k, 32.3% for AGIs $25k-50k, 46.2% for AGIs $50k-75k, 59.6% for AGIs $75k-100k, 106.0% for AGIs $100k-200k, 1305.0% for AGIs over 200k)
Ordinary dividends: $3,580 (reported on 13.3% of returns)
Here:
$3,580
State:
$10,013
(% of AGI for various income ranges: 13.8% for AGIs below $25k, 19.6% for AGIs $25k-50k, 46.7% for AGIs $50k-75k, 79.1% for AGIs $75k-100k, 114.0% for AGIs $100k-200k, 1772.5% for AGIs over 200k)
Net capital gain/loss in AGI: +$25,317 (reported on 14.1% of returns)
Here:
+$25,317
State:
+$40,092
(% of AGI for various income ranges: 8.5% for AGIs below $25k, 25.5% for AGIs $25k-50k, 72.4% for AGIs $50k-75k, 113.3% for AGIs $75k-100k, 479.3% for AGIs $100k-200k, 33880.0% for AGIs over 200k)
Profit/loss from business: +$9,194 (reported on 10.5% of returns)
Here:
+$9,194
State:
+$18,312
(% of AGI for various income ranges: 60.2% for AGIs below $25k, 56.8% for AGIs $25k-50k, 130.8% for AGIs $50k-75k, 90.0% for AGIs $75k-100k, 348.7% for AGIs $100k-200k, 892.5% for AGIs over 200k)
Taxable individual retirement arrangement distribution: $19,756 (reported on 11.5% of returns)
98611:
$19,756
Washington:
$24,221
(% of AGI for various income ranges: 90.6% for AGIs below $25k, 151.5% for AGIs $25k-50k, 266.3% for AGIs $50k-75k, 404.8% for AGIs $75k-100k, 619.8% for AGIs $100k-200k, 4352.5% for AGIs over 200k)
Total itemized deductions: $31,390 (reported on 6.2% of returns)
Here:
$31,390
State:
$39,068
(% of AGI for various income ranges: 124.6% for AGIs $25k-50k, 175.4% for AGIs $50k-75k, 284.6% for AGIs $75k-100k, 508.0% for AGIs $100k-200k, 7775.0% for AGIs over 200k)
Charity contributions: $8,885 (reported on 4.0% of returns)
Here:
$8,885
State:
$15,331
(% of AGI for various income ranges: 8.7% for AGIs $25k-50k, 11.1% for AGIs $50k-75k, 50.4% for AGIs $75k-100k, 80.2% for AGIs $100k-200k, 2282.5% for AGIs over 200k)
Taxes paid: $5,810 (reported on 6.2% of returns)
98611:
$5,810
State:
$7,774
(% of AGI for various income ranges: 20.4% for AGIs $25k-50k, 39.2% for AGIs $50k-75k, 61.5% for AGIs $75k-100k, 119.7% for AGIs $100k-200k, 907.5% for AGIs over 200k)
Earned income credit: $2,010 (reported on 11.9% of returns)
Here:
$2,010
State:
$2,020
(% of AGI for various income ranges: 69.5% for AGIs below $25k, 57.3% for AGIs $25k-50k)
Percentage of individuals using paid preparers for their 2020 taxes: 93.3%
Here:
93%
State:
93%
(% for various income ranges: 91.3% for AGIs below $25k, 94.7% for AGIs $25k-50k, 92.9% for AGIs $50k-75k, 93.5% for AGIs $75k-100k, 94.7% for AGIs $100k-200k, 93.8% for AGIs over 200k)
Averages for the 2012 tax year for zip code 98611, filed in 2013:
Average Adjusted Gross Income (AGI) in 2012: $52,561 (Individual Income Tax Returns)
Here:
$52,561
State:
$69,533
Salary/wage: $47,023 (reported on 78.8% of returns)
Here:
$47,023
State:
$57,267
(% of AGI for various income ranges: 66.6% for AGIs below $25k, 65.8% for AGIs $25k-50k, 72.7% for AGIs $50k-75k, 78.6% for AGIs $75k-100k, 75.3% for AGIs $100k-200k, 42.5% for AGIs over 200k)
Taxable interest for individuals: $1,387 (reported on 42.2% of returns)
This zip code:
$1,387
Washington:
$1,816
(% of AGI for various income ranges: 1.9% for AGIs below $25k, 0.9% for AGIs $25k-50k, 1.0% for AGIs $50k-75k, 0.9% for AGIs $75k-100k, 0.9% for AGIs $100k-200k, 2.0% for AGIs over 200k)
Ordinary dividends: $2,382 (reported on 13.6% of returns)
Here:
$2,382
State:
$8,163
(% of AGI for various income ranges: 1.3% for AGIs below $25k, 0.9% for AGIs $25k-50k, 0.5% for AGIs $50k-75k, 0.4% for AGIs $75k-100k, 0.7% for AGIs $100k-200k)
Net capital gain/loss in AGI: +$6,023 (reported on 12.8% of returns)
Here:
+$6,023
State:
+$21,568
(% of AGI for various income ranges: 0.4% for AGIs $25k-50k, 0.5% for AGIs $50k-75k, 0.2% for AGIs $75k-100k, 2.0% for AGIs $100k-200k, 9.0% for AGIs over 200k)
Profit/loss from business: +$10,457 (reported on 11.4% of returns)
Here:
+$10,457
State:
+$16,521
(% of AGI for various income ranges: 3.8% for AGIs below $25k, 3.1% for AGIs $25k-50k, 1.9% for AGIs $50k-75k, 0.6% for AGIs $75k-100k, 3.5% for AGIs $100k-200k)
Taxable individual retirement arrangement distribution: $15,913 (reported on 12.8% of returns)
98611:
$15,913
Washington:
$18,648
(% of AGI for various income ranges: 3.9% for AGIs below $25k, 5.1% for AGIs $25k-50k, 3.8% for AGIs $50k-75k, 3.6% for AGIs $75k-100k, 4.7% for AGIs $100k-200k)
Total itemized deductions: $18,909 (22% of AGI, reported on 28.9% of returns)
Here:
$18,909
State:
$23,872
Here:
22.0% of AGI
State:
18.2% of AGI
(% of AGI for various income ranges: 10.3% for AGIs below $25k, 9.9% for AGIs $25k-50k, 10.0% for AGIs $50k-75k, 11.0% for AGIs $75k-100k, 11.1% for AGIs $100k-200k, 8.7% for AGIs over 200k)
Charity contributions: $3,268 (reported on 20.0% of returns)
Here:
$3,268
State:
$4,465
(% of AGI for various income ranges: 1.0% for AGIs below $25k, 1.0% for AGIs $25k-50k, 1.0% for AGIs $50k-75k, 1.1% for AGIs $75k-100k, 1.5% for AGIs $100k-200k, 2.3% for AGIs over 200k)
Taxes paid: $4,380 (reported on 28.9% of returns)
98611:
$4,380
State:
$6,400
(% of AGI for various income ranges: 1.5% for AGIs below $25k, 1.8% for AGIs $25k-50k, 2.3% for AGIs $50k-75k, 2.6% for AGIs $75k-100k, 2.9% for AGIs $100k-200k, 2.6% for AGIs over 200k)
Earned income credit: $2,197 (reported on 14.6% of returns)
Here:
$2,197
State:
$2,073
(% of AGI for various income ranges: 5.4% for AGIs below $25k, 1.0% for AGIs $25k-50k)
Percentage of individuals using paid preparers for their 2012 taxes: 47.7%
Here:
48%
State:
43%
(% for various income ranges: 40.0% for AGIs below $25k, 48.4% for AGIs $25k-50k, 55.6% for AGIs $50k-75k, 46.9% for AGIs $75k-100k, 54.5% for AGIs $100k-200k, 80.0% for AGIs over 200k)
Averages for the 2004 tax year for zip code 98611, filed in 2005:
Average Adjusted Gross Income (AGI) in 2004: $42,601 (Individual Income Tax Returns)
Here:
$42,601
State:
$54,331
Salary/wage: $39,378 (reported on 82.6% of returns)
Here:
$39,378
State:
$45,761
(% of AGI for various income ranges: 142.2% for AGIs below $10k, 67.8% for AGIs $10k-25k, 75.0% for AGIs $25k-50k, 84.9% for AGIs $50k-75k, 81.5% for AGIs $75k-100k, 60.1% for AGIs over 100k)
Taxable interest for individuals: $1,691 (reported on 54.6% of returns)
This zip code:
$1,691
Washington:
$2,110
(% of AGI for various income ranges: 9.0% for AGIs below $10k, 3.4% for AGIs $10k-25k, 2.2% for AGIs $25k-50k, 1.1% for AGIs $50k-75k, 1.3% for AGIs $75k-100k, 3.6% for AGIs over 100k)
Taxable dividends: $1,630 (reported on 17.0% of returns)
Here:
$1,630
State:
$5,879
(% of AGI for various income ranges: 2.9% for AGIs below $10k, 1.2% for AGIs $10k-25k, 0.9% for AGIs $25k-50k, 0.2% for AGIs $50k-75k, 0.4% for AGIs $75k-100k, 0.8% for AGIs over 100k)
Net capital gain/loss: +$7,992 (reported on 16.7% of returns)
Here:
+$7,992
State:
+$15,835
(% of AGI for various income ranges: -3.4% for AGIs below $10k, 0.5% for AGIs $10k-25k, 0.7% for AGIs $25k-50k, 1.7% for AGIs $50k-75k, 2.7% for AGIs $75k-100k, 9.9% for AGIs over 100k)
Profit/loss from business: +$7,949 (reported on 12.6% of returns)
Here:
+$7,949
State:
+$13,994
(% of AGI for various income ranges: 4.7% for AGIs below $10k, 3.4% for AGIs $10k-25k, 3.1% for AGIs $25k-50k, 0.7% for AGIs $50k-75k, 1.4% for AGIs $75k-100k, 4.3% for AGIs over 100k)
IRA payment deduction: $3,161 (reported on 2.2% of returns)
98611:
$3,161
Washington:
$3,001
(% of AGI for various income ranges: 0.3% for AGIs $25k-50k, 0.1% for AGIs $50k-75k, 0.2% for AGIs $75k-100k, 0.1% for AGIs over 100k)
Self-employed pension: $12,357 (reported on 0.4% of returns)
Here:
$12,357
Washington:
$14,244
Total itemized deductions: $15,787 (24% of AGI, reported on 30.8% of returns)
Here:
$15,787
State:
$19,669
Here:
23.5% of AGI
State:
20.7% of AGI
(% of AGI for various income ranges: 22.4% for AGIs below $10k, 9.6% for AGIs $10k-25k, 10.5% for AGIs $25k-50k, 12.3% for AGIs $50k-75k, 12.8% for AGIs $75k-100k, 9.8% for AGIs over 100k)
Charity contributions deductions: $2,518 (4% of AGI, reported on 23.8% of returns)
Here:
$2,518
State:
$3,569
Here:
3.5% of AGI
State:
3.5% of AGI
(% of AGI for various income ranges: 1.2% for AGIs below $10k, 0.9% for AGIs $10k-25k, 1.1% for AGIs $25k-50k, 1.3% for AGIs $50k-75k, 1.5% for AGIs $75k-100k, 2.0% for AGIs over 100k)
Total tax: $5,282 (reported on 77.1% of returns)
98611:
$5,282
State:
$9,065
(% of AGI for various income ranges: 3.7% for AGIs below $10k, 3.8% for AGIs $10k-25k, 6.7% for AGIs $25k-50k, 8.1% for AGIs $50k-75k, 10.2% for AGIs $75k-100k, 17.0% for AGIs over 100k)
Earned income credit: $1,394 (reported on 12.7% of returns)
Here:
$1,394
State:
$1,607
Percentage of individuals using paid preparers for their 2004 taxes: 50.9%
Here:
51%
State:
49%
(% for various income ranges: 40.5% for AGIs below $10k, 51.9% for AGIs $10k-25k, 53.7% for AGIs $25k-50k, 49.7% for AGIs $50k-75k, 52.9% for AGIs $75k-100k, 68.5% for AGIs over 100k)
Likely homosexual households (counted as self-reported same-sex unmarried-partner households)
Lesbian couples: 0.4% of all households
Gay men: 0.0% of all households
Household received Food Stamps/SNAP in the past 12 months: 643 Household did not receive Food Stamps/SNAP in the past 12 months: 2,800
Women who had a birth in the past 12 months: 72 (47 now married, 23 unmarried) Women who did not have a birth in the past 12 months: 1,945 (964 now married, 978 unmarried)
Housing units in zip code 98611 with a mortgage: 1,782 (105 second mortgage, 18 home equity loan, 95 both second mortgage and home equity loan) Houses without a mortgage: 149
Median monthly owner costs for units with a mortgage: $1,664 Median monthly owner costs for units without a mortgage: $485
Residents with income below the poverty level in 2022:
This zip code:
7.9%
Whole state:
10.0%
Residents with income below 50% of the poverty level in 2022:
This zip code:
2.6%
Whole state:
4.6%
Median number of rooms in houses and condos:
Here:
6.3
State:
6.5
Median number of rooms in apartments:
Here:
4.1
State:
3.9
Notable locations in this zip code not listed on our city pages
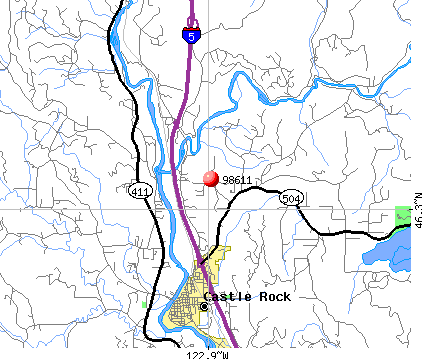
Notable locations in zip code 98611: Camp Cowlitz (A), Gardner (B), Castle Rock Fairgrounds (C), Tower (D), Vader Junction (E), Cowlitz County Fire District 3 Castle Rock Substation (F), Cowlitz County Fire District 6 Station 61 (G). Display/hide their locations on the map
Cemeteries: Independent Order of Odd Fellows Cemetery (1), Jackson Cemetery (2), Rosin Cemetery (3), Tower Cemetery (4), Whittle and Hubbard Cemetery (5). Display/hide their locations on the map
Rivers and creeks: Agren Creek (A), Arkansas Creek (B), Baxter Creek (C), Cline Creek (D), Delameter Creek (E), Dobson Creek (F), Hill Creek (G), Monahan Creek (H), Olequa Creek (I). Display/hide their locations on the map
In group quarters: 55 (-1 institutionalized population)
Size of family households: 958 2-persons, 470 3-persons, 597 4-persons, 184 5-persons, 63 6-persons, 63 7-or-more-persons
Size of nonfamily households: 819 1-person, 253 2-persons, 14 5-persons
1,256 married couples with children.
302 single-parent households (113 men, 189 women).
97.2% of residents of 98611 zip code speak English at home.
1.8% of residents speak Spanish at home (85% very well, 15% well).
0.4% of residents speak other Indo-European language at home (100% very well).
0.2% of residents speak Asian or Pacific Island language at home (20% very well, 80% well).
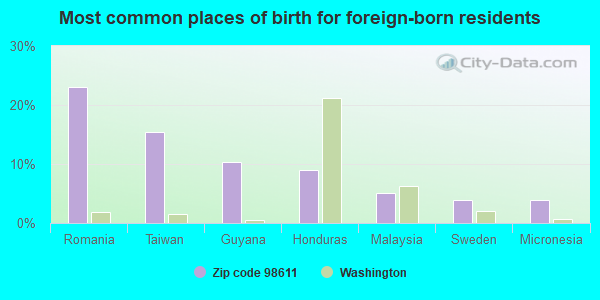
Foreign born population: 79 (0.8%) (70.2% of them are naturalized citizens)
This zip code:
0.8%
Whole state:
15.3%
23%Romania
15%Taiwan
10%Guyana
9%Honduras
5%Malaysia
4%Sweden
4%Micronesia
19%English
15%American
11%German
6%European
5%Irish
3%French
3%Norwegian
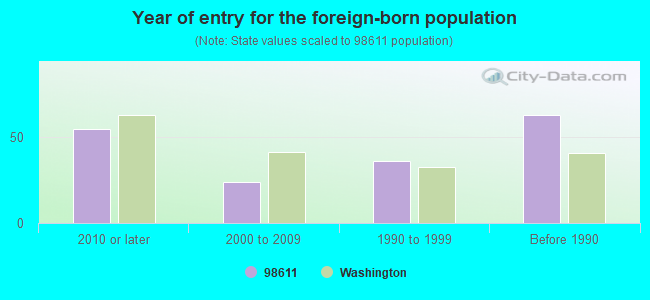
Year of entry for the foreign-born population
552010 or later
242000 to 2009
361990 to 1999
63Before 1990
Facilities with environmental interests located in this zip code:
CASTLE ROCK STP (118 CUMMINGS STREET SW in CASTLE ROCK, WA)
National Pollutant Discharge Elimination System NON-MAJOR (Tracking pollutant discharge elimination systems) - permit National Pollutant Discharge Elimination System NON-MAJOR (Tracking pollutant discharge elimination systems) - permit STATE MASTER (Washington State Department of Ecology's Facility/Site identification system) - TOXICS-100001, UNDERGROUND STORAGE TANK PROGRAM, WATQUAL-WA0022683, NPDES NON-MAJOR, WATQUAL-SO3004047, NPDES STORMWATER PERMIT Business SIC classification: SEWERAGE SYSTEMS Organizations: CASTLE ROCK CITY (CONTACT/OWNER)
Alternative names: CASTLE ROCK, CITY OF, CASTLE ROCK CITY UST 100001, CASTLE ROCK WASTEWATER TREATMENT PLANT, CASTLE ROCK WTP
ARCO 5903 PSI 5436 (1040 DOUGHERTY DR NE in CASTLE ROCK, WA)
Conditionally Exempt Small Quantity Generators, less than 100 kg/month of hazardous waste (Resource Conservation and Recovery Act (tracking hazardous waste)) STATE MASTER (Washington State Department of Ecology's Facility/Site identification system) - TOXICS-101917, UNDERGROUND STORAGE TANK PROGRAM, HAZWASTE-WA0000062349, EPCRA, CESQG Business SIC classification: GASOLINE SERVICE STATIONS Alternative names: ARCO 05903
CASTLE ROCK ELEMENTARY (700 HUNTINGTON AVE S in CASTLE ROCK, WA)
(National Center for Education Statistics) - STATE ID-2762 Organizations: CASTLE ROCK SCHOOL DIST 401 (SCHOOL DISTRICT)
CASTLE ROCK HIGH SCHOOL (5180 WESTSIDE HWY in CASTLE ROCK, WA)
(National Center for Education Statistics) - STATE ID-2281 Organizations: CASTLE ROCK SCHOOL DIST 401 (SCHOOL DISTRICT)
CASTLE ROCK MIDDLE SCHOOL (615 FRONT AVE SW in CASTLE ROCK, WA)
(National Center for Education Statistics) - STATE ID-3969 Organizations: CASTLE ROCK SCHOOL DIST 401 (SCHOOL DISTRICT)
CASTLE ROCK UPPER ELEMENTARY (1200 HUNTINGTON AVENUE in CASTLE ROCK, WA)
(National Center for Education Statistics) - STATE ID-3271 Organizations: CASTLE ROCK SCHOOL DIST 401 (SCHOOL DISTRICT)
CASTLE ROCK AUTO CARE (316 HUNTINGTON AVE S in CASTLE ROCK, WA)
(Resource Conservation and Recovery Act (tracking hazardous waste)) Business NAICS classification: GENERAL AUTOMOTIVE REPAIR. Organizations: ROBERT FEDERMAN (CONTACT/OPERATOR)
CASTLE ROCK WTP (302 COWLITZ STREET WEST in CASTLE ROCK, WA)
National Pollutant Discharge Elimination System NON-MAJOR (Tracking pollutant discharge elimination systems) - permit Business SIC classification: EXCAVATION WORK Organizations: CASTLE ROCK CITY (CONTACT/OWNER)
CASTLE ROCK AUTO CARE 107 (107 HUNTINGTON AVE S in CASTLE ROCK, WA)
(Resource Conservation and Recovery Act (tracking hazardous waste)) Business NAICS classification: GENERAL AUTOMOTIVE REPAIR.
CASTLE ROCK DRUG LAB (P E NO 10 & TITUS RDS in CASTLE ROCK, WA)
(Resource Conservation and Recovery Act (tracking hazardous waste)) Organizations: WA ECY (CONTACT/OWNER)
CHEVRON USA INC SS 95451 (1209 MT ST HELENS WAY NE in CASTLE ROCK, WA)
(Resource Conservation and Recovery Act (tracking hazardous waste)) Organizations: CHEVRON PRODUCTS CO (CONTACT/OWNER)
CASTLE ROCK SD 401 (700 HUNTINGTON AVENUE in CASTLE ROCK, WA)
COMPLIANCE ACTIVITY (Tracking inspections of insecticide, fungicide, and rodenticide, and toxic substances)
Housing units lacking complete plumbing facilities: 0.1% Housing units lacking complete kitchen facilities: 0.1%
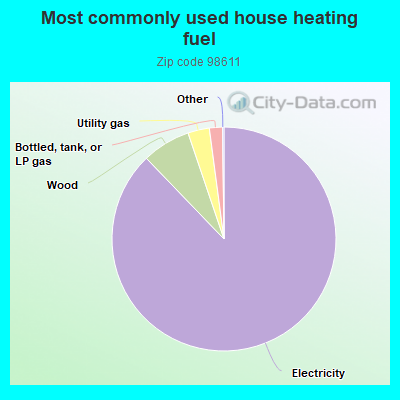
87.9%Electricity
7.0%Wood
3.1%Utility gas
1.9%Bottled, tank, or LP gas
Population in 1990: 8,455.
Place of birth for U.S.-born residents:
This state: 5,396
Northeast: 151
Midwest: 768
South: 678
West: 2,225
67% of the 98611 zip code residents lived in the same house 5 years ago. Out of people who lived in different houses, 74% lived in this county. Out of people who lived in different counties, 50% lived in Washington.
92% of the 98611 zip code residents lived in the same house 1 year ago. Out of people who lived in different houses, 75% moved from this county. Out of people who lived in different houses, 10% moved from different county within same state. Out of people who lived in different houses, 15% moved from different state.
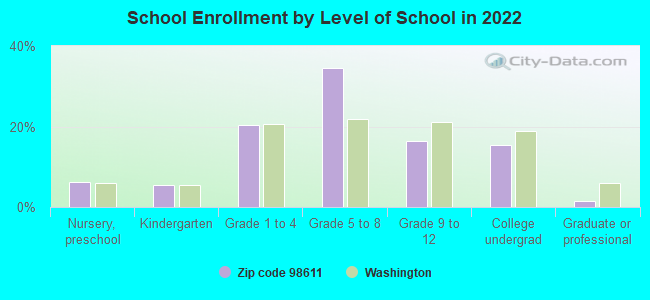
Private vs. public school enrollment:
Students in private schools in grades 1 to 8 (elementary and middle school): 86
Here:
8.1%
Washington:
12.4%
Students in private schools in grades 9 to 12 (high school): 3
Here:
1.2%
Washington:
9.2%
Students in private undergraduate colleges: 38
Here:
12.9%
Washington:
16.5%
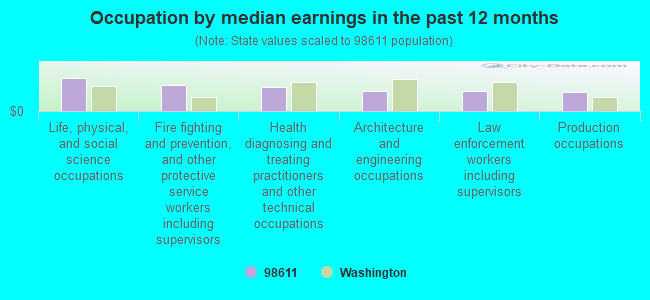
Occupation by median earnings in the past 12 months ($)
126,654Life, physical, and social science occupations
98,820Fire fighting and prevention, and other protective service workers including supervisors
92,057Health diagnosing and treating practitioners and other technical occupations
76,653Architecture and engineering occupations
74,962Law enforcement workers including supervisors
72,237Production occupations
Top industries in this zip code by the number of employees in 2005:
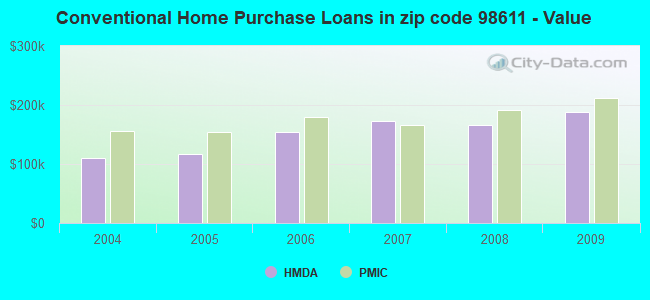
Detailed PMIC statistics for the following Tracts:0020.01
, 0020.02
2002 - 2018 National Fire Incident Reporting System (NFIRS) incidents
Based on the data from the years 2002 - 2018 the average number of fire incidents per year is 74. The highest number of fire incidents - 157 took place in 2006, and the least - 20 in 2013. The data has a dropping trend.
When looking into fire subcategories, the most incidents belonged to: Structure Fires (38.9%), and Outside Fires (29.3%).
Fire incident types reported to NFIRS in Zip Code 98611


 Nearest zip codes: 98645, 98593, 98581, 98632, 98626, 98596.


 Based on the data from the years 2002 - 2018 the average number of fire incidents per year is 74. The highest number of fire incidents - 157 took place in 2006, and the least - 20 in 2013. The data has a dropping trend.
 When looking into fire subcategories, the most incidents belonged to: Structure Fires (38.9%), and Outside Fires (29.3%).