Estimated zip code population in 2022: 13,311 Zip code population in 2010: 13,739 Zip code population in 2000: 13,570
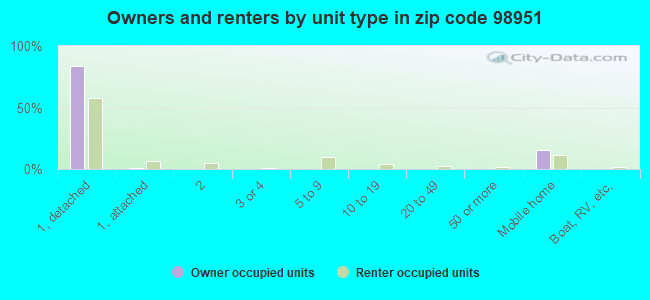
Houses and condos: 3,943 Renter-occupied apartments: 1,673
% of renters here:
46%
State:
36%
March 2022 cost of living index in zip code 98951: 93.6 (less than average, U.S. average is 100)
Land area: 150.4 sq. mi. Water area: 0.2 sq. mi.
Population density: 89 people per square mile
(very low).
OSM Map
General Map
Google Map
MSN Map
OSM Map
General Map
Google Map
MSN Map
OSM Map
General Map
Google Map
MSN Map
OSM Map
General Map
Google Map
MSN Map
Please wait while loading the map...
Real estate property taxes paid for housing units in 2022:
This zip code:
0.7% ($1,533)
Washington:
0.8% ($4,283)
Median real estate property taxes paid for housing units with mortgages in 2022: $1,687 (0.7%) Median real estate property taxes paid for housing units with no mortgage in 2022: $1,473 (0.8%)
Business Search- 14 Million verified businesses
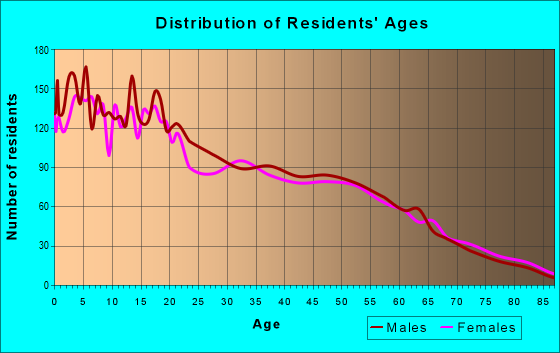
Males: 6,922
(52.0%)
Females: 6,389
(48.0%)
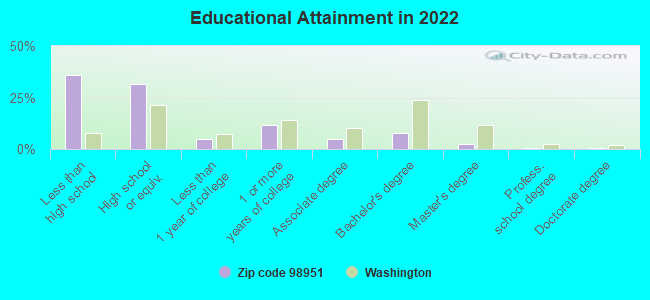
For population 25 years and over in 98951:
High school or higher: 62.4%
Bachelor's degree or higher: 10.8%
Graduate or professional degree: 3.3%
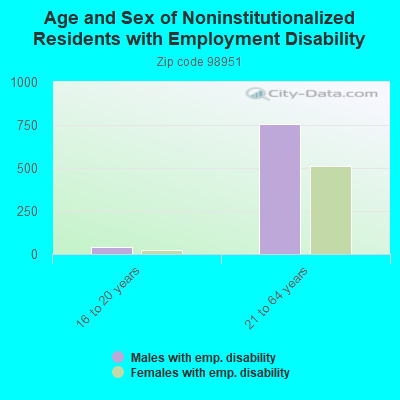
Unemployed: 8.2%
Mean travel time to work (commute): 20.0 minutes
For population 15 years and over in 98951:
Never married: 43.7%
Now married: 40.7%
Separated: 3.0%
Widowed: 4.9%
Divorced: 7.6%
Zip code 98951 compared to state average:
Median household income below state average.
Median house value significantly below state average.
Unemployed percentage above state average.
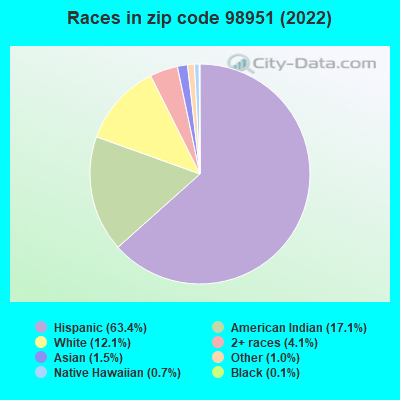
Black race population percentage significantly below state average.
Hispanic race population percentage significantly above state average.
Median age significantly below state average.
Foreign-born population percentage above state average.
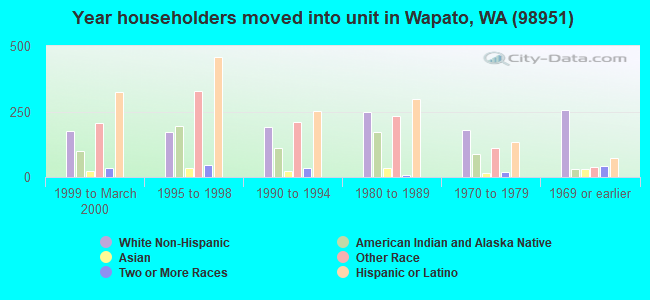
Length of stay since moving in significantly above state average.
Percentage of population with a bachelor's degree or higher significantly below state average.
Estimated median house/condo value in 2022: $211,006
98951:
$211,006
Washington:
$569,500
According to our research of Washington and other state lists, there were 7 registered sex offenders living in 98951 zip code as of May 28, 2024. The ratio of all residents to sex offenders in zip code 98951 is 1,968 to 1. The ratio of registered sex offenders to all residents in this zip code is lower than the state average.
Median resident age:
This zip code:
29.8 years
Washington median age:
38.4 years
Average household size:
This zip code:
3.6 people
Washington:
2.5 people
Averages for the 2020 tax year for zip code 98951, filed in 2021:
Average Adjusted Gross Income (AGI) in 2020: $40,346 (Individual Income Tax Returns)
Here:
$40,346
State:
$99,264
Salary/wage: $35,787 (reported on 88.8% of returns)
Here:
$35,787
State:
$80,347
(% of AGI for various income ranges: 1438.0% for AGIs below $25k, 3850.5% for AGIs $25k-50k, 6944.5% for AGIs $50k-75k, 9769.5% for AGIs $75k-100k, 14840.0% for AGIs $100k-200k)
Taxable interest for individuals: $2,044 (reported on 10.6% of returns)
This zip code:
$2,044
Washington:
$2,077
(% of AGI for various income ranges: 6.3% for AGIs below $25k, 4.0% for AGIs $25k-50k, 30.5% for AGIs $50k-75k, 52.7% for AGIs $75k-100k, 242.9% for AGIs $100k-200k)
Ordinary dividends: $8,116 (reported on 4.3% of returns)
Here:
$8,116
State:
$10,013
(% of AGI for various income ranges: 4.7% for AGIs below $25k, 5.0% for AGIs $25k-50k, 19.3% for AGIs $50k-75k, 42.7% for AGIs $75k-100k, 114.1% for AGIs $100k-200k)
Net capital gain/loss in AGI: +$15,474 (reported on 4.7% of returns)
Here:
+$15,474
State:
+$40,092
(% of AGI for various income ranges: 2.5% for AGIs below $25k, 5.4% for AGIs $25k-50k, 44.4% for AGIs $50k-75k, 145.0% for AGIs $75k-100k, 671.8% for AGIs $100k-200k)
Profit/loss from business: +$10,992 (reported on 6.2% of returns)
Here:
+$10,992
State:
+$18,312
(% of AGI for various income ranges: 40.2% for AGIs below $25k, 45.0% for AGIs $25k-50k, 115.8% for AGIs $50k-75k, 161.4% for AGIs $75k-100k, 902.4% for AGIs $100k-200k)
Taxable individual retirement arrangement distribution: $14,721 (reported on 2.4% of returns)
98951:
$14,721
Washington:
$24,221
(% of AGI for various income ranges: 14.1% for AGIs below $25k, 15.0% for AGIs $25k-50k, 82.2% for AGIs $50k-75k, 658.8% for AGIs $100k-200k)
Total itemized deductions: $41,850 (reported on 1.0% of returns)
Here:
$41,850
State:
$39,068
(% of AGI for various income ranges: 45.6% for AGIs below $25k, 138.4% for AGIs $50k-75k, 594.7% for AGIs $100k-200k)
Charity contributions: $11,125 (reported on 0.7% of returns)
Here:
$11,125
State:
$15,331
(% of AGI for various income ranges: 202.3% for AGIs $75k-100k)
Taxes paid: $5,533 (reported on 1.0% of returns)
98951:
$5,533
State:
$7,774
(% of AGI for various income ranges: 8.8% for AGIs $25k-50k, 105.9% for AGIs $100k-200k)
Earned income credit: $2,576 (reported on 25.6% of returns)
Here:
$2,576
State:
$2,020
(% of AGI for various income ranges: 123.0% for AGIs below $25k, 104.4% for AGIs $25k-50k, 2.5% for AGIs $50k-75k)
Percentage of individuals using paid preparers for their 2020 taxes: 91.7%
Here:
92%
State:
93%
(% for various income ranges: 90.8% for AGIs below $25k, 92.1% for AGIs $25k-50k, 91.9% for AGIs $50k-75k, 93.3% for AGIs $75k-100k, 92.3% for AGIs $100k-200k, 100.0% for AGIs over 200k)
Averages for the 2012 tax year for zip code 98951, filed in 2013:
Average Adjusted Gross Income (AGI) in 2012: $34,612 (Individual Income Tax Returns)
Here:
$34,612
State:
$69,533
Salary/wage: $28,794 (reported on 89.9% of returns)
Here:
$28,794
State:
$57,267
(% of AGI for various income ranges: 88.1% for AGIs below $25k, 88.7% for AGIs $25k-50k, 83.7% for AGIs $50k-75k, 77.4% for AGIs $75k-100k, 63.8% for AGIs $100k-200k, 20.2% for AGIs over 200k)
Taxable interest for individuals: $2,270 (reported on 13.0% of returns)
This zip code:
$2,270
Washington:
$1,816
(% of AGI for various income ranges: 0.4% for AGIs below $25k, 0.3% for AGIs $25k-50k, 0.7% for AGIs $50k-75k, 0.8% for AGIs $75k-100k, 1.1% for AGIs $100k-200k, 2.8% for AGIs over 200k)
Ordinary dividends: $5,630 (reported on 5.0% of returns)
Here:
$5,630
State:
$8,163
(% of AGI for various income ranges: 0.7% for AGIs below $25k, 0.4% for AGIs $25k-50k, 0.4% for AGIs $50k-75k, 0.5% for AGIs $75k-100k, 1.1% for AGIs $100k-200k, 2.5% for AGIs over 200k)
Net capital gain/loss in AGI: +$19,565 (reported on 4.3% of returns)
Here:
+$19,565
State:
+$21,568
(% of AGI for various income ranges: 0.1% for AGIs below $25k, 1.0% for AGIs $50k-75k, 0.7% for AGIs $75k-100k, 4.9% for AGIs $100k-200k, 12.3% for AGIs over 200k)
Profit/loss from business: +$8,476 (reported on 6.1% of returns)
Here:
+$8,476
State:
+$16,521
(% of AGI for various income ranges: 1.8% for AGIs below $25k, 0.9% for AGIs $25k-50k, 2.3% for AGIs $50k-75k, 2.2% for AGIs $75k-100k, 3.0% for AGIs $100k-200k)
Taxable individual retirement arrangement distribution: $11,450 (reported on 3.0% of returns)
98951:
$11,450
Washington:
$18,648
(% of AGI for various income ranges: 0.5% for AGIs below $25k, 0.6% for AGIs $25k-50k, 1.0% for AGIs $50k-75k, 1.8% for AGIs $75k-100k, 3.7% for AGIs $100k-200k)
Total itemized deductions: $17,592 (17% of AGI, reported on 7.1% of returns)
Here:
$17,592
State:
$23,872
Here:
16.8% of AGI
State:
18.2% of AGI
(% of AGI for various income ranges: 1.6% for AGIs below $25k, 2.6% for AGIs $25k-50k, 4.7% for AGIs $50k-75k, 6.6% for AGIs $75k-100k, 7.4% for AGIs $100k-200k, 2.6% for AGIs over 200k)
Charity contributions: $3,729 (reported on 4.5% of returns)
Here:
$3,729
State:
$4,465
(% of AGI for various income ranges: 0.1% for AGIs below $25k, 0.2% for AGIs $25k-50k, 0.8% for AGIs $50k-75k, 0.8% for AGIs $75k-100k, 1.8% for AGIs $100k-200k)
Taxes paid: $3,903 (reported on 6.9% of returns)
98951:
$3,903
State:
$6,400
(% of AGI for various income ranges: 0.2% for AGIs below $25k, 0.5% for AGIs $25k-50k, 0.9% for AGIs $50k-75k, 1.5% for AGIs $75k-100k, 2.0% for AGIs $100k-200k, 0.7% for AGIs over 200k)
Earned income credit: $2,564 (reported on 31.7% of returns)
Here:
$2,564
State:
$2,073
(% of AGI for various income ranges: 8.4% for AGIs below $25k, 2.1% for AGIs $25k-50k)
Percentage of individuals using paid preparers for their 2012 taxes: 55.5%
Here:
55%
State:
43%
(% for various income ranges: 52.8% for AGIs below $25k, 58.2% for AGIs $25k-50k, 55.1% for AGIs $50k-75k, 57.9% for AGIs $75k-100k, 62.5% for AGIs $100k-200k, 100.0% for AGIs over 200k)
Averages for the 2004 tax year for zip code 98951, filed in 2005:
Average Adjusted Gross Income (AGI) in 2004: $24,473 (Individual Income Tax Returns)
Here:
$24,473
State:
$54,331
Salary/wage: $24,655 (reported on 91.3% of returns)
Here:
$24,655
State:
$45,761
(% of AGI for various income ranges: 89.6% for AGIs $10k-25k, 87.8% for AGIs $25k-50k, 84.8% for AGIs $50k-75k, 78.8% for AGIs $75k-100k, 51.8% for AGIs over 100k)
Taxable interest for individuals: $2,418 (reported on 23.7% of returns)
This zip code:
$2,418
Washington:
$2,110
(% of AGI for various income ranges: 1.6% for AGIs $10k-25k, 0.8% for AGIs $25k-50k, 1.0% for AGIs $50k-75k, 1.9% for AGIs $75k-100k, 7.9% for AGIs over 100k)
Taxable dividends: $2,156 (reported on 8.6% of returns)
Here:
$2,156
State:
$5,879
(% of AGI for various income ranges: 0.4% for AGIs $10k-25k, 0.4% for AGIs $25k-50k, 0.4% for AGIs $50k-75k, 1.2% for AGIs $75k-100k, 1.5% for AGIs over 100k)
Net capital gain/loss: +$8,827 (reported on 8.4% of returns)
Here:
+$8,827
State:
+$15,835
(% of AGI for various income ranges: 0.1% for AGIs $10k-25k, 0.4% for AGIs $25k-50k, 0.9% for AGIs $50k-75k, 2.8% for AGIs $75k-100k, 13.2% for AGIs over 100k)
Profit/loss from business: +$5,422 (reported on 6.7% of returns)
Here:
+$5,422
State:
+$13,994
(% of AGI for various income ranges: 1.2% for AGIs $10k-25k, 2.2% for AGIs $25k-50k, 1.5% for AGIs $50k-75k, 0.1% for AGIs $75k-100k, 0.0% for AGIs over 100k)
IRA payment deduction: $3,069 (reported on 2.0% of returns)
98951:
$3,069
Washington:
$3,001
(% of AGI for various income ranges: 0.2% for AGIs $10k-25k, 0.1% for AGIs $25k-50k, 0.4% for AGIs $50k-75k, 0.5% for AGIs over 100k)
Total itemized deductions: $15,297 (25% of AGI, reported on 8.8% of returns)
Here:
$15,297
State:
$19,669
Here:
25.5% of AGI
State:
20.7% of AGI
(% of AGI for various income ranges: 2.9% for AGIs $10k-25k, 4.5% for AGIs $25k-50k, 6.8% for AGIs $50k-75k, 7.4% for AGIs $75k-100k, 6.9% for AGIs over 100k)
Charity contributions deductions: $3,511 (5% of AGI, reported on 6.2% of returns)
Here:
$3,511
State:
$3,569
Here:
5.2% of AGI
State:
3.5% of AGI
(% of AGI for various income ranges: 0.3% for AGIs $10k-25k, 0.6% for AGIs $25k-50k, 1.0% for AGIs $50k-75k, 1.7% for AGIs $75k-100k, 1.7% for AGIs over 100k)
Total tax: $3,436 (reported on 50.0% of returns)
98951:
$3,436
State:
$9,065
(% of AGI for various income ranges: 2.0% for AGIs $10k-25k, 4.2% for AGIs $25k-50k, 7.9% for AGIs $50k-75k, 10.3% for AGIs $75k-100k, 17.6% for AGIs over 100k)
Earned income credit: $1,949 (reported on 34.7% of returns)
Here:
$1,949
State:
$1,607
Percentage of individuals using paid preparers for their 2004 taxes: 64.4%
Here:
64%
State:
49%
(% for various income ranges: 61.0% for AGIs below $10k, 64.9% for AGIs $10k-25k, 66.9% for AGIs $25k-50k, 61.2% for AGIs $50k-75k, 67.2% for AGIs $75k-100k, 70.9% for AGIs over 100k)
Likely homosexual households (counted as self-reported same-sex unmarried-partner households)
Lesbian couples: 0.0% of all households
Gay men: 0.2% of all households
Household received Food Stamps/SNAP in the past 12 months: 1,189 Household did not receive Food Stamps/SNAP in the past 12 months: 2,507
Women who had a birth in the past 12 months: 210 (118 now married, 85 unmarried) Women who did not have a birth in the past 12 months: 2,845 (947 now married, 1,907 unmarried)
Housing units in zip code 98951 with a mortgage: 899 (67 second mortgage, 38 both second mortgage and home equity loan) Median monthly owner costs for units with a mortgage: $1,250 Median monthly owner costs for units without a mortgage: $391
Residents with income below the poverty level in 2022:
This zip code:
21.4%
Whole state:
10.0%
Residents with income below 50% of the poverty level in 2022:
This zip code:
11.7%
Whole state:
4.6%
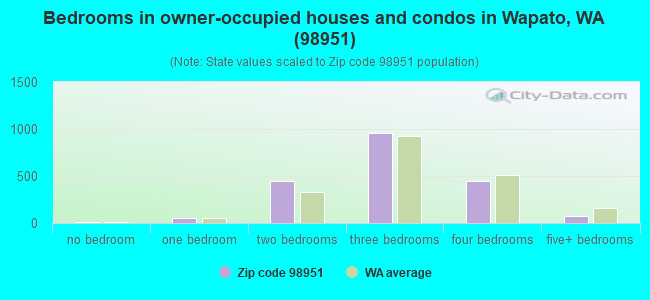
Median number of rooms in houses and condos:
Here:
6.0
State:
6.5
Median number of rooms in apartments:
Here:
4.7
State:
3.9
Notable locations in this zip code not listed on our city pages
Notable locations in zip code 98951: Parker Heights Grange (A), Parker Station (B), Utahco (C), Harrah Feedlot (D), Yakima County Fire District 5 Station 5 Parker (E), Yakima County Fire District 5 Station 7 Sawyer (F), Wapato Fire Department (G). Display/hide their locations on the map
1,807 married couples with children.
1,529 single-parent households (508 men, 1,021 women).
43.8% of residents of 98951 zip code speak English at home.
53.0% of residents speak Spanish at home (58% very well, 12% well, 13% not well, 16% not at all).
2.0% of residents speak Asian or Pacific Island language at home (63% very well, 30% well, 7% not well).
2.4% of residents speak other language at home (97% very well, 3% well).
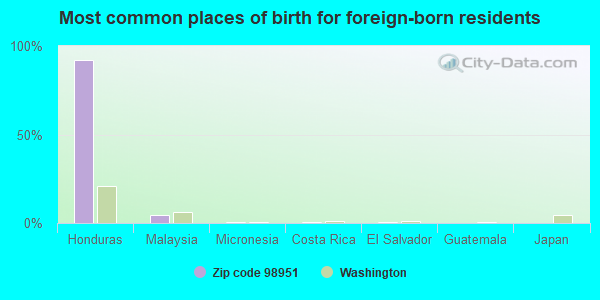
Foreign born population: 3,113 (23.4%) (27.5% of them are naturalized citizens)
This zip code:
23.4%
Whole state:
15.3%
92%Honduras
4%Malaysia
1%Micronesia
1%Costa Rica
1%El Salvador
0%Guatemala
0%Japan
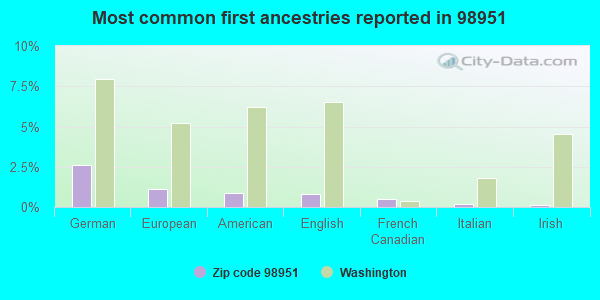
3%German
1%European
1%American
1%English
0%French Canadian
0%Italian
0%Irish
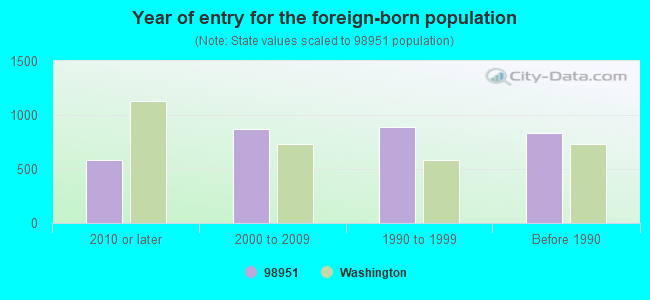
Year of entry for the foreign-born population
5852010 or later
8682000 to 2009
8911990 to 1999
835Before 1990
Major facilities with environmental interests located in this zip code:
AMTECH CORP YAKIMA DIV (180 E JONES RD in WAPATO, WA) . Tribal Land
AIR MAJOR (AIRS/AFS) - ICIS-, ENFORCEMENT/COMPLIANCE ACTIVITY ENFORCEMENT/COMPLIANCE ACTIVITY (Integrated Compliance Information System) Small Quantity Generators, between 100 kg and 1000 kg of hazardous waste/month (Resource Conservation and Recovery Act (tracking hazardous waste)) TRI REPORTER (Tracking of toxic chemicals releasing facilities) Business SIC classification: PLASTICS PRODUCTS; NONCLASSIFIABLE ESTABLISHMENTS Business NAICS classification: ALL OTHER PLASTICS PRODUCT MANUFACTURING. Organizations: AMTECH CORPORATION (CONTACT/OPERATOR)
Alternative names: AMTECH CORPORATION
ADAMS ELEMENTARY (1101 S CAMAS AVE in WAPATO, WA)
(National Center for Education Statistics) - STATE ID-4518 Organizations: WAPATO SCH DIST 207 (SCHOOL DISTRICT)
CAMAS ELEMENTARY (1002 N CAMAS RD in WAPATO, WA)
(National Center for Education Statistics) - STATE ID-2960 Organizations: WAPATO SCH DIST 207 (SCHOOL DISTRICT)
CONTINENTAL FLAVORS & FRAGRANCES INCORPORATED (RTE. 1 BOX 1220A BRANCH RD. in WAPATO, WA) . Tribal Land
TRI REPORTER (Tracking of toxic chemicals releasing facilities) STATE MASTER (Washington State Department of Ecology's Facility/Site identification system) - HAZWASTE-CRK000004070, TRI REPORTER Business SIC classification: FROZEN FRUITS, FRUIT JUICES, AND VEGETABLES Alternative names: CONTINENTAL FLAVORS& FRAGRANCE INC
ALAMO SERVICE (202 W 1ST ST in WAPATO, WA) . Tribal Land
CENTURY AUTOMOTIVE (390 S WAPATO RD in WAPATO, WA) . Tribal Land
ENFORCEMENT/COMPLIANCE ACTIVITY (Integrated Compliance Information System) (Resource Conservation and Recovery Act (tracking hazardous waste))
ALL WOOD COMPONENTS INC (470 E JONES RD in WAPATO, WA) . Tribal Land
(Resource Conservation and Recovery Act (tracking hazardous waste))
BOUCHEY POTATOES & APPLES (2310 EVANS ROAD in WAPATO, WA) . Tribal Land
AIR MINOR (AIRS/AFS) Business SIC classification: CHEMICALS AND CHEMICAL PREPARATIONS
CALHOUN FRUIT AND PRODUCE (421 SOUTH WAPATO ROAD in WAPATO, WA) . Tribal Land
AIR MINOR (AIRS/AFS) Business SIC classification: NONCLASSIFIABLE ESTABLISHMENTS
CAMPBELL FARM, THE (2527 CAMPBELL RD in WAPATO, WA) . Tribal Land
AIR MINOR (AIRS/AFS) Business SIC classification: NONCLASSIFIABLE ESTABLISHMENTS
CHRIS KLEBAUM (3900 W WAPATO in WAPATO, WA)
COMPLIANCE ACTIVITY (Tracking inspections of insecticide, fungicide, and rodenticide, and toxic substances)
AG AIR / HEIDI BOLONG (6261 ASHUE RD in WAPATO, WA)
COMPLIANCE ACTIVITY (Tracking inspections of insecticide, fungicide, and rodenticide, and toxic substances)
BOB ST. HILIARE, OWNER JSH FARMS (9980 EVANS RD in WAPATO, WA)
COMPLIANCE ACTIVITY (Tracking inspections of insecticide, fungicide, and rodenticide, and toxic substances)
Housing units lacking complete plumbing facilities: 2.3% Housing units lacking complete kitchen facilities: 3.7%
79.1%Electricity
8.0%Wood
4.9%Utility gas
3.2%Bottled, tank, or LP gas
2.2%Fuel oil, kerosene, etc.
1.9%Other fuel
0.8%No fuel used
Population in 1990: 10,262. Population change in the 1990s: +3,308 (+32.2%).
Place of birth for U.S.-born residents:
This state: 8,134
Northeast: 111
Midwest: 221
South: 409
West: 1,178
67% of the 98951 zip code residents lived in the same house 5 years ago. Out of people who lived in different houses, 90% lived in this county. Out of people who lived in different counties, 50% lived in Washington.
90% of the 98951 zip code residents lived in the same house 1 year ago. Out of people who lived in different houses, 70% moved from this county. Out of people who lived in different houses, 4% moved from different county within same state. Out of people who lived in different houses, 25% moved from different state. Out of people who lived in different houses, 2% moved from abroad.
Private vs. public school enrollment:
Students in private schools in grades 1 to 8 (elementary and middle school): 94
Here:
4.8%
Washington:
12.4%
Students in private schools in grades 9 to 12 (high school): 114
Here:
10.7%
Washington:
9.2%
Students in private undergraduate colleges: 99
Here:
25.1%
Washington:
16.5%
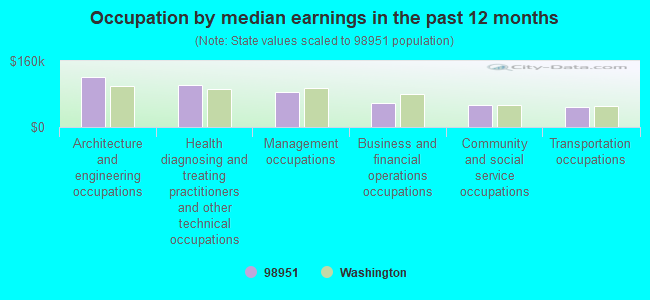
Occupation by median earnings in the past 12 months ($)
121,177Architecture and engineering occupations
102,117Health diagnosing and treating practitioners and other technical occupations
85,726Management occupations
57,070Business and financial operations occupations
54,205Community and social service occupations
47,788Transportation occupations
Companies with federal contracts located in this zip code:
D L T CONSTRUCTION, LLC (219 WEST FIRST STREET in WAPATO, WA; small business) : $9,527,846 in 95 contractsfrom 2001 to 2006
Contracts for Construction of Structures and Facilities -- Highways, Roads, Streets, Bridges, and Railways (includes resurfacing), Maintenance, Repair or Alteration of Real Property -- Miscellaneous Buildings, Maintenance, Repair or Alteration of Real Property -- Highways, Roads, Streets, Bridges, and Railways (includes resurfacing), Maintenance, Repair or Alteration of Real Property -- Office Buildings, and moreby Federal Highway Administration, Army, Air Force, Public Buildings Service, and others Signed by year:2000: $0; 2001: $119,000; 2002: $1,121,375; 2003: $1,677,238; 2004: $3,020,732; 2005: $2,564,409; 2006: $1,025,092.
Biggest contracts:
$648,900 with Federal Highway Administration for Construction of Structures and Facilities -- Highways, Roads, Streets, Bridges, and Railways (includes resurfacing). Signed on 2006-06-15. Completion date: 2006-10-06.
$535,169 with Army for Maintenance, Repair or Alteration of Real Property -- Miscellaneous Buildings. Signed on 2004-04-16. Completion date: 2005-04-21.
$526,573, same as above.Signed on 2004-09-17. Completion date: 2005-09-19.
$447,600 with Air Force for Maintenance, Repair or Alteration of Real Property -- Highways, Roads, Streets, Bridges, and Railways (includes resurfacing). Signed on 2003-10-23. Completion date: 2004-02-20.
Top industries in this zip code by the number of employees in 2005:
Wholesale Trade: Fresh Fruit and Vegetable Merchant Wholesalers (250-499 employees: 1 establishment, 20-49 employees: 2 establishments, 1-4 employees: 1 establishment)
Health Care and Social Assistance: Nursing Care Facilities (100-249: 1)
Educational Services: Exam Preparation and Tutoring (50-99: 1, 5-9: 1)
Health Care and Social Assistance: Child Day Care Services (20-49: 1, 10-19: 1, 1-4: 2)
People in group quarters in 2010:
70 people in nursing facilities/skilled-nursing facilities
63 people in local jails and other municipal confinement facilities
51 people in other noninstitutional facilities
22 people in workers' group living quarters and job corps centers
4 people in group homes intended for adults
3 people in emergency and transitional shelters (with sleeping facilities) for people experiencing homelessness
People in group quarters in 2000:
70 people in nursing homes
36 people in local jails and other confinement facilities (including police lockups)
6 people in other group homes
Fatal accident statistics in 2014:
Fatal accident count: 6
Vehicles involved in fatal accidents: 9
Fatal accidents caused by drunken drivers: 1
Fatalities: 7
Persons involved in fatal accidents: 11
Pedestrians involved in fatal accidents: 2
Fatal accident statistics in 2013:
Fatal accident count: 3
Vehicles involved in fatal accidents: 4
Fatal accidents caused by drunken drivers: 1
Fatalities: 3
Persons involved in fatal accidents: 7
Pedestrians involved in fatal accidents: 0
Home Mortgage Disclosure Act Aggregated Statistics For Year 2009 (Based on 1 full and 8 partial tracts)
A) FHA, FSA/RHS & VA Home Purchase Loans
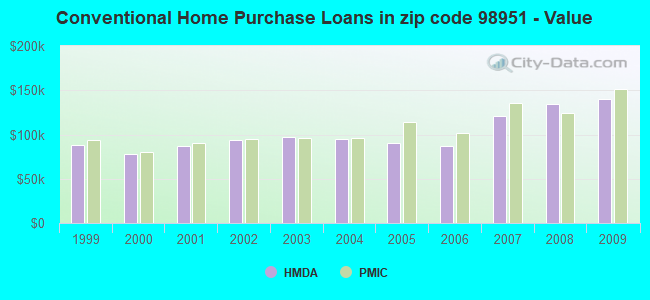
B) Conventional Home Purchase Loans
C) Refinancings
D) Home Improvement Loans
E) Loans on Dwellings For 5+ Families
F) Non-occupant Loans on < 5 Family Dwellings (A B C & D)
G) Loans On Manufactured Home Dwelling (A B C & D)
Number
Average Value
Number
Average Value
Number
Average Value
Number
Average Value
Number
Average Value
Number
Average Value
Number
Average Value
LOANS ORIGINATED
32
$138,821
25
$140,400
98
$138,128
13
$62,797
0
$0
6
$121,938
19
$119,784
APPLICATIONS APPROVED, NOT ACCEPTED
4
$127,295
4
$143,780
33
$122,560
5
$75,622
0
$0
1
$177,880
2
$116,195
APPLICATIONS DENIED
10
$104,333
10
$126,475
92
$136,270
19
$54,449
1
$921,720
10
$107,028
14
$108,816
APPLICATIONS WITHDRAWN
5
$138,590
6
$143,310
45
$134,454
6
$75,030
0
$0
5
$101,776
9
$104,780
FILES CLOSED FOR INCOMPLETENESS
1
$142,010
2
$65,405
9
$188,778
1
$10,030
0
$0
1
$87,110
1
$114,670
Aggregated Statistics For Year 2008 (Based on 1 full and 8 partial tracts)
A) FHA, FSA/RHS & VA Home Purchase Loans
B) Conventional Home Purchase Loans
C) Refinancings
D) Home Improvement Loans
E) Loans on Dwellings For 5+ Families
F) Non-occupant Loans on < 5 Family Dwellings (A B C & D)
G) Loans On Manufactured Home Dwelling (A B C & D)
Number
Average Value
Number
Average Value
Number
Average Value
Number
Average Value
Number
Average Value
Number
Average Value
Number
Average Value
LOANS ORIGINATED
31
$141,385
45
$134,674
89
$118,797
17
$47,913
1
$222,800
15
$169,002
22
$121,631
APPLICATIONS APPROVED, NOT ACCEPTED
1
$206,280
7
$138,333
28
$127,656
5
$21,568
0
$0
4
$102,260
2
$256,100
APPLICATIONS DENIED
14
$112,454
21
$154,373
166
$122,227
44
$57,433
0
$0
10
$97,672
26
$98,326
APPLICATIONS WITHDRAWN
5
$128,822
11
$111,313
54
$123,974
7
$83,910
0
$0
6
$90,233
7
$85,901
FILES CLOSED FOR INCOMPLETENESS
3
$128,667
4
$163,208
12
$123,229
0
$0
0
$0
1
$95,680
1
$101,390
Aggregated Statistics For Year 2007 (Based on 1 full and 8 partial tracts)
A) FHA, FSA/RHS & VA Home Purchase Loans
B) Conventional Home Purchase Loans
C) Refinancings
D) Home Improvement Loans
F) Non-occupant Loans on < 5 Family Dwellings (A B C & D)
G) Loans On Manufactured Home Dwelling (A B C & D)
Number
Average Value
Number
Average Value
Number
Average Value
Number
Average Value
Number
Average Value
Number
Average Value
LOANS ORIGINATED
13
$144,650
106
$120,854
97
$105,056
32
$44,980
20
$107,349
25
$114,572
APPLICATIONS APPROVED, NOT ACCEPTED
1
$84,510
22
$155,642
33
$99,121
4
$69,800
5
$108,168
8
$130,190
APPLICATIONS DENIED
9
$129,193
37
$101,253
206
$104,393
49
$59,678
23
$65,779
36
$96,735
APPLICATIONS WITHDRAWN
1
$124,030
13
$148,410
64
$126,448
10
$52,280
7
$146,113
5
$113,942
FILES CLOSED FOR INCOMPLETENESS
0
$0
3
$65,420
13
$147,685
1
$26,580
0
$0
1
$125,770
Aggregated Statistics For Year 2006 (Based on 1 full and 8 partial tracts)
A) FHA, FSA/RHS & VA Home Purchase Loans
B) Conventional Home Purchase Loans
C) Refinancings
D) Home Improvement Loans
F) Non-occupant Loans on < 5 Family Dwellings (A B C & D)
G) Loans On Manufactured Home Dwelling (A B C & D)
Number
Average Value
Number
Average Value
Number
Average Value
Number
Average Value
Number
Average Value
Number
Average Value
LOANS ORIGINATED
13
$124,733
104
$86,767
117
$99,390
26
$51,560
17
$85,790
30
$84,622
APPLICATIONS APPROVED, NOT ACCEPTED
2
$79,980
20
$78,481
41
$89,558
5
$55,570
5
$86,008
7
$90,914
APPLICATIONS DENIED
3
$79,830
49
$89,191
214
$102,616
52
$49,846
11
$74,396
46
$95,063
APPLICATIONS WITHDRAWN
3
$105,293
20
$109,728
97
$113,650
9
$52,624
6
$116,595
10
$95,328
FILES CLOSED FOR INCOMPLETENESS
2
$126,580
7
$145,336
28
$131,875
2
$109,505
2
$97,495
5
$100,524
Aggregated Statistics For Year 2005 (Based on 1 full and 8 partial tracts)
A) FHA, FSA/RHS & VA Home Purchase Loans
B) Conventional Home Purchase Loans
C) Refinancings
D) Home Improvement Loans
F) Non-occupant Loans on < 5 Family Dwellings (A B C & D)
G) Loans On Manufactured Home Dwelling (A B C & D)
Number
Average Value
Number
Average Value
Number
Average Value
Number
Average Value
Number
Average Value
Number
Average Value
LOANS ORIGINATED
13
$121,788
104
$90,655
128
$87,336
21
$71,880
12
$121,754
26
$100,863
APPLICATIONS APPROVED, NOT ACCEPTED
5
$119,662
20
$102,520
52
$74,702
7
$50,921
4
$51,885
5
$92,270
APPLICATIONS DENIED
11
$86,001
45
$87,623
223
$100,392
43
$47,475
16
$97,734
50
$105,966
APPLICATIONS WITHDRAWN
6
$104,732
17
$86,541
113
$121,182
7
$106,584
4
$102,358
20
$115,146
FILES CLOSED FOR INCOMPLETENESS
1
$56,000
3
$110,667
10
$108,303
0
$0
0
$0
0
$0
Aggregated Statistics For Year 2004 (Based on 1 full and 8 partial tracts)
A) FHA, FSA/RHS & VA Home Purchase Loans
B) Conventional Home Purchase Loans
C) Refinancings
D) Home Improvement Loans
E) Loans on Dwellings For 5+ Families
F) Non-occupant Loans on < 5 Family Dwellings (A B C & D)
G) Loans On Manufactured Home Dwelling (A B C & D)
Number
Average Value
Number
Average Value
Number
Average Value
Number
Average Value
Number
Average Value
Number
Average Value
Number
Average Value
LOANS ORIGINATED
18
$110,097
98
$94,450
154
$87,929
27
$40,948
1
$770,000
20
$97,175
31
$92,987
APPLICATIONS APPROVED, NOT ACCEPTED
3
$119,510
25
$91,484
28
$96,007
5
$41,744
0
$0
2
$43,780
6
$86,647
APPLICATIONS DENIED
4
$102,610
48
$84,756
192
$89,730
39
$36,123
0
$0
9
$84,330
36
$104,706
APPLICATIONS WITHDRAWN
7
$104,813
24
$92,668
104
$105,447
4
$85,695
0
$0
10
$79,486
12
$112,797
FILES CLOSED FOR INCOMPLETENESS
0
$0
3
$95,340
17
$98,839
0
$0
0
$0
1
$75,750
7
$114,380
Aggregated Statistics For Year 2003 (Based on 1 full and 8 partial tracts)
A) FHA, FSA/RHS & VA Home Purchase Loans
B) Conventional Home Purchase Loans
C) Refinancings
D) Home Improvement Loans
E) Loans on Dwellings For 5+ Families
F) Non-occupant Loans on < 5 Family Dwellings (A B C & D)
Number
Average Value
Number
Average Value
Number
Average Value
Number
Average Value
Number
Average Value
Number
Average Value
LOANS ORIGINATED
24
$95,810
82
$97,625
298
$93,976
8
$27,745
1
$161,000
11
$70,728
APPLICATIONS APPROVED, NOT ACCEPTED
7
$107,720
17
$82,531
48
$93,489
5
$33,896
0
$0
6
$58,145
APPLICATIONS DENIED
3
$85,233
50
$94,578
190
$87,201
11
$28,278
0
$0
6
$43,628
APPLICATIONS WITHDRAWN
6
$85,210
12
$82,651
76
$104,831
4
$18,822
0
$0
0
$0
FILES CLOSED FOR INCOMPLETENESS
2
$47,405
1
$82,620
12
$93,315
1
$13,100
0
$0
1
$140,780
Aggregated Statistics For Year 2002 (Based on 1 full and 8 partial tracts)
A) FHA, FSA/RHS & VA Home Purchase Loans
B) Conventional Home Purchase Loans
C) Refinancings
D) Home Improvement Loans
F) Non-occupant Loans on < 5 Family Dwellings (A B C & D)
Number
Average Value
Number
Average Value
Number
Average Value
Number
Average Value
Number
Average Value
LOANS ORIGINATED
25
$101,168
57
$93,741
167
$90,717
11
$21,184
12
$70,185
APPLICATIONS APPROVED, NOT ACCEPTED
4
$104,930
27
$101,858
32
$106,902
3
$18,243
3
$58,140
APPLICATIONS DENIED
10
$86,812
29
$83,479
138
$93,423
21
$19,680
9
$66,228
APPLICATIONS WITHDRAWN
1
$99,240
11
$92,254
78
$95,642
1
$16,540
4
$96,525
FILES CLOSED FOR INCOMPLETENESS
1
$120,570
3
$132,220
14
$110,419
2
$60,630
3
$113,040
Aggregated Statistics For Year 2001 (Based on 1 full and 8 partial tracts)
A) FHA, FSA/RHS & VA Home Purchase Loans
B) Conventional Home Purchase Loans
C) Refinancings
D) Home Improvement Loans
E) Loans on Dwellings For 5+ Families
F) Non-occupant Loans on < 5 Family Dwellings (A B C & D)
Number
Average Value
Number
Average Value
Number
Average Value
Number
Average Value
Number
Average Value
Number
Average Value
LOANS ORIGINATED
29
$88,503
62
$87,568
138
$87,785
21
$30,444
1
$104,000
16
$65,964
APPLICATIONS APPROVED, NOT ACCEPTED
1
$76,210
16
$84,168
32
$86,764
4
$15,145
0
$0
4
$68,892
APPLICATIONS DENIED
2
$87,055
49
$74,712
145
$79,340
26
$30,584
0
$0
6
$78,045
APPLICATIONS WITHDRAWN
1
$87,990
26
$96,785
86
$88,644
5
$19,354
1
$136,900
1
$92,240
FILES CLOSED FOR INCOMPLETENESS
0
$0
1
$60,250
14
$84,189
0
$0
0
$0
1
$64,000
Aggregated Statistics For Year 2000 (Based on 1 full and 8 partial tracts)
A) FHA, FSA/RHS & VA Home Purchase Loans
B) Conventional Home Purchase Loans
C) Refinancings
D) Home Improvement Loans
E) Loans on Dwellings For 5+ Families
F) Non-occupant Loans on < 5 Family Dwellings (A B C & D)
Number
Average Value
Number
Average Value
Number
Average Value
Number
Average Value
Number
Average Value
Number
Average Value
LOANS ORIGINATED
13
$92,235
95
$77,486
99
$68,922
16
$27,599
1
$144,050
16
$55,673
APPLICATIONS APPROVED, NOT ACCEPTED
2
$89,735
24
$95,315
18
$67,994
8
$11,185
0
$0
2
$83,795
APPLICATIONS DENIED
5
$88,768
71
$92,861
99
$71,828
25
$25,693
0
$0
7
$92,396
APPLICATIONS WITHDRAWN
3
$82,020
12
$59,258
40
$57,097
5
$53,672
0
$0
3
$52,020
FILES CLOSED FOR INCOMPLETENESS
1
$40,000
5
$44,862
29
$81,163
1
$88,960
0
$0
0
$0
Aggregated Statistics For Year 1999 (Based on 1 full and 3 partial tracts)
A) FHA, FSA/RHS & VA Home Purchase Loans
B) Conventional Home Purchase Loans
C) Refinancings
D) Home Improvement Loans
F) Non-occupant Loans on < 5 Family Dwellings (A B C & D)
2002 - 2018 National Fire Incident Reporting System (NFIRS) incidents
Based on the data from the years 2002 - 2018 the average number of fire incidents per year is 162. The highest number of reported fire incidents - 267 took place in 2003, and the least - 91 in 2016. The data has a declining trend.
When looking into fire subcategories, the most reports belonged to: Outside Fires (63.9%), and Structure Fires (17.8%).
Fire incident types reported to NFIRS in Zip Code 98951
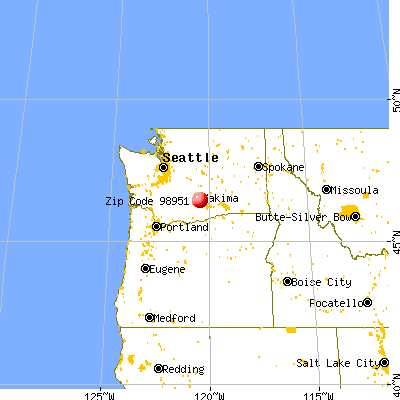


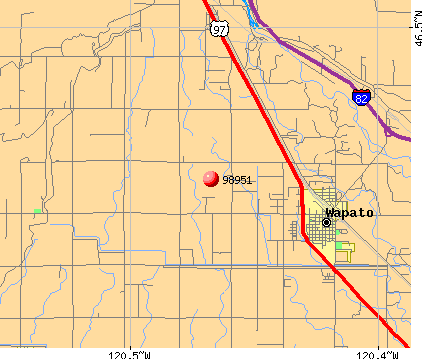 Nearest zip codes: 98939, 98933, 98902, 98921, 98948, 98908.
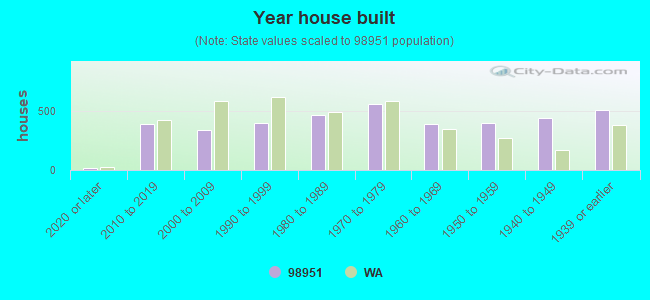


 . Tribal Land


 Based on the data from the years 2002 - 2018 the average number of fire incidents per year is 162. The highest number of reported fire incidents - 267 took place in 2003, and the least - 91 in 2016. The data has a declining trend.
 When looking into fire subcategories, the most reports belonged to: Outside Fires (63.9%), and Structure Fires (17.8%).