Estimated zip code population in 2022: 1,125 Zip code population in 2010: 1,064 Zip code population in 2000: 981
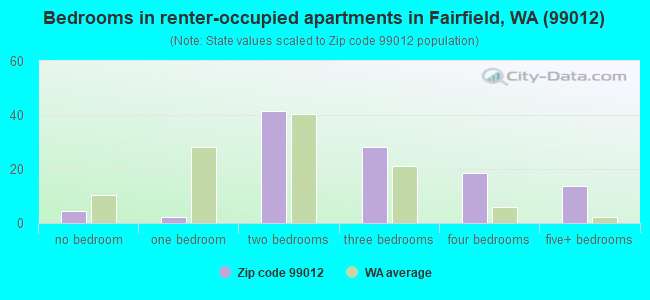
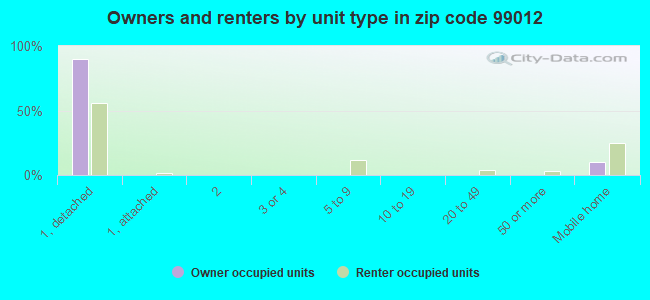
Houses and condos: 433 Renter-occupied apartments: 108
% of renters here:
31%
State:
36%
March 2022 cost of living index in zip code 99012: 88.0 (less than average, U.S. average is 100)
Land area: 95.1 sq. mi. Water area: 0.0 sq. mi.
Population density: 12 people per square mile
(very low).
OSM Map
General Map
Google Map
MSN Map
OSM Map
General Map
Google Map
MSN Map
OSM Map
General Map
Google Map
MSN Map
OSM Map
General Map
Google Map
MSN Map
Please wait while loading the map...
Real estate property taxes paid for housing units in 2022:
This zip code:
0.6% ($1,846)
Washington:
0.8% ($4,283)
Median real estate property taxes paid for housing units with mortgages in 2022: $1,734 (0.5%) Median real estate property taxes paid for housing units with no mortgage in 2022: $2,106 (0.8%)
Business Search- 14 Million verified businesses
Males: 562
(50.0%)
Females: 562
(50.0%)
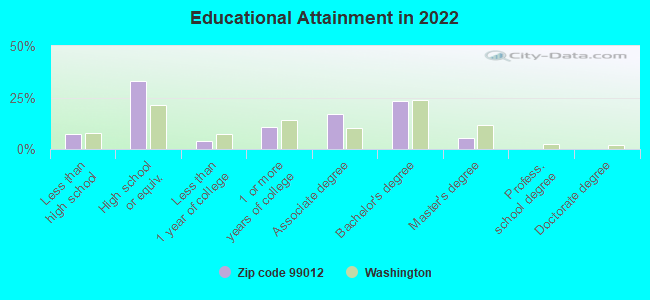
For population 25 years and over in 99012:
High school or higher: 91.0%
Bachelor's degree or higher: 28.0%
Graduate or professional degree: 5.3%
Unemployed: 10.2%
Mean travel time to work (commute): 34.2 minutes
For population 15 years and over in 99012:
Never married: 28.2%
Now married: 54.9%
Separated: 6.4%
Widowed: 3.8%
Divorced: 6.7%
Zip code 99012 compared to state average:
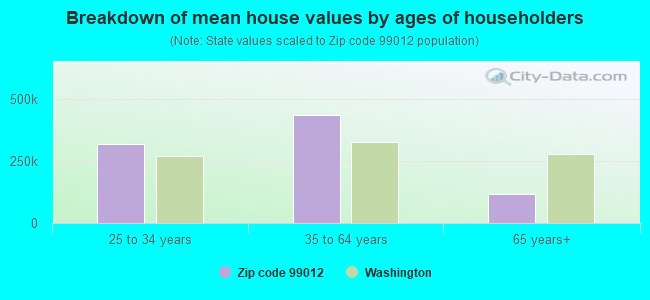
Median house value below state average.
Unemployed percentage above state average.
Black race population percentage significantly below state average.
Hispanic race population percentage significantly below state average.
Foreign-born population percentage significantly below state average.
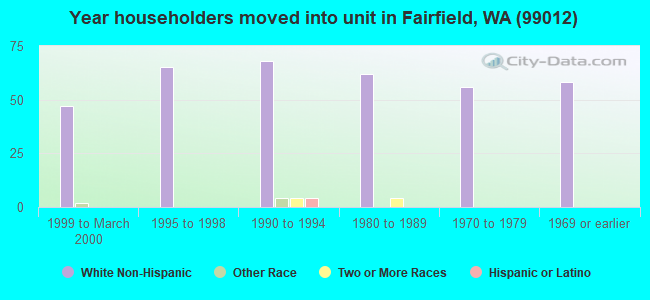
Length of stay since moving in significantly above state average.
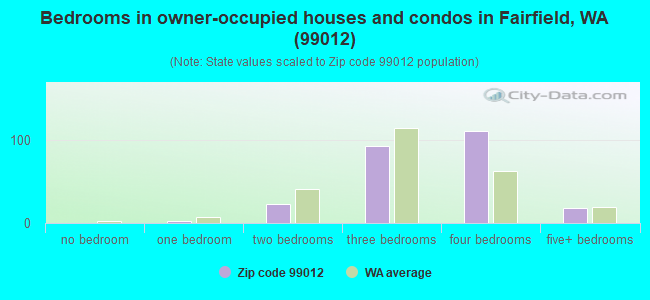
Number of rooms per house above state average.
House age significantly above state average.
Number of college students significantly below state average.
Averages for the 2020 tax year for zip code 99012, filed in 2021:
Average Adjusted Gross Income (AGI) in 2020: $64,840 (Individual Income Tax Returns)
Here:
$64,840
State:
$99,264
Salary/wage: $55,632 (reported on 82.2% of returns)
Here:
$55,632
State:
$80,347
(% of AGI for various income ranges: 1311.2% for AGIs below $25k, 4158.8% for AGIs $25k-50k, 6612.0% for AGIs $50k-75k, 7996.7% for AGIs $75k-100k, 26257.5% for AGIs $100k-200k)
Taxable interest for individuals: $631 (reported on 35.6% of returns)
This zip code:
$631
Washington:
$2,077
(% of AGI for various income ranges: 10.0% for AGIs below $25k, 45.0% for AGIs $25k-50k, 38.0% for AGIs $50k-75k, 95.0% for AGIs $100k-200k)
Ordinary dividends: $2,900 (reported on 15.6% of returns)
Here:
$2,900
State:
$10,013
(% of AGI for various income ranges: 73.8% for AGIs $25k-50k, 360.0% for AGIs $100k-200k)
Net capital gain/loss in AGI: +$10,800 (reported on 20.0% of returns)
Here:
+$10,800
State:
+$40,092
(% of AGI for various income ranges: 76.2% for AGIs $25k-50k, 2277.5% for AGIs $100k-200k)
Profit/loss from business: +$11,620 (reported on 11.1% of returns)
Here:
+$11,620
State:
+$18,312
(% of AGI for various income ranges: 197.5% for AGIs below $25k, 1057.5% for AGIs $100k-200k)
Taxable individual retirement arrangement distribution: $11,333 (reported on 6.7% of returns)
99012:
$11,333
Washington:
$24,221
(% of AGI for various income ranges: 425.0% for AGIs $25k-50k)
Earned income credit: $1,883 (reported on 13.3% of returns)
Here:
$1,883
State:
$2,020
(% of AGI for various income ranges: 80.0% for AGIs below $25k, 61.3% for AGIs $25k-50k)
Percentage of individuals using paid preparers for their 2020 taxes: 91.1%
Here:
91%
State:
93%
(% for various income ranges: 84.6% for AGIs below $25k, 100.0% for AGIs $25k-50k, 85.7% for AGIs $50k-75k, 100.0% for AGIs $75k-100k, 90.0% for AGIs $100k-200k)
Averages for the 2012 tax year for zip code 99012, filed in 2013:
Average Adjusted Gross Income (AGI) in 2012: $52,132 (Individual Income Tax Returns)
Here:
$52,132
State:
$69,533
Salary/wage: $41,782 (reported on 82.5% of returns)
Here:
$41,782
State:
$57,267
(% of AGI for various income ranges: 79.3% for AGIs below $25k, 75.0% for AGIs $25k-50k, 73.5% for AGIs $50k-75k, 73.8% for AGIs $75k-100k, 47.1% for AGIs $100k-200k)
Taxable interest for individuals: $771 (reported on 42.5% of returns)
This zip code:
$771
Washington:
$1,816
(% of AGI for various income ranges: 0.6% for AGIs below $25k, 1.4% for AGIs $25k-50k, 0.7% for AGIs $50k-75k, 0.3% for AGIs $75k-100k, 0.5% for AGIs $100k-200k)
Ordinary dividends: $2,700 (reported on 17.5% of returns)
Here:
$2,700
State:
$8,163
(% of AGI for various income ranges: 0.7% for AGIs below $25k, 0.7% for AGIs $25k-50k, 2.8% for AGIs $75k-100k)
Net capital gain/loss in AGI: +$600 (reported on 17.5% of returns)
Here:
+$600
State:
+$21,568
Profit/loss from business: +$2,280 (reported on 12.5% of returns)
Here:
+$2,280
State:
+$16,521
Taxable individual retirement arrangement distribution: $9,175 (reported on 10.0% of returns)
99012:
$9,175
Washington:
$18,648
Total itemized deductions: $15,160 (21% of AGI, reported on 25.0% of returns)
Here:
$15,160
State:
$23,872
Here:
20.7% of AGI
State:
18.2% of AGI
(% of AGI for various income ranges: 22.8% for AGIs below $25k, 9.4% for AGIs $50k-75k, 14.1% for AGIs $75k-100k)
Charity contributions: $3,929 (reported on 17.5% of returns)
Here:
$3,929
State:
$4,465
Taxes paid: $3,270 (reported on 25.0% of returns)
99012:
$3,270
State:
$6,400
(% of AGI for various income ranges: 3.7% for AGIs below $25k, 2.5% for AGIs $50k-75k, 3.1% for AGIs $75k-100k)
Earned income credit: $2,086 (reported on 17.5% of returns)
Here:
$2,086
State:
$2,073
(% of AGI for various income ranges: 5.7% for AGIs below $25k, 1.5% for AGIs $25k-50k)
Percentage of individuals using paid preparers for their 2012 taxes: 47.5%
Here:
48%
State:
43%
(% for various income ranges: 35.7% for AGIs below $25k, 50.0% for AGIs $25k-50k, 50.0% for AGIs $50k-75k, 50.0% for AGIs $75k-100k, 75.0% for AGIs $100k-200k)
Averages for the 2004 tax year for zip code 99012, filed in 2005:
Average Adjusted Gross Income (AGI) in 2004: $38,913 (Individual Income Tax Returns)
Here:
$38,913
State:
$54,331
Salary/wage: $31,922 (reported on 78.4% of returns)
Here:
$31,922
State:
$45,761
(% of AGI for various income ranges: 396.2% for AGIs below $10k, 66.0% for AGIs $10k-25k, 79.5% for AGIs $25k-50k, 70.9% for AGIs $50k-75k, 61.4% for AGIs $75k-100k, 37.8% for AGIs over 100k)
Taxable interest for individuals: $1,672 (reported on 56.0% of returns)
This zip code:
$1,672
Washington:
$2,110
(% of AGI for various income ranges: 64.1% for AGIs below $10k, 6.5% for AGIs $10k-25k, 2.0% for AGIs $25k-50k, 0.9% for AGIs $50k-75k, 0.8% for AGIs $75k-100k, 2.3% for AGIs over 100k)
Taxable dividends: $1,333 (reported on 27.5% of returns)
Here:
$1,333
State:
$5,879
(% of AGI for various income ranges: 17.9% for AGIs below $10k, 2.4% for AGIs $10k-25k, 0.2% for AGIs $25k-50k, 0.5% for AGIs $50k-75k, 0.8% for AGIs $75k-100k, 1.3% for AGIs over 100k)
Net capital gain/loss: +$7,692 (reported on 21.4% of returns)
Here:
+$7,692
State:
+$15,835
(% of AGI for various income ranges: -14.1% for AGIs below $10k, 0.9% for AGIs $10k-25k, 0.3% for AGIs $25k-50k, 1.3% for AGIs $50k-75k, 14.8% for AGIs over 100k)
Profit/loss from business: +$1,265 (reported on 11.5% of returns)
Here:
+$1,265
State:
+$13,994
Total itemized deductions: $15,798 (25% of AGI, reported on 24.5% of returns)
Here:
$15,798
State:
$19,669
Here:
24.9% of AGI
State:
20.7% of AGI
(% of AGI for various income ranges: 18.5% for AGIs $10k-25k, 7.3% for AGIs $25k-50k, 10.4% for AGIs $50k-75k, 8.8% for AGIs $75k-100k, 10.0% for AGIs over 100k)
Charity contributions deductions: $2,244 (3% of AGI, reported on 21.2% of returns)
Here:
$2,244
State:
$3,569
Here:
3.4% of AGI
State:
3.5% of AGI
(% of AGI for various income ranges: 1.0% for AGIs $10k-25k, 0.7% for AGIs $25k-50k, 1.3% for AGIs $50k-75k, 1.3% for AGIs $75k-100k, 1.8% for AGIs over 100k)
Total tax: $4,651 (reported on 74.8% of returns)
99012:
$4,651
State:
$9,065
(% of AGI for various income ranges: 19.2% for AGIs below $10k, 4.2% for AGIs $10k-25k, 6.7% for AGIs $25k-50k, 8.9% for AGIs $50k-75k, 11.0% for AGIs $75k-100k, 11.8% for AGIs over 100k)
Earned income credit: $2,018 (reported on 13.4% of returns)
Here:
$2,018
State:
$1,607
Percentage of individuals using paid preparers for their 2004 taxes: 50.4%
Here:
50%
State:
49%
(% for various income ranges: 45.9% for AGIs below $10k, 52.0% for AGIs $10k-25k, 45.8% for AGIs $25k-50k, 50.0% for AGIs $50k-75k, 50.0% for AGIs $75k-100k, 84.0% for AGIs over 100k)
Household received Food Stamps/SNAP in the past 12 months: 41 Household did not receive Food Stamps/SNAP in the past 12 months: 313
Women who had a birth in the past 12 months: 12 (13 now married, 0 unmarried) Women who did not have a birth in the past 12 months: 297 (136 now married, 161 unmarried)
Housing units in zip code 99012 with a mortgage: 160 (7 second mortgage) Houses without a mortgage: 13
Median monthly owner costs for units with a mortgage: $1,660 Median monthly owner costs for units without a mortgage: $531
Residents with income below the poverty level in 2022:
This zip code:
9.3%
Whole state:
10.0%
Residents with income below 50% of the poverty level in 2022:
This zip code:
3.1%
Whole state:
4.6%
Median number of rooms in houses and condos:
Here:
7.8
State:
6.5
Median number of rooms in apartments:
Here:
4.9
State:
3.9
Notable locations in this zip code not listed on our city pages
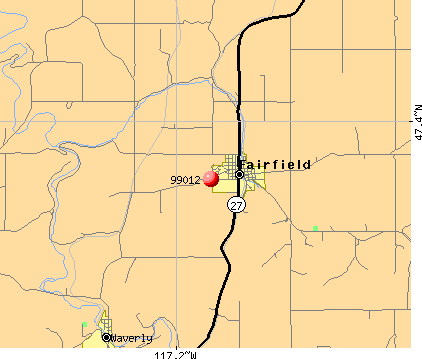
Notable locations in zip code 99012: Curlew (A), Jefferson (B), Fairfield Ambulance (C), Spokane County Fire District 2 (D). Display/hide their locations on the map
In group quarters: 64 (-1 institutionalized population)
Size of family households: 119 2-persons, 45 3-persons, 47 4-persons, 18 5-persons, 2 6-persons, 23 7-or-more-persons
Size of nonfamily households: 90 1-person, 6 2-persons
122 married couples with children.
29 single-parent households (4 men, 25 women).
99.3% of residents of 99012 zip code speak English at home.
Foreign born population: 0 (0.0%)
:
0.0%
Whole state:
15.3%
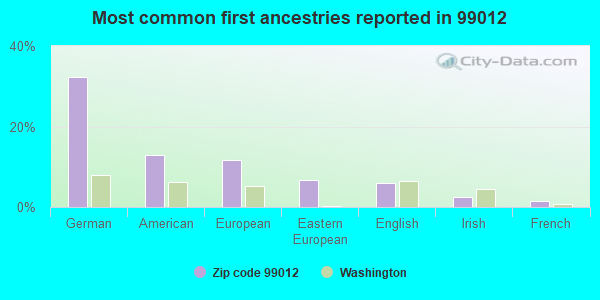
32%German
13%American
12%European
7%Eastern European
6%English
3%Irish
2%French
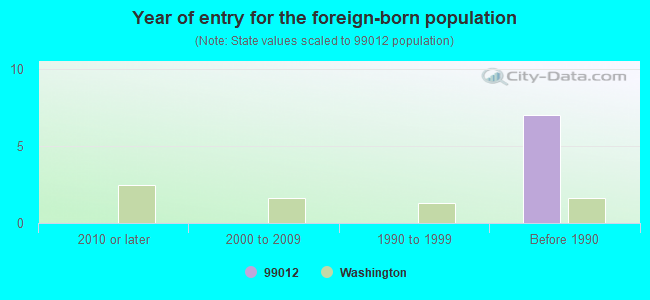
Year of entry for the foreign-born population
02010 or later
02000 to 2009
01990 to 1999
7Before 1990
Housing units lacking complete plumbing facilities: 2.5%
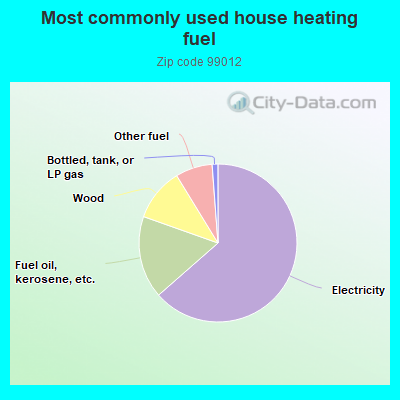
64.0%Electricity
17.0%Fuel oil, kerosene, etc.
10.9%Wood
7.6%Other fuel
1.2%Bottled, tank, or LP gas
Population in 1990: 641. Population change in the 1990s: +340 (+53.0%).
Place of birth for U.S.-born residents:
This state: 750
Northeast: 9
Midwest: 115
South: 34
West: 200
65% of the 99012 zip code residents lived in the same house 5 years ago. Out of people who lived in different houses, 52% lived in this county. Out of people who lived in different counties, 50% lived in Washington.
85% of the 99012 zip code residents lived in the same house 1 year ago. Out of people who lived in different houses, 60% moved from this county. Out of people who lived in different houses, 8% moved from different county within same state. Out of people who lived in different houses, 26% moved from different state. Out of people who lived in different houses, 2% moved from abroad.
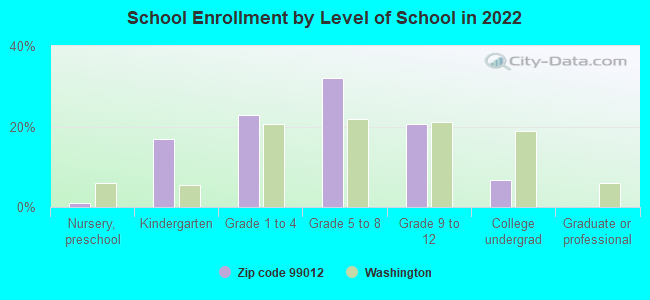
Private vs. public school enrollment:
Students in private schools in grades 1 to 8 (elementary and middle school):
Here:
0.0%
Washington:
12.4%
Students in private schools in grades 9 to 12 (high school):
Here:
0.0%
Washington:
9.2%
Students in private undergraduate colleges:
Here:
0.0%
Washington:
16.5%
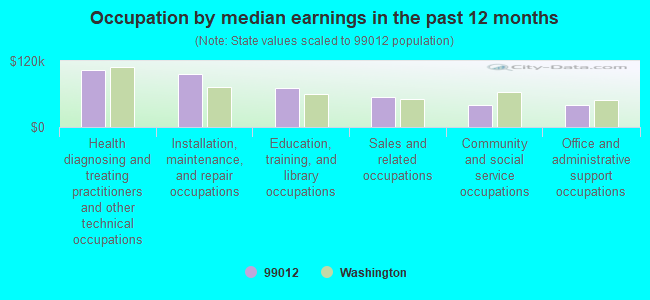
Occupation by median earnings in the past 12 months ($)
103,646Health diagnosing and treating practitioners and other technical occupations
97,153Installation, maintenance, and repair occupations
70,772Education, training, and library occupations
54,685Sales and related occupations
40,212Community and social service occupations
40,042Office and administrative support occupations
Top industries in this zip code by the number of employees in 2005:
Health Care and Social Assistance: Nursing Care Facilities (50-99 employees: 1 establishment)
Finance and Insurance: Commercial Banking (20-49: 1)
Other Services (except Public Administration): Religious Organizations (5-9: 1, 1-4: 1)
Accommodation and Food Services: Full-Service Restaurants (5-9: 1)
Health Care and Social Assistance: Homes for the Elderly (5-9: 1)
Other Services (except Public Administration): Commercial and Industrial Machinery and Equipment (except Automotive and Electronic) Repair and Maintenance (5-9: 1)
People in group quarters in 2010:
30 people in nursing facilities/skilled-nursing facilities
People in group quarters in 2000:
49 people in nursing homes
14 people in other noninstitutional group quarters
Home Mortgage Disclosure Act Aggregated Statistics For Year 2009 (Based on 2 partial tracts)
A) FHA, FSA/RHS & VA Home Purchase Loans
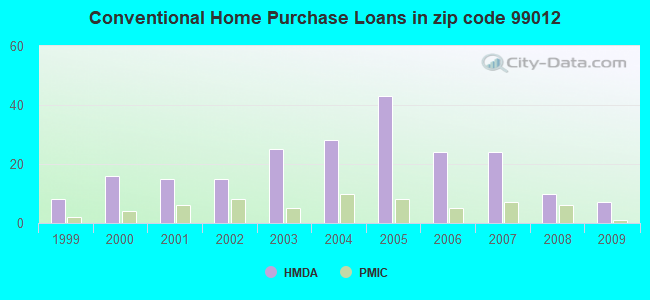
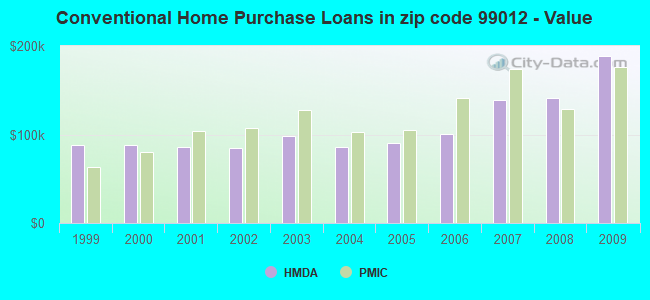
B) Conventional Home Purchase Loans
C) Refinancings
D) Home Improvement Loans
F) Non-occupant Loans on < 5 Family Dwellings (A B C & D)
G) Loans On Manufactured Home Dwelling (A B C & D)
Number
Average Value
Number
Average Value
Number
Average Value
Number
Average Value
Number
Average Value
Number
Average Value
LOANS ORIGINATED
6
$130,107
7
$188,214
40
$164,029
4
$83,920
1
$38,110
7
$120,006
APPLICATIONS APPROVED, NOT ACCEPTED
1
$128,330
1
$84,620
4
$123,288
0
$0
0
$0
1
$88,540
APPLICATIONS DENIED
2
$183,810
1
$154,110
15
$153,176
3
$90,597
0
$0
2
$130,295
APPLICATIONS WITHDRAWN
1
$151,870
2
$159,435
13
$202,994
1
$51,000
1
$147,390
1
$147,950
FILES CLOSED FOR INCOMPLETENESS
0
$0
1
$144,580
2
$136,740
0
$0
0
$0
1
$64,450
Aggregated Statistics For Year 2008 (Based on 2 partial tracts)
A) FHA, FSA/RHS & VA Home Purchase Loans
B) Conventional Home Purchase Loans
C) Refinancings
D) Home Improvement Loans
F) Non-occupant Loans on < 5 Family Dwellings (A B C & D)
G) Loans On Manufactured Home Dwelling (A B C & D)
Number
Average Value
Number
Average Value
Number
Average Value
Number
Average Value
Number
Average Value
Number
Average Value
LOANS ORIGINATED
4
$142,902
10
$141,781
33
$148,455
8
$49,665
1
$65,570
4
$102,692
APPLICATIONS APPROVED, NOT ACCEPTED
0
$0
2
$106,475
3
$123,850
1
$62,760
1
$78,460
2
$95,270
APPLICATIONS DENIED
2
$100,590
2
$122,730
18
$144,926
1
$75,650
0
$0
1
$107,040
APPLICATIONS WITHDRAWN
0
$0
2
$169,240
11
$150,136
0
$0
0
$0
2
$73,410
FILES CLOSED FOR INCOMPLETENESS
0
$0
0
$0
1
$80,700
0
$0
0
$0
0
$0
Aggregated Statistics For Year 2007 (Based on 2 partial tracts)
A) FHA, FSA/RHS & VA Home Purchase Loans
B) Conventional Home Purchase Loans
C) Refinancings
D) Home Improvement Loans
F) Non-occupant Loans on < 5 Family Dwellings (A B C & D)
G) Loans On Manufactured Home Dwelling (A B C & D)
Number
Average Value
Number
Average Value
Number
Average Value
Number
Average Value
Number
Average Value
Number
Average Value
LOANS ORIGINATED
4
$141,640
24
$139,142
39
$127,340
10
$55,592
8
$205,176
11
$123,695
APPLICATIONS APPROVED, NOT ACCEPTED
1
$49,880
4
$238,590
8
$173,934
3
$73,787
1
$348,010
1
$49,880
APPLICATIONS DENIED
2
$121,605
7
$164,357
26
$150,424
8
$83,850
1
$134,500
4
$128,613
APPLICATIONS WITHDRAWN
1
$61,080
3
$96,950
9
$115,629
0
$0
0
$0
1
$131,130
FILES CLOSED FOR INCOMPLETENESS
0
$0
1
$86,860
4
$115,582
1
$14,010
0
$0
0
$0
Aggregated Statistics For Year 2006 (Based on 2 partial tracts)
A) FHA, FSA/RHS & VA Home Purchase Loans
B) Conventional Home Purchase Loans
C) Refinancings
D) Home Improvement Loans
F) Non-occupant Loans on < 5 Family Dwellings (A B C & D)
G) Loans On Manufactured Home Dwelling (A B C & D)
Number
Average Value
Number
Average Value
Number
Average Value
Number
Average Value
Number
Average Value
Number
Average Value
LOANS ORIGINATED
2
$134,495
24
$100,849
35
$111,520
11
$52,728
2
$67,530
7
$129,373
APPLICATIONS APPROVED, NOT ACCEPTED
0
$0
4
$120,908
7
$96,469
2
$87,705
1
$117,120
2
$66,405
APPLICATIONS DENIED
1
$81,820
9
$100,934
31
$121,245
5
$55,032
3
$83,873
5
$116,676
APPLICATIONS WITHDRAWN
0
$0
3
$155,417
15
$135,355
2
$89,665
1
$150,190
0
$0
FILES CLOSED FOR INCOMPLETENESS
0
$0
0
$0
3
$209,217
0
$0
0
$0
0
$0
Aggregated Statistics For Year 2005 (Based on 2 partial tracts)
A) FHA, FSA/RHS & VA Home Purchase Loans
B) Conventional Home Purchase Loans
C) Refinancings
D) Home Improvement Loans
E) Loans on Dwellings For 5+ Families
F) Non-occupant Loans on < 5 Family Dwellings (A B C & D)
G) Loans On Manufactured Home Dwelling (A B C & D)
Number
Average Value
Number
Average Value
Number
Average Value
Number
Average Value
Number
Average Value
Number
Average Value
Number
Average Value
LOANS ORIGINATED
6
$75,935
43
$90,707
33
$112,691
6
$48,195
1
$224,160
3
$82,007
13
$85,698
APPLICATIONS APPROVED, NOT ACCEPTED
1
$106,480
3
$136,177
7
$119,044
0
$0
0
$0
1
$146,260
4
$103,395
APPLICATIONS DENIED
1
$182,690
7
$101,193
21
$111,600
6
$47,915
0
$0
1
$44,830
6
$107,317
APPLICATIONS WITHDRAWN
0
$0
8
$110,609
8
$104,445
3
$135,057
0
$0
1
$85,740
1
$47,630
FILES CLOSED FOR INCOMPLETENESS
0
$0
3
$52,117
6
$77,802
0
$0
0
$0
0
$0
1
$80,700
Aggregated Statistics For Year 2004 (Based on 2 partial tracts)
A) FHA, FSA/RHS & VA Home Purchase Loans
B) Conventional Home Purchase Loans
C) Refinancings
D) Home Improvement Loans
F) Non-occupant Loans on < 5 Family Dwellings (A B C & D)
G) Loans On Manufactured Home Dwelling (A B C & D)
Number
Average Value
Number
Average Value
Number
Average Value
Number
Average Value
Number
Average Value
Number
Average Value
LOANS ORIGINATED
3
$141,593
28
$85,541
34
$95,812
4
$46,092
4
$81,118
8
$89,874
APPLICATIONS APPROVED, NOT ACCEPTED
0
$0
6
$154,483
4
$86,162
2
$64,725
1
$509,960
2
$65,845
APPLICATIONS DENIED
1
$131,130
11
$74,839
22
$110,679
2
$35,865
2
$61,645
8
$105,425
APPLICATIONS WITHDRAWN
2
$63,045
3
$80,697
17
$103,905
1
$100,870
2
$160,275
2
$78,735
FILES CLOSED FOR INCOMPLETENESS
0
$0
1
$68,930
6
$86,022
0
$0
0
$0
1
$34,740
Aggregated Statistics For Year 2003 (Based on 2 partial tracts)
A) FHA, FSA/RHS & VA Home Purchase Loans
B) Conventional Home Purchase Loans
C) Refinancings
D) Home Improvement Loans
E) Loans on Dwellings For 5+ Families
F) Non-occupant Loans on < 5 Family Dwellings (A B C & D)
Number
Average Value
Number
Average Value
Number
Average Value
Number
Average Value
Number
Average Value
Number
Average Value
LOANS ORIGINATED
4
$106,195
25
$98,204
83
$108,529
6
$22,790
1
$168,120
6
$163,637
APPLICATIONS APPROVED, NOT ACCEPTED
0
$0
2
$55,200
8
$91,835
1
$8,410
0
$0
1
$35,310
APPLICATIONS DENIED
0
$0
7
$85,421
29
$92,138
2
$7,845
0
$0
3
$107,037
APPLICATIONS WITHDRAWN
1
$44,270
3
$106,663
14
$94,908
1
$6,720
0
$0
2
$79,295
FILES CLOSED FOR INCOMPLETENESS
0
$0
0
$0
1
$61,080
0
$0
0
$0
0
$0
Aggregated Statistics For Year 2002 (Based on 2 partial tracts)
A) FHA, FSA/RHS & VA Home Purchase Loans
B) Conventional Home Purchase Loans
C) Refinancings
D) Home Improvement Loans
F) Non-occupant Loans on < 5 Family Dwellings (A B C & D)
Number
Average Value
Number
Average Value
Number
Average Value
Number
Average Value
Number
Average Value
LOANS ORIGINATED
4
$74,812
15
$85,031
57
$98,493
4
$38,948
4
$44,832
APPLICATIONS APPROVED, NOT ACCEPTED
1
$56,600
3
$108,530
7
$116,963
0
$0
0
$0
APPLICATIONS DENIED
1
$48,750
3
$101,247
20
$79,521
4
$12,330
1
$1,680
APPLICATIONS WITHDRAWN
1
$49,320
2
$65,845
10
$100,648
0
$0
0
$0
FILES CLOSED FOR INCOMPLETENESS
0
$0
0
$0
2
$110,680
0
$0
0
$0
Aggregated Statistics For Year 2001 (Based on 2 partial tracts)
A) FHA, FSA/RHS & VA Home Purchase Loans
B) Conventional Home Purchase Loans
C) Refinancings
D) Home Improvement Loans
F) Non-occupant Loans on < 5 Family Dwellings (A B C & D)
Number
Average Value
Number
Average Value
Number
Average Value
Number
Average Value
Number
Average Value
LOANS ORIGINATED
3
$97,697
15
$85,928
47
$97,963
7
$32,903
2
$147,945
APPLICATIONS APPROVED, NOT ACCEPTED
0
$0
1
$89,100
8
$80,698
1
$19,610
0
$0
APPLICATIONS DENIED
1
$55,480
4
$68,930
27
$86,779
1
$32,500
1
$14,010
APPLICATIONS WITHDRAWN
0
$0
1
$75,090
13
$99,363
1
$8,410
0
$0
FILES CLOSED FOR INCOMPLETENESS
0
$0
1
$56,040
3
$115,630
0
$0
0
$0
Aggregated Statistics For Year 2000 (Based on 2 partial tracts)
A) FHA, FSA/RHS & VA Home Purchase Loans
B) Conventional Home Purchase Loans
C) Refinancings
D) Home Improvement Loans
F) Non-occupant Loans on < 5 Family Dwellings (A B C & D)
Number
Average Value
Number
Average Value
Number
Average Value
Number
Average Value
Number
Average Value
LOANS ORIGINATED
4
$76,775
16
$87,808
15
$73,151
6
$28,113
2
$29,700
APPLICATIONS APPROVED, NOT ACCEPTED
0
$0
4
$76,355
7
$61,164
3
$17,933
0
$0
APPLICATIONS DENIED
2
$43,710
7
$81,979
20
$66,744
6
$22,230
1
$20,730
APPLICATIONS WITHDRAWN
1
$90,780
1
$112,640
7
$68,849
2
$41,190
0
$0
FILES CLOSED FOR INCOMPLETENESS
0
$0
0
$0
2
$49,595
0
$0
0
$0
Aggregated Statistics For Year 1999 (Based on 1 partial tract)
A) FHA, FSA/RHS & VA Home Purchase Loans
B) Conventional Home Purchase Loans
C) Refinancings
D) Home Improvement Loans
F) Non-occupant Loans on < 5 Family Dwellings (A B C & D)
Detailed PMIC statistics for the following Tracts:0143.00
2003 - 2018 National Fire Incident Reporting System (NFIRS) incidents
According to the data from the years 2003 - 2018 the average number of fires per year is 10. The highest number of fires - 26 took place in 2003, and the least - 0 in 2012. The data has a decreasing trend.
When looking into fire subcategories, the most reports belonged to: Structure Fires (49.7%), and Outside Fires (45.4%).
Fire incident types reported to NFIRS in Zip Code 99012

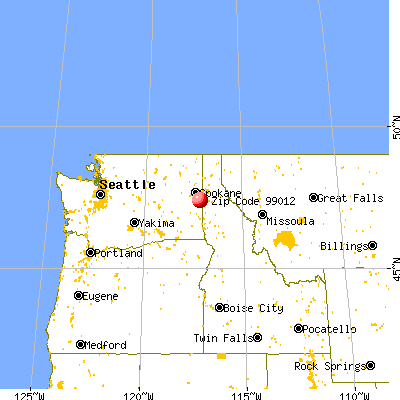


 Nearest zip codes: 99039, 99018, 99030, 99036, 99031, 99033.
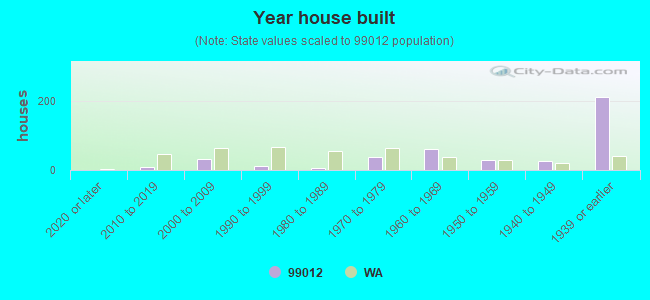


 According to the data from the years 2003 - 2018 the average number of fires per year is 10. The highest number of fires - 26 took place in 2003, and the least - 0 in 2012. The data has a decreasing trend.
 When looking into fire subcategories, the most reports belonged to: Structure Fires (49.7%), and Outside Fires (45.4%).