Estimated zip code population in 2022: 4,272 Zip code population in 2010: 3,684 Zip code population in 2000: 3,629
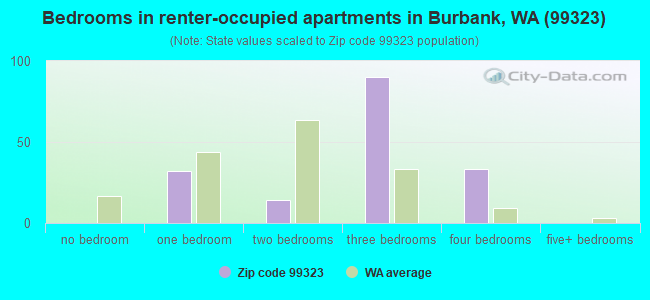
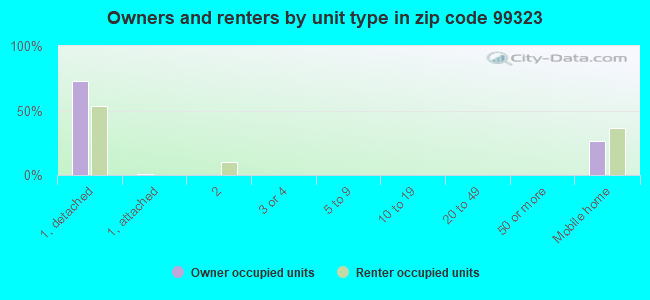
Houses and condos: 1,455 Renter-occupied apartments: 177
% of renters here:
13%
State:
36%
March 2022 cost of living index in zip code 99323: 87.6 (less than average, U.S. average is 100)
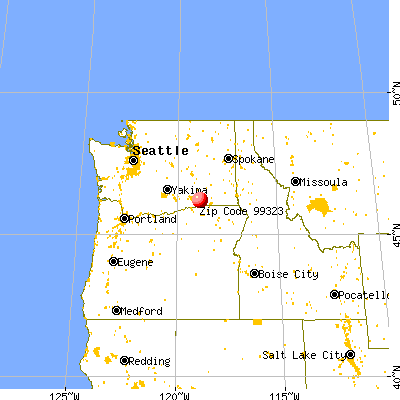
Land area: 125.9 sq. mi. Water area: 7.8 sq. mi.
Population density: 34 people per square mile
(very low).
OSM Map
General Map
Google Map
MSN Map
OSM Map
General Map
Google Map
MSN Map
OSM Map
General Map
Google Map
MSN Map
OSM Map
General Map
Google Map
MSN Map
Please wait while loading the map...
Real estate property taxes paid for housing units in 2022:
This zip code:
0.9% ($3,057)
Washington:
0.8% ($4,283)
Median real estate property taxes paid for housing units with mortgages in 2022: $3,307 (0.8%) Median real estate property taxes paid for housing units with no mortgage in 2022: $2,710 (1.0%)
Estimated median house/condo value in 2022: $358,975
99323:
$358,975
Washington:
$569,500
According to our research of Washington and other state lists, there was 1 registered sex offender living in 99323 zip code as of May 23, 2024. The ratio of all residents to sex offenders in zip code 99323 is 3,645 to 1. The ratio of registered sex offenders to all residents in this zip code is much lower than the state average.
Median resident age:
This zip code:
33.2 years
Washington median age:
38.4 years
Average household size:
This zip code:
3.2 people
Washington:
2.5 people
Averages for the 2020 tax year for zip code 99323, filed in 2021:
Average Adjusted Gross Income (AGI) in 2020: $71,318 (Individual Income Tax Returns)
Here:
$71,318
State:
$99,264
Salary/wage: $60,971 (reported on 80.8% of returns)
Here:
$60,971
State:
$80,347
(% of AGI for various income ranges: 1123.3% for AGIs below $25k, 3375.5% for AGIs $25k-50k, 6604.7% for AGIs $50k-75k, 9035.3% for AGIs $75k-100k, 15510.4% for AGIs $100k-200k)
Taxable interest for individuals: $1,335 (reported on 32.0% of returns)
This zip code:
$1,335
Washington:
$2,077
(% of AGI for various income ranges: 18.9% for AGIs below $25k, 25.9% for AGIs $25k-50k, 38.8% for AGIs $50k-75k, 19.4% for AGIs $75k-100k, 135.2% for AGIs $100k-200k)
Ordinary dividends: $5,548 (reported on 13.4% of returns)
Here:
$5,548
State:
$10,013
(% of AGI for various income ranges: 25.0% for AGIs below $25k, 17.6% for AGIs $25k-50k, 27.6% for AGIs $50k-75k, 64.7% for AGIs $75k-100k, 169.6% for AGIs $100k-200k)
Net capital gain/loss in AGI: +$16,017 (reported on 14.0% of returns)
Here:
+$16,017
State:
+$40,092
(% of AGI for various income ranges: 4.4% for AGIs below $25k, 38.3% for AGIs $25k-50k, 45.3% for AGIs $50k-75k, 78.8% for AGIs $75k-100k, 627.4% for AGIs $100k-200k)
Profit/loss from business: +$6,274 (reported on 11.0% of returns)
Here:
+$6,274
State:
+$18,312
(% of AGI for various income ranges: 72.5% for AGIs below $25k, 102.4% for AGIs $25k-50k, 145.3% for AGIs $50k-75k, 82.9% for AGIs $75k-100k, 107.0% for AGIs $100k-200k)
Taxable individual retirement arrangement distribution: $18,464 (reported on 8.1% of returns)
99323:
$18,464
Washington:
$24,221
(% of AGI for various income ranges: 100.8% for AGIs below $25k, 230.6% for AGIs $50k-75k, 231.8% for AGIs $75k-100k, 624.3% for AGIs $100k-200k)
Total itemized deductions: $32,890 (reported on 5.8% of returns)
Here:
$32,890
State:
$39,068
(% of AGI for various income ranges: 750.6% for AGIs $50k-75k, 875.2% for AGIs $100k-200k)
Charity contributions: $15,333 (reported on 3.5% of returns)
Here:
$15,333
State:
$15,331
(% of AGI for various income ranges: 35.2% for AGIs $25k-50k, 355.7% for AGIs $100k-200k)
Taxes paid: $6,400 (reported on 5.2% of returns)
99323:
$6,400
State:
$7,774
(% of AGI for various income ranges: 121.2% for AGIs $50k-75k, 160.9% for AGIs $100k-200k)
Earned income credit: $2,305 (reported on 11.0% of returns)
Here:
$2,305
State:
$2,020
(% of AGI for various income ranges: 71.7% for AGIs below $25k, 62.1% for AGIs $25k-50k)
Percentage of individuals using paid preparers for their 2020 taxes: 93.6%
Here:
94%
State:
93%
(% for various income ranges: 93.6% for AGIs below $25k, 91.9% for AGIs $25k-50k, 96.0% for AGIs $50k-75k, 91.3% for AGIs $75k-100k, 94.3% for AGIs $100k-200k, 100.0% for AGIs over 200k)
Averages for the 2012 tax year for zip code 99323, filed in 2013:
Average Adjusted Gross Income (AGI) in 2012: $55,632 (Individual Income Tax Returns)
Here:
$55,632
State:
$69,533
Salary/wage: $49,293 (reported on 86.6% of returns)
Here:
$49,293
State:
$57,267
(% of AGI for various income ranges: 78.1% for AGIs below $25k, 79.8% for AGIs $25k-50k, 76.4% for AGIs $50k-75k, 80.6% for AGIs $75k-100k, 90.2% for AGIs $100k-200k)
Taxable interest for individuals: $985 (reported on 31.7% of returns)
This zip code:
$985
Washington:
$1,816
(% of AGI for various income ranges: 1.4% for AGIs below $25k, 0.5% for AGIs $25k-50k, 0.5% for AGIs $50k-75k, 0.4% for AGIs $75k-100k, 0.7% for AGIs $100k-200k)
Ordinary dividends: $2,668 (reported on 13.4% of returns)
Here:
$2,668
State:
$8,163
(% of AGI for various income ranges: 0.5% for AGIs below $25k, 1.0% for AGIs $25k-50k, 0.3% for AGIs $50k-75k, 0.5% for AGIs $75k-100k, 0.9% for AGIs $100k-200k)
Net capital gain/loss in AGI: +$4,974 (reported on 11.6% of returns)
Here:
+$4,974
State:
+$21,568
(% of AGI for various income ranges: 0.6% for AGIs $25k-50k, 0.9% for AGIs $50k-75k, 2.5% for AGIs $100k-200k)
Profit/loss from business: +$6,343 (reported on 12.8% of returns)
Here:
+$6,343
State:
+$16,521
(% of AGI for various income ranges: 5.6% for AGIs below $25k, 1.8% for AGIs $25k-50k, 2.5% for AGIs $50k-75k, 0.6% for AGIs $75k-100k, 0.6% for AGIs $100k-200k)
Taxable individual retirement arrangement distribution: $11,629 (reported on 8.5% of returns)
99323:
$11,629
Washington:
$18,648
(% of AGI for various income ranges: 2.7% for AGIs below $25k, 1.6% for AGIs $25k-50k, 1.6% for AGIs $50k-75k, 2.1% for AGIs $75k-100k, 2.0% for AGIs $100k-200k)
Total itemized deductions: $18,984 (22% of AGI, reported on 29.9% of returns)
Here:
$18,984
State:
$23,872
Here:
21.8% of AGI
State:
18.2% of AGI
(% of AGI for various income ranges: 7.5% for AGIs below $25k, 9.3% for AGIs $25k-50k, 11.0% for AGIs $50k-75k, 11.3% for AGIs $75k-100k, 12.4% for AGIs $100k-200k)
Charity contributions: $3,894 (reported on 21.3% of returns)
Here:
$3,894
State:
$4,465
(% of AGI for various income ranges: 1.0% for AGIs $25k-50k, 1.3% for AGIs $50k-75k, 1.8% for AGIs $75k-100k, 2.3% for AGIs $100k-200k)
Taxes paid: $5,029 (reported on 29.3% of returns)
99323:
$5,029
State:
$6,400
(% of AGI for various income ranges: 1.6% for AGIs below $25k, 1.7% for AGIs $25k-50k, 2.7% for AGIs $50k-75k, 2.8% for AGIs $75k-100k, 3.7% for AGIs $100k-200k)
Earned income credit: $1,980 (reported on 15.2% of returns)
Here:
$1,980
State:
$2,073
(% of AGI for various income ranges: 4.8% for AGIs below $25k, 1.3% for AGIs $25k-50k)
Percentage of individuals using paid preparers for their 2012 taxes: 49.4%
Here:
49%
State:
43%
(% for various income ranges: 42.9% for AGIs below $25k, 48.6% for AGIs $25k-50k, 55.6% for AGIs $50k-75k, 52.4% for AGIs $75k-100k, 60.9% for AGIs $100k-200k)
Averages for the 2004 tax year for zip code 99323, filed in 2005:
Average Adjusted Gross Income (AGI) in 2004: $44,260 (Individual Income Tax Returns)
Here:
$44,260
State:
$54,331
Salary/wage: $42,557 (reported on 88.8% of returns)
Here:
$42,557
State:
$45,761
(% of AGI for various income ranges: 517.0% for AGIs below $10k, 78.6% for AGIs $10k-25k, 84.9% for AGIs $25k-50k, 87.5% for AGIs $50k-75k, 87.9% for AGIs $75k-100k, 78.2% for AGIs over 100k)
Taxable interest for individuals: $1,062 (reported on 48.5% of returns)
This zip code:
$1,062
Washington:
$2,110
(% of AGI for various income ranges: 23.9% for AGIs below $10k, 2.3% for AGIs $10k-25k, 1.3% for AGIs $25k-50k, 0.5% for AGIs $50k-75k, 0.9% for AGIs $75k-100k, 1.4% for AGIs over 100k)
Taxable dividends: $1,533 (reported on 14.8% of returns)
Here:
$1,533
State:
$5,879
(% of AGI for various income ranges: 5.3% for AGIs below $10k, 1.2% for AGIs $10k-25k, 0.4% for AGIs $25k-50k, 0.3% for AGIs $50k-75k, 0.2% for AGIs $75k-100k, 0.8% for AGIs over 100k)
Net capital gain/loss: +$3,576 (reported on 13.0% of returns)
Here:
+$3,576
State:
+$15,835
(% of AGI for various income ranges: -0.5% for AGIs below $10k, -0.4% for AGIs $10k-25k, 0.4% for AGIs $25k-50k, 0.4% for AGIs $50k-75k, 0.7% for AGIs $75k-100k, 3.2% for AGIs over 100k)
Profit/loss from business: +$756 (reported on 11.8% of returns)
Here:
+$756
State:
+$13,994
(% of AGI for various income ranges: 16.5% for AGIs below $10k, 2.8% for AGIs $10k-25k, 0.3% for AGIs $25k-50k, -0.6% for AGIs $50k-75k, -0.9% for AGIs $75k-100k, 1.0% for AGIs over 100k)
IRA payment deduction: $2,649 (reported on 2.4% of returns)
99323:
$2,649
Washington:
$3,001
Total itemized deductions: $15,538 (22% of AGI, reported on 31.8% of returns)
Here:
$15,538
State:
$19,669
Here:
21.9% of AGI
State:
20.7% of AGI
(% of AGI for various income ranges: 9.1% for AGIs $10k-25k, 9.2% for AGIs $25k-50k, 13.1% for AGIs $50k-75k, 11.7% for AGIs $75k-100k, 10.8% for AGIs over 100k)
Charity contributions deductions: $2,657 (4% of AGI, reported on 26.4% of returns)
Here:
$2,657
State:
$3,569
Here:
3.6% of AGI
State:
3.5% of AGI
(% of AGI for various income ranges: 1.0% for AGIs $10k-25k, 0.9% for AGIs $25k-50k, 1.8% for AGIs $50k-75k, 1.9% for AGIs $75k-100k, 1.9% for AGIs over 100k)
Total tax: $5,536 (reported on 75.1% of returns)
99323:
$5,536
State:
$9,065
(% of AGI for various income ranges: 9.0% for AGIs below $10k, 3.5% for AGIs $10k-25k, 6.4% for AGIs $25k-50k, 7.7% for AGIs $50k-75k, 9.8% for AGIs $75k-100k, 15.6% for AGIs over 100k)
Earned income credit: $1,836 (reported on 13.6% of returns)
Here:
$1,836
State:
$1,607
Percentage of individuals using paid preparers for their 2004 taxes: 52.5%
Here:
53%
State:
49%
(% for various income ranges: 44.4% for AGIs below $10k, 55.3% for AGIs $10k-25k, 52.4% for AGIs $25k-50k, 56.2% for AGIs $50k-75k, 52.6% for AGIs $75k-100k, 51.7% for AGIs over 100k)
Likely homosexual households (counted as self-reported same-sex unmarried-partner households)
Lesbian couples: 0.0% of all households
Gay men: 0.8% of all households
Household received Food Stamps/SNAP in the past 12 months: 123 Household did not receive Food Stamps/SNAP in the past 12 months: 1,227
Women who had a birth in the past 12 months: 91 (25 now married, 60 unmarried) Women who did not have a birth in the past 12 months: 927 (470 now married, 455 unmarried)
Housing units in zip code 99323 with a mortgage: 719 (17 second mortgage, 18 both second mortgage and home equity loan) Houses without a mortgage: 11
Median monthly owner costs for units with a mortgage: $1,637 Median monthly owner costs for units without a mortgage: $577
Residents with income below the poverty level in 2022:
This zip code:
7.1%
Whole state:
10.0%
Residents with income below 50% of the poverty level in 2022:
This zip code:
4.7%
Whole state:
4.6%
Median number of rooms in houses and condos:
Here:
6.1
State:
6.5
Median number of rooms in apartments:
Here:
5.5
State:
3.9
Notable locations in this zip code not listed on our city pages
Notable locations in zip code 99323: Burbank Substation (A), Walla Walla County Fire District 5 Station 53 (B), Walla Walla County Fire District 5 Station 54 (C), Walla Walla County Fire District 5 Station 51 (D). Display/hide their locations on the map
Parks in zip code 99323 include: Hood Park (1), Charbonneau Park (2), Charbonneau Recreation Area (3), McNary National Wildlife Refuge (4). Display/hide their locations on the map
Size of family households: 421 2-persons, 205 3-persons, 195 4-persons, 111 5-persons, 26 6-persons, 47 7-or-more-persons
Size of nonfamily households: 239 1-person, 97 2-persons
842 married couples with children.
237 single-parent households (11 men, 226 women).
81.4% of residents of 99323 zip code speak English at home.
18.7% of residents speak Spanish at home (32% very well, 48% well, 7% not well, 13% not at all).
0.2% of residents speak other Indo-European language at home (100% very well).
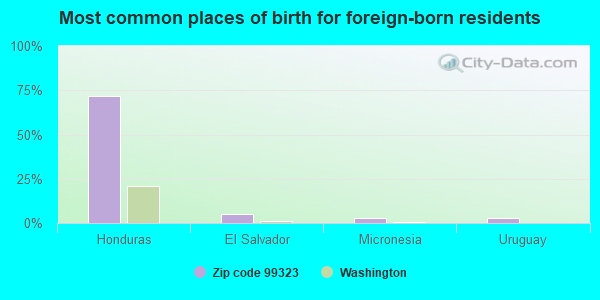
Foreign born population: 227 (5.3%) (36.0% of them are naturalized citizens)
This zip code:
5.3%
Whole state:
15.3%
71%Honduras
5%El Salvador
3%Micronesia
3%Uruguay
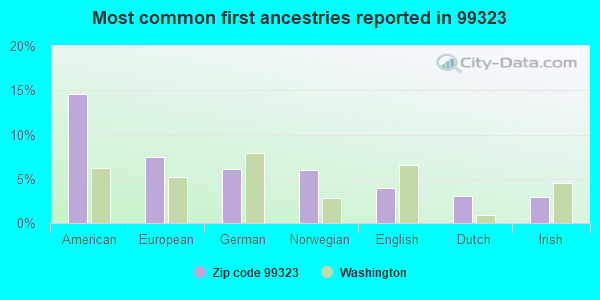
15%American
7%European
6%German
6%Norwegian
4%English
3%Dutch
3%Irish
Year of entry for the foreign-born population
412010 or later
1092000 to 2009
271990 to 1999
140Before 1990
Facilities with environmental interests located in this zip code:
COLUMBIA SCHOOL DISTRICT 400 (755 MAPLE STREET in BURBANK, WA)
AIR MONITORING SITE (Airborne pollution emission tracking) COMPLIANCE ACTIVITY (Tracking inspections of insecticide, fungicide, and rodenticide, and toxic substances) STATE MASTER (Washington State Department of Ecology's Facility/Site identification system) - TOXICS-10971, UNDERGROUND STORAGE TANK PROGRAM Alternative names: COLUMBIA BURBANK, COLUMBIA SD 400
COLUMBIA HIGH SCHOOL (787 MAPLE ST in BURBANK, WA)
(Geographic Names Information System) (National Center for Education Statistics) - STATE ID-4049 Organizations: COLUMBIA SCH DIST 400 (SCHOOL DISTRICT)
COLUMBIA MIDDLE SCHOOL (835 MAPLE ST in BURBANK, WA)
(Geographic Names Information System) (National Center for Education Statistics) - STATE ID-3012 Organizations: COLUMBIA SCH DIST 400 (SCHOOL DISTRICT)
COLUMBIA ELEMENTARY (977 MAPLE ST in BURBANK, WA)
(National Center for Education Statistics) - STATE ID-3613 Organizations: COLUMBIA SCH DIST 400 (SCHOOL DISTRICT)
COLUMBIA SPECIAL ED SCHOOL (835 MAPLE ST in BURBANK, WA)
(National Center for Education Statistics) - STATE ID-1908 Organizations: COLUMBIA SCH DIST 400 (SCHOOL DISTRICT)
Housing units lacking complete plumbing facilities: 1.7% Housing units lacking complete kitchen facilities: 6.1%
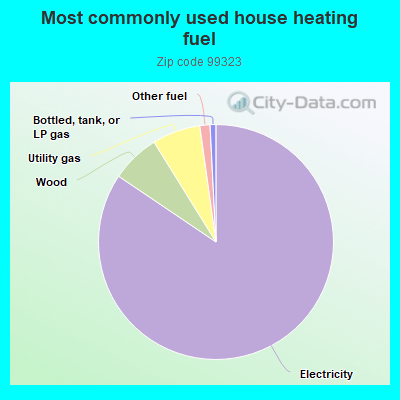
84.2%Electricity
6.7%Wood
6.6%Utility gas
1.4%Other fuel
0.8%Bottled, tank, or LP gas
Place of birth for U.S.-born residents:
This state: 2,503
Northeast: 70
Midwest: 174
South: 120
West: 1,058
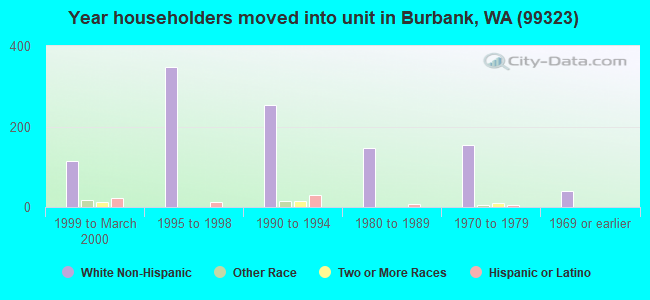
62% of the 99323 zip code residents lived in the same house 5 years ago. Out of people who lived in different houses, 23% lived in this county. Out of people who lived in different counties, 50% lived in Washington.
95% of the 99323 zip code residents lived in the same house 1 year ago. Out of people who lived in different houses, 12% moved from this county. Out of people who lived in different houses, 101% moved from different county within same state.
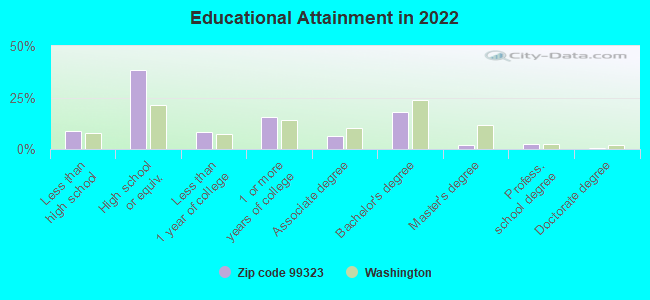
Private vs. public school enrollment:
Students in private schools in grades 1 to 8 (elementary and middle school): 51
Here:
9.7%
Washington:
12.4%
Students in private schools in grades 9 to 12 (high school): 29
Here:
8.9%
Washington:
9.2%
Students in private undergraduate colleges: 8
Here:
5.7%
Washington:
16.5%
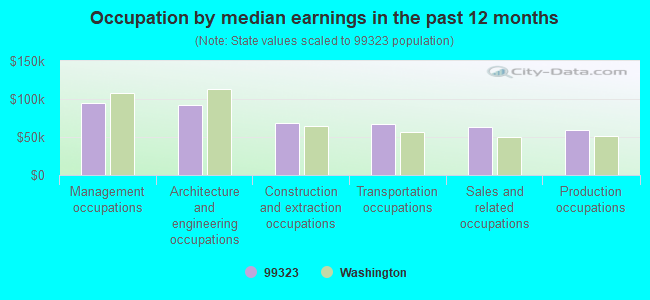
Occupation by median earnings in the past 12 months ($)
94,324Management occupations
92,376Architecture and engineering occupations
67,790Construction and extraction occupations
66,640Transportation occupations
62,868Sales and related occupations
58,626Production occupations
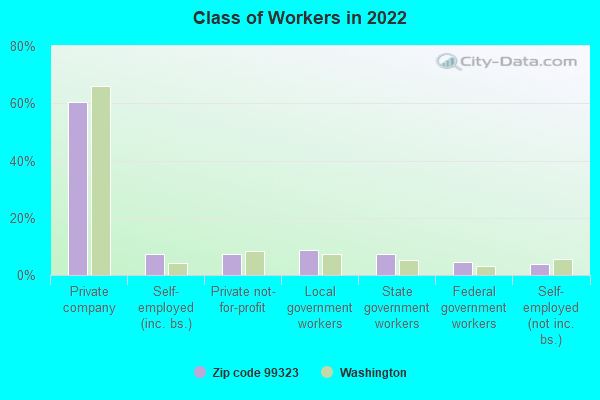
Top industries in this zip code by the number of employees in 2005:
Wholesale Trade: Fresh Fruit and Vegetable Merchant Wholesalers (5-9: 1)
Construction: Flooring Contractors (5-9: 1)
Construction: Drywall and Insulation Contractors (5-9: 1)
Fatal accident statistics in 2014:
Fatal accident count: 1
Vehicles involved in fatal accidents: 1
Fatal accidents caused by drunken drivers: 0
Fatalities: 1
Persons involved in fatal accidents: 2
Pedestrians involved in fatal accidents: 0
Fatal accident statistics in 2013:
Fatal accident count: 1
Vehicles involved in fatal accidents: 1
Fatal accidents caused by drunken drivers: 1
Fatalities: 1
Persons involved in fatal accidents: 1
Pedestrians involved in fatal accidents: 0
2002 - 2018 National Fire Incident Reporting System (NFIRS) incidents
According to the data from the years 2002 - 2018 the average number of fires per year is 41. The highest number of fire incidents - 72 took place in 2018, and the least - 3 in 2005. The data has a growing trend.
When looking into fire subcategories, the most incidents belonged to: Outside Fires (64.2%), and Structure Fires (15.2%).
Fire incident types reported to NFIRS in Zip Code 99323


 Nearest zip codes: 99363, 99301, 99360, 99337, 97835, 99336.


 According to the data from the years 2002 - 2018 the average number of fires per year is 41. The highest number of fire incidents - 72 took place in 2018, and the least - 3 in 2005. The data has a growing trend.
 When looking into fire subcategories, the most incidents belonged to: Outside Fires (64.2%), and Structure Fires (15.2%).