Abington, Massachusetts Submit your own pictures of this place and show them to the world
OSM Map
General Map
Google Map
MSN Map
OSM Map
General Map
Google Map
MSN Map
OSM Map
General Map
Google Map
MSN Map
OSM Map
General Map
Google Map
MSN Map
Please wait while loading the map...
Population in 2010: 15,985. Population change since 2000: +9.4%Males: 8,135 Females: 7,850
March 2022 cost of living index in Abington: 133.2 (high, U.S. average is 100) Percentage of residents living in poverty in 2022: 5.5%for White Non-Hispanic residents , 15.2% for Black residents , 6.9% for Hispanic or Latino residents , 26.3% for two or more races residents )Business Search - 14 Million verified businesses
Data:
Median household income ($)
Median household income (% change since 2000)
Household income diversity
Ratio of average income to average house value (%)
Ratio of average income to average rent
Median household income ($) - White
Median household income ($) - Black or African American
Median household income ($) - Asian
Median household income ($) - Hispanic or Latino
Median household income ($) - American Indian and Alaska Native
Median household income ($) - Multirace
Median household income ($) - Other Race
Median household income for houses/condos with a mortgage ($)
Median household income for apartments without a mortgage ($)
Races - White alone (%)
Races - White alone (% change since 2000)
Races - Black alone (%)
Races - Black alone (% change since 2000)
Races - American Indian alone (%)
Races - American Indian alone (% change since 2000)
Races - Asian alone (%)
Races - Asian alone (% change since 2000)
Races - Hispanic (%)
Races - Hispanic (% change since 2000)
Races - Native Hawaiian and Other Pacific Islander alone (%)
Races - Native Hawaiian and Other Pacific Islander alone (% change since 2000)
Races - Two or more races (%)
Races - Two or more races (% change since 2000)
Races - Other race alone (%)
Races - Other race alone (% change since 2000)
Racial diversity
Unemployment (%)
Unemployment (% change since 2000)
Unemployment (%) - White
Unemployment (%) - Black or African American
Unemployment (%) - Asian
Unemployment (%) - Hispanic or Latino
Unemployment (%) - American Indian and Alaska Native
Unemployment (%) - Multirace
Unemployment (%) - Other Race
Population density (people per square mile)
Population - Males (%)
Population - Females (%)
Population - Males (%) - White
Population - Males (%) - Black or African American
Population - Males (%) - Asian
Population - Males (%) - Hispanic or Latino
Population - Males (%) - American Indian and Alaska Native
Population - Males (%) - Multirace
Population - Males (%) - Other Race
Population - Females (%) - White
Population - Females (%) - Black or African American
Population - Females (%) - Asian
Population - Females (%) - Hispanic or Latino
Population - Females (%) - American Indian and Alaska Native
Population - Females (%) - Multirace
Population - Females (%) - Other Race
Coronavirus confirmed cases (Jun 15, 2024)
Deaths caused by coronavirus (Jun 15, 2024)
Coronavirus confirmed cases (per 100k population) (Jun 15, 2024)
Deaths caused by coronavirus (per 100k population) (Jun 15, 2024)
Daily increase in number of cases (Jun 15, 2024)
Weekly increase in number of cases (Jun 15, 2024)
Cases doubled (in days) (Jun 15, 2024)
Hospitalized patients (Apr 18, 2022)
Negative test results (Apr 18, 2022)
Total test results (Apr 18, 2022)
COVID Vaccine doses distributed (per 100k population) (Sep 19, 2023)
COVID Vaccine doses administered (per 100k population) (Sep 19, 2023)
COVID Vaccine doses distributed (Sep 19, 2023)
COVID Vaccine doses administered (Sep 19, 2023)
Likely homosexual households (%)
Likely homosexual households (% change since 2000)
Likely homosexual households - Lesbian couples (%)
Likely homosexual households - Lesbian couples (% change since 2000)
Likely homosexual households - Gay men (%)
Likely homosexual households - Gay men (% change since 2000)
Cost of living index
Median gross rent ($)
Median contract rent ($)
Median monthly housing costs ($)
Median house or condo value ($)
Median house or condo value ($ change since 2000)
Mean house or condo value by units in structure - 1, detached ($)
Mean house or condo value by units in structure - 1, attached ($)
Mean house or condo value by units in structure - 2 ($)
Mean house or condo value by units in structure by units in structure - 3 or 4 ($)
Mean house or condo value by units in structure - 5 or more ($)
Mean house or condo value by units in structure - Boat, RV, van, etc. ($)
Mean house or condo value by units in structure - Mobile home ($)
Median house or condo value ($) - White
Median house or condo value ($) - Black or African American
Median house or condo value ($) - Asian
Median house or condo value ($) - Hispanic or Latino
Median house or condo value ($) - American Indian and Alaska Native
Median house or condo value ($) - Multirace
Median house or condo value ($) - Other Race
Median resident age
Resident age diversity
Median resident age - Males
Median resident age - Females
Median resident age - White
Median resident age - Black or African American
Median resident age - Asian
Median resident age - Hispanic or Latino
Median resident age - American Indian and Alaska Native
Median resident age - Multirace
Median resident age - Other Race
Median resident age - Males - White
Median resident age - Males - Black or African American
Median resident age - Males - Asian
Median resident age - Males - Hispanic or Latino
Median resident age - Males - American Indian and Alaska Native
Median resident age - Males - Multirace
Median resident age - Males - Other Race
Median resident age - Females - White
Median resident age - Females - Black or African American
Median resident age - Females - Asian
Median resident age - Females - Hispanic or Latino
Median resident age - Females - American Indian and Alaska Native
Median resident age - Females - Multirace
Median resident age - Females - Other Race
Commute - mean travel time to work (minutes)
Travel time to work - Less than 5 minutes (%)
Travel time to work - Less than 5 minutes (% change since 2000)
Travel time to work - 5 to 9 minutes (%)
Travel time to work - 5 to 9 minutes (% change since 2000)
Travel time to work - 10 to 19 minutes (%)
Travel time to work - 10 to 19 minutes (% change since 2000)
Travel time to work - 20 to 29 minutes (%)
Travel time to work - 20 to 29 minutes (% change since 2000)
Travel time to work - 30 to 39 minutes (%)
Travel time to work - 30 to 39 minutes (% change since 2000)
Travel time to work - 40 to 59 minutes (%)
Travel time to work - 40 to 59 minutes (% change since 2000)
Travel time to work - 60 to 89 minutes (%)
Travel time to work - 60 to 89 minutes (% change since 2000)
Travel time to work - 90 or more minutes (%)
Travel time to work - 90 or more minutes (% change since 2000)
Marital status - Never married (%)
Marital status - Now married (%)
Marital status - Separated (%)
Marital status - Widowed (%)
Marital status - Divorced (%)
Median family income ($)
Median family income (% change since 2000)
Median non-family income ($)
Median non-family income (% change since 2000)
Median per capita income ($)
Median per capita income (% change since 2000)
Median family income ($) - White
Median family income ($) - Black or African American
Median family income ($) - Asian
Median family income ($) - Hispanic or Latino
Median family income ($) - American Indian and Alaska Native
Median family income ($) - Multirace
Median family income ($) - Other Race
Median year house/condo built
Median year apartment built
Year house built - Built 2005 or later (%)
Year house built - Built 2000 to 2004 (%)
Year house built - Built 1990 to 1999 (%)
Year house built - Built 1980 to 1989 (%)
Year house built - Built 1970 to 1979 (%)
Year house built - Built 1960 to 1969 (%)
Year house built - Built 1950 to 1959 (%)
Year house built - Built 1940 to 1949 (%)
Year house built - Built 1939 or earlier (%)
Average household size
Household density (households per square mile)
Average household size - White
Average household size - Black or African American
Average household size - Asian
Average household size - Hispanic or Latino
Average household size - American Indian and Alaska Native
Average household size - Multirace
Average household size - Other Race
Occupied housing units (%)
Vacant housing units (%)
Owner occupied housing units (%)
Renter occupied housing units (%)
Vacancy status - For rent (%)
Vacancy status - For sale only (%)
Vacancy status - Rented or sold, not occupied (%)
Vacancy status - For seasonal, recreational, or occasional use (%)
Vacancy status - For migrant workers (%)
Vacancy status - Other vacant (%)
Residents with income below the poverty level (%)
Residents with income below 50% of the poverty level (%)
Children below poverty level (%)
Poor families by family type - Married-couple family (%)
Poor families by family type - Male, no wife present (%)
Poor families by family type - Female, no husband present (%)
Poverty status for native-born residents (%)
Poverty status for foreign-born residents (%)
Poverty among high school graduates not in families (%)
Poverty among people who did not graduate high school not in families (%)
Residents with income below the poverty level (%) - White
Residents with income below the poverty level (%) - Black or African American
Residents with income below the poverty level (%) - Asian
Residents with income below the poverty level (%) - Hispanic or Latino
Residents with income below the poverty level (%) - American Indian and Alaska Native
Residents with income below the poverty level (%) - Multirace
Residents with income below the poverty level (%) - Other Race
Air pollution - Air Quality Index (AQI)
Air pollution - CO
Air pollution - NO2
Air pollution - SO2
Air pollution - Ozone
Air pollution - PM10
Air pollution - PM25
Air pollution - Pb
Crime - Murders per 100,000 population
Crime - Rapes per 100,000 population
Crime - Robberies per 100,000 population
Crime - Assaults per 100,000 population
Crime - Burglaries per 100,000 population
Crime - Thefts per 100,000 population
Crime - Auto thefts per 100,000 population
Crime - Arson per 100,000 population
Crime - City-data.com crime index
Crime - Violent crime index
Crime - Property crime index
Crime - Murders per 100,000 population (5 year average)
Crime - Rapes per 100,000 population (5 year average)
Crime - Robberies per 100,000 population (5 year average)
Crime - Assaults per 100,000 population (5 year average)
Crime - Burglaries per 100,000 population (5 year average)
Crime - Thefts per 100,000 population (5 year average)
Crime - Auto thefts per 100,000 population (5 year average)
Crime - Arson per 100,000 population (5 year average)
Crime - City-data.com crime index (5 year average)
Crime - Violent crime index (5 year average)
Crime - Property crime index (5 year average)
1996 Presidential Elections Results (%) - Democratic Party (Clinton)
1996 Presidential Elections Results (%) - Republican Party (Dole)
1996 Presidential Elections Results (%) - Other
2000 Presidential Elections Results (%) - Democratic Party (Gore)
2000 Presidential Elections Results (%) - Republican Party (Bush)
2000 Presidential Elections Results (%) - Other
2004 Presidential Elections Results (%) - Democratic Party (Kerry)
2004 Presidential Elections Results (%) - Republican Party (Bush)
2004 Presidential Elections Results (%) - Other
2008 Presidential Elections Results (%) - Democratic Party (Obama)
2008 Presidential Elections Results (%) - Republican Party (McCain)
2008 Presidential Elections Results (%) - Other
2012 Presidential Elections Results (%) - Democratic Party (Obama)
2012 Presidential Elections Results (%) - Republican Party (Romney)
2012 Presidential Elections Results (%) - Other
2016 Presidential Elections Results (%) - Democratic Party (Clinton)
2016 Presidential Elections Results (%) - Republican Party (Trump)
2016 Presidential Elections Results (%) - Other
2020 Presidential Elections Results (%) - Democratic Party (Biden)
2020 Presidential Elections Results (%) - Republican Party (Trump)
2020 Presidential Elections Results (%) - Other
Ancestries Reported - Arab (%)
Ancestries Reported - Czech (%)
Ancestries Reported - Danish (%)
Ancestries Reported - Dutch (%)
Ancestries Reported - English (%)
Ancestries Reported - French (%)
Ancestries Reported - French Canadian (%)
Ancestries Reported - German (%)
Ancestries Reported - Greek (%)
Ancestries Reported - Hungarian (%)
Ancestries Reported - Irish (%)
Ancestries Reported - Italian (%)
Ancestries Reported - Lithuanian (%)
Ancestries Reported - Norwegian (%)
Ancestries Reported - Polish (%)
Ancestries Reported - Portuguese (%)
Ancestries Reported - Russian (%)
Ancestries Reported - Scotch-Irish (%)
Ancestries Reported - Scottish (%)
Ancestries Reported - Slovak (%)
Ancestries Reported - Subsaharan African (%)
Ancestries Reported - Swedish (%)
Ancestries Reported - Swiss (%)
Ancestries Reported - Ukrainian (%)
Ancestries Reported - United States (%)
Ancestries Reported - Welsh (%)
Ancestries Reported - West Indian (%)
Ancestries Reported - Other (%)
Educational Attainment - No schooling completed (%)
Educational Attainment - Less than high school (%)
Educational Attainment - High school or equivalent (%)
Educational Attainment - Less than 1 year of college (%)
Educational Attainment - 1 or more years of college (%)
Educational Attainment - Associate degree (%)
Educational Attainment - Bachelor's degree (%)
Educational Attainment - Master's degree (%)
Educational Attainment - Professional school degree (%)
Educational Attainment - Doctorate degree (%)
School Enrollment - Nursery, preschool (%)
School Enrollment - Kindergarten (%)
School Enrollment - Grade 1 to 4 (%)
School Enrollment - Grade 5 to 8 (%)
School Enrollment - Grade 9 to 12 (%)
School Enrollment - College undergrad (%)
School Enrollment - Graduate or professional (%)
School Enrollment - Not enrolled in school (%)
School enrollment - Public schools (%)
School enrollment - Private schools (%)
School enrollment - Not enrolled (%)
Median number of rooms in houses and condos
Median number of rooms in apartments
Housing units lacking complete plumbing facilities (%)
Housing units lacking complete kitchen facilities (%)
Density of houses
Urban houses (%)
Rural houses (%)
Households with people 60 years and over (%)
Households with people 65 years and over (%)
Households with people 75 years and over (%)
Households with one or more nonrelatives (%)
Households with no nonrelatives (%)
Population in households (%)
Family households (%)
Nonfamily households (%)
Population in families (%)
Family households with own children (%)
Median number of bedrooms in owner occupied houses
Mean number of bedrooms in owner occupied houses
Median number of bedrooms in renter occupied houses
Mean number of bedrooms in renter occupied houses
Median number of vehichles in owner occupied houses
Mean number of vehichles in owner occupied houses
Median number of vehichles in renter occupied houses
Mean number of vehichles in renter occupied houses
Mortgage status - with mortgage (%)
Mortgage status - with second mortgage (%)
Mortgage status - with home equity loan (%)
Mortgage status - with both second mortgage and home equity loan (%)
Mortgage status - without a mortgage (%)
Average family size
Average family size - White
Average family size - Black or African American
Average family size - Asian
Average family size - Hispanic or Latino
Average family size - American Indian and Alaska Native
Average family size - Multirace
Average family size - Other Race
Geographical mobility - Same house 1 year ago (%)
Geographical mobility - Moved within same county (%)
Geographical mobility - Moved from different county within same state (%)
Geographical mobility - Moved from different state (%)
Geographical mobility - Moved from abroad (%)
Place of birth - Born in state of residence (%)
Place of birth - Born in other state (%)
Place of birth - Native, outside of US (%)
Place of birth - Foreign born (%)
Housing units in structures - 1, detached (%)
Housing units in structures - 1, attached (%)
Housing units in structures - 2 (%)
Housing units in structures - 3 or 4 (%)
Housing units in structures - 5 to 9 (%)
Housing units in structures - 10 to 19 (%)
Housing units in structures - 20 to 49 (%)
Housing units in structures - 50 or more (%)
Housing units in structures - Mobile home (%)
Housing units in structures - Boat, RV, van, etc. (%)
House/condo owner moved in on average (years ago)
Renter moved in on average (years ago)
Year householder moved into unit - Moved in 1999 to March 2000 (%)
Year householder moved into unit - Moved in 1995 to 1998 (%)
Year householder moved into unit - Moved in 1990 to 1994 (%)
Year householder moved into unit - Moved in 1980 to 1989 (%)
Year householder moved into unit - Moved in 1970 to 1979 (%)
Year householder moved into unit - Moved in 1969 or earlier (%)
Means of transportation to work - Drove car alone (%)
Means of transportation to work - Carpooled (%)
Means of transportation to work - Public transportation (%)
Means of transportation to work - Bus or trolley bus (%)
Means of transportation to work - Streetcar or trolley car (%)
Means of transportation to work - Subway or elevated (%)
Means of transportation to work - Railroad (%)
Means of transportation to work - Ferryboat (%)
Means of transportation to work - Taxicab (%)
Means of transportation to work - Motorcycle (%)
Means of transportation to work - Bicycle (%)
Means of transportation to work - Walked (%)
Means of transportation to work - Other means (%)
Working at home (%)
Industry diversity
Most Common Industries - Agriculture, forestry, fishing and hunting, and mining (%)
Most Common Industries - Agriculture, forestry, fishing and hunting (%)
Most Common Industries - Mining, quarrying, and oil and gas extraction (%)
Most Common Industries - Construction (%)
Most Common Industries - Manufacturing (%)
Most Common Industries - Wholesale trade (%)
Most Common Industries - Retail trade (%)
Most Common Industries - Transportation and warehousing, and utilities (%)
Most Common Industries - Transportation and warehousing (%)
Most Common Industries - Utilities (%)
Most Common Industries - Information (%)
Most Common Industries - Finance and insurance, and real estate and rental and leasing (%)
Most Common Industries - Finance and insurance (%)
Most Common Industries - Real estate and rental and leasing (%)
Most Common Industries - Professional, scientific, and management, and administrative and waste management services (%)
Most Common Industries - Professional, scientific, and technical services (%)
Most Common Industries - Management of companies and enterprises (%)
Most Common Industries - Administrative and support and waste management services (%)
Most Common Industries - Educational services, and health care and social assistance (%)
Most Common Industries - Educational services (%)
Most Common Industries - Health care and social assistance (%)
Most Common Industries - Arts, entertainment, and recreation, and accommodation and food services (%)
Most Common Industries - Arts, entertainment, and recreation (%)
Most Common Industries - Accommodation and food services (%)
Most Common Industries - Other services, except public administration (%)
Most Common Industries - Public administration (%)
Occupation diversity
Most Common Occupations - Management, business, science, and arts occupations (%)
Most Common Occupations - Management, business, and financial occupations (%)
Most Common Occupations - Management occupations (%)
Most Common Occupations - Business and financial operations occupations (%)
Most Common Occupations - Computer, engineering, and science occupations (%)
Most Common Occupations - Computer and mathematical occupations (%)
Most Common Occupations - Architecture and engineering occupations (%)
Most Common Occupations - Life, physical, and social science occupations (%)
Most Common Occupations - Education, legal, community service, arts, and media occupations (%)
Most Common Occupations - Community and social service occupations (%)
Most Common Occupations - Legal occupations (%)
Most Common Occupations - Education, training, and library occupations (%)
Most Common Occupations - Arts, design, entertainment, sports, and media occupations (%)
Most Common Occupations - Healthcare practitioners and technical occupations (%)
Most Common Occupations - Health diagnosing and treating practitioners and other technical occupations (%)
Most Common Occupations - Health technologists and technicians (%)
Most Common Occupations - Service occupations (%)
Most Common Occupations - Healthcare support occupations (%)
Most Common Occupations - Protective service occupations (%)
Most Common Occupations - Fire fighting and prevention, and other protective service workers including supervisors (%)
Most Common Occupations - Law enforcement workers including supervisors (%)
Most Common Occupations - Food preparation and serving related occupations (%)
Most Common Occupations - Building and grounds cleaning and maintenance occupations (%)
Most Common Occupations - Personal care and service occupations (%)
Most Common Occupations - Sales and office occupations (%)
Most Common Occupations - Sales and related occupations (%)
Most Common Occupations - Office and administrative support occupations (%)
Most Common Occupations - Natural resources, construction, and maintenance occupations (%)
Most Common Occupations - Farming, fishing, and forestry occupations (%)
Most Common Occupations - Construction and extraction occupations (%)
Most Common Occupations - Installation, maintenance, and repair occupations (%)
Most Common Occupations - Production, transportation, and material moving occupations (%)
Most Common Occupations - Production occupations (%)
Most Common Occupations - Transportation occupations (%)
Most Common Occupations - Material moving occupations (%)
People in Group quarters - Institutionalized population (%)
People in Group quarters - Correctional institutions (%)
People in Group quarters - Federal prisons and detention centers (%)
People in Group quarters - Halfway houses (%)
People in Group quarters - Local jails and other confinement facilities (including police lockups) (%)
People in Group quarters - Military disciplinary barracks (%)
People in Group quarters - State prisons (%)
People in Group quarters - Other types of correctional institutions (%)
People in Group quarters - Nursing homes (%)
People in Group quarters - Hospitals/wards, hospices, and schools for the handicapped (%)
People in Group quarters - Hospitals/wards and hospices for chronically ill (%)
People in Group quarters - Hospices or homes for chronically ill (%)
People in Group quarters - Military hospitals or wards for chronically ill (%)
People in Group quarters - Other hospitals or wards for chronically ill (%)
People in Group quarters - Hospitals or wards for drug/alcohol abuse (%)
People in Group quarters - Mental (Psychiatric) hospitals or wards (%)
People in Group quarters - Schools, hospitals, or wards for the mentally retarded (%)
People in Group quarters - Schools, hospitals, or wards for the physically handicapped (%)
People in Group quarters - Institutions for the deaf (%)
People in Group quarters - Institutions for the blind (%)
People in Group quarters - Orthopedic wards and institutions for the physically handicapped (%)
People in Group quarters - Wards in general hospitals for patients who have no usual home elsewhere (%)
People in Group quarters - Wards in military hospitals for patients who have no usual home elsewhere (%)
People in Group quarters - Juvenile institutions (%)
People in Group quarters - Long-term care (%)
People in Group quarters - Homes for abused, dependent, and neglected children (%)
People in Group quarters - Residential treatment centers for emotionally disturbed children (%)
People in Group quarters - Training schools for juvenile delinquents (%)
People in Group quarters - Short-term care, detention or diagnostic centers for delinquent children (%)
People in Group quarters - Type of juvenile institution unknown (%)
People in Group quarters - Noninstitutionalized population (%)
People in Group quarters - College dormitories (includes college quarters off campus) (%)
People in Group quarters - Military quarters (%)
People in Group quarters - On base (%)
People in Group quarters - Barracks, unaccompanied personnel housing (UPH), (Enlisted/Officer), ;and similar group living quarters for military personnel (%)
People in Group quarters - Transient quarters for temporary residents (%)
People in Group quarters - Military ships (%)
People in Group quarters - Group homes (%)
People in Group quarters - Homes or halfway houses for drug/alcohol abuse (%)
People in Group quarters - Homes for the mentally ill (%)
People in Group quarters - Homes for the mentally retarded (%)
People in Group quarters - Homes for the physically handicapped (%)
People in Group quarters - Other group homes (%)
People in Group quarters - Religious group quarters (%)
People in Group quarters - Dormitories (%)
People in Group quarters - Agriculture workers' dormitories on farms (%)
People in Group quarters - Job Corps and vocational training facilities (%)
People in Group quarters - Other workers' dormitories (%)
People in Group quarters - Crews of maritime vessels (%)
People in Group quarters - Other nonhousehold living situations (%)
People in Group quarters - Other noninstitutional group quarters (%)
Residents speaking English at home (%)
Residents speaking English at home - Born in the United States (%)
Residents speaking English at home - Native, born elsewhere (%)
Residents speaking English at home - Foreign born (%)
Residents speaking Spanish at home (%)
Residents speaking Spanish at home - Born in the United States (%)
Residents speaking Spanish at home - Native, born elsewhere (%)
Residents speaking Spanish at home - Foreign born (%)
Residents speaking other language at home (%)
Residents speaking other language at home - Born in the United States (%)
Residents speaking other language at home - Native, born elsewhere (%)
Residents speaking other language at home - Foreign born (%)
Class of Workers - Employee of private company (%)
Class of Workers - Self-employed in own incorporated business (%)
Class of Workers - Private not-for-profit wage and salary workers (%)
Class of Workers - Local government workers (%)
Class of Workers - State government workers (%)
Class of Workers - Federal government workers (%)
Class of Workers - Self-employed workers in own not incorporated business and Unpaid family workers (%)
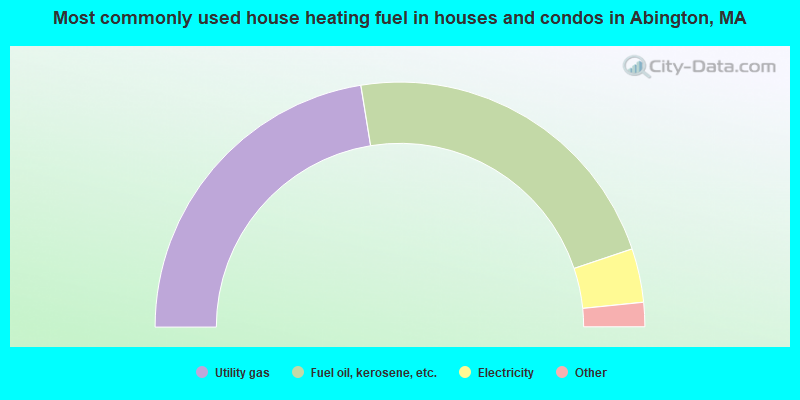
House heating fuel used in houses and condos - Utility gas (%)
House heating fuel used in houses and condos - Bottled, tank, or LP gas (%)
House heating fuel used in houses and condos - Electricity (%)
House heating fuel used in houses and condos - Fuel oil, kerosene, etc. (%)
House heating fuel used in houses and condos - Coal or coke (%)
House heating fuel used in houses and condos - Wood (%)
House heating fuel used in houses and condos - Solar energy (%)
House heating fuel used in houses and condos - Other fuel (%)
House heating fuel used in houses and condos - No fuel used (%)
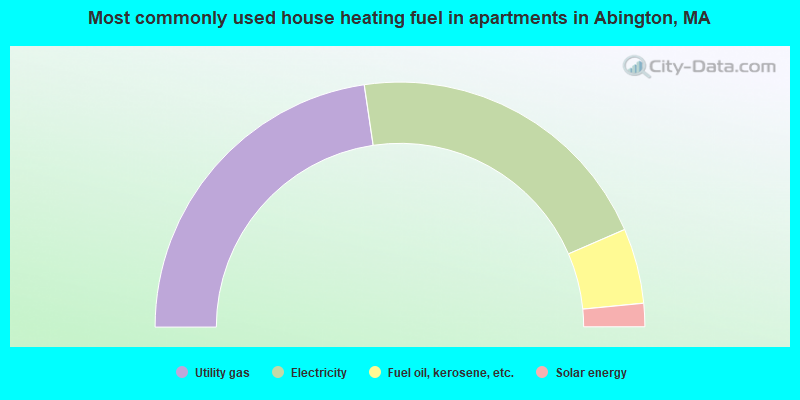
House heating fuel used in apartments - Utility gas (%)
House heating fuel used in apartments - Bottled, tank, or LP gas (%)
House heating fuel used in apartments - Electricity (%)
House heating fuel used in apartments - Fuel oil, kerosene, etc. (%)
House heating fuel used in apartments - Coal or coke (%)
House heating fuel used in apartments - Wood (%)
House heating fuel used in apartments - Solar energy (%)
House heating fuel used in apartments - Other fuel (%)
House heating fuel used in apartments - No fuel used (%)
Armed forces status - In Armed Forces (%)
Armed forces status - Civilian (%)
Armed forces status - Civilian - Veteran (%)
Armed forces status - Civilian - Nonveteran (%)
Fatal accidents locations in years 2005-2021
Fatal accidents locations in 2005
Fatal accidents locations in 2006
Fatal accidents locations in 2007
Fatal accidents locations in 2008
Fatal accidents locations in 2009
Fatal accidents locations in 2010
Fatal accidents locations in 2011
Fatal accidents locations in 2012
Fatal accidents locations in 2013
Fatal accidents locations in 2014
Fatal accidents locations in 2015
Fatal accidents locations in 2016
Fatal accidents locations in 2017
Fatal accidents locations in 2018
Fatal accidents locations in 2019
Fatal accidents locations in 2020
Fatal accidents locations in 2021
Alcohol use - People drinking some alcohol every month (%)
Alcohol use - People not drinking at all (%)
Alcohol use - Average days/month drinking alcohol
Alcohol use - Average drinks/week
Alcohol use - Average days/year people drink much
Audiometry - Average condition of hearing (%)
Audiometry - People that can hear a whisper from across a quiet room (%)
Audiometry - People that can hear normal voice from across a quiet room (%)
Audiometry - Ears ringing, roaring, buzzing (%)
Audiometry - Had a job exposure to loud noise (%)
Audiometry - Had off-work exposure to loud noise (%)
Blood Pressure & Cholesterol - Has high blood pressure (%)
Blood Pressure & Cholesterol - Checking blood pressure at home (%)
Blood Pressure & Cholesterol - Frequently checking blood cholesterol (%)
Blood Pressure & Cholesterol - Has high cholesterol level (%)
Consumer Behavior - Money monthly spent on food at supermarket/grocery store
Consumer Behavior - Money monthly spent on food at other stores
Consumer Behavior - Money monthly spent on eating out
Consumer Behavior - Money monthly spent on carryout/delivered foods
Consumer Behavior - Income spent on food at supermarket/grocery store (%)
Consumer Behavior - Income spent on food at other stores (%)
Consumer Behavior - Income spent on eating out (%)
Consumer Behavior - Income spent on carryout/delivered foods (%)
Current Health Status - General health condition (%)
Current Health Status - Blood donors (%)
Current Health Status - Has blood ever tested for HIV virus (%)
Current Health Status - Left-handed people (%)
Dermatology - People using sunscreen (%)
Diabetes - Diabetics (%)
Diabetes - Had a blood test for high blood sugar (%)
Diabetes - People taking insulin (%)
Diet Behavior & Nutrition - Diet health (%)
Diet Behavior & Nutrition - Milk product consumption (# of products/month)
Diet Behavior & Nutrition - Meals not home prepared (#/week)
Diet Behavior & Nutrition - Meals from fast food or pizza place (#/week)
Diet Behavior & Nutrition - Ready-to-eat foods (#/month)
Diet Behavior & Nutrition - Frozen meals/pizza (#/month)
Drug Use - People that ever used marijuana or hashish (%)
Drug Use - Ever used hard drugs (%)
Drug Use - Ever used any form of cocaine (%)
Drug Use - Ever used heroin (%)
Drug Use - Ever used methamphetamine (%)
Health Insurance - People covered by health insurance (%)
Kidney Conditions-Urology - Avg. # of times urinating at night
Medical Conditions - People with asthma (%)
Medical Conditions - People with anemia (%)
Medical Conditions - People with psoriasis (%)
Medical Conditions - People with overweight (%)
Medical Conditions - Elderly people having difficulties in thinking or remembering (%)
Medical Conditions - People who ever received blood transfusion (%)
Medical Conditions - People having trouble seeing even with glass/contacts (%)
Medical Conditions - People with arthritis (%)
Medical Conditions - People with gout (%)
Medical Conditions - People with congestive heart failure (%)
Medical Conditions - People with coronary heart disease (%)
Medical Conditions - People with angina pectoris (%)
Medical Conditions - People who ever had heart attack (%)
Medical Conditions - People who ever had stroke (%)
Medical Conditions - People with emphysema (%)
Medical Conditions - People with thyroid problem (%)
Medical Conditions - People with chronic bronchitis (%)
Medical Conditions - People with any liver condition (%)
Medical Conditions - People who ever had cancer or malignancy (%)
Mental Health - People who have little interest in doing things (%)
Mental Health - People feeling down, depressed, or hopeless (%)
Mental Health - People who have trouble sleeping or sleeping too much (%)
Mental Health - People feeling tired or having little energy (%)
Mental Health - People with poor appetite or overeating (%)
Mental Health - People feeling bad about themself (%)
Mental Health - People who have trouble concentrating on things (%)
Mental Health - People moving or speaking slowly or too fast (%)
Mental Health - People having thoughts they would be better off dead (%)
Oral Health - Average years since last visit a dentist
Oral Health - People embarrassed because of mouth (%)
Oral Health - People with gum disease (%)
Oral Health - General health of teeth and gums (%)
Oral Health - Average days a week using dental floss/device
Oral Health - Average days a week using mouthwash for dental problem
Oral Health - Average number of teeth
Pesticide Use - Households using pesticides to control insects (%)
Pesticide Use - Households using pesticides to kill weeds (%)
Physical Activity - People doing vigorous-intensity work activities (%)
Physical Activity - People doing moderate-intensity work activities (%)
Physical Activity - People walking or bicycling (%)
Physical Activity - People doing vigorous-intensity recreational activities (%)
Physical Activity - People doing moderate-intensity recreational activities (%)
Physical Activity - Average hours a day doing sedentary activities
Physical Activity - Average hours a day watching TV or videos
Physical Activity - Average hours a day using computer
Physical Functioning - People having limitations keeping them from working (%)
Physical Functioning - People limited in amount of work they can do (%)
Physical Functioning - People that need special equipment to walk (%)
Physical Functioning - People experiencing confusion/memory problems (%)
Physical Functioning - People requiring special healthcare equipment (%)
Prescription Medications - Average number of prescription medicines taking
Preventive Aspirin Use - Adults 40+ taking low-dose aspirin (%)
Reproductive Health - Vaginal deliveries (%)
Reproductive Health - Cesarean deliveries (%)
Reproductive Health - Deliveries resulted in a live birth (%)
Reproductive Health - Pregnancies resulted in a delivery (%)
Reproductive Health - Women breastfeeding newborns (%)
Reproductive Health - Women that had a hysterectomy (%)
Reproductive Health - Women that had both ovaries removed (%)
Reproductive Health - Women that have ever taken birth control pills (%)
Reproductive Health - Women taking birth control pills (%)
Reproductive Health - Women that have ever used Depo-Provera or injectables (%)
Reproductive Health - Women that have ever used female hormones (%)
Sexual Behavior - People 18+ that ever had sex (vaginal, anal, or oral) (%)
Sexual Behavior - Males 18+ that ever had vaginal sex with a woman (%)
Sexual Behavior - Males 18+ that ever performed oral sex on a woman (%)
Sexual Behavior - Males 18+ that ever had anal sex with a woman (%)
Sexual Behavior - Males 18+ that ever had any sex with a man (%)
Sexual Behavior - Females 18+ that ever had vaginal sex with a man (%)
Sexual Behavior - Females 18+ that ever performed oral sex on a man (%)
Sexual Behavior - Females 18+ that ever had anal sex with a man (%)
Sexual Behavior - Females 18+ that ever had any kind of sex with a woman (%)
Sexual Behavior - Average age people first had sex
Sexual Behavior - Average number of female sex partners in lifetime (males 18+)
Sexual Behavior - Average number of female vaginal sex partners in lifetime (males 18+)
Sexual Behavior - Average age people first performed oral sex on a woman (18+)
Sexual Behavior - Average number of woman performed oral sex on in lifetime (18+)
Sexual Behavior - Average number of male sex partners in lifetime (males 18+)
Sexual Behavior - Average number of male anal sex partners in lifetime (males 18+)
Sexual Behavior - Average age people first performed oral sex on a man (18+)
Sexual Behavior - Average number of male oral sex partners in lifetime (18+)
Sexual Behavior - People using protection when performing oral sex (%)
Sexual Behavior - Average number of times people have vaginal or anal sex a year
Sexual Behavior - People having sex without condom (%)
Sexual Behavior - Average number of male sex partners in lifetime (females 18+)
Sexual Behavior - Average number of male vaginal sex partners in lifetime (females 18+)
Sexual Behavior - Average number of female sex partners in lifetime (females 18+)
Sexual Behavior - Circumcised males 18+ (%)
Sleep Disorders - Average hours sleeping at night
Sleep Disorders - People that has trouble sleeping (%)
Smoking-Cigarette Use - People smoking cigarettes (%)
Taste & Smell - People 40+ having problems with smell (%)
Taste & Smell - People 40+ having problems with taste (%)
Taste & Smell - People 40+ that ever had wisdom teeth removed (%)
Taste & Smell - People 40+ that ever had tonsils teeth removed (%)
Taste & Smell - People 40+ that ever had a loss of consciousness because of a head injury (%)
Taste & Smell - People 40+ that ever had a broken nose or other serious injury to face or skull (%)
Taste & Smell - People 40+ that ever had two or more sinus infections (%)
Weight - Average height (inches)
Weight - Average weight (pounds)
Weight - Average BMI
Weight - People that are obese (%)
Weight - People that ever were obese (%)
Weight - People trying to lose weight (%)
According to our research of Massachusetts and other state lists, there were 5 registered sex offenders living in Abington, Massachusetts as of June 15, 2024 . The ratio of all residents to sex offenders in Abington is 3,283 to 1.The ratio of registered sex offenders to all residents in this city is lower than the state average.
Officers per 1,000 residents here:
1.73Massachusetts average:
2.59
Latest news from Abington, MA collected exclusively by city-data.com from local newspapers, TV, and radio stations
Ancestries: Irish (38.1%), Italian (9.8%), American (7.2%), Cape Verdean (5.0%), English (4.8%), Albanian (4.4%).
Current Local Time:
Land area: 9.94 square miles.
Population density: 1,608 people per square mile (low).
1,707 residents are foreign born (3.0% Latin America , 2.7% Europe , 2.3% Asia , 1.8% Africa ).
This place:
10.0%Massachusetts:
17.6%
Median real estate property taxes paid for housing units with mortgages in 2022: $6,875 (1.2%)Median real estate property taxes paid for housing units with no mortgage in 2022: $6,402 (1.3%)
Nearest city with pop. 50,000+: Brockton, MA
Nearest city with pop. 200,000+: Boston, MA
Nearest city with pop. 1,000,000+: Bronx, NY
Nearest cities:
Latitude: 42.12 N, Longitude: 70.95 W
Daytime population change due to commuting: -4,693 (-27.4%)Workers who live and work in this place: 2,115 (22.7%)
Single-family new house construction building permits:
2022: 6 buildings , average cost: $300,0002021: 6 buildings , average cost: $321,0002020: 6 buildings , average cost: $342,2002019: 13 buildings , average cost: $295,4002018: 27 buildings , average cost: $278,3002017: 30 buildings , average cost: $267,6002016: 5 buildings , average cost: $317,1002015: 5 buildings , average cost: $331,3002014: 13 buildings , average cost: $230,6002013: 14 buildings , average cost: $222,5002012: 12 buildings , average cost: $203,5002011: 14 buildings , average cost: $224,4002010: 15 buildings , average cost: $251,6002009: 12 buildings , average cost: $258,9002008: 18 buildings , average cost: $231,6002007: 27 buildings , average cost: $217,3002006: 29 buildings , average cost: $186,4002005: 23 buildings , average cost: $198,7002004: 31 buildings , average cost: $194,3002003: 37 buildings , average cost: $173,1002002: 137 buildings , average cost: $126,2002001: 90 buildings , average cost: $102,0002000: 60 buildings , average cost: $120,8001999: 66 buildings , average cost: $93,8001998: 16 buildings , average cost: $85,9001997: 17 buildings , average cost: $95,900Unemployment in December 2023: Here:
3.6%Massachusetts:
3.5%
Most common occupations in Abington, MA (%)
Both Males Females
Other management occupations, except farmers and farm managers (5.5%)
Other office and administrative support workers, including supervisors (4.6%)
Secretaries and administrative assistants (4.4%)
Registered nurses (3.3%)
Material recording, scheduling, dispatching, and distributing workers (3.1%)
Sales representatives, services, wholesale and manufacturing (3.0%)
Other sales and related occupations, including supervisors (2.9%)
Other management occupations, except farmers and farm managers (7.3%)
Driver/sales workers and truck drivers (5.0%)
Material recording, scheduling, dispatching, and distributing workers (4.9%)
Electrical equipment mechanics and other installation, maintenance, and repair workers, including supervisors (4.8%)
Building and grounds cleaning and maintenance occupations (4.5%)
Other production occupations, including supervisors (3.8%)
Sales representatives, services, wholesale and manufacturing (3.4%)
Secretaries and administrative assistants (8.9%)
Other office and administrative support workers, including supervisors (7.5%)
Registered nurses (6.5%)
Preschool, kindergarten, elementary, and middle school teachers (4.8%)
Cashiers (4.0%)
Information and record clerks, except customer service representatives (3.8%)
Health technologists and technicians (3.7%)
Tornado activity:
Abington-area historical tornado activity is slightly below Massachusetts state average. It is 55% smaller than the overall U.S. average.
On 6/9/1953, a category F4 (max. wind speeds 207-260 mph) tornado 31.9 miles away from the Abington place center killed 90 people and injured 1228 people and caused between $50,000,000 and $500,000,000 in damages.
On 6/9/1953, a category F3 (max. wind speeds 158-206 mph) tornado 13.8 miles away from the place center injured 17 people and caused between $500,000 and $5,000,000 in damages.
Earthquake activity:
Abington-area historical earthquake activity is significantly above Massachusetts state average. It is 74% smaller than the overall U.S. average. On 10/7/1983 at 10:18:46, a magnitude 5.3 (5.1 MB, 5.3 LG, 5.1 ML, Class: Moderate, Intensity: VI - VII) earthquake occurred 213.3 miles away from the city center On 4/20/2002 at 10:50:47, a magnitude 5.3 (5.3 ML, Depth: 3.0 mi) earthquake occurred 215.7 miles away from Abington center On 1/19/1982 at 00:14:42, a magnitude 4.7 (4.5 MB, 4.7 MD, 4.5 LG, Class: Light, Intensity: IV - V) earthquake occurred 101.1 miles away from the city center On 10/16/2012 at 23:12:25, a magnitude 4.7 (4.7 ML, Depth: 10.0 mi) earthquake occurred 103.3 miles away from the city center On 4/20/2002 at 10:50:47, a magnitude 5.2 (5.2 MB, 4.2 MS, 5.2 MW, 5.0 MW) earthquake occurred 215.0 miles away from Abington center On 8/22/1992 at 12:20:32, a magnitude 4.8 (4.8 MB, 3.8 MS, 4.7 LG, Depth: 6.2 mi) earthquake occurred 211.0 miles away from the city center Magnitude types: regional Lg-wave magnitude (LG), body-wave magnitude (MB), duration magnitude (MD), local magnitude (ML), surface-wave magnitude (MS), moment magnitude (MW) Natural disasters: The number of natural disasters in Plymouth County (26) is a lot greater than the US average (15).Major Disasters (Presidential) Declared: 17Emergencies Declared: 9Floods: 11, Storms: 9, Hurricanes: 7, Snows: 3, Snowstorms: 3, Blizzards: 2, Winter Storms: 2, Heavy Rain: 1, Snowfall: 1, Tropical Storm: 1, Wind: 1 (Note: some incidents may be assigned to more than one category). Main business address for: ABINGTON BANCORP INC SAVINGS INSTITUTIONS, NOT FEDERALLY CHARTERED ).
Hospitals and medical centers in Abington: COLONY HOUSE HEALTH CARE (277 WASHINGTON ST)
KINDRED NURSING AND REHABILITATION-COLONY HOUSE (277 WASHINGTON STREET)
MILDRED ALFORD NURSING HOME (81 BIRCH STREET)
Amtrak stations near Abington: 13 miles: ROUTE 128 (WESTWOOD, UNIVERSITY AVE. & RTE. 128) Services: ticket office, enclosed waiting area, public restrooms, public payphones, vending machines, paid short-term parking, taxi stand, public transit connection.
17 miles: BOSTON (SO. STA) (BOSTON, ATLANTIC AVE. & SUMMER ST.) Services: ticket office, fully wheelchair accessible, enclosed waiting area, public restrooms, public payphones, full-service food facilities and snack bar, ATM, paid short-term parking, paid long-term parking, call for car rental service, taxi stand, intercity bus service, public transit connection.
18 miles: BACK BAY (BOSTON, 145 DARTMOUTH ST.) Services: ticket office, partially wheelchair accessible, enclosed waiting area, public restrooms, public payphones, vending machines, ATM, paid short-term parking, paid long-term parking, call for car rental service, taxi stand, public transit connection.
Operable nuclear power plant near Abington:
19 miles: Pilgrim in Plymouth, MA.
Colleges/universities with over 2000 students nearest to Abington:
Massasoit Community College (about 4 miles; Brockton, MA ; Full-time enrollment: 5,442)
Stonehill College (about 8 miles; Easton, MA ; FT enrollment: 2,563)
Bridgewater State University (about 10 miles; Bridgewater, MA ; FT enrollment: 9,802)
Quincy College (about 10 miles; Quincy, MA ; FT enrollment: 3,184)
Curry College (about 12 miles; Milton, MA ; FT enrollment: 2,586)
University of Massachusetts-Boston (about 15 miles; Boston, MA ; FT enrollment: 12,625)
Wentworth Institute of Technology (about 17 miles; Boston, MA ; FT enrollment: 4,418)
Public high school in Abington: ABINGTON HIGH Students: 588, Location: 201 GLINIEWICZ WAY, Grades: 9-12)Public elementary/middle schools in Abington: WOODSDALE ELEMENTARY SCHOOL Students: 391, Location: 128 CHESTNUT STREET, Grades: 5-6)FROLIO MIDDLE SCHOOL Location: 1071 WASHINGTON STREET, Grades: 7-8)
BEAVER BROOK ELEMENTARY SCHOOL Location: 1 RALPH HAMLIN LANE, Grades: 1-4)
Private elementary/middle school in Abington: ST BRIDGET SCHOOL Students: 210, Location: 455 PLYMOUTH ST, Grades: PK-7)
See full list of schools located in Abington Library in Abington: ABINGTON PUBLIC LIBRARY Operating income: $467,104; Location: 600 GLINIEWICZ WAY; 64,235 books ; 1,849 audio materials ; 1,577 video materials ; 1 local licensed databases ; 34 state licensed databases ; 1 other licensed databases ; 93 print serial subscriptions )
User-submitted facts and corrections:
Parks in Abington Ames State Forest Cleveland pond Department of Evniromental Managment Linwood st Island Grove Park Park st Abington parks & recreation
Notable locations in Abington: (A) , North Abington Depot (B) , Strawberry Valley Golf Course (C) , Abington Fire Department Station 2 (D) , Burton L Wales Public Library (E) , Abington Fire Department Station 1 Headquarters (F) , North Abington Town Hall (G) . Display/hide their locations on the map
Main business address in Abington: (A) . Display/hide its location on the map
Churches in Abington include: (A) , Saint Marks Lutheran Church (B) , Rock Church of Rockland (C) , Saint Nicholas Church (D) . Display/hide their locations on the map
Cemeteries: (1) , Cushing Family Tomb Site (2) , Gould Family Burying Ground Site (3) , Hunt Family Tomb Site (4) , Island Grove Cemetery (5) , Nash Family Tomb (6) , Old Church Burying Ground (7) . Display/hide their locations on the map
Lakes and reservoirs: (A) , Cushing Pond (B) , Cleveland Pond (C) , Hunts Pond (D) , Island Grove Pond (E) . Display/hide their locations on the map
Parks in Abington include: (1) , Ames Nowell State Park (2) . Display/hide their locations on the map
Birthplace of: Jared C. Monti - Army Medal of Honor recipient, William S. McNary - Politician, Pete Smith (1987–98 pitcher) - Baseball player, Simeon Gannett Reed - Businessman, Dan Burke (baseball) - Baseball player, Eugene F. Loud - Politician, Larry Murphy (actor) - Stand-up comedian, Levi Reed - Politician, Lyman Reed Blake - Inventor who devised a sewing machine for sewing the soles of shoes to the vamp of the shoe, Michael Driscoll (baseball) - Baseball player.
Plymouth County has a predicted average indoor radon screening level between 2 and 4 pCi/L (pico curies per liter) - Moderate Potential Drinking water stations with addresses in Abington and their reported violations in the past:
ELIOT WOODS CONDOS (Address: 27 GREENWOOD ST Population served: 140, Groundwater):
Past health violations:
MCL, Monthly (TCR) - In JUL-2011, Contaminant: Coliform. Follow-up actions: St AO (w/o penalty) issued (NOV-28-2011), St Compliance achieved (NOV-28-2011)
MCL, Monthly (TCR) - In AUG-2010, Contaminant: Coliform. Follow-up actions: St AO (w/o penalty) issued (NOV-29-2010), St Compliance achieved (NOV-29-2010)
Average household size: This place:
2.6 peopleMassachusetts:
2.5 people
Percentage of family households: This place:
67.6%Whole state:
63.0%
Percentage of households with unmarried partners: This place:
7.7%Whole state:
7.0%
Likely homosexual households (counted as self-reported same-sex unmarried-partner households)
Lesbian couples: 0.4% of all households Gay men: 0.3% of all households
People in group quarters in Abington in 2010:
86 people in nursing facilities/skilled-nursing facilities
4 people in residential treatment centers for adults
2 people in other noninstitutional facilities
People in group quarters in Abington in 2000:
182 people in nursing homes
7 people in other nonhousehold living situations
2 people in religious group quarters
Banks with branches in Abington (2011 data):
Sovereign Bank, National Association: Abington Savings Bank Branch at 533 Washington Street, branch established on 1853/01/01. Info updated 2012/01/31: Bank assets: $78,146.9 mil, Deposits: $48,042.9 mil, headquarters in Wilmington, DE, positive income , Commercial Lending Specialization, 718 total offices , Holding Company: Banco Santander, S.A.
Abington Bank: at 6 Harrison Avenue, branch established on 1888/01/01. Info updated 2009/01/28: Bank assets: $101.0 mil, Deposits: $83.8 mil, local headquarters , positive income , Mortgage Lending Specialization, 1 total offices
Bank of America, National Association: Abington Branch at 93 Brockton Avenue, branch established on 2002/10/15. Info updated 2009/11/18: Bank assets: $1,451,969.3 mil, Deposits: $1,077,176.8 mil, headquarters in Charlotte, NC, positive income , 5782 total offices , Holding Company: Bank Of America Corporation
Rockland Trust Company: Abington Branch at 381 Centre Ave, branch established on 2007/11/19. Info updated 2009/05/20: Bank assets: $4,974.4 mil, Deposits: $3,903.9 mil, headquarters in Rockland, MA, positive income , Commercial Lending Specialization, 67 total offices , Holding Company: Independent Bank Corp.
RBS Citizens, National Association: Abington Stop And Shop Branch at 375 Centre Street, branch established on 2002/09/18. Info updated 2007/09/19: Bank assets: $106,940.6 mil, Deposits: $75,690.2 mil, headquarters in Providence, RI, positive income , 1135 total offices , Holding Company: Uk Financial Investments Limited
For population 15 years and over in Abington:
Never married: 32.0%Now married: 53.1%Separated: 0.7%Widowed: 4.8%Divorced: 9.4% For population 25 years and over in Abington:
High school or higher: 95.6%Bachelor's degree or higher: 40.8%Graduate or professional degree: 12.9%Unemployed: 2.4%Mean travel time to work (commute): 29.1 minutes
Education Gini index (Inequality in education) Here:
9.8Massachusetts average:
13.0
Religion statistics for Abington, MA (based on Plymouth County data)
Religion Adherents Congregations Catholic 165,985 35 Mainline Protestant 23,724 91 Evangelical Protestant 13,159 96 Other 6,129 43 Orthodox 1,140 3 Black Protestant 611 5 None 284,171 -
Source: Clifford Grammich, Kirk Hadaway, Richard Houseal, Dale E.Jones, Alexei Krindatch, Richie Stanley and Richard H.Taylor. 2012. 2010 U.S.Religion Census: Religious Congregations & Membership Study. Association of Statisticians of American Religious Bodies. Jones, Dale E., et al. 2002. Congregations and Membership in the United States 2000. Nashville, TN: Glenmary Research Center. Graphs represent county-level data
Food Environment Statistics: Number of grocery stores : 85Plymouth County :
1.74 / 10,000 pop.Massachusetts :
1.98 / 10,000 pop.
Number of supercenters and club stores : 2This county :
0.04 / 10,000 pop.State :
0.05 / 10,000 pop.
Number of convenience stores (no gas) : 139Plymouth County :
2.84 / 10,000 pop.Massachusetts :
2.22 / 10,000 pop.
Number of convenience stores (with gas) : 108Plymouth County :
2.20 / 10,000 pop.State :
1.77 / 10,000 pop.
Number of full-service restaurants : 361Here :
7.37 / 10,000 pop.State :
8.76 / 10,000 pop.
Adult diabetes rate : This county :
7.9%Massachusetts :
8.1%
Adult obesity rate : Plymouth County :
21.7%Massachusetts :
22.5%
Low-income preschool obesity rate : This county :
16.3%State :
16.5%
Health and Nutrition: Healthy diet rate : Abington:
53.3%Massachusetts:
50.5%
Average overall health of teeth and gums : This city:
52.3%State:
48.0%
Average BMI : This city:
28.3Massachusetts:
28.4
People feeling badly about themselves : Abington:
20.0%State:
20.7%
People not drinking alcohol at all : Average hours sleeping at night : Overweight people : This city:
34.5%State:
33.4%
General health condition : Abington:
60.1%State:
57.1%
Average condition of hearing : This city:
79.9%Massachusetts:
79.2%
More about Health and Nutrition of Abington, MA Residents
5.54% of this county's 2020 resident taxpayers moved to other counties in 2021 ($85,482 average adjusted gross income )
Here:
5.54%Massachusetts average:
7.18%
0.01% of residents moved to foreign countries ($80 average AGI )Plymouth County:
0.01%Massachusetts average:
0.02%
Top counties to which taxpayers relocated from this county between 2020 and 2021:
Businesses in Abington, MA
Name Count Name Count
7-Eleven 1 Stop & Shop 1 Advance Auto Parts 1 Subway 2 Dairy Queen 1 T-Mobile 2 Dunkin Donuts 4 Target 1 FedEx 2 U-Haul 1 Lowe's 1 UPS 1 MasterBrand Cabinets 4 Walmart 1 Starbucks 1 Wendy's 1
Strongest AM radio stations in Abington:
WBZ (1030 AM; 50 kW; BOSTON, MA; Owner: INFINITY BROADCASTING OPERATIONS, INC.)
WEEI (850 AM; 50 kW; BOSTON, MA; Owner: ENTERCOM BOSTON LICENSE, LLC)
WRKO (680 AM; 50 kW; BOSTON, MA; Owner: ENTERCOM BOSTON LICENSE, LLC)
WWZN (1510 AM; 50 kW; BOSTON, MA; Owner: ROSE CITY RADIO CORPORATION)
WBET (1460 AM; 5 kW; BROCKTON, MA; Owner: KJI BROADCASTING, LLC)
WKOX (1200 AM; 50 kW; FRAMINGHAM, MA; Owner: CAPSTAR TX LIMITED PARTNERSHIP)
WBIX (1060 AM; 40 kW; NATICK, MA; Owner: LANGER BROADCASTING CORPORATION)
WUNR (1600 AM; 20 kW; BROOKLINE, MA; Owner: CHAMPION BROADCASTING SYSTEMS, INC.)
WAMG (890 AM; 25 kW; DEDHAM, MA; Owner: MEGA COMMUNICATIONS OF DEDHAM LICENSEE, LLC)
WALE (990 AM; 50 kW; GREENVILLE, RI; Owner: NORTH AMERICAN BROADCASTING CO., INC.)
WRCA (1330 AM; 25 kW; WALTHAM, MA; Owner: WRCA LICENSE, LLC)
WMKI (1260 AM; 5 kW; BOSTON, MA; Owner: ABC, INC.)
WCRN (830 AM; 50 kW; WORCESTER, MA; Owner: CARTER BROADCASTING CORPORATION)
Strongest FM radio stations in Abington:
WRPS (88.3 FM; ROCKLAND, MA; Owner: ROCKLAND PUBLIC SCHOOLS)
WBOT (97.7 FM; BROCKTON, MA; Owner: RADIO ONE LICENSES, LLC)
WXKS-FM (107.9 FM; MEDFORD, MA; Owner: AMFM RADIO LICENSES, L.L.C.)
WMJX (106.7 FM; BOSTON, MA; Owner: GREATER BOSTON RADIO, INC.)
WBMX (98.5 FM; BOSTON, MA; Owner: INFINITY RADIO OPERATIONS INC.)
WBOS (92.9 FM; BROOKLINE, MA; Owner: GREATER BOSTON RADIO, INC.)
WJMN (94.5 FM; BOSTON, MA; Owner: AMFM RADIO LICENSES, L.L.C.)
WCRB (102.5 FM; WALTHAM, MA; Owner: CHARLES RIVER BROADCASTING WCRB LICE)
WTKK (96.9 FM; BOSTON, MA; Owner: GREATER BOSTON RADIO, INC.)
WROR-FM (105.7 FM; FRAMINGHAM, MA; Owner: GREATER BOSTON RADIO, INC.)
WGBH (89.7 FM; BOSTON, MA; Owner: WGBH EDUCATIONAL FOUNDATION)
WBUR-FM (90.9 FM; BOSTON, MA; Owner: TRUSTEES OF BOSTON UNIVERSITY)
WBCN (104.1 FM; BOSTON, MA; Owner: HEMISPHERE BROADCASTING CORPORATION)
WZLX (100.7 FM; BOSTON, MA; Owner: INFINITY BROADCASTING CORPORATION OF BOSTON)
WODS (103.3 FM; BOSTON, MA; Owner: INFINITY BROADCASTING OPERATIONS, INC.)
W267AI (101.3 FM; BOSTON, MA; Owner: MCC BROADCASTING COMPANY, INC.)
WERS (88.9 FM; BOSTON, MA; Owner: EMERSON COLLEGE)
WATD-FM (95.9 FM; MARSHFIELD, MA; Owner: MARSHFIELD BROADCASTING CO., INC.)
WHRB (95.3 FM; CAMBRIDGE, MA; Owner: HARVARD RADIO BROADCASTING CO., INC.)
WWBB (101.5 FM; PROVIDENCE, RI; Owner: CLEAR CHANNEL BROADCASTING LICENSES, INC.)
TV broadcast stations around Abington:
WWDP (Channel 46; NORWELL, MA; Owner: NORWELL TELEVISION, LLC)
WCVB-TV (Channel 5; BOSTON, MA; Owner: WCVB HEARST-ARGYLE TV, INC.)
WGBH-TV (Channel 2; BOSTON, MA; Owner: WGBH EDUCATIONAL FOUNDATION)
WHDH-TV (Channel 7; BOSTON, MA; Owner: WHDH-TV)
WMFP (Channel 62; LAWRENCE, MA; Owner: WSAH LICENSE, INC.)
WSBK-TV (Channel 38; BOSTON, MA; Owner: VIACOM INC.)
WLVI-TV (Channel 56; CAMBRIDGE, MA; Owner: WLVI, INC.)
WBZ-TV (Channel 4; BOSTON, MA; Owner: VIACOM INC.)
WGBX-TV (Channel 44; BOSTON, MA; Owner: WGBH EDUCATIONAL FOUNDATION)
WFXT (Channel 25; BOSTON, MA; Owner: FOX TELEVISION STATIONS INC.)
WBPX (Channel 68; BOSTON, MA; Owner: PAXSON BOSTON-68 LICENSE, INC.)
WTMU-LP (Channel 32; BOSTON, MA; Owner: ZGS BOSTON, INC.)
WCEA-LP (Channel 58; BOSTON, MA; Owner: CHANNEL 19 TV CORPORATION)
W40BO (Channel 40; BOSTON, MA; Owner: PAXSON COMMUNICATIONS LPTV, INC.)
WLNE-TV (Channel 6; NEW BEDFORD, MA; Owner: FREEDOM BROADCASTING OF SOUTHERN NEW ENGLAND, INC.)
WPRI-TV (Channel 12; PROVIDENCE, RI; Owner: TVL BROADCASTING OF RHODE ISLAND, LLC)
WNAC-TV (Channel 64; PROVIDENCE, RI; Owner: WNAC, LLC)
WJAR (Channel 10; PROVIDENCE, RI; Owner: OUTLET BROADCASTING, INC.)
WUTF (Channel 66; MARLBOROUGH, MA; Owner: TELEFUTURA BOSTON LLC)
WLWC (Channel 28; NEW BEDFORD, MA; Owner: C-28 FCC LICENSEE SUBSIDIARY, LLC)
WSBE-TV (Channel 36; PROVIDENCE, RI; Owner: RHODE ISLAND PUBLIC TELECOM. AUTHORITY)
WUNI (Channel 27; WORCESTER, MA; Owner: ENTRAVISION HOLDINGS, LLC)
WPXQ (Channel 69; BLOCK ISLAND, RI; Owner: OCEAN STATE TELEVISION, L.L.C.)
National Bridge Inventory (NBI) Statistics 2 Number of bridges7ft / 1.6m Total length $1,125,000 Total costs77,209 Total average daily traffic4,880 Total average daily truck traffic20,373 Total future (year 2032) average daily traffic
FCC Registered Antenna Towers: 13 (
See the full list of FCC Registered Antenna Towers in Abington )
FCC Registered Private Land Mobile Towers: 11 (
See the full list of FCC Registered Private Land Mobile Towers in Abington, MA )
FCC Registered Broadcast Land Mobile Towers: 10 (
See the full list of FCC Registered Broadcast Land Mobile Towers )
FCC Registered Microwave Towers: 11 (
See the full list of FCC Registered Microwave Towers in this town )
FCC Registered Paging Towers: 5 (
See the full list of FCC Registered Paging Towers )
FCC Registered Amateur Radio Licenses: 56 (
See the full list of FCC Registered Amateur Radio Licenses in Abington )
FAA Registered Aircraft: 5
Aircraft: AUTOCOPTER FL-1 (Category: Land, Seats: 2, Weight: Up to 12,499 Pounds, Speed: 86 mph), Engine: MCCULLOCH 4318A&E/0-100 (72 HP) (Reciprocating)N-Number: 10331, N10331, N-10331, Serial Number: 3, Year manufactured: 1960Registrant (Individual): Eric W Tasker, 696 Summer St, Abington, MA 00000Deregistered: Cancel Date: 07/03/2019Aircraft: LAISTER-KAUFFMAN TG-4A (Category: Land, Seats: 2, Weight: Up to 12,499 Pounds, Speed: 60 mph), Engine: NoneN-Number: 58082, N58082, N-58082, Serial Number: 66, Year manufactured: 1942Registrant (Individual): Eric W Tasker, 696 Summer St, Abington, MA 00000Deregistered: Cancel Date: 11/14/2019Aircraft: DJI PHANTOM 3 PROFESSION (Category: Land, Engines: 4), Engine: ElectricN-Number: 674SG, N674SG, N-674SG, Serial Number: P76DCF19017406, Certificate Issue Date: 03/14/2016Registrant (Individual): Christopher J Grazioso, 92 Clapp St, Abington, MA 02351Deregistered: Cancel Date: 09/06/2019Aircraft: MOONEY M20J (Category: Land, Seats: 4, Weight: Up to 12,499 Pounds, Speed: 126 mph), Engine: LYCOMING I0360 SER A&C (200 HP) (Reciprocating)N-Number: 205MA, N205MA, N-205MA, Serial Number: 24-3003, Airworthiness Date: 06/25/1986, Certificate Issue Date: 12/15/1994Registrant (Individual): Paul D Spiro, 102 Strawberry Ln, Abington, MA 02351Aircraft: COSMOS BISON (Category: Land, Seats: 2, Weight: Up to 12,499 Pounds), Engine: ROTAX 503 DCDI (52 HP) (2 Cycle)N-Number: 367RF, N367RF, N-367RF, Serial Number: B21387, Year manufactured: 2001, Airworthiness Date: 05/10/2007, Certificate Issue Date: 03/29/2007Registrant (Individual): Richard Framil, 401 Adams St Apt 3, Abington, MA 02351Deregistered: Cancel Date: 10/19/2017
Home Mortgage Disclosure Act Aggregated Statistics For Year 2009(Based on 3 full tracts) A) FHA, FSA/RHS & VA B) Conventional C) Refinancings D) Home Improvement Loans E) Loans on Dwellings For 5+ Families F) Non-occupant Loans on Number Average Value Number Average Value Number Average Value Number Average Value Number Average Value Number Average Value
LOANS ORIGINATED 78 $250,231 100 $217,450 472 $231,182 29 $94,517 4 $967,500 14 $198,071 APPLICATIONS APPROVED, NOT ACCEPTED 7 $216,714 6 $286,667 27 $220,556 2 $207,500 0 $0 1 $180,000 APPLICATIONS DENIED 11 $260,909 18 $226,500 131 $252,664 8 $94,500 0 $0 3 $140,333 APPLICATIONS WITHDRAWN 7 $294,714 11 $182,727 99 $238,889 4 $121,250 0 $0 3 $274,333 FILES CLOSED FOR INCOMPLETENESS 2 $196,000 4 $194,750 38 $219,000 1 $151,000 0 $0 0 $0
Aggregated Statistics For Year 2008(Based on 3 full tracts) A) FHA, FSA/RHS & VA B) Conventional C) Refinancings D) Home Improvement Loans E) Loans on Dwellings For 5+ Families F) Non-occupant Loans on Number Average Value Number Average Value Number Average Value Number Average Value Number Average Value Number Average Value
LOANS ORIGINATED 33 $273,545 113 $223,814 226 $233,549 38 $88,000 1 $750,000 23 $220,348 APPLICATIONS APPROVED, NOT ACCEPTED 2 $233,000 11 $232,636 29 $258,655 10 $37,700 1 $30,500,000 1 $360,000 APPLICATIONS DENIED 4 $287,000 34 $244,059 119 $234,697 14 $52,786 1 $40,000 5 $273,200 APPLICATIONS WITHDRAWN 4 $293,250 7 $197,714 38 $261,000 2 $110,000 0 $0 4 $182,750 FILES CLOSED FOR INCOMPLETENESS 0 $0 5 $188,400 8 $283,875 0 $0 0 $0 0 $0
Aggregated Statistics For Year 2007(Based on 3 full tracts) A) FHA, FSA/RHS & VA B) Conventional C) Refinancings D) Home Improvement Loans E) Loans on Dwellings For 5+ Families F) Non-occupant Loans on Number Average Value Number Average Value Number Average Value Number Average Value Number Average Value Number Average Value
LOANS ORIGINATED 2 $261,000 203 $220,236 289 $226,678 72 $72,347 7 $537,000 17 $215,353 APPLICATIONS APPROVED, NOT ACCEPTED 0 $0 20 $169,250 59 $247,458 16 $83,000 0 $0 6 $241,500 APPLICATIONS DENIED 0 $0 35 $198,171 176 $457,693 35 $79,343 0 $0 7 $174,000 APPLICATIONS WITHDRAWN 0 $0 25 $232,360 84 $231,202 7 $173,714 0 $0 6 $300,500 FILES CLOSED FOR INCOMPLETENESS 0 $0 4 $303,250 31 $240,323 2 $147,000 0 $0 1 $229,000
Aggregated Statistics For Year 2006(Based on 3 full tracts) A) FHA, FSA/RHS & VA B) Conventional C) Refinancings D) Home Improvement Loans E) Loans on Dwellings For 5+ Families F) Non-occupant Loans on Number Average Value Number Average Value Number Average Value Number Average Value Number Average Value Number Average Value
LOANS ORIGINATED 4 $286,000 236 $214,792 420 $204,200 102 $77,912 5 $770,200 34 $205,647 APPLICATIONS APPROVED, NOT ACCEPTED 0 $0 24 $151,417 38 $241,579 8 $40,250 0 $0 1 $301,000 APPLICATIONS DENIED 2 $311,500 46 $221,000 188 $236,090 39 $38,462 0 $0 11 $157,000 APPLICATIONS WITHDRAWN 1 $358,000 23 $216,522 147 $254,048 4 $26,750 0 $0 6 $224,833 FILES CLOSED FOR INCOMPLETENESS 0 $0 5 $207,800 26 $257,731 1 $30,000 0 $0 2 $237,500
Aggregated Statistics For Year 2005(Based on 3 full tracts) A) FHA, FSA/RHS & VA B) Conventional C) Refinancings D) Home Improvement Loans E) Loans on Dwellings For 5+ Families F) Non-occupant Loans on Number Average Value Number Average Value Number Average Value Number Average Value Number Average Value Number Average Value
LOANS ORIGINATED 3 $303,000 356 $214,407 506 $220,972 78 $124,218 3 $339,000 45 $225,889 APPLICATIONS APPROVED, NOT ACCEPTED 1 $400,000 21 $235,905 46 $214,000 3 $99,667 0 $0 2 $155,500 APPLICATIONS DENIED 0 $0 45 $225,933 147 $458,388 27 $105,778 1 $367,000 5 $136,200 APPLICATIONS WITHDRAWN 0 $0 63 $198,619 183 $248,399 12 $185,583 0 $0 7 $256,429 FILES CLOSED FOR INCOMPLETENESS 0 $0 13 $228,308 48 $241,458 1 $50,000 0 $0 1 $325,000
Aggregated Statistics For Year 2004(Based on 3 full tracts) A) FHA, FSA/RHS & VA B) Conventional C) Refinancings D) Home Improvement Loans E) Loans on Dwellings For 5+ Families F) Non-occupant Loans on G) Loans On Manufactured Number Average Value Number Average Value Number Average Value Number Average Value Number Average Value Number Average Value Number Average Value
LOANS ORIGINATED 10 $258,600 340 $234,026 611 $202,534 82 $105,866 5 $543,600 37 $213,135 1 $130,000 APPLICATIONS APPROVED, NOT ACCEPTED 0 $0 30 $266,700 59 $212,068 16 $60,625 0 $0 8 $167,375 1 $40,000 APPLICATIONS DENIED 4 $277,250 50 $240,460 120 $215,517 39 $57,410 0 $0 9 $122,444 1 $30,000 APPLICATIONS WITHDRAWN 0 $0 25 $201,040 172 $208,401 13 $157,385 0 $0 6 $231,000 0 $0 FILES CLOSED FOR INCOMPLETENESS 0 $0 3 $350,000 51 $232,882 1 $272,000 0 $0 0 $0 0 $0
Aggregated Statistics For Year 2003(Based on 3 full tracts) A) FHA, FSA/RHS & VA B) Conventional C) Refinancings D) Home Improvement Loans E) Loans on Dwellings For 5+ Families F) Non-occupant Loans on Number Average Value Number Average Value Number Average Value Number Average Value Number Average Value Number Average Value
LOANS ORIGINATED 19 $254,947 276 $227,011 1,417 $172,295 27 $75,074 2 $310,000 47 $204,957 APPLICATIONS APPROVED, NOT ACCEPTED 1 $218,000 36 $250,778 146 $170,747 17 $40,118 0 $0 7 $234,429 APPLICATIONS DENIED 4 $255,250 40 $226,000 197 $196,645 28 $61,536 0 $0 12 $195,750 APPLICATIONS WITHDRAWN 1 $266,000 22 $199,727 132 $192,076 13 $37,692 0 $0 10 $202,900 FILES CLOSED FOR INCOMPLETENESS 1 $184,000 2 $251,500 20 $187,900 1 $24,000 0 $0 0 $0
Aggregated Statistics For Year 2002(Based on 3 full tracts) A) FHA, FSA/RHS & VA B) Conventional C) Refinancings D) Home Improvement Loans E) Loans on Dwellings For 5+ Families F) Non-occupant Loans on Number Average Value Number Average Value Number Average Value Number Average Value Number Average Value Number Average Value
LOANS ORIGINATED 11 $220,818 256 $197,238 949 $165,726 40 $41,750 2 $11,704,000 33 $161,212 APPLICATIONS APPROVED, NOT ACCEPTED 0 $0 33 $204,364 90 $151,956 16 $33,312 0 $0 3 $141,667 APPLICATIONS DENIED 3 $204,667 24 $231,958 122 $169,434 18 $49,667 0 $0 6 $156,333 APPLICATIONS WITHDRAWN 0 $0 20 $172,700 111 $145,297 9 $60,444 0 $0 4 $139,750 FILES CLOSED FOR INCOMPLETENESS 0 $0 3 $283,333 28 $182,679 0 $0 0 $0 0 $0
Aggregated Statistics For Year 2001(Based on 3 full tracts) A) FHA, FSA/RHS & VA B) Conventional C) Refinancings D) Home Improvement Loans E) Loans on Dwellings For 5+ Families F) Non-occupant Loans on Number Average Value Number Average Value Number Average Value Number Average Value Number Average Value Number Average Value
LOANS ORIGINATED 29 $188,862 197 $169,391 777 $152,283 55 $36,091 4 $491,750 20 $147,050 APPLICATIONS APPROVED, NOT ACCEPTED 1 $200,000 16 $203,062 69 $129,116 23 $37,043 0 $0 2 $186,500 APPLICATIONS DENIED 6 $238,667 18 $160,389 122 $129,074 19 $29,263 0 $0 10 $108,400 APPLICATIONS WITHDRAWN 3 $195,667 16 $145,625 102 $136,392 7 $30,429 0 $0 2 $220,000 FILES CLOSED FOR INCOMPLETENESS 1 $159,000 2 $174,000 23 $145,957 4 $14,500 0 $0 0 $0
Aggregated Statistics For Year 2000(Based on 3 full tracts) A) FHA, FSA/RHS & VA B) Conventional C) Refinancings D) Home Improvement Loans E) Loans on Dwellings For 5+ Families F) Non-occupant Loans on Number Average Value Number Average Value Number Average Value Number Average Value Number Average Value Number Average Value
LOANS ORIGINATED 32 $157,594 207 $150,812 171 $117,175 54 $21,907 1 $14,000 8 $114,125 APPLICATIONS APPROVED, NOT ACCEPTED 1 $188,000 11 $121,091 31 $84,097 19 $49,000 0 $0 0 $0 APPLICATIONS DENIED 3 $167,333 25 $136,680 85 $89,494 29 $24,138 0 $0 4 $134,000 APPLICATIONS WITHDRAWN 1 $136,000 9 $141,556 59 $94,034 8 $37,625 0 $0 6 $114,667 FILES CLOSED FOR INCOMPLETENESS 0 $0 2 $132,500 23 $133,870 1 $15,000 0 $0 1 $149,000
Aggregated Statistics For Year 1999(Based on 3 full tracts) A) FHA, FSA/RHS & VA B) Conventional C) Refinancings D) Home Improvement Loans E) Loans on Dwellings For 5+ Families F) Non-occupant Loans on Number Average Value Number Average Value Number Average Value Number Average Value Number Average Value Number Average Value
LOANS ORIGINATED 23 $148,770 191 $144,724 300 $110,886 44 $29,989 3 $650,617 11 $94,530 APPLICATIONS APPROVED, NOT ACCEPTED 3 $131,343 7 $129,927 39 $104,067 12 $58,841 0 $0 3 $129,633 APPLICATIONS DENIED 3 $154,753 22 $187,971 84 $111,516 26 $29,742 0 $0 5 $94,684 APPLICATIONS WITHDRAWN 0 $0 22 $144,522 70 $106,389 3 $70,953 0 $0 3 $133,333 FILES CLOSED FOR INCOMPLETENESS 0 $0 4 $161,875 17 $98,283 1 $25,610 0 $0 1 $105,360
Detailed HMDA statistics for the following Tracts:
5201.00
, 5202.01 , 5202.02
Private Mortgage Insurance Companies Aggregated Statistics For Year 2009(Based on 3 full tracts) A) Conventional B) Refinancings Number Average Value Number Average Value
LOANS ORIGINATED 18 $266,833 8 $306,750 APPLICATIONS APPROVED, NOT ACCEPTED 8 $291,000 8 $262,875 APPLICATIONS DENIED 3 $315,667 1 $246,000 APPLICATIONS WITHDRAWN 2 $239,000 1 $351,000 FILES CLOSED FOR INCOMPLETENESS 0 $0 1 $318,000
Aggregated Statistics For Year 2008(Based on 3 full tracts) A) Conventional B) Refinancings Number Average Value Number Average Value
LOANS ORIGINATED 35 $285,600 23 $303,217 APPLICATIONS APPROVED, NOT ACCEPTED 8 $265,625 4 $340,000 APPLICATIONS DENIED 7 $278,143 3 $330,333 APPLICATIONS WITHDRAWN 1 $385,000 1 $304,000 FILES CLOSED FOR INCOMPLETENESS 1 $408,000 0 $0
Aggregated Statistics For Year 2007(Based on 3 full tracts) A) Conventional B) Refinancings C) Non-occupant Loans on Number Average Value Number Average Value Number Average Value
LOANS ORIGINATED 57 $269,228 23 $310,261 1 $352,000 APPLICATIONS APPROVED, NOT ACCEPTED 8 $254,375 8 $367,375 0 $0 APPLICATIONS DENIED 1 $150,000 0 $0 0 $0 APPLICATIONS WITHDRAWN 2 $348,000 3 $290,667 0 $0 FILES CLOSED FOR INCOMPLETENESS 0 $0 0 $0 0 $0
Aggregated Statistics For Year 2006(Based on 3 full tracts) A) Conventional B) Refinancings Number Average Value Number Average Value
LOANS ORIGINATED 19 $277,105 15 $306,067 APPLICATIONS APPROVED, NOT ACCEPTED 9 $362,667 3 $407,333 APPLICATIONS DENIED 1 $270,000 1 $299,000 APPLICATIONS WITHDRAWN 0 $0 1 $399,000 FILES CLOSED FOR INCOMPLETENESS 0 $0 1 $294,000
Aggregated Statistics For Year 2005(Based on 3 full tracts) A) Conventional B) Refinancings C) Non-occupant Loans on Number Average Value Number Average Value Number Average Value
LOANS ORIGINATED 41 $282,561 11 $274,909 1 $201,000 APPLICATIONS APPROVED, NOT ACCEPTED 4 $374,250 3 $355,667 0 $0 APPLICATIONS DENIED 1 $590,000 0 $0 1 $590,000 APPLICATIONS WITHDRAWN 4 $314,250 0 $0 0 $0 FILES CLOSED FOR INCOMPLETENESS 0 $0 0 $0 0 $0
Aggregated Statistics For Year 2004(Based on 3 full tracts) A) Conventional B) Refinancings C) Non-occupant Loans on Number Average Value Number Average Value Number Average Value
LOANS ORIGINATED 42 $288,810 7 $298,571 3 $234,667 APPLICATIONS APPROVED, NOT ACCEPTED 5 $381,200 11 $301,636 1 $185,000 APPLICATIONS DENIED 0 $0 1 $298,000 0 $0 APPLICATIONS WITHDRAWN 1 $226,000 0 $0 0 $0 FILES CLOSED FOR INCOMPLETENESS 1 $229,000 0 $0 0 $0
Aggregated Statistics For Year 2003(Based on 3 full tracts) A) Conventional B) Refinancings C) Non-occupant Loans on Number Average Value Number Average Value Number Average Value
LOANS ORIGINATED 58 $253,845 30 $256,933 2 $200,500 APPLICATIONS APPROVED, NOT ACCEPTED 7 $232,571 10 $273,500 1 $191,000 APPLICATIONS DENIED 2 $312,500 0 $0 1 $351,000 APPLICATIONS WITHDRAWN 4 $241,750 2 $237,500 0 $0 FILES CLOSED FOR INCOMPLETENESS 0 $0 0 $0 0 $0
Aggregated Statistics For Year 2002(Based on 3 full tracts) A) Conventional B) Refinancings C) Non-occupant Loans on Number Average Value Number Average Value Number Average Value
LOANS ORIGINATED 75 $223,747 28 $219,536 2 $172,000 APPLICATIONS APPROVED, NOT ACCEPTED 12 $206,083 4 $200,250 1 $145,000 APPLICATIONS DENIED 1 $195,000 1 $250,000 0 $0 APPLICATIONS WITHDRAWN 6 $206,167 4 $185,500 1 $148,000 FILES CLOSED FOR INCOMPLETENESS 0 $0 0 $0 0 $0
Aggregated Statistics For Year 2001(Based on 3 full tracts) A) Conventional B) Refinancings C) Non-occupant Loans on Number Average Value Number Average Value Number Average Value
LOANS ORIGINATED 63 $191,270 37 $176,568 3 $143,667 APPLICATIONS APPROVED, NOT ACCEPTED 7 $179,429 8 $187,750 1 $147,000 APPLICATIONS DENIED 0 $0 0 $0 0 $0 APPLICATIONS WITHDRAWN 1 $166,000 1 $136,000 0 $0 FILES CLOSED FOR INCOMPLETENESS 0 $0 0 $0 0 $0
Aggregated Statistics For Year 2000(Based on 3 full tracts) A) Conventional B) Refinancings C) Non-occupant Loans on Number Average Value Number Average Value Number Average Value
LOANS ORIGINATED 59 $168,525 11 $160,273 1 $104,000 APPLICATIONS APPROVED, NOT ACCEPTED 7 $140,143 3 $138,667 0 $0 APPLICATIONS DENIED 2 $136,000 1 $185,000 0 $0 APPLICATIONS WITHDRAWN 1 $158,000 1 $274,000 0 $0 FILES CLOSED FOR INCOMPLETENESS 1 $155,000 0 $0 0 $0
Aggregated Statistics For Year 1999(Based on 3 full tracts) A) Conventional B) Refinancings C) Non-occupant Loans on Number Average Value Number Average Value Number Average Value
LOANS ORIGINATED 76 $153,419 22 $133,519 1 $46,650 APPLICATIONS APPROVED, NOT ACCEPTED 5 $158,278 4 $107,395 0 $0 APPLICATIONS DENIED 0 $0 0 $0 0 $0 APPLICATIONS WITHDRAWN 0 $0 1 $137,960 0 $0 FILES CLOSED FOR INCOMPLETENESS 0 $0 1 $109,180 0 $0
Detailed PMIC statistics for the following Tracts:
5201.00
, 5202.01 , 5202.02 Abington compared to Massachusetts state average:
Unemployed percentage significantly below state average. Black race population percentage significantly below state average. Hispanic race population percentage significantly below state average. Foreign-born population percentage below state average. Length of stay since moving in below state average.
Top Patent Applicants
Robert A. Spitz (10)
Stephen Gianelis (7)
Dominique Uhlmann (6)
Richard Kevin Sennett (5)
Jack Robertson (4)
Richard F. Grafton (3)
Thomas Raymond Caferro (3)
Kelly Daniel Bridges (3)
Michael Rufo (2)
Adrian Griego (2)
Total of 82 patent applications in 2008-2024.
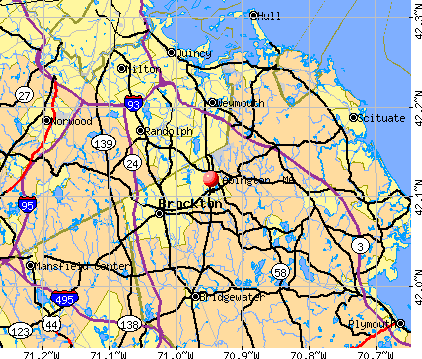


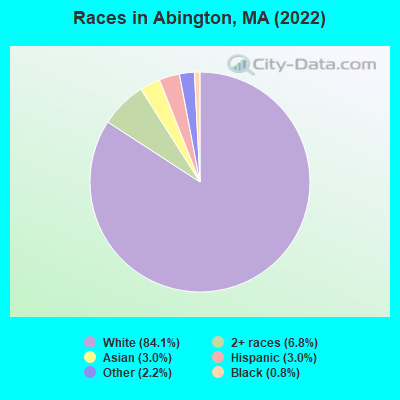
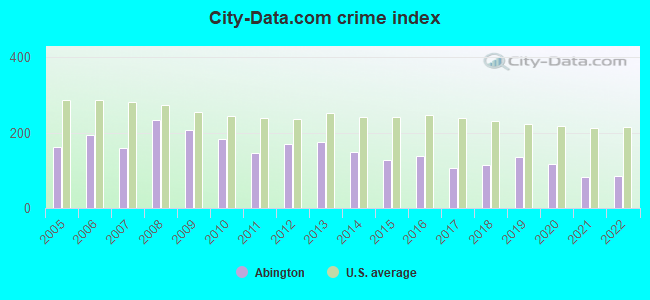
 Recent articles from our blog. Our writers, many of them Ph.D. graduates or candidates, create easy-to-read articles on a wide variety of topics.

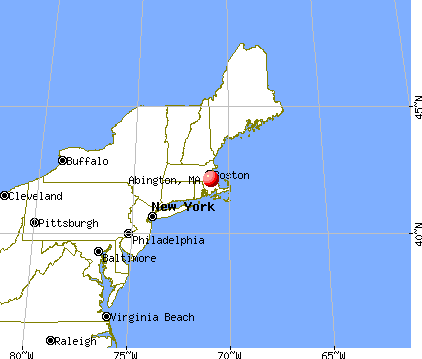
 (4.6 miles
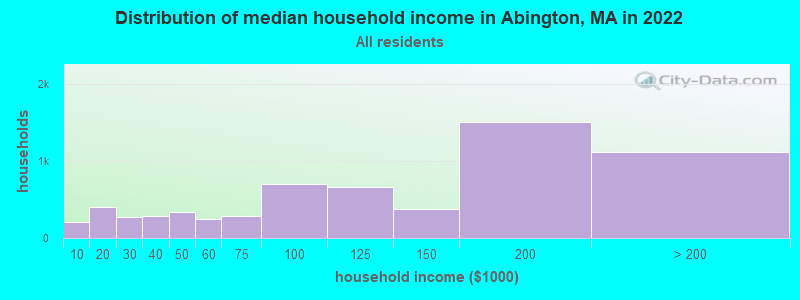
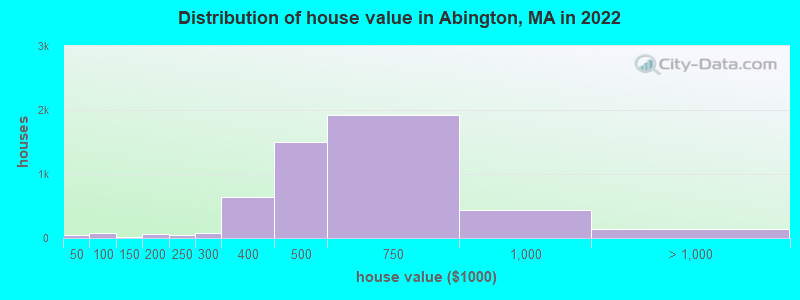
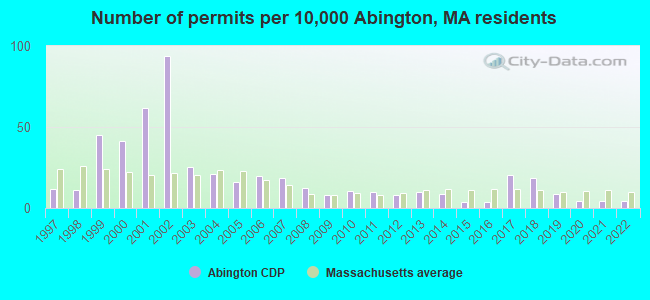
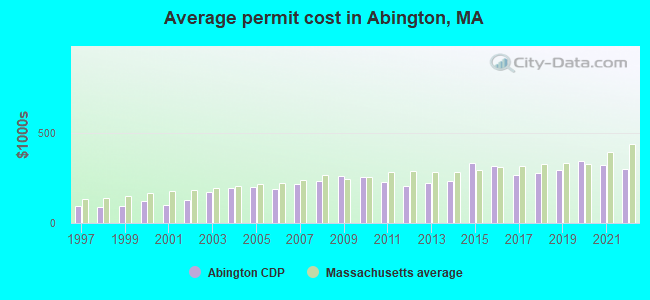
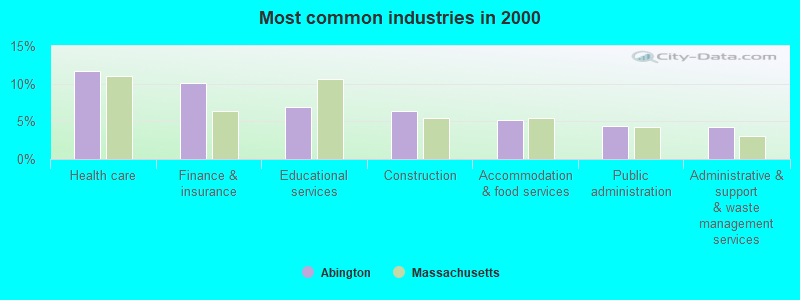
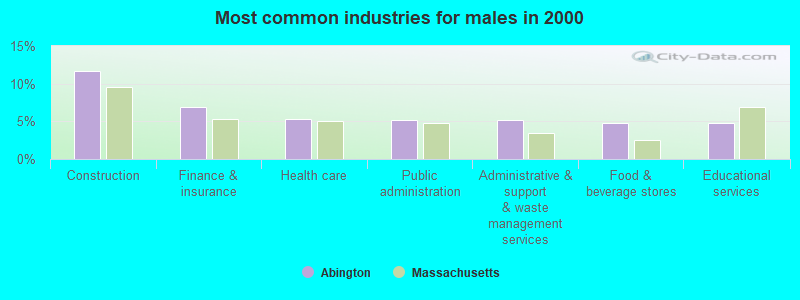
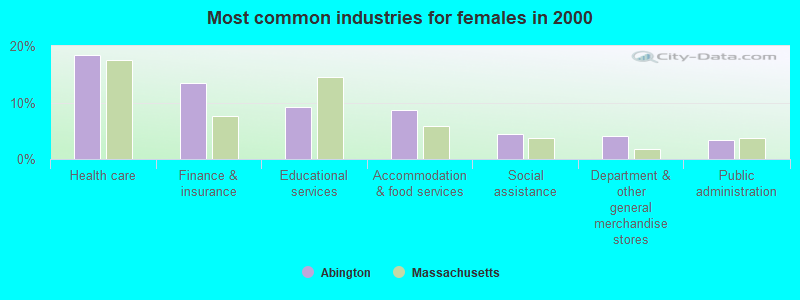
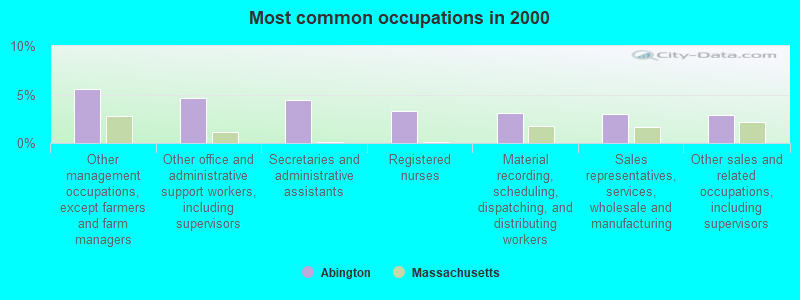
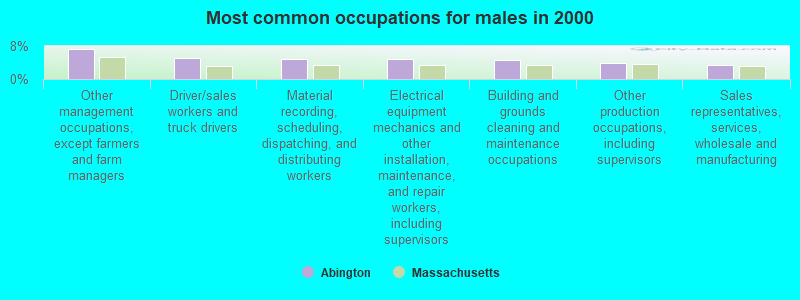
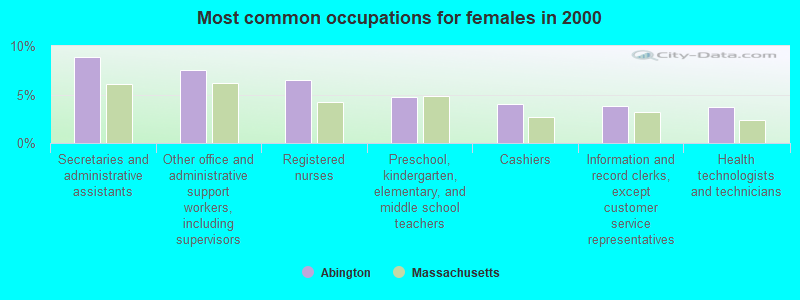

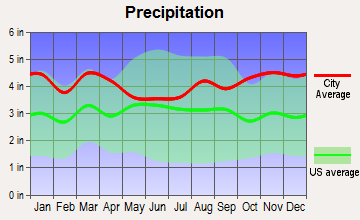
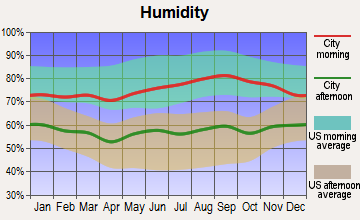

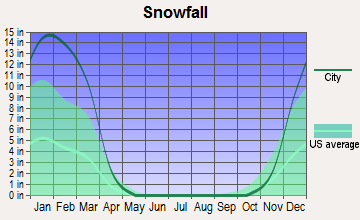
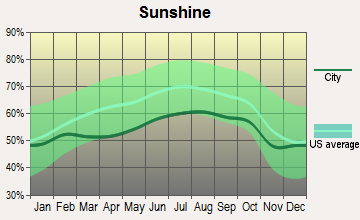
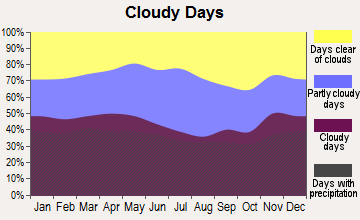
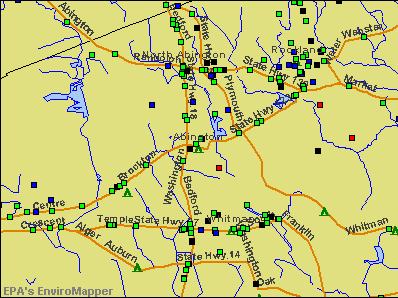

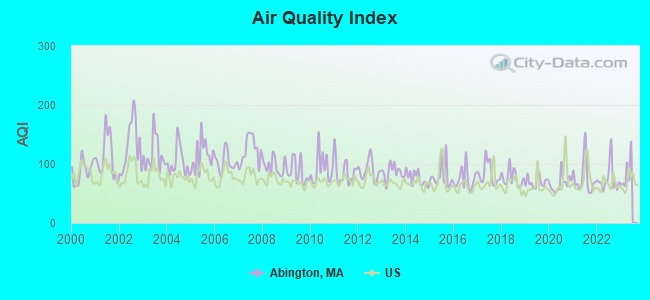
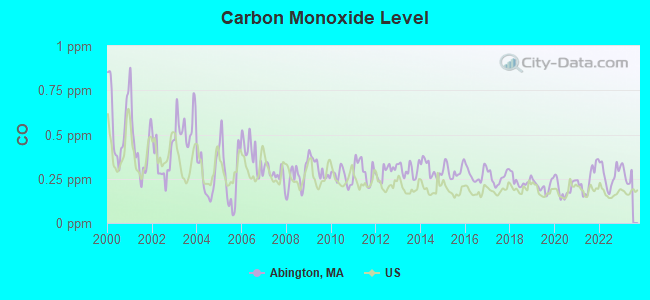
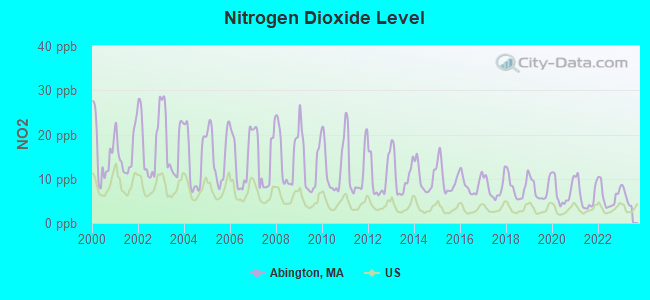
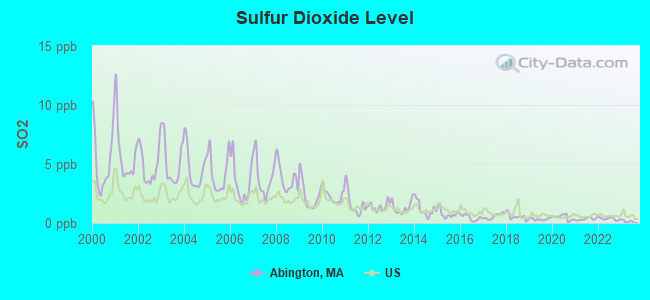
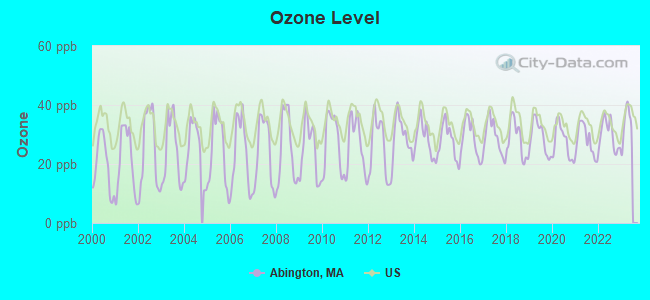
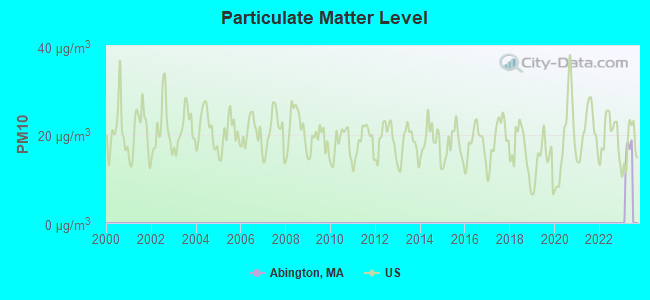
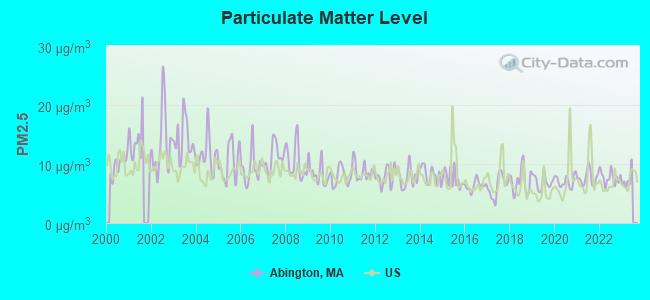
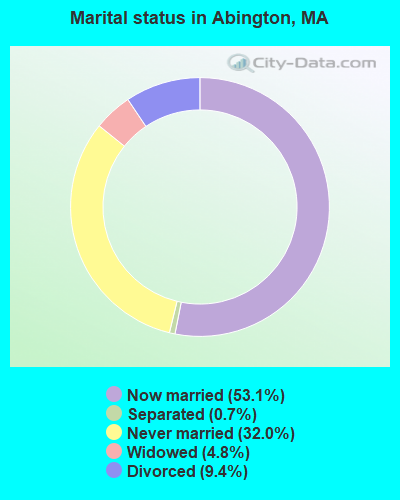
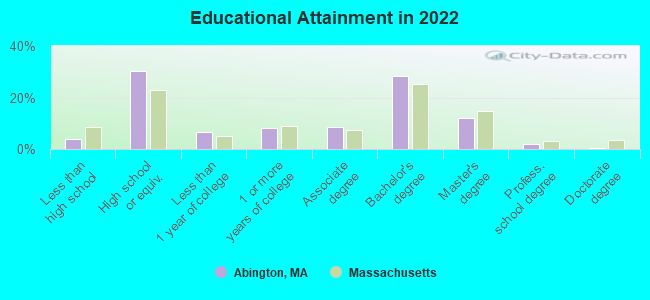
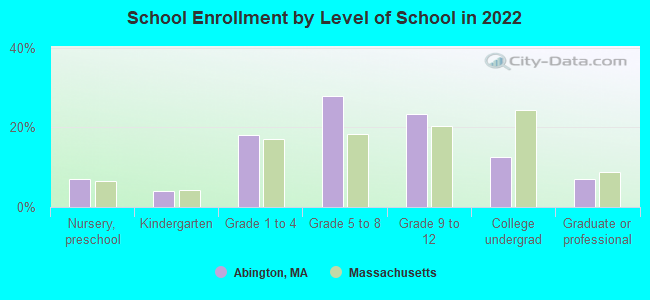
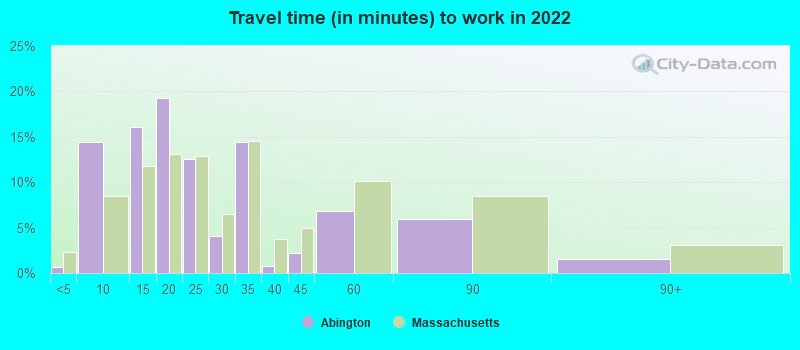

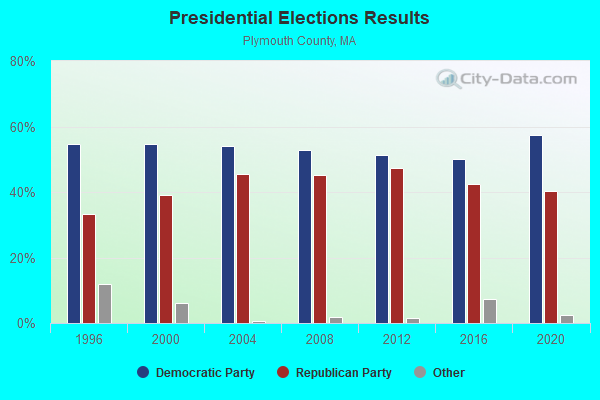
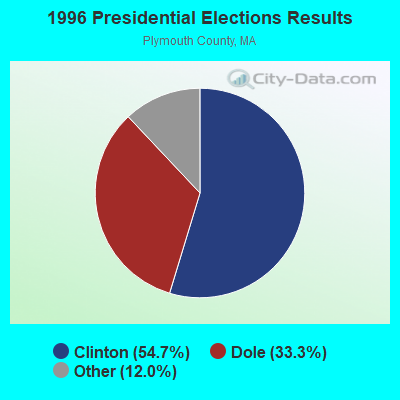
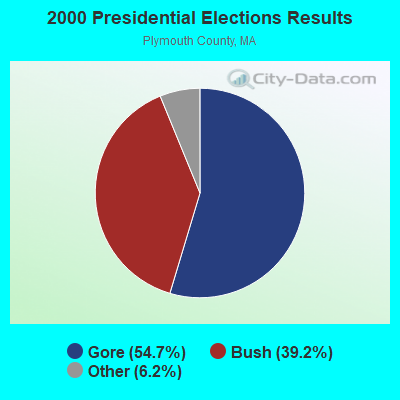
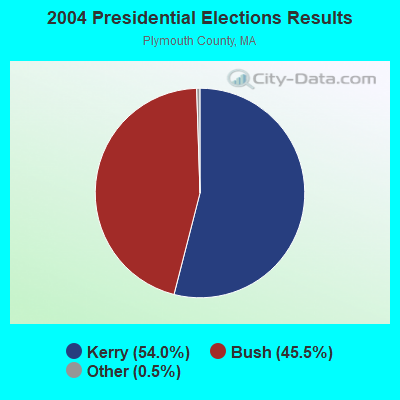
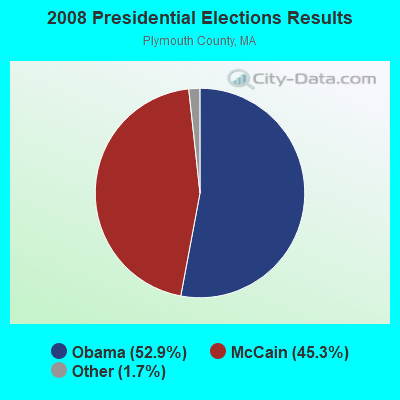

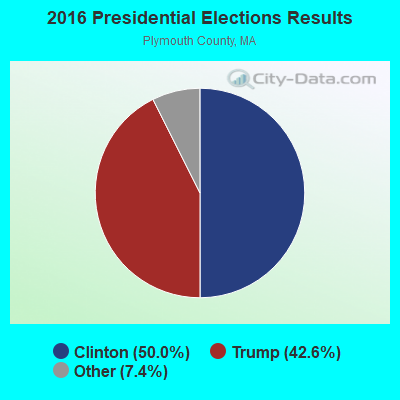
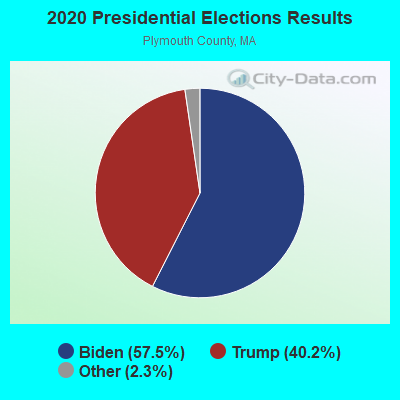
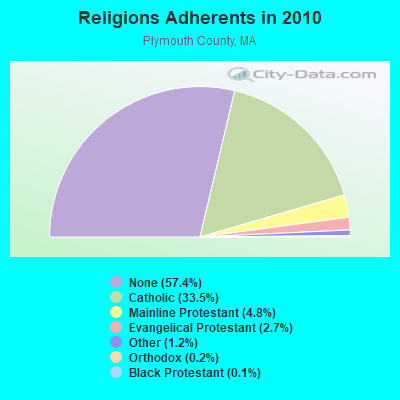
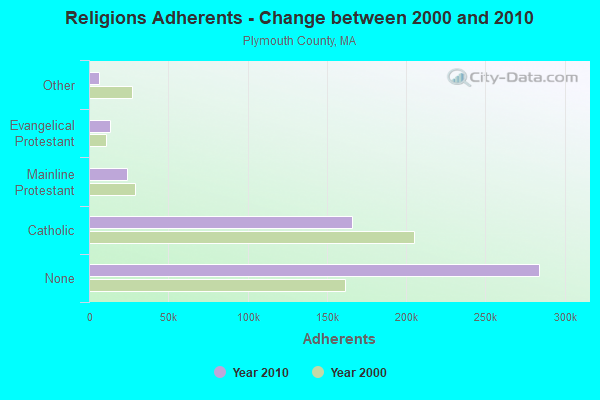
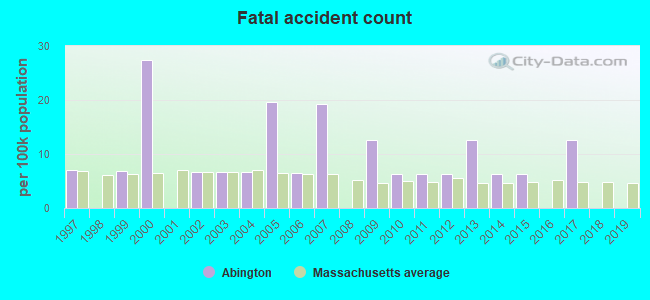
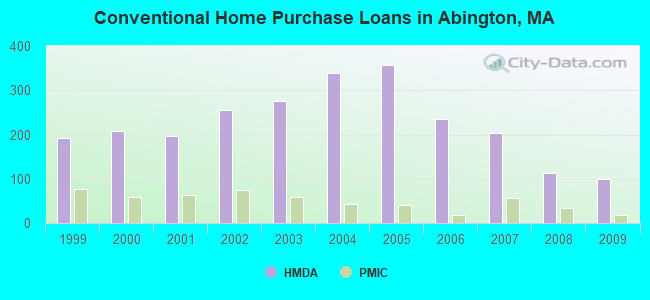
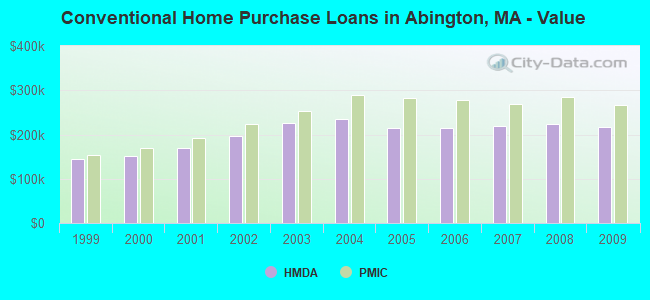
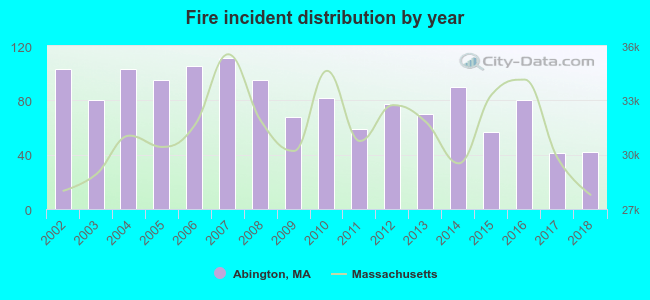 According to the data from the years 2002 - 2018 the average number of fire incidents per year is 80. The highest number of reported fire incidents - 111 took place in 2007, and the least - 41 in 2017. The data has a dropping trend.
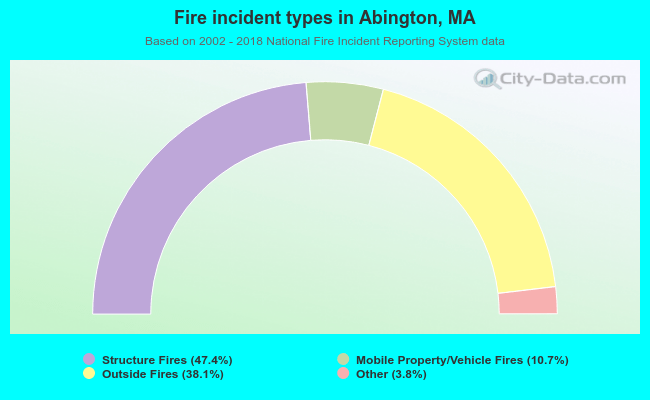 When looking into fire subcategories, the most reports belonged to: Structure Fires (47.4%), and Outside Fires (38.1%).