Addison, Texas Submit your own pictures of this town and show them to the world
OSM Map
General Map
Google Map
MSN Map
OSM Map
General Map
Google Map
MSN Map
OSM Map
General Map
Google Map
MSN Map
OSM Map
General Map
Google Map
MSN Map
Please wait while loading the map...
Population in 2022: 17,310 (100% urban, 0% rural). Population change since 2000: +22.2%Males: 8,691 Females: 8,619
March 2022 cost of living index in Addison: 99.1 (near average, U.S. average is 100) Percentage of residents living in poverty in 2022: 8.4%for White Non-Hispanic residents , 8.4% for Black residents , 13.7% for Hispanic or Latino residents , 26.7% for American Indian residents , 22.6% for other race residents , 8.4% for two or more races residents )
Profiles of local businesses
Business Search - 14 Million verified businesses
Data:
Median household income ($)
Median household income (% change since 2000)
Household income diversity
Ratio of average income to average house value (%)
Ratio of average income to average rent
Median household income ($) - White
Median household income ($) - Black or African American
Median household income ($) - Asian
Median household income ($) - Hispanic or Latino
Median household income ($) - American Indian and Alaska Native
Median household income ($) - Multirace
Median household income ($) - Other Race
Median household income for houses/condos with a mortgage ($)
Median household income for apartments without a mortgage ($)
Races - White alone (%)
Races - White alone (% change since 2000)
Races - Black alone (%)
Races - Black alone (% change since 2000)
Races - American Indian alone (%)
Races - American Indian alone (% change since 2000)
Races - Asian alone (%)
Races - Asian alone (% change since 2000)
Races - Hispanic (%)
Races - Hispanic (% change since 2000)
Races - Native Hawaiian and Other Pacific Islander alone (%)
Races - Native Hawaiian and Other Pacific Islander alone (% change since 2000)
Races - Two or more races (%)
Races - Two or more races (% change since 2000)
Races - Other race alone (%)
Races - Other race alone (% change since 2000)
Racial diversity
Unemployment (%)
Unemployment (% change since 2000)
Unemployment (%) - White
Unemployment (%) - Black or African American
Unemployment (%) - Asian
Unemployment (%) - Hispanic or Latino
Unemployment (%) - American Indian and Alaska Native
Unemployment (%) - Multirace
Unemployment (%) - Other Race
Population density (people per square mile)
Population - Males (%)
Population - Females (%)
Population - Males (%) - White
Population - Males (%) - Black or African American
Population - Males (%) - Asian
Population - Males (%) - Hispanic or Latino
Population - Males (%) - American Indian and Alaska Native
Population - Males (%) - Multirace
Population - Males (%) - Other Race
Population - Females (%) - White
Population - Females (%) - Black or African American
Population - Females (%) - Asian
Population - Females (%) - Hispanic or Latino
Population - Females (%) - American Indian and Alaska Native
Population - Females (%) - Multirace
Population - Females (%) - Other Race
Coronavirus confirmed cases (Jun 16, 2024)
Deaths caused by coronavirus (Jun 16, 2024)
Coronavirus confirmed cases (per 100k population) (Jun 16, 2024)
Deaths caused by coronavirus (per 100k population) (Jun 16, 2024)
Daily increase in number of cases (Jun 16, 2024)
Weekly increase in number of cases (Jun 16, 2024)
Cases doubled (in days) (Jun 16, 2024)
Hospitalized patients (Apr 18, 2022)
Negative test results (Apr 18, 2022)
Total test results (Apr 18, 2022)
COVID Vaccine doses distributed (per 100k population) (Sep 19, 2023)
COVID Vaccine doses administered (per 100k population) (Sep 19, 2023)
COVID Vaccine doses distributed (Sep 19, 2023)
COVID Vaccine doses administered (Sep 19, 2023)
Likely homosexual households (%)
Likely homosexual households (% change since 2000)
Likely homosexual households - Lesbian couples (%)
Likely homosexual households - Lesbian couples (% change since 2000)
Likely homosexual households - Gay men (%)
Likely homosexual households - Gay men (% change since 2000)
Cost of living index
Median gross rent ($)
Median contract rent ($)
Median monthly housing costs ($)
Median house or condo value ($)
Median house or condo value ($ change since 2000)
Mean house or condo value by units in structure - 1, detached ($)
Mean house or condo value by units in structure - 1, attached ($)
Mean house or condo value by units in structure - 2 ($)
Mean house or condo value by units in structure by units in structure - 3 or 4 ($)
Mean house or condo value by units in structure - 5 or more ($)
Mean house or condo value by units in structure - Boat, RV, van, etc. ($)
Mean house or condo value by units in structure - Mobile home ($)
Median house or condo value ($) - White
Median house or condo value ($) - Black or African American
Median house or condo value ($) - Asian
Median house or condo value ($) - Hispanic or Latino
Median house or condo value ($) - American Indian and Alaska Native
Median house or condo value ($) - Multirace
Median house or condo value ($) - Other Race
Median resident age
Resident age diversity
Median resident age - Males
Median resident age - Females
Median resident age - White
Median resident age - Black or African American
Median resident age - Asian
Median resident age - Hispanic or Latino
Median resident age - American Indian and Alaska Native
Median resident age - Multirace
Median resident age - Other Race
Median resident age - Males - White
Median resident age - Males - Black or African American
Median resident age - Males - Asian
Median resident age - Males - Hispanic or Latino
Median resident age - Males - American Indian and Alaska Native
Median resident age - Males - Multirace
Median resident age - Males - Other Race
Median resident age - Females - White
Median resident age - Females - Black or African American
Median resident age - Females - Asian
Median resident age - Females - Hispanic or Latino
Median resident age - Females - American Indian and Alaska Native
Median resident age - Females - Multirace
Median resident age - Females - Other Race
Commute - mean travel time to work (minutes)
Travel time to work - Less than 5 minutes (%)
Travel time to work - Less than 5 minutes (% change since 2000)
Travel time to work - 5 to 9 minutes (%)
Travel time to work - 5 to 9 minutes (% change since 2000)
Travel time to work - 10 to 19 minutes (%)
Travel time to work - 10 to 19 minutes (% change since 2000)
Travel time to work - 20 to 29 minutes (%)
Travel time to work - 20 to 29 minutes (% change since 2000)
Travel time to work - 30 to 39 minutes (%)
Travel time to work - 30 to 39 minutes (% change since 2000)
Travel time to work - 40 to 59 minutes (%)
Travel time to work - 40 to 59 minutes (% change since 2000)
Travel time to work - 60 to 89 minutes (%)
Travel time to work - 60 to 89 minutes (% change since 2000)
Travel time to work - 90 or more minutes (%)
Travel time to work - 90 or more minutes (% change since 2000)
Marital status - Never married (%)
Marital status - Now married (%)
Marital status - Separated (%)
Marital status - Widowed (%)
Marital status - Divorced (%)
Median family income ($)
Median family income (% change since 2000)
Median non-family income ($)
Median non-family income (% change since 2000)
Median per capita income ($)
Median per capita income (% change since 2000)
Median family income ($) - White
Median family income ($) - Black or African American
Median family income ($) - Asian
Median family income ($) - Hispanic or Latino
Median family income ($) - American Indian and Alaska Native
Median family income ($) - Multirace
Median family income ($) - Other Race
Median year house/condo built
Median year apartment built
Year house built - Built 2005 or later (%)
Year house built - Built 2000 to 2004 (%)
Year house built - Built 1990 to 1999 (%)
Year house built - Built 1980 to 1989 (%)
Year house built - Built 1970 to 1979 (%)
Year house built - Built 1960 to 1969 (%)
Year house built - Built 1950 to 1959 (%)
Year house built - Built 1940 to 1949 (%)
Year house built - Built 1939 or earlier (%)
Average household size
Household density (households per square mile)
Average household size - White
Average household size - Black or African American
Average household size - Asian
Average household size - Hispanic or Latino
Average household size - American Indian and Alaska Native
Average household size - Multirace
Average household size - Other Race
Occupied housing units (%)
Vacant housing units (%)
Owner occupied housing units (%)
Renter occupied housing units (%)
Vacancy status - For rent (%)
Vacancy status - For sale only (%)
Vacancy status - Rented or sold, not occupied (%)
Vacancy status - For seasonal, recreational, or occasional use (%)
Vacancy status - For migrant workers (%)
Vacancy status - Other vacant (%)
Residents with income below the poverty level (%)
Residents with income below 50% of the poverty level (%)
Children below poverty level (%)
Poor families by family type - Married-couple family (%)
Poor families by family type - Male, no wife present (%)
Poor families by family type - Female, no husband present (%)
Poverty status for native-born residents (%)
Poverty status for foreign-born residents (%)
Poverty among high school graduates not in families (%)
Poverty among people who did not graduate high school not in families (%)
Residents with income below the poverty level (%) - White
Residents with income below the poverty level (%) - Black or African American
Residents with income below the poverty level (%) - Asian
Residents with income below the poverty level (%) - Hispanic or Latino
Residents with income below the poverty level (%) - American Indian and Alaska Native
Residents with income below the poverty level (%) - Multirace
Residents with income below the poverty level (%) - Other Race
Air pollution - Air Quality Index (AQI)
Air pollution - CO
Air pollution - NO2
Air pollution - SO2
Air pollution - Ozone
Air pollution - PM10
Air pollution - PM25
Air pollution - Pb
Crime - Murders per 100,000 population
Crime - Rapes per 100,000 population
Crime - Robberies per 100,000 population
Crime - Assaults per 100,000 population
Crime - Burglaries per 100,000 population
Crime - Thefts per 100,000 population
Crime - Auto thefts per 100,000 population
Crime - Arson per 100,000 population
Crime - City-data.com crime index
Crime - Violent crime index
Crime - Property crime index
Crime - Murders per 100,000 population (5 year average)
Crime - Rapes per 100,000 population (5 year average)
Crime - Robberies per 100,000 population (5 year average)
Crime - Assaults per 100,000 population (5 year average)
Crime - Burglaries per 100,000 population (5 year average)
Crime - Thefts per 100,000 population (5 year average)
Crime - Auto thefts per 100,000 population (5 year average)
Crime - Arson per 100,000 population (5 year average)
Crime - City-data.com crime index (5 year average)
Crime - Violent crime index (5 year average)
Crime - Property crime index (5 year average)
1996 Presidential Elections Results (%) - Democratic Party (Clinton)
1996 Presidential Elections Results (%) - Republican Party (Dole)
1996 Presidential Elections Results (%) - Other
2000 Presidential Elections Results (%) - Democratic Party (Gore)
2000 Presidential Elections Results (%) - Republican Party (Bush)
2000 Presidential Elections Results (%) - Other
2004 Presidential Elections Results (%) - Democratic Party (Kerry)
2004 Presidential Elections Results (%) - Republican Party (Bush)
2004 Presidential Elections Results (%) - Other
2008 Presidential Elections Results (%) - Democratic Party (Obama)
2008 Presidential Elections Results (%) - Republican Party (McCain)
2008 Presidential Elections Results (%) - Other
2012 Presidential Elections Results (%) - Democratic Party (Obama)
2012 Presidential Elections Results (%) - Republican Party (Romney)
2012 Presidential Elections Results (%) - Other
2016 Presidential Elections Results (%) - Democratic Party (Clinton)
2016 Presidential Elections Results (%) - Republican Party (Trump)
2016 Presidential Elections Results (%) - Other
2020 Presidential Elections Results (%) - Democratic Party (Biden)
2020 Presidential Elections Results (%) - Republican Party (Trump)
2020 Presidential Elections Results (%) - Other
Ancestries Reported - Arab (%)
Ancestries Reported - Czech (%)
Ancestries Reported - Danish (%)
Ancestries Reported - Dutch (%)
Ancestries Reported - English (%)
Ancestries Reported - French (%)
Ancestries Reported - French Canadian (%)
Ancestries Reported - German (%)
Ancestries Reported - Greek (%)
Ancestries Reported - Hungarian (%)
Ancestries Reported - Irish (%)
Ancestries Reported - Italian (%)
Ancestries Reported - Lithuanian (%)
Ancestries Reported - Norwegian (%)
Ancestries Reported - Polish (%)
Ancestries Reported - Portuguese (%)
Ancestries Reported - Russian (%)
Ancestries Reported - Scotch-Irish (%)
Ancestries Reported - Scottish (%)
Ancestries Reported - Slovak (%)
Ancestries Reported - Subsaharan African (%)
Ancestries Reported - Swedish (%)
Ancestries Reported - Swiss (%)
Ancestries Reported - Ukrainian (%)
Ancestries Reported - United States (%)
Ancestries Reported - Welsh (%)
Ancestries Reported - West Indian (%)
Ancestries Reported - Other (%)
Educational Attainment - No schooling completed (%)
Educational Attainment - Less than high school (%)
Educational Attainment - High school or equivalent (%)
Educational Attainment - Less than 1 year of college (%)
Educational Attainment - 1 or more years of college (%)
Educational Attainment - Associate degree (%)
Educational Attainment - Bachelor's degree (%)
Educational Attainment - Master's degree (%)
Educational Attainment - Professional school degree (%)
Educational Attainment - Doctorate degree (%)
School Enrollment - Nursery, preschool (%)
School Enrollment - Kindergarten (%)
School Enrollment - Grade 1 to 4 (%)
School Enrollment - Grade 5 to 8 (%)
School Enrollment - Grade 9 to 12 (%)
School Enrollment - College undergrad (%)
School Enrollment - Graduate or professional (%)
School Enrollment - Not enrolled in school (%)
School enrollment - Public schools (%)
School enrollment - Private schools (%)
School enrollment - Not enrolled (%)
Median number of rooms in houses and condos
Median number of rooms in apartments
Housing units lacking complete plumbing facilities (%)
Housing units lacking complete kitchen facilities (%)
Density of houses
Urban houses (%)
Rural houses (%)
Households with people 60 years and over (%)
Households with people 65 years and over (%)
Households with people 75 years and over (%)
Households with one or more nonrelatives (%)
Households with no nonrelatives (%)
Population in households (%)
Family households (%)
Nonfamily households (%)
Population in families (%)
Family households with own children (%)
Median number of bedrooms in owner occupied houses
Mean number of bedrooms in owner occupied houses
Median number of bedrooms in renter occupied houses
Mean number of bedrooms in renter occupied houses
Median number of vehichles in owner occupied houses
Mean number of vehichles in owner occupied houses
Median number of vehichles in renter occupied houses
Mean number of vehichles in renter occupied houses
Mortgage status - with mortgage (%)
Mortgage status - with second mortgage (%)
Mortgage status - with home equity loan (%)
Mortgage status - with both second mortgage and home equity loan (%)
Mortgage status - without a mortgage (%)
Average family size
Average family size - White
Average family size - Black or African American
Average family size - Asian
Average family size - Hispanic or Latino
Average family size - American Indian and Alaska Native
Average family size - Multirace
Average family size - Other Race
Geographical mobility - Same house 1 year ago (%)
Geographical mobility - Moved within same county (%)
Geographical mobility - Moved from different county within same state (%)
Geographical mobility - Moved from different state (%)
Geographical mobility - Moved from abroad (%)
Place of birth - Born in state of residence (%)
Place of birth - Born in other state (%)
Place of birth - Native, outside of US (%)
Place of birth - Foreign born (%)
Housing units in structures - 1, detached (%)
Housing units in structures - 1, attached (%)
Housing units in structures - 2 (%)
Housing units in structures - 3 or 4 (%)
Housing units in structures - 5 to 9 (%)
Housing units in structures - 10 to 19 (%)
Housing units in structures - 20 to 49 (%)
Housing units in structures - 50 or more (%)
Housing units in structures - Mobile home (%)
Housing units in structures - Boat, RV, van, etc. (%)
House/condo owner moved in on average (years ago)
Renter moved in on average (years ago)
Year householder moved into unit - Moved in 1999 to March 2000 (%)
Year householder moved into unit - Moved in 1995 to 1998 (%)
Year householder moved into unit - Moved in 1990 to 1994 (%)
Year householder moved into unit - Moved in 1980 to 1989 (%)
Year householder moved into unit - Moved in 1970 to 1979 (%)
Year householder moved into unit - Moved in 1969 or earlier (%)
Means of transportation to work - Drove car alone (%)
Means of transportation to work - Carpooled (%)
Means of transportation to work - Public transportation (%)
Means of transportation to work - Bus or trolley bus (%)
Means of transportation to work - Streetcar or trolley car (%)
Means of transportation to work - Subway or elevated (%)
Means of transportation to work - Railroad (%)
Means of transportation to work - Ferryboat (%)
Means of transportation to work - Taxicab (%)
Means of transportation to work - Motorcycle (%)
Means of transportation to work - Bicycle (%)
Means of transportation to work - Walked (%)
Means of transportation to work - Other means (%)
Working at home (%)
Industry diversity
Most Common Industries - Agriculture, forestry, fishing and hunting, and mining (%)
Most Common Industries - Agriculture, forestry, fishing and hunting (%)
Most Common Industries - Mining, quarrying, and oil and gas extraction (%)
Most Common Industries - Construction (%)
Most Common Industries - Manufacturing (%)
Most Common Industries - Wholesale trade (%)
Most Common Industries - Retail trade (%)
Most Common Industries - Transportation and warehousing, and utilities (%)
Most Common Industries - Transportation and warehousing (%)
Most Common Industries - Utilities (%)
Most Common Industries - Information (%)
Most Common Industries - Finance and insurance, and real estate and rental and leasing (%)
Most Common Industries - Finance and insurance (%)
Most Common Industries - Real estate and rental and leasing (%)
Most Common Industries - Professional, scientific, and management, and administrative and waste management services (%)
Most Common Industries - Professional, scientific, and technical services (%)
Most Common Industries - Management of companies and enterprises (%)
Most Common Industries - Administrative and support and waste management services (%)
Most Common Industries - Educational services, and health care and social assistance (%)
Most Common Industries - Educational services (%)
Most Common Industries - Health care and social assistance (%)
Most Common Industries - Arts, entertainment, and recreation, and accommodation and food services (%)
Most Common Industries - Arts, entertainment, and recreation (%)
Most Common Industries - Accommodation and food services (%)
Most Common Industries - Other services, except public administration (%)
Most Common Industries - Public administration (%)
Occupation diversity
Most Common Occupations - Management, business, science, and arts occupations (%)
Most Common Occupations - Management, business, and financial occupations (%)
Most Common Occupations - Management occupations (%)
Most Common Occupations - Business and financial operations occupations (%)
Most Common Occupations - Computer, engineering, and science occupations (%)
Most Common Occupations - Computer and mathematical occupations (%)
Most Common Occupations - Architecture and engineering occupations (%)
Most Common Occupations - Life, physical, and social science occupations (%)
Most Common Occupations - Education, legal, community service, arts, and media occupations (%)
Most Common Occupations - Community and social service occupations (%)
Most Common Occupations - Legal occupations (%)
Most Common Occupations - Education, training, and library occupations (%)
Most Common Occupations - Arts, design, entertainment, sports, and media occupations (%)
Most Common Occupations - Healthcare practitioners and technical occupations (%)
Most Common Occupations - Health diagnosing and treating practitioners and other technical occupations (%)
Most Common Occupations - Health technologists and technicians (%)
Most Common Occupations - Service occupations (%)
Most Common Occupations - Healthcare support occupations (%)
Most Common Occupations - Protective service occupations (%)
Most Common Occupations - Fire fighting and prevention, and other protective service workers including supervisors (%)
Most Common Occupations - Law enforcement workers including supervisors (%)
Most Common Occupations - Food preparation and serving related occupations (%)
Most Common Occupations - Building and grounds cleaning and maintenance occupations (%)
Most Common Occupations - Personal care and service occupations (%)
Most Common Occupations - Sales and office occupations (%)
Most Common Occupations - Sales and related occupations (%)
Most Common Occupations - Office and administrative support occupations (%)
Most Common Occupations - Natural resources, construction, and maintenance occupations (%)
Most Common Occupations - Farming, fishing, and forestry occupations (%)
Most Common Occupations - Construction and extraction occupations (%)
Most Common Occupations - Installation, maintenance, and repair occupations (%)
Most Common Occupations - Production, transportation, and material moving occupations (%)
Most Common Occupations - Production occupations (%)
Most Common Occupations - Transportation occupations (%)
Most Common Occupations - Material moving occupations (%)
People in Group quarters - Institutionalized population (%)
People in Group quarters - Correctional institutions (%)
People in Group quarters - Federal prisons and detention centers (%)
People in Group quarters - Halfway houses (%)
People in Group quarters - Local jails and other confinement facilities (including police lockups) (%)
People in Group quarters - Military disciplinary barracks (%)
People in Group quarters - State prisons (%)
People in Group quarters - Other types of correctional institutions (%)
People in Group quarters - Nursing homes (%)
People in Group quarters - Hospitals/wards, hospices, and schools for the handicapped (%)
People in Group quarters - Hospitals/wards and hospices for chronically ill (%)
People in Group quarters - Hospices or homes for chronically ill (%)
People in Group quarters - Military hospitals or wards for chronically ill (%)
People in Group quarters - Other hospitals or wards for chronically ill (%)
People in Group quarters - Hospitals or wards for drug/alcohol abuse (%)
People in Group quarters - Mental (Psychiatric) hospitals or wards (%)
People in Group quarters - Schools, hospitals, or wards for the mentally retarded (%)
People in Group quarters - Schools, hospitals, or wards for the physically handicapped (%)
People in Group quarters - Institutions for the deaf (%)
People in Group quarters - Institutions for the blind (%)
People in Group quarters - Orthopedic wards and institutions for the physically handicapped (%)
People in Group quarters - Wards in general hospitals for patients who have no usual home elsewhere (%)
People in Group quarters - Wards in military hospitals for patients who have no usual home elsewhere (%)
People in Group quarters - Juvenile institutions (%)
People in Group quarters - Long-term care (%)
People in Group quarters - Homes for abused, dependent, and neglected children (%)
People in Group quarters - Residential treatment centers for emotionally disturbed children (%)
People in Group quarters - Training schools for juvenile delinquents (%)
People in Group quarters - Short-term care, detention or diagnostic centers for delinquent children (%)
People in Group quarters - Type of juvenile institution unknown (%)
People in Group quarters - Noninstitutionalized population (%)
People in Group quarters - College dormitories (includes college quarters off campus) (%)
People in Group quarters - Military quarters (%)
People in Group quarters - On base (%)
People in Group quarters - Barracks, unaccompanied personnel housing (UPH), (Enlisted/Officer), ;and similar group living quarters for military personnel (%)
People in Group quarters - Transient quarters for temporary residents (%)
People in Group quarters - Military ships (%)
People in Group quarters - Group homes (%)
People in Group quarters - Homes or halfway houses for drug/alcohol abuse (%)
People in Group quarters - Homes for the mentally ill (%)
People in Group quarters - Homes for the mentally retarded (%)
People in Group quarters - Homes for the physically handicapped (%)
People in Group quarters - Other group homes (%)
People in Group quarters - Religious group quarters (%)
People in Group quarters - Dormitories (%)
People in Group quarters - Agriculture workers' dormitories on farms (%)
People in Group quarters - Job Corps and vocational training facilities (%)
People in Group quarters - Other workers' dormitories (%)
People in Group quarters - Crews of maritime vessels (%)
People in Group quarters - Other nonhousehold living situations (%)
People in Group quarters - Other noninstitutional group quarters (%)
Residents speaking English at home (%)
Residents speaking English at home - Born in the United States (%)
Residents speaking English at home - Native, born elsewhere (%)
Residents speaking English at home - Foreign born (%)
Residents speaking Spanish at home (%)
Residents speaking Spanish at home - Born in the United States (%)
Residents speaking Spanish at home - Native, born elsewhere (%)
Residents speaking Spanish at home - Foreign born (%)
Residents speaking other language at home (%)
Residents speaking other language at home - Born in the United States (%)
Residents speaking other language at home - Native, born elsewhere (%)
Residents speaking other language at home - Foreign born (%)
Class of Workers - Employee of private company (%)
Class of Workers - Self-employed in own incorporated business (%)
Class of Workers - Private not-for-profit wage and salary workers (%)
Class of Workers - Local government workers (%)
Class of Workers - State government workers (%)
Class of Workers - Federal government workers (%)
Class of Workers - Self-employed workers in own not incorporated business and Unpaid family workers (%)
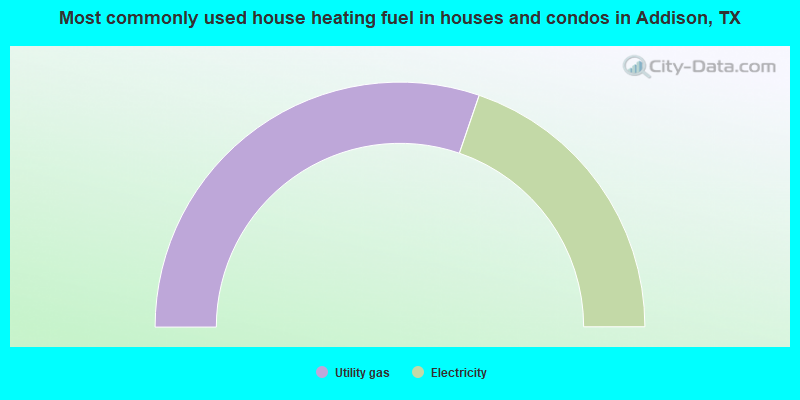
House heating fuel used in houses and condos - Utility gas (%)
House heating fuel used in houses and condos - Bottled, tank, or LP gas (%)
House heating fuel used in houses and condos - Electricity (%)
House heating fuel used in houses and condos - Fuel oil, kerosene, etc. (%)
House heating fuel used in houses and condos - Coal or coke (%)
House heating fuel used in houses and condos - Wood (%)
House heating fuel used in houses and condos - Solar energy (%)
House heating fuel used in houses and condos - Other fuel (%)
House heating fuel used in houses and condos - No fuel used (%)
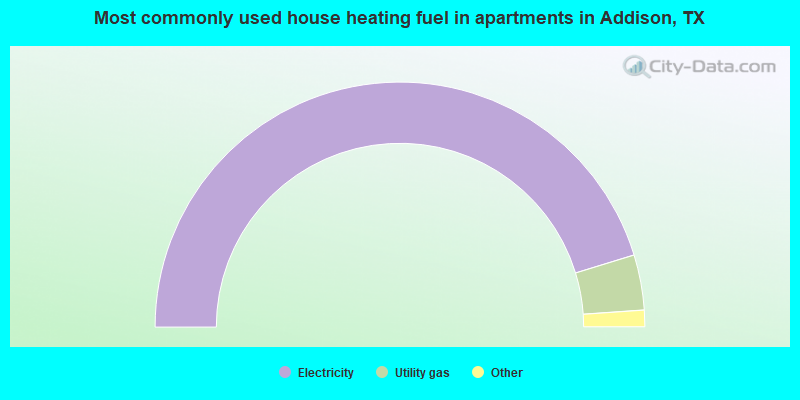
House heating fuel used in apartments - Utility gas (%)
House heating fuel used in apartments - Bottled, tank, or LP gas (%)
House heating fuel used in apartments - Electricity (%)
House heating fuel used in apartments - Fuel oil, kerosene, etc. (%)
House heating fuel used in apartments - Coal or coke (%)
House heating fuel used in apartments - Wood (%)
House heating fuel used in apartments - Solar energy (%)
House heating fuel used in apartments - Other fuel (%)
House heating fuel used in apartments - No fuel used (%)
Armed forces status - In Armed Forces (%)
Armed forces status - Civilian (%)
Armed forces status - Civilian - Veteran (%)
Armed forces status - Civilian - Nonveteran (%)
Fatal accidents locations in years 2005-2021
Fatal accidents locations in 2005
Fatal accidents locations in 2006
Fatal accidents locations in 2007
Fatal accidents locations in 2008
Fatal accidents locations in 2009
Fatal accidents locations in 2010
Fatal accidents locations in 2011
Fatal accidents locations in 2012
Fatal accidents locations in 2013
Fatal accidents locations in 2014
Fatal accidents locations in 2015
Fatal accidents locations in 2016
Fatal accidents locations in 2017
Fatal accidents locations in 2018
Fatal accidents locations in 2019
Fatal accidents locations in 2020
Fatal accidents locations in 2021
Alcohol use - People drinking some alcohol every month (%)
Alcohol use - People not drinking at all (%)
Alcohol use - Average days/month drinking alcohol
Alcohol use - Average drinks/week
Alcohol use - Average days/year people drink much
Audiometry - Average condition of hearing (%)
Audiometry - People that can hear a whisper from across a quiet room (%)
Audiometry - People that can hear normal voice from across a quiet room (%)
Audiometry - Ears ringing, roaring, buzzing (%)
Audiometry - Had a job exposure to loud noise (%)
Audiometry - Had off-work exposure to loud noise (%)
Blood Pressure & Cholesterol - Has high blood pressure (%)
Blood Pressure & Cholesterol - Checking blood pressure at home (%)
Blood Pressure & Cholesterol - Frequently checking blood cholesterol (%)
Blood Pressure & Cholesterol - Has high cholesterol level (%)
Consumer Behavior - Money monthly spent on food at supermarket/grocery store
Consumer Behavior - Money monthly spent on food at other stores
Consumer Behavior - Money monthly spent on eating out
Consumer Behavior - Money monthly spent on carryout/delivered foods
Consumer Behavior - Income spent on food at supermarket/grocery store (%)
Consumer Behavior - Income spent on food at other stores (%)
Consumer Behavior - Income spent on eating out (%)
Consumer Behavior - Income spent on carryout/delivered foods (%)
Current Health Status - General health condition (%)
Current Health Status - Blood donors (%)
Current Health Status - Has blood ever tested for HIV virus (%)
Current Health Status - Left-handed people (%)
Dermatology - People using sunscreen (%)
Diabetes - Diabetics (%)
Diabetes - Had a blood test for high blood sugar (%)
Diabetes - People taking insulin (%)
Diet Behavior & Nutrition - Diet health (%)
Diet Behavior & Nutrition - Milk product consumption (# of products/month)
Diet Behavior & Nutrition - Meals not home prepared (#/week)
Diet Behavior & Nutrition - Meals from fast food or pizza place (#/week)
Diet Behavior & Nutrition - Ready-to-eat foods (#/month)
Diet Behavior & Nutrition - Frozen meals/pizza (#/month)
Drug Use - People that ever used marijuana or hashish (%)
Drug Use - Ever used hard drugs (%)
Drug Use - Ever used any form of cocaine (%)
Drug Use - Ever used heroin (%)
Drug Use - Ever used methamphetamine (%)
Health Insurance - People covered by health insurance (%)
Kidney Conditions-Urology - Avg. # of times urinating at night
Medical Conditions - People with asthma (%)
Medical Conditions - People with anemia (%)
Medical Conditions - People with psoriasis (%)
Medical Conditions - People with overweight (%)
Medical Conditions - Elderly people having difficulties in thinking or remembering (%)
Medical Conditions - People who ever received blood transfusion (%)
Medical Conditions - People having trouble seeing even with glass/contacts (%)
Medical Conditions - People with arthritis (%)
Medical Conditions - People with gout (%)
Medical Conditions - People with congestive heart failure (%)
Medical Conditions - People with coronary heart disease (%)
Medical Conditions - People with angina pectoris (%)
Medical Conditions - People who ever had heart attack (%)
Medical Conditions - People who ever had stroke (%)
Medical Conditions - People with emphysema (%)
Medical Conditions - People with thyroid problem (%)
Medical Conditions - People with chronic bronchitis (%)
Medical Conditions - People with any liver condition (%)
Medical Conditions - People who ever had cancer or malignancy (%)
Mental Health - People who have little interest in doing things (%)
Mental Health - People feeling down, depressed, or hopeless (%)
Mental Health - People who have trouble sleeping or sleeping too much (%)
Mental Health - People feeling tired or having little energy (%)
Mental Health - People with poor appetite or overeating (%)
Mental Health - People feeling bad about themself (%)
Mental Health - People who have trouble concentrating on things (%)
Mental Health - People moving or speaking slowly or too fast (%)
Mental Health - People having thoughts they would be better off dead (%)
Oral Health - Average years since last visit a dentist
Oral Health - People embarrassed because of mouth (%)
Oral Health - People with gum disease (%)
Oral Health - General health of teeth and gums (%)
Oral Health - Average days a week using dental floss/device
Oral Health - Average days a week using mouthwash for dental problem
Oral Health - Average number of teeth
Pesticide Use - Households using pesticides to control insects (%)
Pesticide Use - Households using pesticides to kill weeds (%)
Physical Activity - People doing vigorous-intensity work activities (%)
Physical Activity - People doing moderate-intensity work activities (%)
Physical Activity - People walking or bicycling (%)
Physical Activity - People doing vigorous-intensity recreational activities (%)
Physical Activity - People doing moderate-intensity recreational activities (%)
Physical Activity - Average hours a day doing sedentary activities
Physical Activity - Average hours a day watching TV or videos
Physical Activity - Average hours a day using computer
Physical Functioning - People having limitations keeping them from working (%)
Physical Functioning - People limited in amount of work they can do (%)
Physical Functioning - People that need special equipment to walk (%)
Physical Functioning - People experiencing confusion/memory problems (%)
Physical Functioning - People requiring special healthcare equipment (%)
Prescription Medications - Average number of prescription medicines taking
Preventive Aspirin Use - Adults 40+ taking low-dose aspirin (%)
Reproductive Health - Vaginal deliveries (%)
Reproductive Health - Cesarean deliveries (%)
Reproductive Health - Deliveries resulted in a live birth (%)
Reproductive Health - Pregnancies resulted in a delivery (%)
Reproductive Health - Women breastfeeding newborns (%)
Reproductive Health - Women that had a hysterectomy (%)
Reproductive Health - Women that had both ovaries removed (%)
Reproductive Health - Women that have ever taken birth control pills (%)
Reproductive Health - Women taking birth control pills (%)
Reproductive Health - Women that have ever used Depo-Provera or injectables (%)
Reproductive Health - Women that have ever used female hormones (%)
Sexual Behavior - People 18+ that ever had sex (vaginal, anal, or oral) (%)
Sexual Behavior - Males 18+ that ever had vaginal sex with a woman (%)
Sexual Behavior - Males 18+ that ever performed oral sex on a woman (%)
Sexual Behavior - Males 18+ that ever had anal sex with a woman (%)
Sexual Behavior - Males 18+ that ever had any sex with a man (%)
Sexual Behavior - Females 18+ that ever had vaginal sex with a man (%)
Sexual Behavior - Females 18+ that ever performed oral sex on a man (%)
Sexual Behavior - Females 18+ that ever had anal sex with a man (%)
Sexual Behavior - Females 18+ that ever had any kind of sex with a woman (%)
Sexual Behavior - Average age people first had sex
Sexual Behavior - Average number of female sex partners in lifetime (males 18+)
Sexual Behavior - Average number of female vaginal sex partners in lifetime (males 18+)
Sexual Behavior - Average age people first performed oral sex on a woman (18+)
Sexual Behavior - Average number of woman performed oral sex on in lifetime (18+)
Sexual Behavior - Average number of male sex partners in lifetime (males 18+)
Sexual Behavior - Average number of male anal sex partners in lifetime (males 18+)
Sexual Behavior - Average age people first performed oral sex on a man (18+)
Sexual Behavior - Average number of male oral sex partners in lifetime (18+)
Sexual Behavior - People using protection when performing oral sex (%)
Sexual Behavior - Average number of times people have vaginal or anal sex a year
Sexual Behavior - People having sex without condom (%)
Sexual Behavior - Average number of male sex partners in lifetime (females 18+)
Sexual Behavior - Average number of male vaginal sex partners in lifetime (females 18+)
Sexual Behavior - Average number of female sex partners in lifetime (females 18+)
Sexual Behavior - Circumcised males 18+ (%)
Sleep Disorders - Average hours sleeping at night
Sleep Disorders - People that has trouble sleeping (%)
Smoking-Cigarette Use - People smoking cigarettes (%)
Taste & Smell - People 40+ having problems with smell (%)
Taste & Smell - People 40+ having problems with taste (%)
Taste & Smell - People 40+ that ever had wisdom teeth removed (%)
Taste & Smell - People 40+ that ever had tonsils teeth removed (%)
Taste & Smell - People 40+ that ever had a loss of consciousness because of a head injury (%)
Taste & Smell - People 40+ that ever had a broken nose or other serious injury to face or skull (%)
Taste & Smell - People 40+ that ever had two or more sinus infections (%)
Weight - Average height (inches)
Weight - Average weight (pounds)
Weight - Average BMI
Weight - People that are obese (%)
Weight - People that ever were obese (%)
Weight - People trying to lose weight (%)
According to our research of Texas and other state lists, there were 2 registered sex offenders living in Addison, Texas as of June 16, 2024 . The ratio of all residents to sex offenders in Addison is 7,871 to 1.The ratio of registered sex offenders to all residents in this city is much lower than the state average.
Officers per 1,000 residents here:
3.99Texas average:
2.07
Latest news from Addison, TX collected exclusively by city-data.com from local newspapers, TV, and radio stations
Ancestries: German (4.4%), English (4.2%), American (4.0%), European (4.0%), Irish (3.6%), Italian (3.1%).
Current Local Time:
Land area: 4.43 square miles.
Population density: 3,910 people per square mile (average).
4,105 residents are foreign born (12.2% Latin America , 5.8% Asia , 2.7% Europe ).
This town:
24.1%Texas:
17.1%
Median real estate property taxes paid for housing units with mortgages in 2022: $8,134 (1.6%)Median real estate property taxes paid for housing units with no mortgage in 2022: $6,566 (1.3%)
Nearest city with pop. 50,000+: Carrollton, TX
Nearest city with pop. 200,000+: Plano, TX
Nearest city with pop. 1,000,000+: Dallas, TX
Nearest cities:
Latitude: 32.96 N, Longitude: 96.84 W
Daytime population change due to commuting: +26,347 (+154.9%)Workers who live and work in this town: 3,571 (29.6%)
Property values in Addison, TX
Addison tourist attractions:
Single-family new house construction building permits:
2022: 22 buildings , average cost: $294,3002021: 31 buildings , average cost: $286,5002020: 8 buildings , average cost: $315,4002018: 1 building , cost: $236,4002017: 1 building , cost: $1,520,0002014: 9 buildings , average cost: $263,9002013: 1 building , cost: $700,0002012: 1 building , cost: $600,0002011: 14 buildings , average cost: $217,1002010: 2 buildings , average cost: $1,240,0002009: 19 buildings , average cost: $173,3002008: 17 buildings , average cost: $330,3002007: 19 buildings , average cost: $450,0002006: 28 buildings , average cost: $233,5002005: 50 buildings , average cost: $145,4002004: 2 buildings , average cost: $844,5002002: 2 buildings , average cost: $329,0002001: 3 buildings , average cost: $264,8002000: 3 buildings , average cost: $289,0001999: 13 buildings , average cost: $214,1001998: 48 buildings , average cost: $132,0001997: 34 buildings , average cost: $147,300Unemployment in December 2023: Population change in the 1990s: +5,347 (+60.6%).
Most common occupations in Addison, TX (%)
Both Males Females
Computer specialists (7.0%)
Other sales and related occupations, including supervisors (5.7%)
Sales representatives, services, wholesale and manufacturing (5.5%)
Other management occupations, except farmers and farm managers (5.1%)
Retail sales workers, except cashiers (4.3%)
Customer service representatives (3.7%)
Building and grounds cleaning and maintenance occupations (3.3%)
Computer specialists (10.0%)
Other sales and related occupations, including supervisors (7.2%)
Sales representatives, services, wholesale and manufacturing (6.5%)
Other management occupations, except farmers and farm managers (6.4%)
Top executives (4.2%)
Retail sales workers, except cashiers (4.2%)
Advertising, marketing, promotions, public relations, and sales managers (3.3%)
Secretaries and administrative assistants (5.8%)
Customer service representatives (5.3%)
Other office and administrative support workers, including supervisors (5.0%)
Retail sales workers, except cashiers (4.5%)
Building and grounds cleaning and maintenance occupations (4.4%)
Sales representatives, services, wholesale and manufacturing (4.4%)
Other sales and related occupations, including supervisors (4.0%)
Tornado activity:
Addison-area historical tornado activity is above Texas state average. It is 155% greater than the overall U.S. average.
On 4/25/1994, a category F4 (max. wind speeds 207-260 mph) tornado 22.1 miles away from the Addison town center killed 3 people and injured 48 people and caused between $50,000,000 and $500,000,000 in damages.
On 5/26/1976, a category F3 (max. wind speeds 158-206 mph) tornado 4.1 miles away from the town center injured one person and caused between $500,000 and $5,000,000 in damages.
Earthquake activity:
Addison-area historical earthquake activity is significantly above Texas state average. It is 487% greater than the overall U.S. average. On 11/6/2011 at 03:53:10, a magnitude 5.7 (5.7 MW, Depth: 3.2 mi, Class: Moderate, Intensity: VI - VII) earthquake occurred 178.1 miles away from the city center On 9/3/2016 at 12:02:44, a magnitude 5.8 (5.8 MW, Depth: 3.5 mi) earthquake occurred 239.9 miles away from Addison center On 6/16/1978 at 11:46:54, a magnitude 5.3 (4.4 MB, 4.6 UK, 5.3 ML) earthquake occurred 228.1 miles away from the city center On 5/17/2012 at 08:12:00, a magnitude 4.8 (4.8 MW, Depth: 3.1 mi, Class: Light, Intensity: IV - V) earthquake occurred 160.7 miles away from the city center On 11/7/2016 at 01:44:24, a magnitude 5.0 (5.0 MW, Depth: 2.8 mi) earthquake occurred 209.8 miles away from Addison center On 11/8/2011 at 02:46:57, a magnitude 4.8 (4.8 MW, Depth: 3.1 mi) earthquake occurred 178.0 miles away from the city center Magnitude types: body-wave magnitude (MB), local magnitude (ML), moment magnitude (MW) Natural disasters: The number of natural disasters in Dallas County (21) is greater than the US average (15).Major Disasters (Presidential) Declared: 9Emergencies Declared: 10Hurricanes: 7, Storms: 7, Floods: 5, Tornadoes: 5, Fires: 4, Winds: 2, Flash Flood: 1, Winter Storm: 1, Other: 2 (Note: some incidents may be assigned to more than one category). Main business address for: AFFIRMATIVE INSURANCE HOLDINGS INC FIRE, MARINE & CASUALTY INSURANCE ), CONCENTRA OPERATING CORP SERVICES-SPECIALTY OUTPATIENT FACILITIES, NEC ), DRESSER INC MEASURING & CONTROLLING DEVICES, NEC ).
Hospitals and medical centers in Addison: METHODIST HOSPITAL FOR SURGERY (Proprietary, 17101 DALLAS PARKWAY) TOTAL CONCEPT HOSPICE (14665 MIDWAY ROAD SUITE 157) CARELINK AT HOME (14295 MIDWAY ROAD SUITE 400)
ESSENCE HOMEHEALTH (14677 MIDWAY RD STE 120)
HOME MEDICAL CARE INC (3939 BELT LINE ROAD SUITE 355)
Airports located in Addison: Addison Airport (ADS) Runways: , Commercial Ops: 178, Air Taxi Ops: 6,989, Itinerant Ops: 3,465, Local Ops: 85,583, Military Ops: 261)Amtrak station near Addison: 13 miles: DALLAS (400 S. HOUSTON ST.) Services: ticket office, fully wheelchair accessible, enclosed waiting area, public restrooms, public payphones, vending machines, paid short-term parking, paid long-term parking, call for car rental service, taxi stand, public transit connection.
Colleges/universities with over 2000 students nearest to Addison:
Brookhaven College (about 3 miles; Farmers Branch, TX ; Full-time enrollment: 6,868)
The University of Texas at Dallas (about 6 miles; Richardson, TX ; FT enrollment: 16,777)
Richland College (about 7 miles; Dallas, TX ; FT enrollment: 11,617)
Southern Methodist University (about 9 miles; Dallas, TX ; FT enrollment: 9,150)
University of Dallas (about 10 miles; Irving, TX ; FT enrollment: 2,192)
North Lake College (about 10 miles; Irving, TX ; FT enrollment: 6,191)
DeVry University-Texas (about 11 miles; Irving, TX ; FT enrollment: 4,098)
Private high school in Addison: GREENHILL SCHOOL Students: 1,267, Location: 4141 SPRING VALLEY RD, Grades: PK-12)Public elementary/middle school in Addison:
See full list of schools located in Addison
Notable locations in Addison: (A) , Farmers Branch Fire Department Station 2 (B) , Addison Fire Department Station 2 (C) . Display/hide their locations on the map
Shopping Centers: (1) , Olla Podrida Shopping Center (2) , Prestonwood Shopping Center (3) . Display/hide their locations on the map
Main business address in Addison include: (A) , CONCENTRA OPERATING CORP (B) . Display/hide their locations on the map
Churches in Addison include: (A) , Addison Church (B) . Display/hide their locations on the map
Parks in Addison include: (1) , Inwood Soccer Center (2) , Alfred J Loos Stadium and Sports Complex (3) , Tom Landry Stadium (4) , Hornet Field (5) , Greenhill School Baseball Field (6) , Celestial Park (7) . Display/hide their locations on the map
Tourist attractions:
Hotels:
Birthplace of: Jermaine Smith - College basketball player (Alabama State Hornets), Matt Williams - College basketball player (SMU Mustangs).
Dallas County has a predicted average indoor radon screening level less than 2 pCi/L (pico curies per liter) - Low Potential Average household size: This town:
1.8 peopleTexas:
2.8 people
Percentage of family households: This town:
36.1%Whole state:
69.9%
Percentage of households with unmarried partners: This town:
8.1%Whole state:
6.0%
Likely homosexual households (counted as self-reported same-sex unmarried-partner households)
Lesbian couples: 0.4% of all households Gay men: 0.6% of all households
Banks with most branches in Addison (2011 data):
Wells Fargo Bank, National Association: Beltline & Marsh Branch, Beltline Branch, Spectrum Center Branch. Info updated 2011/04/05: Bank assets: $1,161,490.0 mil, Deposits: $905,653.0 mil, headquarters in Sioux Falls, SD, positive income , 6395 total offices , Holding Company: Wells Fargo & Company
Amegy Bank National Association: Addison Branch at 4650 Belt Line Rd., branch established on 2001/05/14. Info updated 2007/09/24: Bank assets: $12,197.6 mil, Deposits: $9,733.2 mil, headquarters in Houston, TX, positive income , Commercial Lending Specialization, 97 total offices , Holding Company: Zions Bancorporation
The Frost National Bank: Addison Branch at 15301 North Dallas Prkwy, #100, branch established on 2001/04/23. Info updated 2006/12/21: Bank assets: $20,372.1 mil, Deposits: $16,846.8 mil, headquarters in San Antonio, TX, positive income , Commercial Lending Specialization, 133 total offices , Holding Company: Cullen/Frost Bankers, Inc.
Compass Bank: Farmers In-Store Branch at 14280 Marsh Lane, branch established on 2009/08/22. Info updated 2011/02/24: Bank assets: $63,107.0 mil, Deposits: $46,232.4 mil, headquarters in Birmingham, AL, negative income in the last year , Commercial Lending Specialization, 720 total offices , Holding Company: Banco Bilbao Vizcaya Argentaria, S.A.
Woodforest National Bank: Beltline Kroger Branch at 3770 Belt Line Road, branch established on 2003/05/14. Info updated 2011/05/10: Bank assets: $3,488.9 mil, Deposits: $3,097.6 mil, headquarters in Houston, TX, positive income , Commercial Lending Specialization, 766 total offices , Holding Company: Woodforest Financial Group Employee Stock Ownership Plan (With 401(K) Provisions)
Texas Capital Bank, National Association: Midway Branch at 14131 Midway Road, Suite 100, branch established on 1999/01/15. Info updated 2010/06/09: Bank assets: $8,133.1 mil, Deposits: $5,577.4 mil, headquarters in Dallas, TX, positive income , Commercial Lending Specialization, 13 total offices , Holding Company: Texas Capital Bancshares, Inc.
JPMorgan Chase Bank, National Association: Brookhaven Branch at 14250 Marsh Lane, branch established on 1994/04/04. Info updated 2011/11/10: Bank assets: $1,811,678.0 mil, Deposits: $1,190,738.0 mil, headquarters in Columbus, OH, positive income , International Specialization, 5577 total offices , Holding Company: Jpmorgan Chase & Co.
ViewPoint Bank, National Association: Addison Branch at 4560 Belt Line Road Suite 100, branch established on 2006/01/01. Info updated 2012/01/06: Bank assets: $3,179.7 mil, Deposits: $2,050.8 mil, headquarters in Plano, TX, positive income , Mortgage Lending Specialization, 24 total offices , Holding Company: Viewpoint Financial Group, Inc.
Capital One, National Association: Addison Branch at 3790 Beltline Road, branch established on 2006/11/08. Info updated 2011/07/01: Bank assets: $133,477.8 mil, Deposits: $97,063.7 mil, headquarters in Mclean, VA, positive income , 984 total offices , Holding Company: Capital One Financial Corporation
2 other banks with 2 local branches
For population 15 years and over in Addison:
Never married: 46.9%Now married: 35.0%Separated: 1.4%Widowed: 2.7%Divorced: 14.1% For population 25 years and over in Addison:
High school or higher: 95.3%Bachelor's degree or higher: 58.1%Graduate or professional degree: 20.5%Unemployed: 4.3%Mean travel time to work (commute): 18.7 minutes
Education Gini index (Inequality in education) Here:
8.9Texas average:
14.0
Religion statistics for Addison, TX (based on Dallas County data)
Religion Adherents Congregations Evangelical Protestant 615,849 1,672 Catholic 446,996 57 Mainline Protestant 166,224 240 Other 147,445 174 Black Protestant 69,831 174 Orthodox 8,813 19 None 912,981 -
Source: Clifford Grammich, Kirk Hadaway, Richard Houseal, Dale E.Jones, Alexei Krindatch, Richie Stanley and Richard H.Taylor. 2012. 2010 U.S.Religion Census: Religious Congregations & Membership Study. Association of Statisticians of American Religious Bodies. Jones, Dale E., et al. 2002. Congregations and Membership in the United States 2000. Nashville, TN: Glenmary Research Center. Graphs represent county-level data
Food Environment Statistics: Number of grocery stores : 392Dallas County :
1.64 / 10,000 pop.Texas :
1.47 / 10,000 pop.
Number of supercenters and club stores : 25This county :
0.10 / 10,000 pop.State :
0.14 / 10,000 pop.
Number of convenience stores (no gas) : 275Dallas County :
1.15 / 10,000 pop.Texas :
1.11 / 10,000 pop.
Number of convenience stores (with gas) : 673Dallas County :
2.82 / 10,000 pop.State :
3.95 / 10,000 pop.
Number of full-service restaurants : 1,603Here :
6.73 / 10,000 pop.State :
6.13 / 10,000 pop.
Adult diabetes rate : This county :
8.8%Texas :
8.9%
Adult obesity rate : Dallas County :
27.1%Texas :
26.6%
Low-income preschool obesity rate : This county :
17.0%State :
15.7%
Health and Nutrition: Healthy diet rate : This city:
51.2%State:
48.6%
Average overall health of teeth and gums : People feeling badly about themselves : People not drinking alcohol at all : Average hours sleeping at night : General health condition : This city:
61.4%State:
56.2%
Average condition of hearing : More about Health and Nutrition of Addison, TX Residents
Local government employment and payroll (March 2022)
Function
Full-time employees
Monthly full-time payroll
Average yearly full-time wage
Part-time employees
Monthly part-time payroll
Police Protection - Officers
60 $504,019 $100,804 0 $0 Firefighters
54 $465,593 $103,465 0 $0 Parks and Recreation
30 $142,301 $56,920 8 $15,068 Financial Administration
23 $191,384 $99,853 0 $0 Other Government Administration
19 $95,229 $60,145 14 $2,159 Streets and Highways
17 $86,872 $61,321 0 $0 Airports
14 $103,500 $88,714 0 $0 Sewerage
11 $53,851 $58,747 0 $0 Other and Unallocable
11 $69,353 $75,658 0 $0 Police - Other
9 $41,233 $54,977 0 $0 Housing and Community Development (Local)
9 $65,168 $86,891 0 $0 Health
6 $32,135 $64,270 0 $0 Water Supply
6 $36,971 $73,942 0 $0 Judicial and Legal
4 $23,128 $69,384 1 $1,612 Fire - Other
3 $21,428 $85,712 0 $0
Totals for Government
276 $1,932,165 $84,007 23 $18,839
Addison government finances - Expenditure in 2021 (per resident):
Construction - General - Other: $3,041,000 ($175.68)
Water Utilities: $84,000 ($4.85)Parks and Recreation: $62,000 ($3.58)Sewerage: $49,000 ($2.83)Protective Inspection and Regulation - Other: $19,000 ($1.10)General Public Buildings: $15,000 ($0.87)Police Protection: $6,000 ($0.35)Current Operations - General - Other: $12,895,000 ($744.95)
Water Utilities: $11,303,000 ($652.98)Police Protection: $10,031,000 ($579.49)Local Fire Protection: $8,101,000 ($468.00)Parks and Recreation: $5,204,000 ($300.64)Air Transportation: $4,735,000 ($273.54)Financial Administration: $1,797,000 ($103.81)Central Staff Services: $1,744,000 ($100.75)Regular Highways: $1,736,000 ($100.29)Protective Inspection and Regulation - Other: $1,450,000 ($83.77)Housing and Community Development: $1,369,000 ($79.09)General Public Buildings: $992,000 ($57.31)Sewerage: $815,000 ($47.08)Judicial and Legal Services: $618,000 ($35.70)General - Interest on Debt: $3,336,000 ($192.72)
Intergovernmental to Local - Other - General - Other: $461,000 ($26.63)
Other Capital Outlay - Police Protection: $642,000 ($37.09)
Local Fire Protection: $392,000 ($22.65)Water Utilities: $332,000 ($19.18)Air Transportation: $217,000 ($12.54)Parks and Recreation: $142,000 ($8.20)General - Other: $94,000 ($5.43)Regular Highways: $64,000 ($3.70)General Public Building: $36,000 ($2.08)Protective Inspection and Regulation - Other: $33,000 ($1.91)Financial Administration: $30,000 ($1.73)Judicial and Legal Services: $29,000 ($1.68)Housing and Community Development: $17,000 ($0.98)Central Staff Services: $14,000 ($0.81)Total Salaries and Wages: $28,471,000 ($1644.77)
Water Utilities - Interest on Debt: $573,000 ($33.10)
Addison government finances - Revenue in 2021 (per resident):
Charges - Sewerage: $7,701,000 ($444.89)
Other: $4,005,000 ($231.37)Air Transportation: $971,000 ($56.09)Miscellaneous Commercial Activities: $564,000 ($32.58)Parks and Recreation: $35,000 ($2.02)Federal Intergovernmental - Air Transportation: $1,381,000 ($79.78)
General Local Government Support: $446,000 ($25.77)Local Intergovernmental - Other: $16,000 ($0.92)
Miscellaneous - Rents: $4,692,000 ($271.06)
Interest Earnings: $1,868,000 ($107.91)Fines and Forfeits: $272,000 ($15.71)Revenue - Water Utilities: $7,518,000 ($434.32)
Electric Utilities: $1,460,000 ($84.34)Gas Utilities: $205,000 ($11.84)State Intergovernmental - General Local Government Support: $889,000 ($51.36)
Other: $50,000 ($2.89)Tax - Property: $26,877,000 ($1552.69)
General Sales and Gross Receipts: $17,544,000 ($1013.52)Occupation and Business License - Other: $1,185,000 ($68.46)
Addison government finances - Debt in 2021 (per resident):
Long Term Debt - Outstanding Unspecified Public Purpose: $118,065,000 ($6820.62)
Beginning Outstanding - Unspecified Public Purpose: $92,305,000 ($5332.47)Issue, Unspecified Public Purpose: $43,740,000 ($2526.86)Retired Unspecified Public Purpose: $17,980,000 ($1038.71)
Addison government finances - Cash and Securities in 2021 (per resident):
Bond Funds - Cash and Securities: $20,444,000 ($1181.05)
7.50% of this county's 2021 resident taxpayers lived in other counties in 2020 ($78,710 average adjusted gross income )
Here:
7.50%Texas average:
8.12%
0.01% of residents moved from foreign countries ($115 average AGI )Dallas County:
0.01%Texas average:
0.04%
Top counties from which taxpayers relocated into this county between 2020 and 2021:
8.56% of this county's 2020 resident taxpayers moved to other counties in 2021 ($74,660 average adjusted gross income )
Here:
8.56%Texas average:
7.40%
0.02% of residents moved to foreign countries ($227 average AGI )Dallas County:
0.02%Texas average:
0.03%
Top counties to which taxpayers relocated from this county between 2020 and 2021:
Businesses in Addison, TX
Name Count Name Count
AT&T 1 Olive Garden 1 Chick-Fil-A 1 Outback 1 Chipotle 1 Outback Steakhouse 1 Cinnabon 1 Papa John's Pizza 1 Comfort Suites 1 Penske 1 DHL 1 PetSmart 1 FedEx 7 Pizza Hut 1 GNC 1 Quality 1 H&R Block 1 Safeway 1 Hilton 3 Sam's Club 1 Holiday Inn 3 Sprint Nextel 1 Hyatt 1 Staples 1 IHOP 1 Starbucks 3 Jimmy John's 1 Subway 2 Kroger 1 Super 8 1 La Quinta 1 T-Mobile 1 Lane Furniture 1 Target 1 Marriott 2 Toys"R"Us 1 McDonald's 1 UPS 10 Motel 6 1 Vons 1 Office Depot 1 Wendy's 1
Strongest AM radio stations in Addison:
KBIS (1150 AM; 25 kW; HIGHLAND PARK, TX; Owner: DALLAS AM RADIO PARTNERS, L.P.)
KRLD (1080 AM; 50 kW; DALLAS, TX; Owner: TEXAS INFINITY BROADCASTING L.P.)
KTCK (1310 AM; 9 kW; DALLAS, TX; Owner: KRBE LICO, INC.)
KZMP (1540 AM; 50 kW; UNIVERSITY PARK, TX; Owner: ENTRAVISION HOLDINGS, LLC)
KSKY (660 AM; 20 kW; BALCH SPRINGS, TX; Owner: BISON MEDIA, INC.)
KLIF (570 AM; 5 kW; DALLAS, TX; Owner: KLIF LICO, INC.)
KFXR (1190 AM; 50 kW; DALLAS, TX; Owner: CLEAR CHANNEL BROADCASTING LICENSES, INC.)
WBAP (820 AM; 50 kW; FORT WORTH, TX; Owner: WBAP-KSCS OPERATING, LTD.)
KESS (1270 AM; 50 kW; FORT WORTH, TX; Owner: KESS-AM LICENSE CORP.)
KAAM (770 AM; 10 kW; GARLAND, TX; Owner: DONTRON, INC.)
KAHZ (1360 AM; 50 kW; HURST, TX)
KGGR (1040 AM; daytime; 5 kW; DALLAS, TX; Owner: MORTENSON BROADCASTING COMPANY)
KTNO (1440 AM; 12 kW; DENTON, TX; Owner: MORTENSON BROADCASTING COMPANY)
Strongest FM radio stations in Addison:
KPLX (99.5 FM; FORT WORTH, TX; Owner: KPLX LICO, INC.)
WRR (101.1 FM; DALLAS, TX; Owner: CITY OF DALLAS, TEXAS)
KLUV-FM (98.7 FM; DALLAS, TX; Owner: INFINITY BROADCASTING CORPORATION OF DALLAS)
K213BP (90.5 FM; IRVING, TX; Owner: CSN INTERNATIONAL)
KLLI (105.3 FM; DALLAS, TX; Owner: INFINITY BROADCASTING CORPORATION OF DALLAS)
KZPS (92.5 FM; DALLAS, TX; Owner: AMFM TEXAS LICENSES LIMITED PARTNERSHIP)
KHKS (106.1 FM; DENTON, TX; Owner: AMFM TEXAS LICENSES LIMITED PARTNERSHIP)
KVIL-FM (103.7 FM; HIGHLAND PARK-DALLAS, TX; Owner: INFINITY BROADCASTING CORPORATION OF TEXAS)
KOAI (107.5 FM; FORT WORTH, TX; Owner: INFINITY KOAI-FM, INC.)
KKDA-FM (104.5 FM; DALLAS, TX; Owner: SERVICE BROADCASTING I, LTD.)
KEGL (97.1 FM; FORT WORTH, TX; Owner: CITICASTERS LICENSES, L.P.)
KBFB (97.9 FM; DALLAS, TX; Owner: RADIO ONE LICENSES, LLC)
KSCS (96.3 FM; FORT WORTH, TX; Owner: WBAP-KSCS OPERATING, LTD.)
KLNO (94.1 FM; FORT WORTH, TX; Owner: HBC LICENSE CORPORATION)
KRBV (100.3 FM; DALLAS, TX; Owner: INFINITY BROADCASTING CORP. OF FORT WORTH)
KCBI (90.9 FM; DALLAS, TX; Owner: CRISWELL CENTER FOR BIBLICAL STUDIES)
KDGE (102.1 FM; FORT WORTH-DALLAS, TX; Owner: CAPSTAR TX LIMITED PARTNERSHIP)
KDMX (102.9 FM; DALLAS, TX; Owner: CITICASTERS LICENSES, L.P.)
KERA (90.1 FM; DALLAS, TX; Owner: NORTH TEXAS PUBLIC BROADCASTING, INC.)
KDBN (93.3 FM; HALTOM CITY, TX; Owner: TEXAS STAR RADIO, INC.)
TV broadcast stations around Addison:
KLDT (Channel 55; LAKE DALLAS, TX; Owner: JOHNSON BROADCASTING OF DALLAS, INC.)
KLEG-LP (Channel 44; DALLAS, TX; Owner: DILIP VISWANATH)
KTVT (Channel 11; FORT WORTH, TX; Owner: CBS STATIONS GROUP OF TEXAS L.P.)
KXAS-TV (Channel 5; FORT WORTH, TX; Owner: STATION VENTURE OPERATIONS, LP)
KDTN (Channel 2; DENTON, TX; Owner: NORTH TEXAS PUBLIC BROADCASTING, INC.)
KJJM-LP (Channel 46; DALLAS/MESQUITE, TX; Owner: JANE McGINNIS)
KMPX (Channel 29; DECATUR, TX; Owner: WORD OF GOD FELLOWSHIP, INC.)
KTXA (Channel 21; FORT WORTH, TX; Owner: VIACOM TELEVISION STATIONS GROUP OF DALLAS/FORT WORTH L.P.)
KSTR-TV (Channel 49; IRVING, TX; Owner: TELEFUTURA DALLAS LLC)
KUVN (Channel 23; GARLAND, TX; Owner: KUVN LICENSE PARTNERSHIP, L.P.)
KPXD (Channel 68; ARLINGTON, TX; Owner: PAXSON DALLAS LICENSE, INC.)
WFAA-TV (Channel 8; DALLAS, TX; Owner: WFAA-TV, L.P.)
KERA-TV (Channel 13; DALLAS, TX; Owner: NORTH TEXAS PUBLIC BROADCASTING, INC.)
KXTX-TV (Channel 39; DALLAS, TX; Owner: TELEMUNDO OF TEXAS PARTNERSHIP, LP)
KDTX-TV (Channel 58; DALLAS, TX; Owner: TRINITY BROADCASTING OF TEXAS, INC.)
KDFW (Channel 4; DALLAS, TX; Owner: KDFW LICENSE, INC.)
KDAF (Channel 33; DALLAS, TX; Owner: TRIBUNE TELEVISION COMPANY)
KDFI (Channel 27; DALLAS, TX; Owner: NEW DMIC, INC.)
K26HF (Channel 26; BRITTON, TX; Owner: MAKO COMMUNICATIONS, LLC)
KHPK-LP (Channel 28; DE SOTO, TX; Owner: MAKO COMMUNICATIONS, LLC)
K25FW (Channel 25; CORSICANA, TX; Owner: VENTANA TELEVISION, INC.)
KATA-LP (Channel 60; MESQUITE, TX; Owner: JANE McGINNIS)
KFWD (Channel 52; FORT WORTH, TX; Owner: HIC BROADCAST, INC.)
KTAQ (Channel 47; GREENVILLE, TX; Owner: MIKE SIMONS)
KVFW-LP (Channel 65; FORT WORTH, TX; Owner: GERALD BENAVIDES)
National Bridge Inventory (NBI) Statistics 12 Number of bridges279ft / 84.7m Total length $5,000 Total costs138,889 Total average daily traffic4,253 Total average daily truck traffic
New bridges - historical statistics
3 1970-1979 6 2000-2009 3 2010-2019
See full National Bridge Inventory statistics for Addison, TX
Home Mortgage Disclosure Act Aggregated Statistics For Year 2009(Based on 1 full and 4 partial tracts) A) FHA, FSA/RHS & VA B) Conventional C) Refinancings D) Home Improvement Loans E) Loans on Dwellings For 5+ Families F) Non-occupant Loans on G) Loans On Manufactured Number Average Value Number Average Value Number Average Value Number Average Value Number Average Value Number Average Value Number Average Value
LOANS ORIGINATED 26 $194,183 52 $175,913 156 $174,972 4 $41,448 2 $2,325,640 7 $160,524 0 $0 APPLICATIONS APPROVED, NOT ACCEPTED 1 $177,290 8 $155,500 12 $174,284 0 $0 0 $0 1 $69,180 0 $0 APPLICATIONS DENIED 2 $209,610 4 $56,668 27 $174,315 4 $62,555 0 $0 3 $158,327 1 $45,690 APPLICATIONS WITHDRAWN 2 $176,975 7 $200,016 31 $171,864 0 $0 0 $0 7 $136,189 0 $0 FILES CLOSED FOR INCOMPLETENESS 0 $0 1 $145,470 6 $149,827 0 $0 0 $0 0 $0 0 $0
Aggregated Statistics For Year 2008(Based on 1 full and 4 partial tracts) A) FHA, FSA/RHS & VA B) Conventional C) Refinancings D) Home Improvement Loans E) Loans on Dwellings For 5+ Families F) Non-occupant Loans on G) Loans On Manufactured Number Average Value Number Average Value Number Average Value Number Average Value Number Average Value Number Average Value Number Average Value
LOANS ORIGINATED 14 $181,349 96 $187,397 61 $155,738 8 $37,565 2 $45,377,165 9 $165,667 2 $46,930 APPLICATIONS APPROVED, NOT ACCEPTED 2 $106,230 14 $158,762 11 $175,859 3 $66,937 0 $0 4 $185,888 2 $38,460 APPLICATIONS DENIED 2 $171,525 15 $163,881 24 $150,994 3 $81,567 0 $0 3 $202,907 1 $43,920 APPLICATIONS WITHDRAWN 1 $49,000 21 $190,685 19 $196,424 1 $86,470 0 $0 2 $60,035 0 $0 FILES CLOSED FOR INCOMPLETENESS 0 $0 3 $899,237 0 $0 0 $0 0 $0 0 $0 0 $0
Aggregated Statistics For Year 2007(Based on 1 full and 4 partial tracts) A) FHA, FSA/RHS & VA B) Conventional C) Refinancings D) Home Improvement Loans E) Loans on Dwellings For 5+ Families F) Non-occupant Loans on G) Loans On Manufactured Number Average Value Number Average Value Number Average Value Number Average Value Number Average Value Number Average Value Number Average Value
LOANS ORIGINATED 6 $131,068 177 $150,174 42 $155,726 7 $86,944 6 $11,141,332 19 $154,603 0 $0 APPLICATIONS APPROVED, NOT ACCEPTED 0 $0 12 $145,964 11 $147,075 2 $24,420 0 $0 0 $0 0 $0 APPLICATIONS DENIED 0 $0 17 $135,977 28 $164,314 5 $43,534 0 $0 3 $190,617 1 $153,290 APPLICATIONS WITHDRAWN 1 $133,660 22 $139,800 12 $166,874 0 $0 0 $0 2 $65,215 0 $0 FILES CLOSED FOR INCOMPLETENESS 0 $0 10 $110,339 4 $235,852 0 $0 0 $0 0 $0 0 $0
Aggregated Statistics For Year 2006(Based on 1 full and 4 partial tracts) A) FHA, FSA/RHS & VA B) Conventional C) Refinancings D) Home Improvement Loans E) Loans on Dwellings For 5+ Families F) Non-occupant Loans on G) Loans On Manufactured Number Average Value Number Average Value Number Average Value Number Average Value Number Average Value Number Average Value Number Average Value
LOANS ORIGINATED 6 $189,577 224 $152,922 45 $146,742 8 $45,805 1 $15,545,080 29 $120,988 0 $0 APPLICATIONS APPROVED, NOT ACCEPTED 0 $0 18 $121,152 10 $116,025 0 $0 0 $0 2 $76,000 0 $0 APPLICATIONS DENIED 1 $182,040 36 $138,887 15 $150,471 2 $8,790 0 $0 6 $84,507 1 $20,330 APPLICATIONS WITHDRAWN 1 $173,980 27 $144,599 10 $189,261 1 $14,410 0 $0 3 $177,653 0 $0 FILES CLOSED FOR INCOMPLETENESS 0 $0 7 $179,459 1 $100,920 0 $0 0 $0 1 $39,430 0 $0
Aggregated Statistics For Year 2005(Based on 1 full and 4 partial tracts) A) FHA, FSA/RHS & VA B) Conventional C) Refinancings D) Home Improvement Loans F) Non-occupant Loans on G) Loans On Manufactured Number Average Value Number Average Value Number Average Value Number Average Value Number Average Value Number Average Value
LOANS ORIGINATED 9 $156,950 257 $137,315 69 $157,999 5 $142,888 18 $133,004 0 $0 APPLICATIONS APPROVED, NOT ACCEPTED 0 $0 16 $113,243 21 $138,850 0 $0 1 $68,740 1 $132,590 APPLICATIONS DENIED 0 $0 51 $135,042 40 $127,175 4 $21,930 7 $104,301 1 $62,850 APPLICATIONS WITHDRAWN 0 $0 46 $160,835 19 $133,689 5 $333,082 2 $221,050 0 $0 FILES CLOSED FOR INCOMPLETENESS 1 $126,830 16 $111,786 24 $178,526 1 $89,520 1 $170,620 0 $0
Aggregated Statistics For Year 2004(Based on 1 full and 4 partial tracts) A) FHA, FSA/RHS & VA B) Conventional C) Refinancings D) Home Improvement Loans F) Non-occupant Loans on G) Loans On Manufactured Number Average Value Number Average Value Number Average Value Number Average Value Number Average Value Number Average Value
LOANS ORIGINATED 11 $127,389 200 $131,548 103 $145,882 5 $34,098 15 $121,309 0 $0 APPLICATIONS APPROVED, NOT ACCEPTED 0 $0 24 $105,172 21 $111,323 2 $26,955 4 $128,280 0 $0 APPLICATIONS DENIED 1 $114,810 26 $85,558 46 $149,058 8 $29,321 8 $74,872 0 $0 APPLICATIONS WITHDRAWN 0 $0 15 $129,389 20 $245,214 0 $0 1 $159,580 1 $47,530 FILES CLOSED FOR INCOMPLETENESS 0 $0 4 $77,340 14 $138,751 0 $0 1 $86,470 0 $0
Aggregated Statistics For Year 2003(Based on 1 full and 4 partial tracts) A) FHA, FSA/RHS & VA B) Conventional C) Refinancings D) Home Improvement Loans F) Non-occupant Loans on Number Average Value Number Average Value Number Average Value Number Average Value Number Average Value
LOANS ORIGINATED 4 $68,392 218 $128,874 405 $143,713 8 $39,432 41 $115,552 APPLICATIONS APPROVED, NOT ACCEPTED 0 $0 36 $87,835 44 $138,915 4 $40,985 3 $91,857 APPLICATIONS DENIED 1 $77,030 37 $94,017 70 $112,821 6 $44,908 11 $96,316 APPLICATIONS WITHDRAWN 0 $0 36 $107,734 61 $150,513 0 $0 3 $119,363 FILES CLOSED FOR INCOMPLETENESS 1 $94,460 9 $139,767 8 $139,729 0 $0 1 $138,220
Aggregated Statistics For Year 2002(Based on 1 full and 3 partial tracts) A) FHA, FSA/RHS & VA B) Conventional C) Refinancings D) Home Improvement Loans F) Non-occupant Loans on Number Average Value Number Average Value Number Average Value Number Average Value Number Average Value
LOANS ORIGINATED 9 $106,414 226 $131,649 232 $145,678 11 $41,015 17 $119,225 APPLICATIONS APPROVED, NOT ACCEPTED 1 $123,940 22 $104,971 25 $171,543 5 $36,446 1 $50,880 APPLICATIONS DENIED 0 $0 27 $51,634 29 $117,110 8 $31,184 5 $89,074 APPLICATIONS WITHDRAWN 0 $0 22 $116,247 39 $140,284 1 $53,590 6 $87,913 FILES CLOSED FOR INCOMPLETENESS 0 $0 5 $190,046 10 $160,646 0 $0 0 $0
Aggregated Statistics For Year 2001(Based on 1 full and 3 partial tracts) A) FHA, FSA/RHS & VA B) Conventional C) Refinancings D) Home Improvement Loans E) Loans on Dwellings For 5+ Families F) Non-occupant Loans on Number Average Value Number Average Value Number Average Value Number Average Value Number Average Value Number Average Value
LOANS ORIGINATED 12 $121,502 232 $133,340 124 $136,472 8 $58,209 1 $8,839,360 25 $118,512 APPLICATIONS APPROVED, NOT ACCEPTED 1 $115,500 24 $110,897 12 $94,597 3 $58,610 0 $0 4 $147,242 APPLICATIONS DENIED 0 $0 29 $91,105 21 $112,185 5 $11,326 0 $0 2 $45,120 APPLICATIONS WITHDRAWN 4 $125,482 18 $169,579 13 $176,797 1 $5,520 0 $0 0 $0 FILES CLOSED FOR INCOMPLETENESS 1 $63,620 6 $109,408 4 $132,830 0 $0 1 $9,459,080 0 $0
Aggregated Statistics For Year 2000(Based on 1 full and 3 partial tracts) A) FHA, FSA/RHS & VA B) Conventional C) Refinancings D) Home Improvement Loans E) Loans on Dwellings For 5+ Families F) Non-occupant Loans on Number Average Value Number Average Value Number Average Value Number Average Value Number Average Value Number Average Value
LOANS ORIGINATED 11 $118,430 194 $128,095 28 $114,808 15 $25,200 1 $8,551,120 21 $99,601 APPLICATIONS APPROVED, NOT ACCEPTED 2 $57,680 21 $126,551 7 $117,937 3 $36,233 0 $0 2 $183,995 APPLICATIONS DENIED 2 $45,490 26 $93,165 4 $46,150 8 $10,005 0 $0 3 $29,047 APPLICATIONS WITHDRAWN 1 $132,590 11 $115,628 0 $0 0 $0 0 $0 1 $87,590 FILES CLOSED FOR INCOMPLETENESS 0 $0 5 $193,706 2 $145,560 2 $21,140 0 $0 0 $0
Aggregated Statistics For Year 1999(Based on 1 full and 4 partial tracts) A) FHA, FSA/RHS & VA B) Conventional C) Refinancings D) Home Improvement Loans E) Loans on Dwellings For 5+ Families F) Non-occupant Loans on Number Average Value Number Average Value Number Average Value Number Average Value Number Average Value Number Average Value
LOANS ORIGINATED 29 $83,355 212 $129,546 63 $126,475 17 $31,745 2 $2,347,495 19 $100,192 APPLICATIONS APPROVED, NOT ACCEPTED 1 $62,350 30 $108,629 10 $92,415 6 $35,197 0 $0 2 $59,280 APPLICATIONS DENIED 5 $100,546 48 $77,509 16 $159,245 5 $20,394 0 $0 3 $70,893 APPLICATIONS WITHDRAWN 3 $67,577 20 $109,856 13 $150,512 0 $0 0 $0 5 $71,630 FILES CLOSED FOR INCOMPLETENESS 0 $0 3 $143,783 5 $101,818 1 $21,680 0 $0 2 $61,405
Detailed HMDA statistics for the following Tracts:
0136.14
, 0136.16 , 0137.04 , 0137.25 , 0138.01
Private Mortgage Insurance Companies Aggregated Statistics For Year 2009(Based on 1 full and 4 partial tracts) A) Conventional B) Refinancings Number Average Value Number Average Value
LOANS ORIGINATED 9 $207,893 4 $201,925 APPLICATIONS APPROVED, NOT ACCEPTED 0 $0 1 $175,830 APPLICATIONS DENIED 2 $202,005 3 $189,297 APPLICATIONS WITHDRAWN 0 $0 0 $0 FILES CLOSED FOR INCOMPLETENESS 0 $0 0 $0
Aggregated Statistics For Year 2008(Based on 1 full and 4 partial tracts) A) Conventional B) Refinancings C) Non-occupant Loans on Number Average Value Number Average Value Number Average Value
LOANS ORIGINATED 23 $219,979 3 $214,250 1 $168,920 APPLICATIONS APPROVED, NOT ACCEPTED 5 $228,030 1 $149,880 1 $163,810 APPLICATIONS DENIED 2 $132,960 0 $0 2 $132,960 APPLICATIONS WITHDRAWN 1 $161,620 0 $0 0 $0 FILES CLOSED FOR INCOMPLETENESS 0 $0 0 $0 0 $0
Aggregated Statistics For Year 2007(Based on 1 full and 4 partial tracts) A) Conventional B) Refinancings C) Non-occupant Loans on Number Average Value Number Average Value Number Average Value
LOANS ORIGINATED 27 $191,688 3 $177,787 2 $155,385 APPLICATIONS APPROVED, NOT ACCEPTED 3 $101,120 1 $155,770 0 $0 APPLICATIONS DENIED 0 $0 0 $0 0 $0 APPLICATIONS WITHDRAWN 0 $0 0 $0 0 $0 FILES CLOSED FOR INCOMPLETENESS 0 $0 0 $0 0 $0
Aggregated Statistics For Year 2006(Based on 1 full and 3 partial tracts) A) Conventional B) Refinancings C) Non-occupant Loans on Number Average Value Number Average Value Number Average Value
LOANS ORIGINATED 12 $125,477 1 $40,950 1 $68,740 APPLICATIONS APPROVED, NOT ACCEPTED 23 $73,193 1 $207,530 20 $56,704 APPLICATIONS DENIED 0 $0 0 $0 0 $0 APPLICATIONS WITHDRAWN 3 $59,860 0 $0 1 $44,610 FILES CLOSED FOR INCOMPLETENESS 0 $0 0 $0 0 $0
Aggregated Statistics For Year 2005(Based on 1 full and 4 partial tracts) A) Conventional B) Refinancings C) Non-occupant Loans on Number Average Value Number Average Value Number Average Value
LOANS ORIGINATED 19 $204,681 4 $152,635 2 $197,595 APPLICATIONS APPROVED, NOT ACCEPTED 2 $123,755 2 $264,000 1 $47,700 APPLICATIONS DENIED 0 $0 0 $0 0 $0 APPLICATIONS WITHDRAWN 0 $0 0 $0 0 $0 FILES CLOSED FOR INCOMPLETENESS 0 $0 0 $0 0 $0
Aggregated Statistics For Year 2004(Based on 1 full and 3 partial tracts) A) Conventional B) Refinancings C) Non-occupant Loans on Number Average Value Number Average Value Number Average Value
LOANS ORIGINATED 18 $138,369 7 $163,499 3 $149,433 APPLICATIONS APPROVED, NOT ACCEPTED 3 $129,287 6 $187,347 1 $245,720 APPLICATIONS DENIED 0 $0 0 $0 0 $0 APPLICATIONS WITHDRAWN 0 $0 0 $0 0 $0 FILES CLOSED FOR INCOMPLETENESS 1 $124,900 0 $0 0 $0
Aggregated Statistics For Year 2003(Based on 1 full and 4 partial tracts) A) Conventional B) Refinancings C) Non-occupant Loans on Number Average Value Number Average Value Number Average Value
LOANS ORIGINATED 41 $163,720 20 $188,516 6 $127,383 APPLICATIONS APPROVED, NOT ACCEPTED 7 $141,783 4 $167,830 0 $0 APPLICATIONS DENIED 0 $0 3 $140,597 0 $0 APPLICATIONS WITHDRAWN 2 $129,805 2 $149,430 0 $0 FILES CLOSED FOR INCOMPLETENESS 0 $0 0 $0 0 $0
Aggregated Statistics For Year 2002(Based on 1 full and 3 partial tracts) A) Conventional B) Refinancings C) Non-occupant Loans on Number Average Value Number Average Value Number Average Value
LOANS ORIGINATED 36 $152,708 9 $169,319 3 $219,147 APPLICATIONS APPROVED, NOT ACCEPTED 6 $149,113 2 $157,090 0 $0 APPLICATIONS DENIED 1 $161,620 0 $0 1 $161,620 APPLICATIONS WITHDRAWN 3 $129,847 1 $157,570 0 $0 FILES CLOSED FOR INCOMPLETENESS 1 $246,930 0 $0 0 $0
Aggregated Statistics For Year 2001(Based on 1 full and 3 partial tracts) A) Conventional B) Refinancings C) Non-occupant Loans on Number Average Value Number Average Value Number Average Value
LOANS ORIGINATED 25 $169,697 5 $172,194 1 $199,350 APPLICATIONS APPROVED, NOT ACCEPTED 3 $81,323 2 $164,695 0 $0 APPLICATIONS DENIED 1 $154,690 1 $124,900 0 $0 APPLICATIONS WITHDRAWN 1 $98,000 1 $157,570 0 $0 FILES CLOSED FOR INCOMPLETENESS 0 $0 0 $0 0 $0
Aggregated Statistics For Year 2000(Based on 1 full and 3 partial tracts) A) Conventional B) Refinancings C) Non-occupant Loans on Number Average Value Number Average Value Number Average Value
LOANS ORIGINATED 36 $144,836 5 $135,492 6 $87,163 APPLICATIONS APPROVED, NOT ACCEPTED 4 $119,638 2 $216,670 1 $21,210 APPLICATIONS DENIED 2 $136,090 0 $0 0 $0 APPLICATIONS WITHDRAWN 1 $140,280 0 $0 0 $0 FILES CLOSED FOR INCOMPLETENESS 0 $0 0 $0 0 $0
Aggregated Statistics For Year 1999(Based on 1 full and 3 partial tracts) A) Conventional B) Refinancings C) Non-occupant Loans on Number Average Value Number Average Value Number Average Value
LOANS ORIGINATED 60 $160,172 5 $113,088 2 $106,875 APPLICATIONS APPROVED, NOT ACCEPTED 2 $63,105 0 $0 1 $91,120 APPLICATIONS DENIED 1 $104,210 0 $0 0 $0 APPLICATIONS WITHDRAWN 3 $139,930 0 $0 1 $117,020 FILES CLOSED FOR INCOMPLETENESS 2 $169,270 0 $0 0 $0
Detailed PMIC statistics for the following Tracts:
0136.14
, 0136.16 , 0137.04 , 0137.25 , 0138.01 Fire-safe hotels and motels in Addison, Texas:
Homewood Suites Hotel-Addison, 4451 Beltline Rd, Addison, Texas 75001 Phone: (972) 788-1342, Fax: (972) 788-1373
Addison Midway Courtyard By Marriott, 4165 Proton Dr, Addison, Texas 75001 Phone: (972) 490-7390, Fax: (972) 490-0002
Crowne Plaza Dallas Near The Galleria, 14315 Midway Rd, Addison, Texas 75001 Phone: (972) 980-8877, Fax: (972) 788-2758
Best Western Plus Addison Galleria Hotel, 14975 Landmark Blvd, Addison, Texas 75254 Phone: (972) 701-0881, Fax: (972) 701-0815
Radisson Hotel Dallas North-Addison, 4960 Arapaho Rd, Addison, Texas 75001 Phone: (972) 490-1212, Fax: (972) 233-4283
Hyatt Summerfield Suites In Addision, 4900 Edwin Lewis Dr, Addison, Texas 75001 Phone: (972) 661-3113, Fax: (972) 661-5010
Holiday Inn Express Hotel & Suites, 4355 Beltway Dr, Addison, Texas 75001 Phone: (972) 503-7800, Fax: (972) 503-2300
Hawthorn Suites By Wyndham-Addison TX, 15200 Addison Rd, Addison, Texas 75001 Phone: (972) 386-4800, Fax: (972) 947-3802
4 other hotels and motels
All 12 fire-safe hotels and motels in Addison, Texas
Most common first names in Addison, TX among deceased individuals Name Count Lived (average)
Mary 13 80.5 years James 10 68.5 years Robert 9 71.6 years John 8 73.0 years Charles 7 67.2 years Jerry 6 70.5 years Dorothy 5 83.6 years Richard 4 55.5 years Elizabeth 3 68.7 years Margaret 3 64.0 years
Most common last names in Addison, TX among deceased individuals Last name Count Lived (average)
Allen 4 76.5 years Johnson 3 79.1 years Harris 3 81.3 years Miller 3 69.0 years Moore 3 65.7 years Seabolt 3 81.3 years Smith 3 88.3 years Garfield 2 87.5 years Cook 2 68.6 years Klein 2 65.0 years
Addison compared to Texas state average:
Median house value above state average. Unemployed percentage significantly below state average. Black race population percentage above state average. Foreign-born population percentage above state average. Renting percentage above state average. Length of stay since moving in above state average. Number of rooms per house significantly below state average. House age below state average. Percentage of population with a bachelor's degree or higher significantly above state average.
#1 on the list of "Top 101 cities with the most local government spending on highway construction per resident (population 10,000+)"
#11 on the list of "Top 101 cities with the most local government spending on current operations of parks and recreation per resident (population 10,000+)"
#27 on the list of "Top 101 cities with the lowest percentage of family households, population 10,000+"
#30 on the list of "Top 101 cities with the highest number of police officers per 1000 residents (population 5,000+)"
#31 on the list of "Top 101 cities that people commute into (largest positive percentage daily daytime population change due to commuting) (population 5,000+)"
#41 on the list of "Top 100 cities with smallest houses (pop. 5,000+)"
#51 on the list of "Top 101 cities with largest percentage of males in occupations: business and financial operations occupations (population 5,000+)"
#67 on the list of "Top 100 cities with highest percentage of renters (pop. 5,000+)"
#69 on the list of "Top 101 cities with the lowest percentage of family households, population 1,000+"
#94 on the list of "Top 101 cities with the highest number of auto thefts per 100,000 residents, excludes tourist destinations and others with a lot of outsiders visiting based on city industries data (population 5,000+)"
#63 (75248) on the list of "Top 101 zip codes with the most Internet business establishments in 2005"
#3 on the list of "Top 101 counties with the most Evangelical Protestant adherents"
#3 on the list of "Top 101 counties with the most Evangelical Protestant congregations"
#5 on the list of "Top 101 counties with the highest average weight of females"
#6 on the list of "Top 101 counties with the most Mainline Protestant adherents"
#7 on the list of "Top 101 counties with the most Black Protestant congregations"
Top Patent Applicants
Payam Delgoshaei (12)
David Gan (11)
Benjamin Stassen Cook (11)
Geetha Kalahasti (10)
Tiffany Carle (9)
Narendra Tilwani (9)
Nia Mack (8)
Sorin N. Cismas (8)
Patrick Satarzadeh (8)
Robert Michael Muchsel (8)
Total of 365 patent applications in 2008-2024.


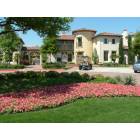
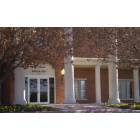


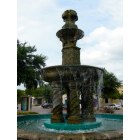

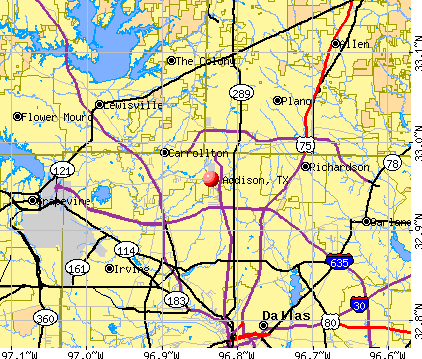


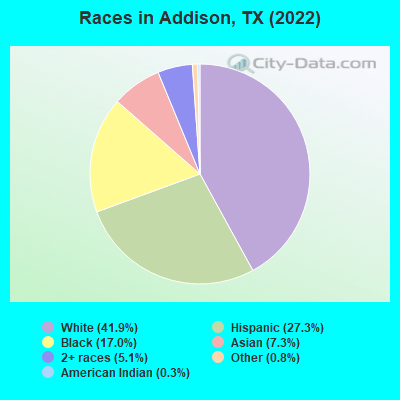
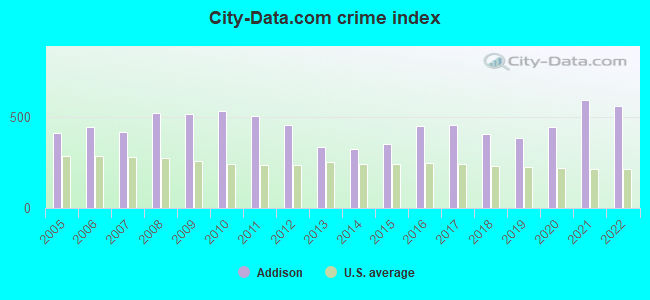
 Recent articles from our blog. Our writers, many of them Ph.D. graduates or candidates, create easy-to-read articles on a wide variety of topics.

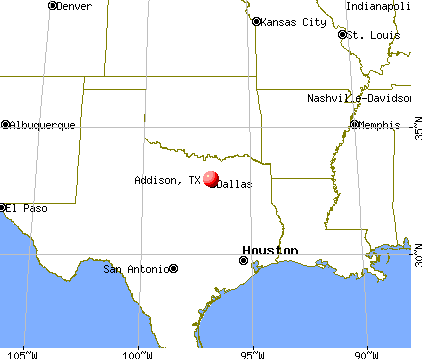
 (4.0 miles
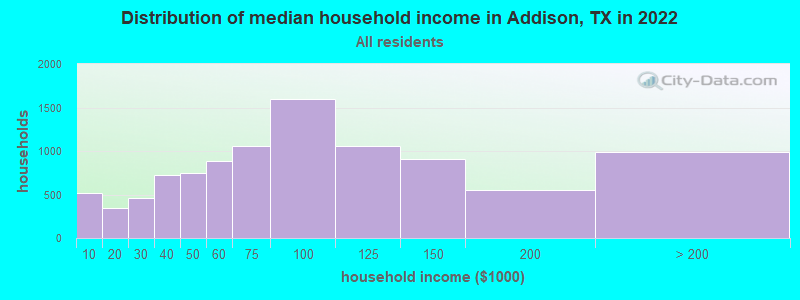
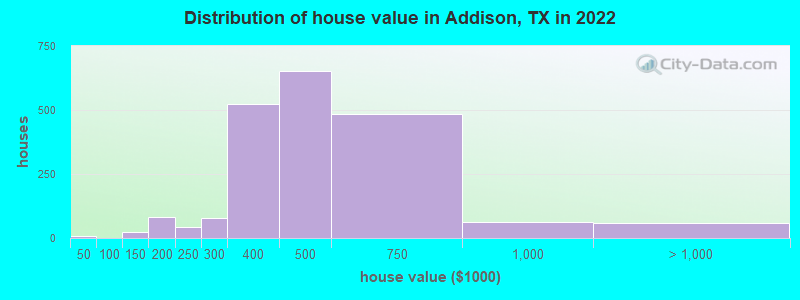

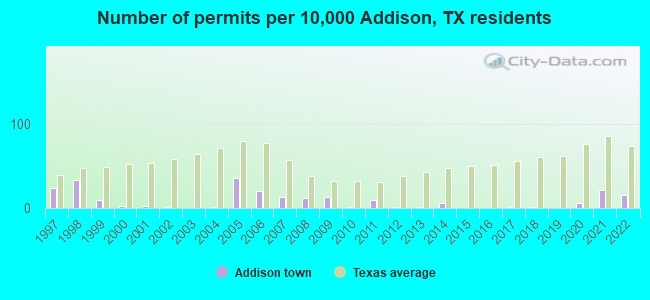
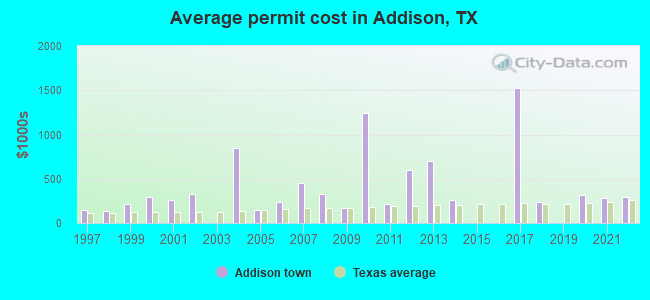
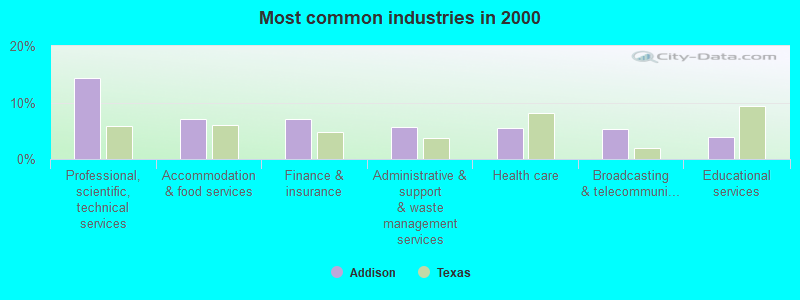
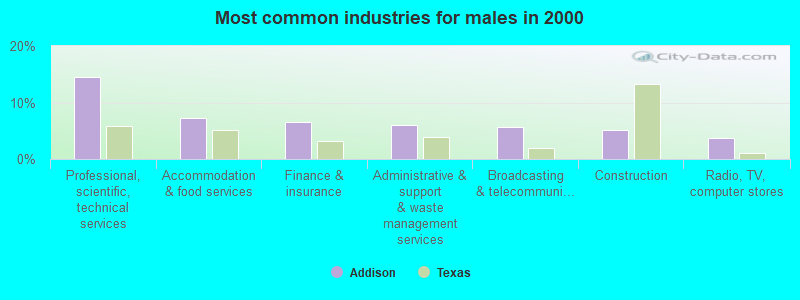
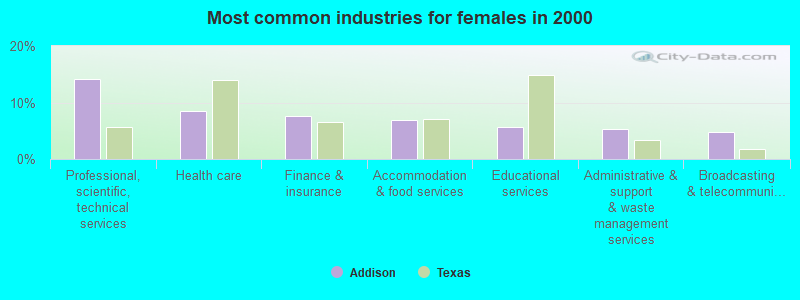
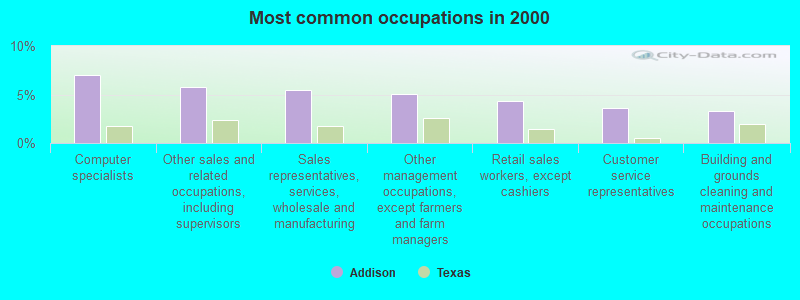
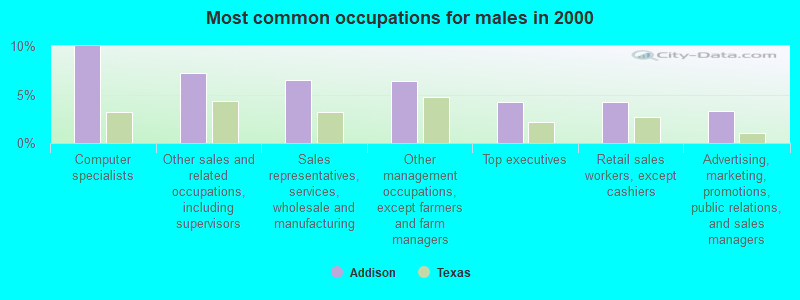
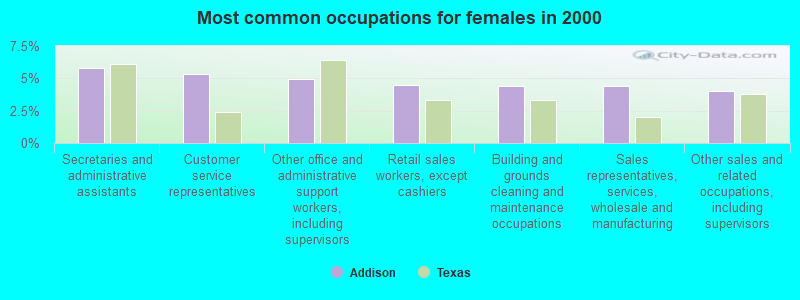


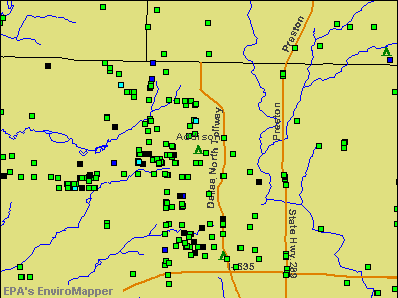

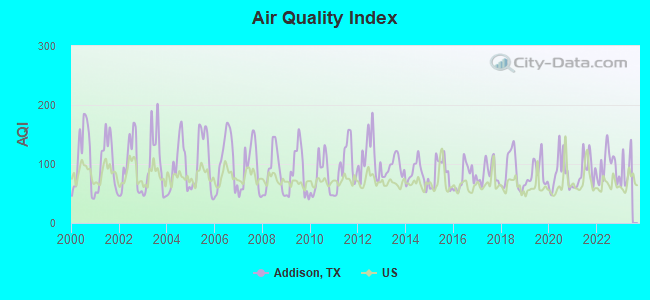
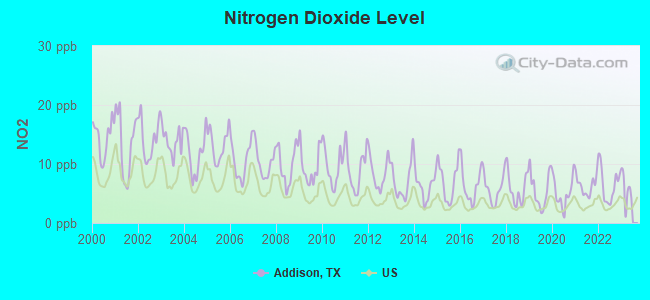
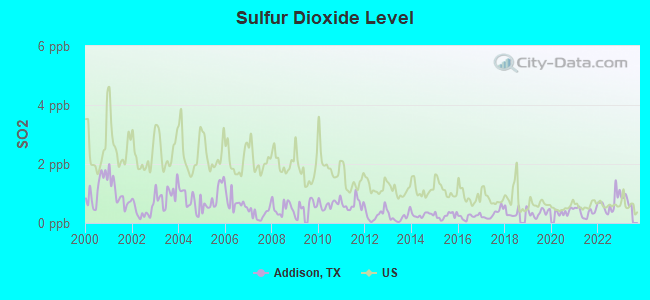
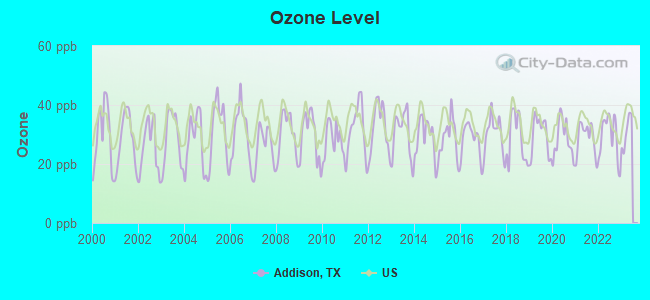
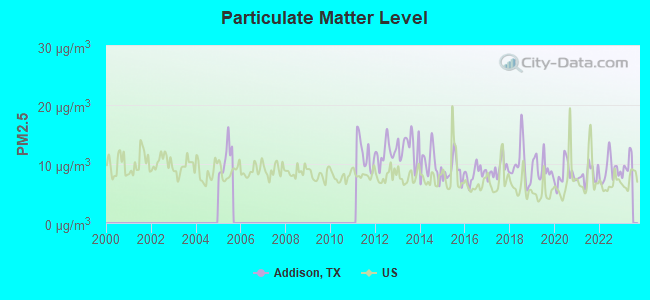
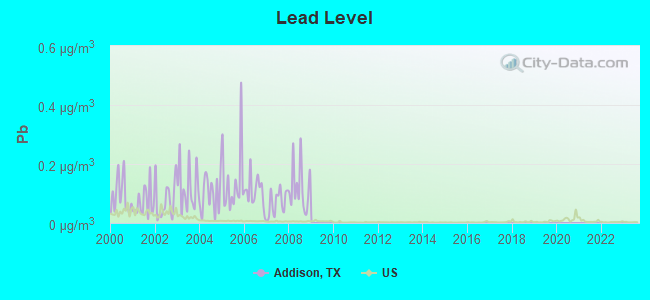
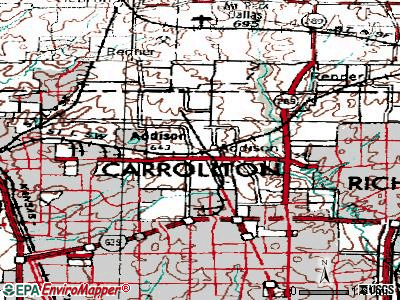
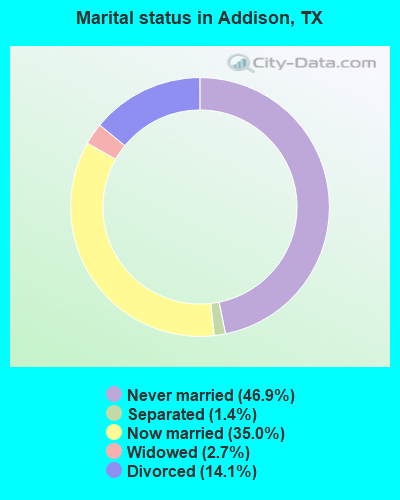
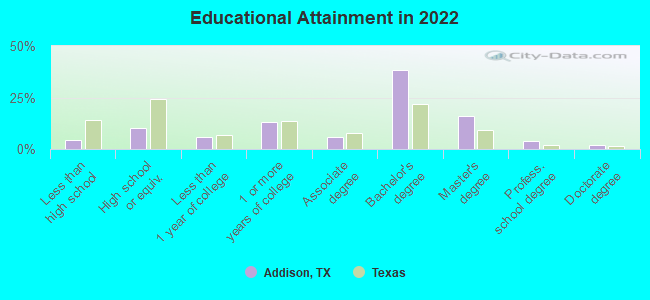
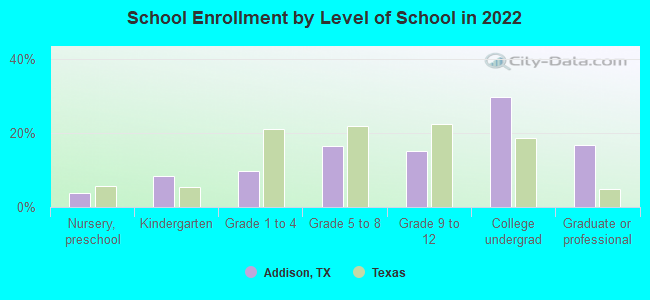
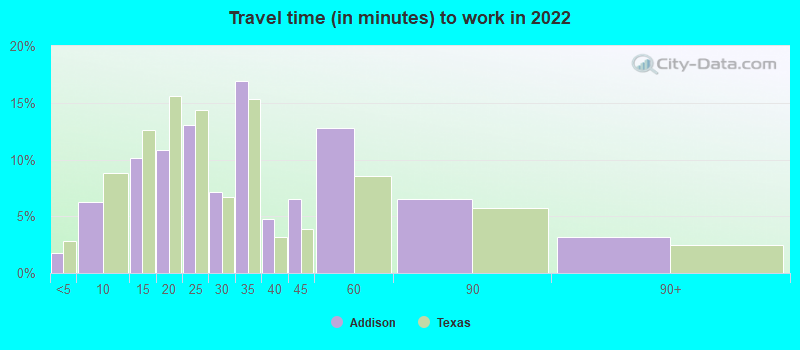
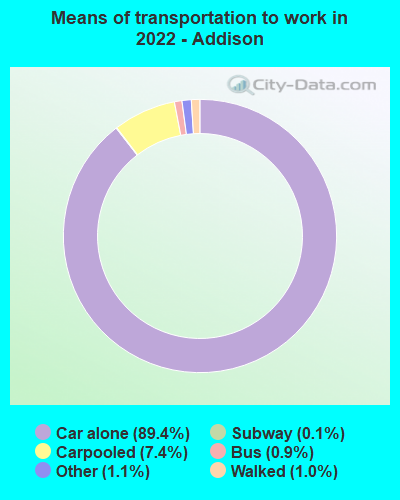
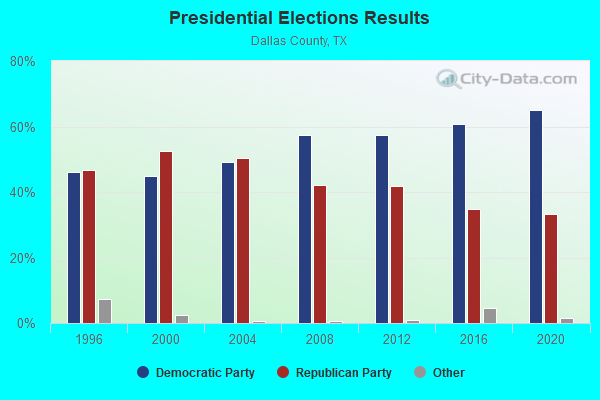
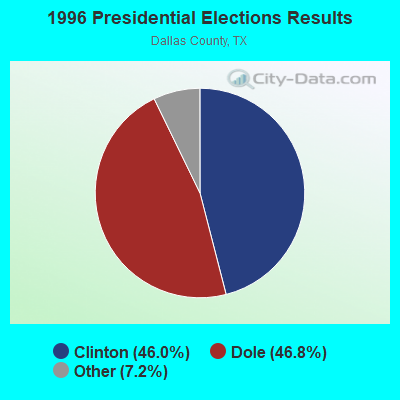
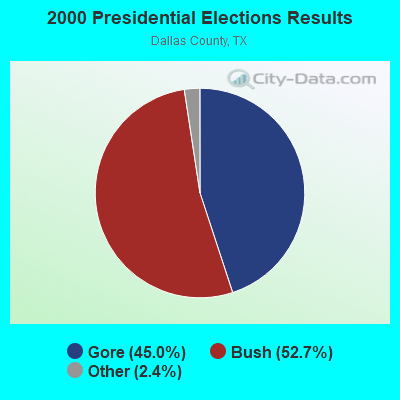
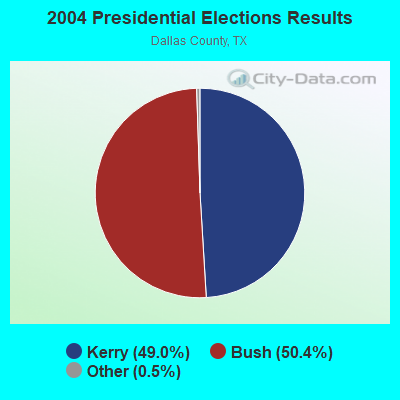
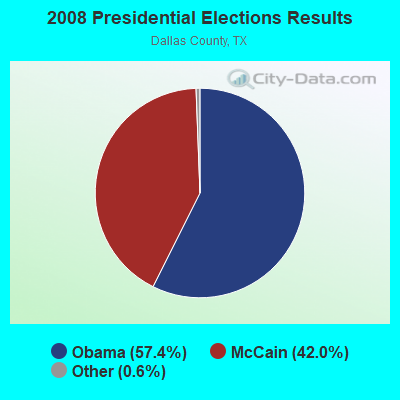

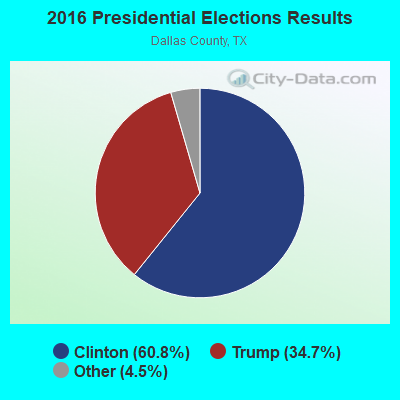
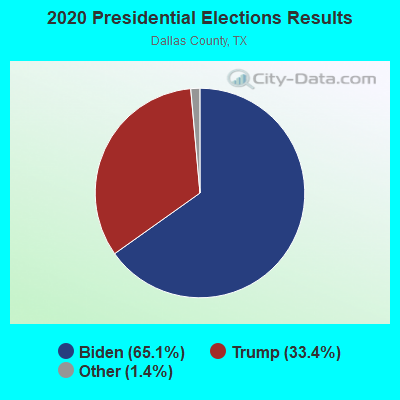
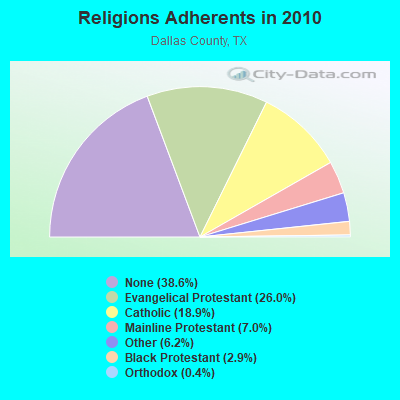
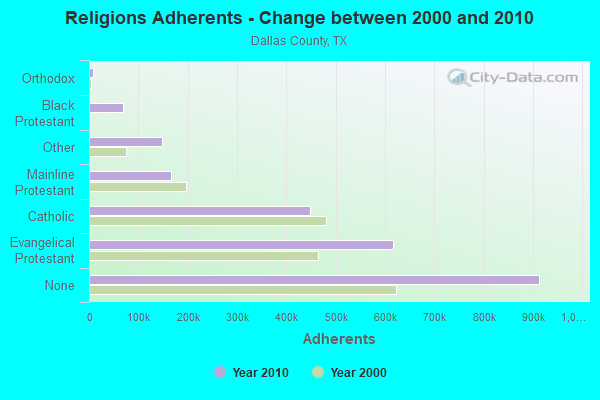
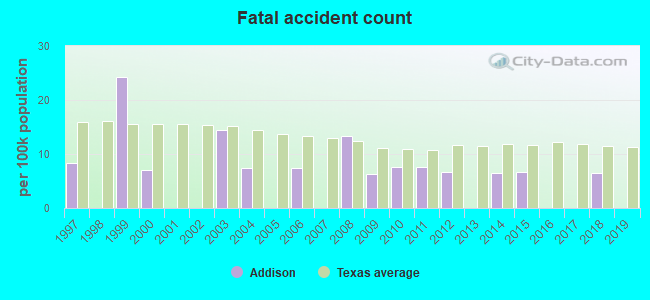
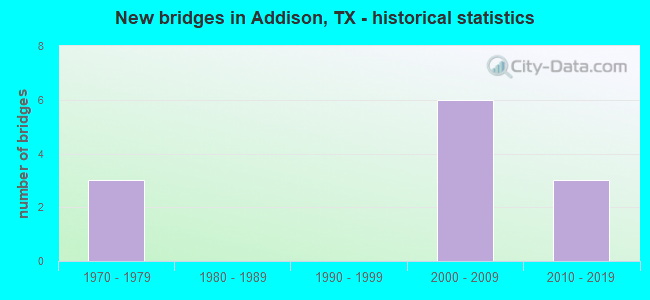
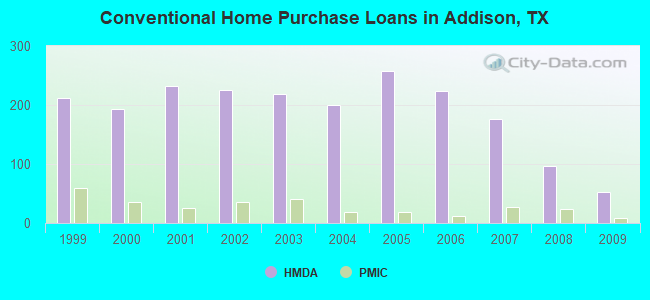
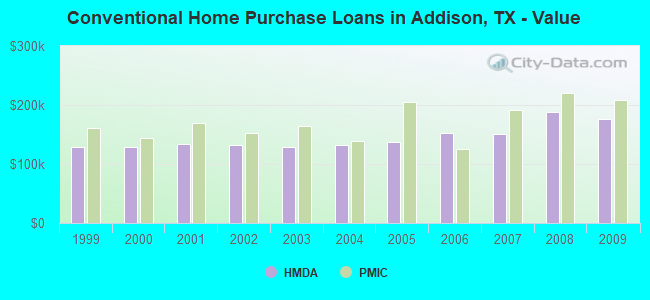
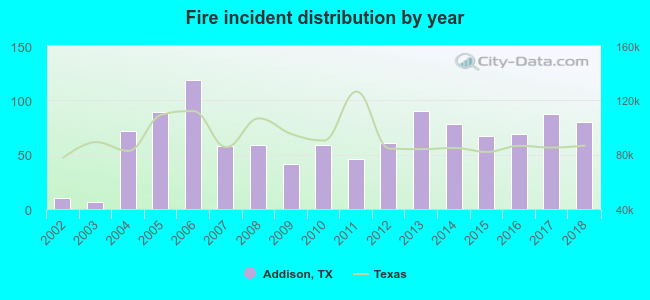 Based on the data from the years 2002 - 2018 the average number of fire incidents per year is 64. The highest number of fires - 119 took place in 2006, and the least - 6 in 2003. The data has an increasing trend.
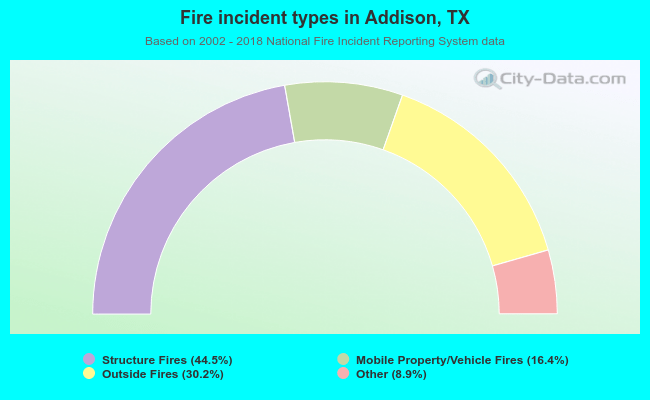 When looking into fire subcategories, the most incidents belonged to: Structure Fires (44.5%), and Outside Fires (30.2%).