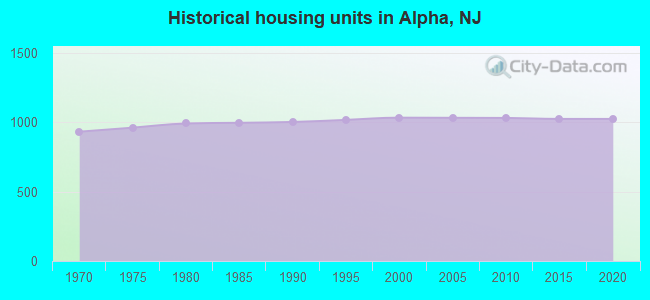
Alpha, New Jersey Submit your own pictures of this borough and show them to the world
OSM Map
General Map
Google Map
MSN Map
OSM Map
General Map
Google Map
MSN Map
OSM Map
General Map
Google Map
MSN Map
OSM Map
General Map
Google Map
MSN Map
Please wait while loading the map...
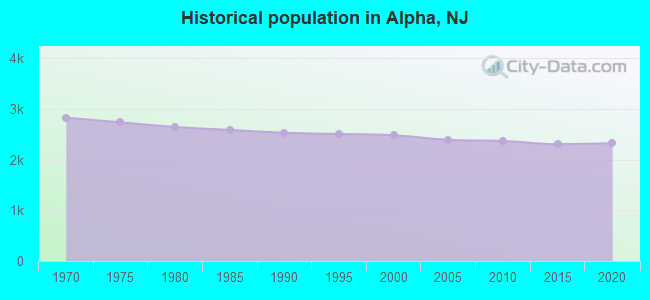
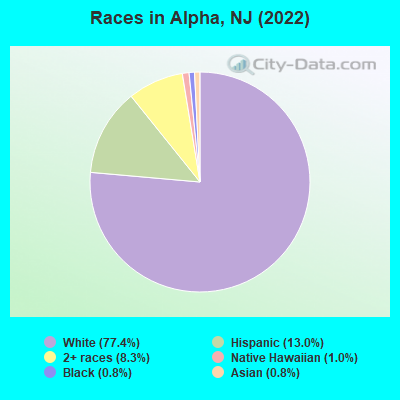
Population in 2022: 2,344 (100% urban, 0% rural). Population change since 2000: -5.6%Males: 1,134 Females: 1,210
March 2022 cost of living index in Alpha: 109.3 (more than average, U.S. average is 100) Percentage of residents living in poverty in 2022: 7.3%for White Non-Hispanic residents , 100.0% for Black residents , 12.5% for Hispanic or Latino residents , 35.9% for other race residents , 4.0% for two or more races residents )Business Search - 14 Million verified businesses
Data:
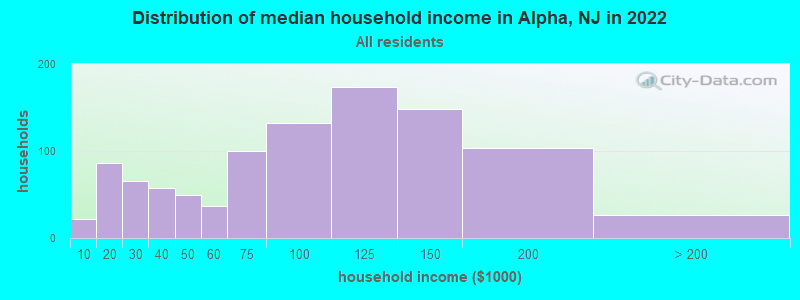
Median household income ($)
Median household income (% change since 2000)
Household income diversity
Ratio of average income to average house value (%)
Ratio of average income to average rent
Median household income ($) - White
Median household income ($) - Black or African American
Median household income ($) - Asian
Median household income ($) - Hispanic or Latino
Median household income ($) - American Indian and Alaska Native
Median household income ($) - Multirace
Median household income ($) - Other Race
Median household income for houses/condos with a mortgage ($)
Median household income for apartments without a mortgage ($)
Races - White alone (%)
Races - White alone (% change since 2000)
Races - Black alone (%)
Races - Black alone (% change since 2000)
Races - American Indian alone (%)
Races - American Indian alone (% change since 2000)
Races - Asian alone (%)
Races - Asian alone (% change since 2000)
Races - Hispanic (%)
Races - Hispanic (% change since 2000)
Races - Native Hawaiian and Other Pacific Islander alone (%)
Races - Native Hawaiian and Other Pacific Islander alone (% change since 2000)
Races - Two or more races (%)
Races - Two or more races (% change since 2000)
Races - Other race alone (%)
Races - Other race alone (% change since 2000)
Racial diversity
Unemployment (%)
Unemployment (% change since 2000)
Unemployment (%) - White
Unemployment (%) - Black or African American
Unemployment (%) - Asian
Unemployment (%) - Hispanic or Latino
Unemployment (%) - American Indian and Alaska Native
Unemployment (%) - Multirace
Unemployment (%) - Other Race
Population density (people per square mile)
Population - Males (%)
Population - Females (%)
Population - Males (%) - White
Population - Males (%) - Black or African American
Population - Males (%) - Asian
Population - Males (%) - Hispanic or Latino
Population - Males (%) - American Indian and Alaska Native
Population - Males (%) - Multirace
Population - Males (%) - Other Race
Population - Females (%) - White
Population - Females (%) - Black or African American
Population - Females (%) - Asian
Population - Females (%) - Hispanic or Latino
Population - Females (%) - American Indian and Alaska Native
Population - Females (%) - Multirace
Population - Females (%) - Other Race
Coronavirus confirmed cases (Jun 16, 2024)
Deaths caused by coronavirus (Jun 16, 2024)
Coronavirus confirmed cases (per 100k population) (Jun 16, 2024)
Deaths caused by coronavirus (per 100k population) (Jun 16, 2024)
Daily increase in number of cases (Jun 16, 2024)
Weekly increase in number of cases (Jun 16, 2024)
Cases doubled (in days) (Jun 16, 2024)
Hospitalized patients (Apr 18, 2022)
Negative test results (Apr 18, 2022)
Total test results (Apr 18, 2022)
COVID Vaccine doses distributed (per 100k population) (Sep 19, 2023)
COVID Vaccine doses administered (per 100k population) (Sep 19, 2023)
COVID Vaccine doses distributed (Sep 19, 2023)
COVID Vaccine doses administered (Sep 19, 2023)
Likely homosexual households (%)
Likely homosexual households (% change since 2000)
Likely homosexual households - Lesbian couples (%)
Likely homosexual households - Lesbian couples (% change since 2000)
Likely homosexual households - Gay men (%)
Likely homosexual households - Gay men (% change since 2000)
Cost of living index
Median gross rent ($)
Median contract rent ($)
Median monthly housing costs ($)
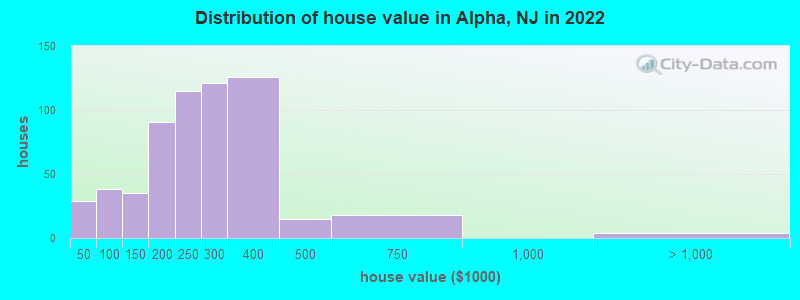
Median house or condo value ($)
Median house or condo value ($ change since 2000)
Mean house or condo value by units in structure - 1, detached ($)
Mean house or condo value by units in structure - 1, attached ($)
Mean house or condo value by units in structure - 2 ($)
Mean house or condo value by units in structure by units in structure - 3 or 4 ($)
Mean house or condo value by units in structure - 5 or more ($)
Mean house or condo value by units in structure - Boat, RV, van, etc. ($)
Mean house or condo value by units in structure - Mobile home ($)
Median house or condo value ($) - White
Median house or condo value ($) - Black or African American
Median house or condo value ($) - Asian
Median house or condo value ($) - Hispanic or Latino
Median house or condo value ($) - American Indian and Alaska Native
Median house or condo value ($) - Multirace
Median house or condo value ($) - Other Race
Median resident age
Resident age diversity
Median resident age - Males
Median resident age - Females
Median resident age - White
Median resident age - Black or African American
Median resident age - Asian
Median resident age - Hispanic or Latino
Median resident age - American Indian and Alaska Native
Median resident age - Multirace
Median resident age - Other Race
Median resident age - Males - White
Median resident age - Males - Black or African American
Median resident age - Males - Asian
Median resident age - Males - Hispanic or Latino
Median resident age - Males - American Indian and Alaska Native
Median resident age - Males - Multirace
Median resident age - Males - Other Race
Median resident age - Females - White
Median resident age - Females - Black or African American
Median resident age - Females - Asian
Median resident age - Females - Hispanic or Latino
Median resident age - Females - American Indian and Alaska Native
Median resident age - Females - Multirace
Median resident age - Females - Other Race
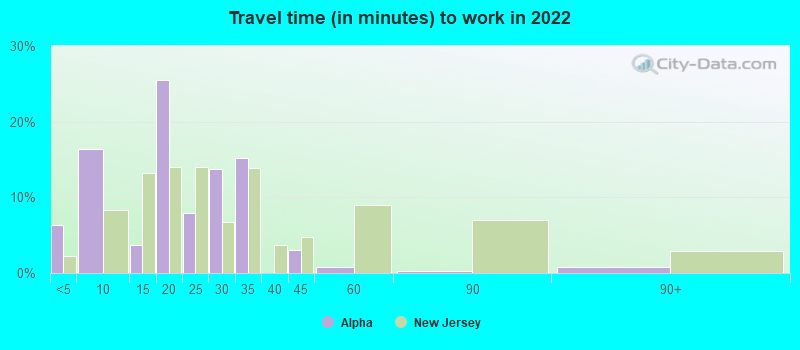
Commute - mean travel time to work (minutes)
Travel time to work - Less than 5 minutes (%)
Travel time to work - Less than 5 minutes (% change since 2000)
Travel time to work - 5 to 9 minutes (%)
Travel time to work - 5 to 9 minutes (% change since 2000)
Travel time to work - 10 to 19 minutes (%)
Travel time to work - 10 to 19 minutes (% change since 2000)
Travel time to work - 20 to 29 minutes (%)
Travel time to work - 20 to 29 minutes (% change since 2000)
Travel time to work - 30 to 39 minutes (%)
Travel time to work - 30 to 39 minutes (% change since 2000)
Travel time to work - 40 to 59 minutes (%)
Travel time to work - 40 to 59 minutes (% change since 2000)
Travel time to work - 60 to 89 minutes (%)
Travel time to work - 60 to 89 minutes (% change since 2000)
Travel time to work - 90 or more minutes (%)
Travel time to work - 90 or more minutes (% change since 2000)
Marital status - Never married (%)
Marital status - Now married (%)
Marital status - Separated (%)
Marital status - Widowed (%)
Marital status - Divorced (%)
Median family income ($)
Median family income (% change since 2000)
Median non-family income ($)
Median non-family income (% change since 2000)
Median per capita income ($)
Median per capita income (% change since 2000)
Median family income ($) - White
Median family income ($) - Black or African American
Median family income ($) - Asian
Median family income ($) - Hispanic or Latino
Median family income ($) - American Indian and Alaska Native
Median family income ($) - Multirace
Median family income ($) - Other Race
Median year house/condo built
Median year apartment built
Year house built - Built 2005 or later (%)
Year house built - Built 2000 to 2004 (%)
Year house built - Built 1990 to 1999 (%)
Year house built - Built 1980 to 1989 (%)
Year house built - Built 1970 to 1979 (%)
Year house built - Built 1960 to 1969 (%)
Year house built - Built 1950 to 1959 (%)
Year house built - Built 1940 to 1949 (%)
Year house built - Built 1939 or earlier (%)
Average household size
Household density (households per square mile)
Average household size - White
Average household size - Black or African American
Average household size - Asian
Average household size - Hispanic or Latino
Average household size - American Indian and Alaska Native
Average household size - Multirace
Average household size - Other Race
Occupied housing units (%)
Vacant housing units (%)
Owner occupied housing units (%)
Renter occupied housing units (%)
Vacancy status - For rent (%)
Vacancy status - For sale only (%)
Vacancy status - Rented or sold, not occupied (%)
Vacancy status - For seasonal, recreational, or occasional use (%)
Vacancy status - For migrant workers (%)
Vacancy status - Other vacant (%)
Residents with income below the poverty level (%)
Residents with income below 50% of the poverty level (%)
Children below poverty level (%)
Poor families by family type - Married-couple family (%)
Poor families by family type - Male, no wife present (%)
Poor families by family type - Female, no husband present (%)
Poverty status for native-born residents (%)
Poverty status for foreign-born residents (%)
Poverty among high school graduates not in families (%)
Poverty among people who did not graduate high school not in families (%)
Residents with income below the poverty level (%) - White
Residents with income below the poverty level (%) - Black or African American
Residents with income below the poverty level (%) - Asian
Residents with income below the poverty level (%) - Hispanic or Latino
Residents with income below the poverty level (%) - American Indian and Alaska Native
Residents with income below the poverty level (%) - Multirace
Residents with income below the poverty level (%) - Other Race
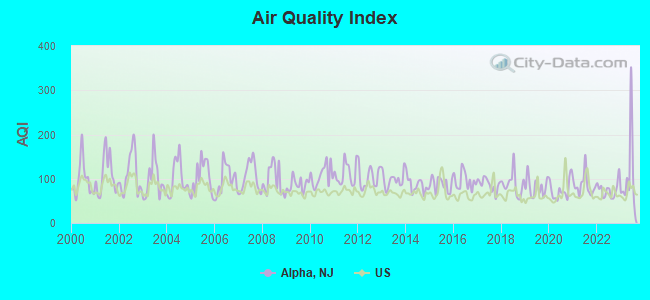
Air pollution - Air Quality Index (AQI)
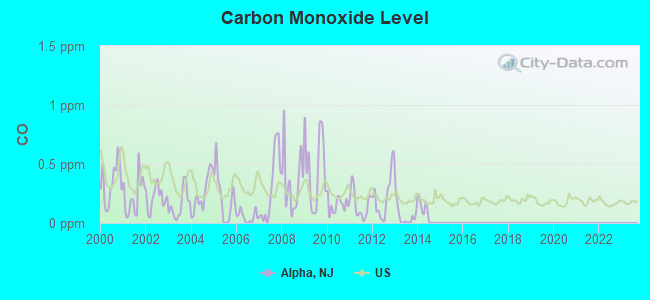
Air pollution - CO
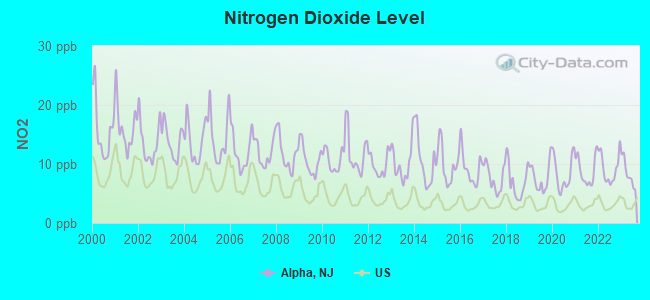
Air pollution - NO2
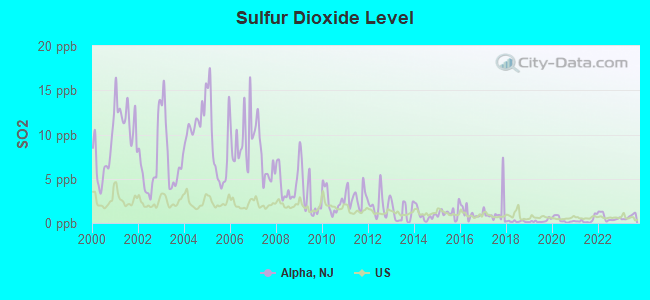
Air pollution - SO2
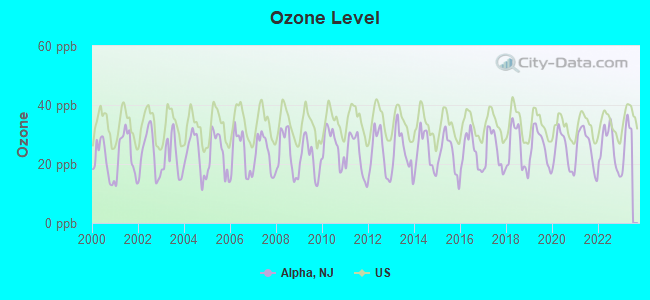
Air pollution - Ozone
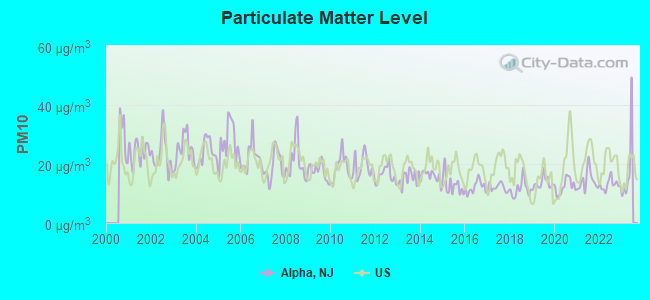
Air pollution - PM10
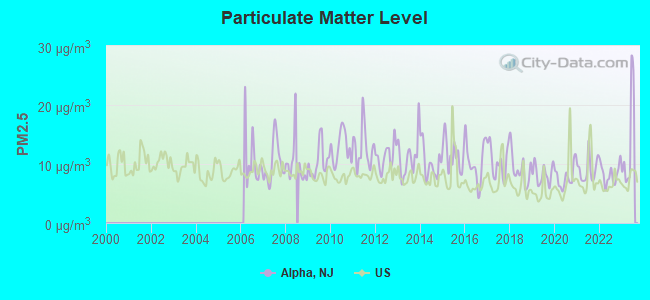
Air pollution - PM25
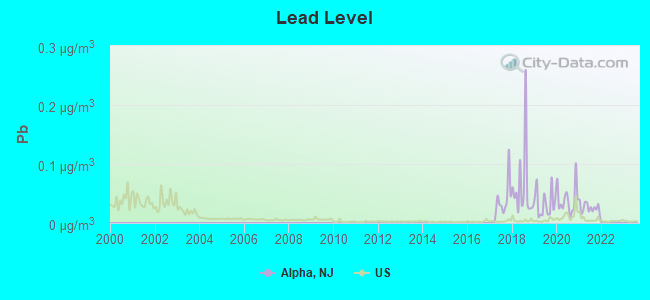
Air pollution - Pb
Crime - Murders per 100,000 population
Crime - Rapes per 100,000 population
Crime - Robberies per 100,000 population
Crime - Assaults per 100,000 population
Crime - Burglaries per 100,000 population
Crime - Thefts per 100,000 population
Crime - Auto thefts per 100,000 population
Crime - Arson per 100,000 population
Crime - City-data.com crime index
Crime - Violent crime index
Crime - Property crime index
Crime - Murders per 100,000 population (5 year average)
Crime - Rapes per 100,000 population (5 year average)
Crime - Robberies per 100,000 population (5 year average)
Crime - Assaults per 100,000 population (5 year average)
Crime - Burglaries per 100,000 population (5 year average)
Crime - Thefts per 100,000 population (5 year average)
Crime - Auto thefts per 100,000 population (5 year average)
Crime - Arson per 100,000 population (5 year average)
Crime - City-data.com crime index (5 year average)
Crime - Violent crime index (5 year average)
Crime - Property crime index (5 year average)
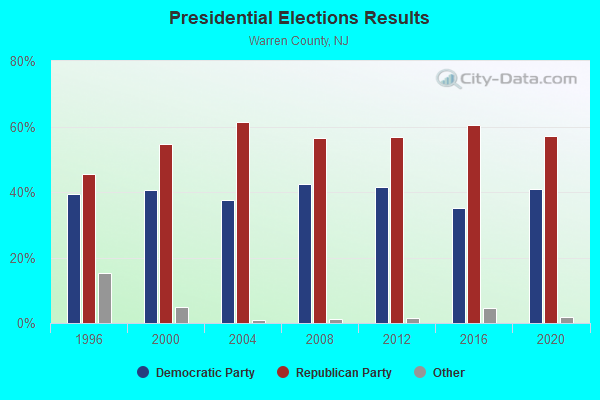
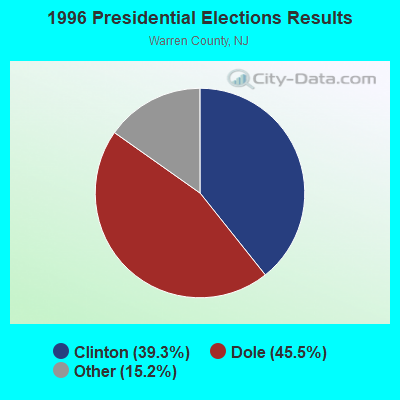
1996 Presidential Elections Results (%) - Democratic Party (Clinton)
1996 Presidential Elections Results (%) - Republican Party (Dole)
1996 Presidential Elections Results (%) - Other
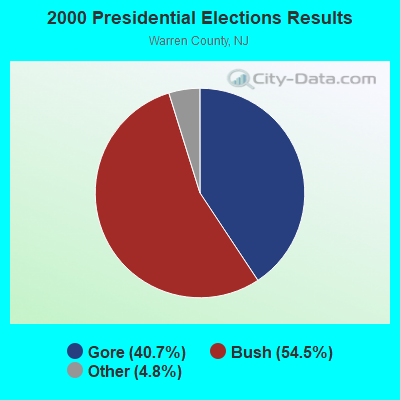
2000 Presidential Elections Results (%) - Democratic Party (Gore)
2000 Presidential Elections Results (%) - Republican Party (Bush)
2000 Presidential Elections Results (%) - Other
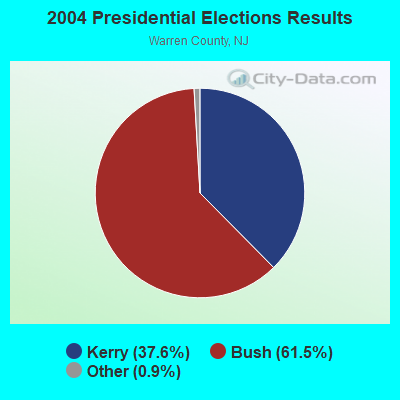
2004 Presidential Elections Results (%) - Democratic Party (Kerry)
2004 Presidential Elections Results (%) - Republican Party (Bush)
2004 Presidential Elections Results (%) - Other
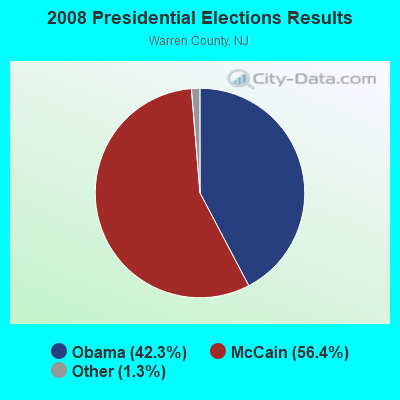
2008 Presidential Elections Results (%) - Democratic Party (Obama)
2008 Presidential Elections Results (%) - Republican Party (McCain)
2008 Presidential Elections Results (%) - Other
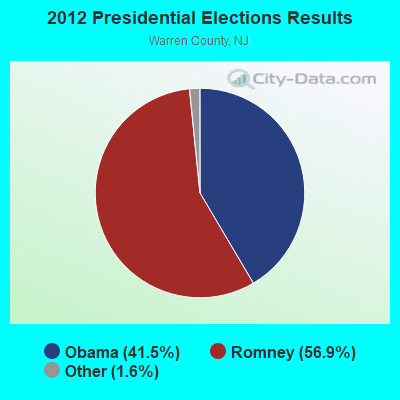
2012 Presidential Elections Results (%) - Democratic Party (Obama)
2012 Presidential Elections Results (%) - Republican Party (Romney)
2012 Presidential Elections Results (%) - Other
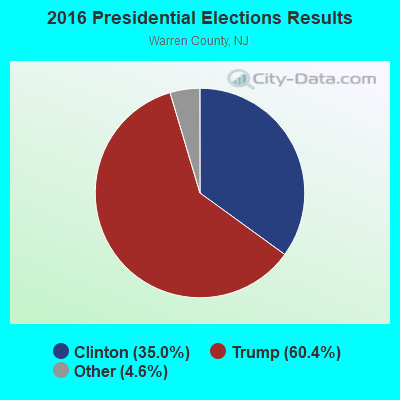
2016 Presidential Elections Results (%) - Democratic Party (Clinton)
2016 Presidential Elections Results (%) - Republican Party (Trump)
2016 Presidential Elections Results (%) - Other
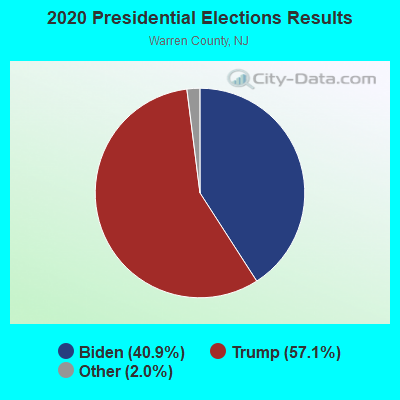
2020 Presidential Elections Results (%) - Democratic Party (Biden)
2020 Presidential Elections Results (%) - Republican Party (Trump)
2020 Presidential Elections Results (%) - Other
Ancestries Reported - Arab (%)
Ancestries Reported - Czech (%)
Ancestries Reported - Danish (%)
Ancestries Reported - Dutch (%)
Ancestries Reported - English (%)
Ancestries Reported - French (%)
Ancestries Reported - French Canadian (%)
Ancestries Reported - German (%)
Ancestries Reported - Greek (%)
Ancestries Reported - Hungarian (%)
Ancestries Reported - Irish (%)
Ancestries Reported - Italian (%)
Ancestries Reported - Lithuanian (%)
Ancestries Reported - Norwegian (%)
Ancestries Reported - Polish (%)
Ancestries Reported - Portuguese (%)
Ancestries Reported - Russian (%)
Ancestries Reported - Scotch-Irish (%)
Ancestries Reported - Scottish (%)
Ancestries Reported - Slovak (%)
Ancestries Reported - Subsaharan African (%)
Ancestries Reported - Swedish (%)
Ancestries Reported - Swiss (%)
Ancestries Reported - Ukrainian (%)
Ancestries Reported - United States (%)
Ancestries Reported - Welsh (%)
Ancestries Reported - West Indian (%)
Ancestries Reported - Other (%)
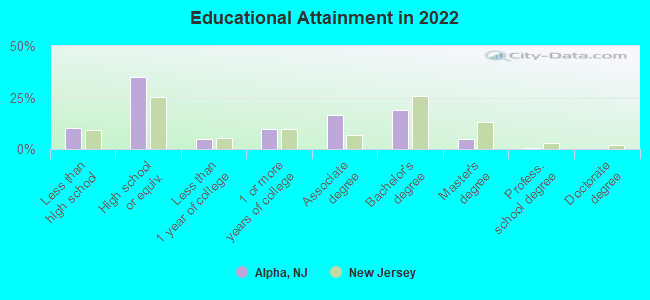
Educational Attainment - No schooling completed (%)
Educational Attainment - Less than high school (%)
Educational Attainment - High school or equivalent (%)
Educational Attainment - Less than 1 year of college (%)
Educational Attainment - 1 or more years of college (%)
Educational Attainment - Associate degree (%)
Educational Attainment - Bachelor's degree (%)
Educational Attainment - Master's degree (%)
Educational Attainment - Professional school degree (%)
Educational Attainment - Doctorate degree (%)
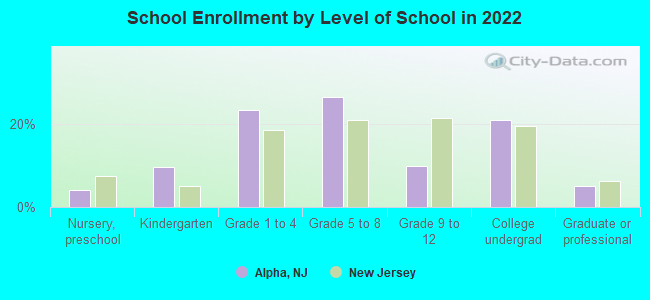
School Enrollment - Nursery, preschool (%)
School Enrollment - Kindergarten (%)
School Enrollment - Grade 1 to 4 (%)
School Enrollment - Grade 5 to 8 (%)
School Enrollment - Grade 9 to 12 (%)
School Enrollment - College undergrad (%)
School Enrollment - Graduate or professional (%)
School Enrollment - Not enrolled in school (%)
School enrollment - Public schools (%)
School enrollment - Private schools (%)
School enrollment - Not enrolled (%)
Median number of rooms in houses and condos
Median number of rooms in apartments
Housing units lacking complete plumbing facilities (%)
Housing units lacking complete kitchen facilities (%)
Density of houses
Urban houses (%)
Rural houses (%)
Households with people 60 years and over (%)
Households with people 65 years and over (%)
Households with people 75 years and over (%)
Households with one or more nonrelatives (%)
Households with no nonrelatives (%)
Population in households (%)
Family households (%)
Nonfamily households (%)
Population in families (%)
Family households with own children (%)
Median number of bedrooms in owner occupied houses
Mean number of bedrooms in owner occupied houses
Median number of bedrooms in renter occupied houses
Mean number of bedrooms in renter occupied houses
Median number of vehichles in owner occupied houses
Mean number of vehichles in owner occupied houses
Median number of vehichles in renter occupied houses
Mean number of vehichles in renter occupied houses
Mortgage status - with mortgage (%)
Mortgage status - with second mortgage (%)
Mortgage status - with home equity loan (%)
Mortgage status - with both second mortgage and home equity loan (%)
Mortgage status - without a mortgage (%)
Average family size
Average family size - White
Average family size - Black or African American
Average family size - Asian
Average family size - Hispanic or Latino
Average family size - American Indian and Alaska Native
Average family size - Multirace
Average family size - Other Race
Geographical mobility - Same house 1 year ago (%)
Geographical mobility - Moved within same county (%)
Geographical mobility - Moved from different county within same state (%)
Geographical mobility - Moved from different state (%)
Geographical mobility - Moved from abroad (%)
Place of birth - Born in state of residence (%)
Place of birth - Born in other state (%)
Place of birth - Native, outside of US (%)
Place of birth - Foreign born (%)
Housing units in structures - 1, detached (%)
Housing units in structures - 1, attached (%)
Housing units in structures - 2 (%)
Housing units in structures - 3 or 4 (%)
Housing units in structures - 5 to 9 (%)
Housing units in structures - 10 to 19 (%)
Housing units in structures - 20 to 49 (%)
Housing units in structures - 50 or more (%)
Housing units in structures - Mobile home (%)
Housing units in structures - Boat, RV, van, etc. (%)
House/condo owner moved in on average (years ago)
Renter moved in on average (years ago)
Year householder moved into unit - Moved in 1999 to March 2000 (%)
Year householder moved into unit - Moved in 1995 to 1998 (%)
Year householder moved into unit - Moved in 1990 to 1994 (%)
Year householder moved into unit - Moved in 1980 to 1989 (%)
Year householder moved into unit - Moved in 1970 to 1979 (%)
Year householder moved into unit - Moved in 1969 or earlier (%)
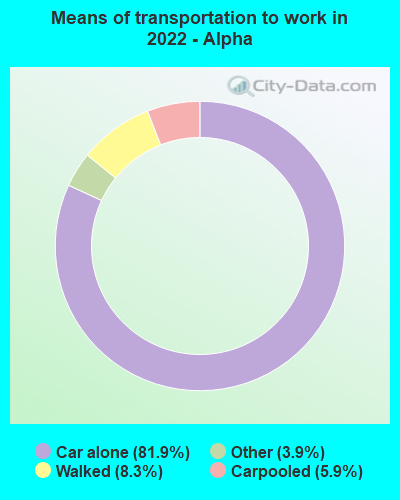
Means of transportation to work - Drove car alone (%)
Means of transportation to work - Carpooled (%)
Means of transportation to work - Public transportation (%)
Means of transportation to work - Bus or trolley bus (%)
Means of transportation to work - Streetcar or trolley car (%)
Means of transportation to work - Subway or elevated (%)
Means of transportation to work - Railroad (%)
Means of transportation to work - Ferryboat (%)
Means of transportation to work - Taxicab (%)
Means of transportation to work - Motorcycle (%)
Means of transportation to work - Bicycle (%)
Means of transportation to work - Walked (%)
Means of transportation to work - Other means (%)
Working at home (%)
Industry diversity
Most Common Industries - Agriculture, forestry, fishing and hunting, and mining (%)
Most Common Industries - Agriculture, forestry, fishing and hunting (%)
Most Common Industries - Mining, quarrying, and oil and gas extraction (%)
Most Common Industries - Construction (%)
Most Common Industries - Manufacturing (%)
Most Common Industries - Wholesale trade (%)
Most Common Industries - Retail trade (%)
Most Common Industries - Transportation and warehousing, and utilities (%)
Most Common Industries - Transportation and warehousing (%)
Most Common Industries - Utilities (%)
Most Common Industries - Information (%)
Most Common Industries - Finance and insurance, and real estate and rental and leasing (%)
Most Common Industries - Finance and insurance (%)
Most Common Industries - Real estate and rental and leasing (%)
Most Common Industries - Professional, scientific, and management, and administrative and waste management services (%)
Most Common Industries - Professional, scientific, and technical services (%)
Most Common Industries - Management of companies and enterprises (%)
Most Common Industries - Administrative and support and waste management services (%)
Most Common Industries - Educational services, and health care and social assistance (%)
Most Common Industries - Educational services (%)
Most Common Industries - Health care and social assistance (%)
Most Common Industries - Arts, entertainment, and recreation, and accommodation and food services (%)
Most Common Industries - Arts, entertainment, and recreation (%)
Most Common Industries - Accommodation and food services (%)
Most Common Industries - Other services, except public administration (%)
Most Common Industries - Public administration (%)
Occupation diversity
Most Common Occupations - Management, business, science, and arts occupations (%)
Most Common Occupations - Management, business, and financial occupations (%)
Most Common Occupations - Management occupations (%)
Most Common Occupations - Business and financial operations occupations (%)
Most Common Occupations - Computer, engineering, and science occupations (%)
Most Common Occupations - Computer and mathematical occupations (%)
Most Common Occupations - Architecture and engineering occupations (%)
Most Common Occupations - Life, physical, and social science occupations (%)
Most Common Occupations - Education, legal, community service, arts, and media occupations (%)
Most Common Occupations - Community and social service occupations (%)
Most Common Occupations - Legal occupations (%)
Most Common Occupations - Education, training, and library occupations (%)
Most Common Occupations - Arts, design, entertainment, sports, and media occupations (%)
Most Common Occupations - Healthcare practitioners and technical occupations (%)
Most Common Occupations - Health diagnosing and treating practitioners and other technical occupations (%)
Most Common Occupations - Health technologists and technicians (%)
Most Common Occupations - Service occupations (%)
Most Common Occupations - Healthcare support occupations (%)
Most Common Occupations - Protective service occupations (%)
Most Common Occupations - Fire fighting and prevention, and other protective service workers including supervisors (%)
Most Common Occupations - Law enforcement workers including supervisors (%)
Most Common Occupations - Food preparation and serving related occupations (%)
Most Common Occupations - Building and grounds cleaning and maintenance occupations (%)
Most Common Occupations - Personal care and service occupations (%)
Most Common Occupations - Sales and office occupations (%)
Most Common Occupations - Sales and related occupations (%)
Most Common Occupations - Office and administrative support occupations (%)
Most Common Occupations - Natural resources, construction, and maintenance occupations (%)
Most Common Occupations - Farming, fishing, and forestry occupations (%)
Most Common Occupations - Construction and extraction occupations (%)
Most Common Occupations - Installation, maintenance, and repair occupations (%)
Most Common Occupations - Production, transportation, and material moving occupations (%)
Most Common Occupations - Production occupations (%)
Most Common Occupations - Transportation occupations (%)
Most Common Occupations - Material moving occupations (%)
People in Group quarters - Institutionalized population (%)
People in Group quarters - Correctional institutions (%)
People in Group quarters - Federal prisons and detention centers (%)
People in Group quarters - Halfway houses (%)
People in Group quarters - Local jails and other confinement facilities (including police lockups) (%)
People in Group quarters - Military disciplinary barracks (%)
People in Group quarters - State prisons (%)
People in Group quarters - Other types of correctional institutions (%)
People in Group quarters - Nursing homes (%)
People in Group quarters - Hospitals/wards, hospices, and schools for the handicapped (%)
People in Group quarters - Hospitals/wards and hospices for chronically ill (%)
People in Group quarters - Hospices or homes for chronically ill (%)
People in Group quarters - Military hospitals or wards for chronically ill (%)
People in Group quarters - Other hospitals or wards for chronically ill (%)
People in Group quarters - Hospitals or wards for drug/alcohol abuse (%)
People in Group quarters - Mental (Psychiatric) hospitals or wards (%)
People in Group quarters - Schools, hospitals, or wards for the mentally retarded (%)
People in Group quarters - Schools, hospitals, or wards for the physically handicapped (%)
People in Group quarters - Institutions for the deaf (%)
People in Group quarters - Institutions for the blind (%)
People in Group quarters - Orthopedic wards and institutions for the physically handicapped (%)
People in Group quarters - Wards in general hospitals for patients who have no usual home elsewhere (%)
People in Group quarters - Wards in military hospitals for patients who have no usual home elsewhere (%)
People in Group quarters - Juvenile institutions (%)
People in Group quarters - Long-term care (%)
People in Group quarters - Homes for abused, dependent, and neglected children (%)
People in Group quarters - Residential treatment centers for emotionally disturbed children (%)
People in Group quarters - Training schools for juvenile delinquents (%)
People in Group quarters - Short-term care, detention or diagnostic centers for delinquent children (%)
People in Group quarters - Type of juvenile institution unknown (%)
People in Group quarters - Noninstitutionalized population (%)
People in Group quarters - College dormitories (includes college quarters off campus) (%)
People in Group quarters - Military quarters (%)
People in Group quarters - On base (%)
People in Group quarters - Barracks, unaccompanied personnel housing (UPH), (Enlisted/Officer), ;and similar group living quarters for military personnel (%)
People in Group quarters - Transient quarters for temporary residents (%)
People in Group quarters - Military ships (%)
People in Group quarters - Group homes (%)
People in Group quarters - Homes or halfway houses for drug/alcohol abuse (%)
People in Group quarters - Homes for the mentally ill (%)
People in Group quarters - Homes for the mentally retarded (%)
People in Group quarters - Homes for the physically handicapped (%)
People in Group quarters - Other group homes (%)
People in Group quarters - Religious group quarters (%)
People in Group quarters - Dormitories (%)
People in Group quarters - Agriculture workers' dormitories on farms (%)
People in Group quarters - Job Corps and vocational training facilities (%)
People in Group quarters - Other workers' dormitories (%)
People in Group quarters - Crews of maritime vessels (%)
People in Group quarters - Other nonhousehold living situations (%)
People in Group quarters - Other noninstitutional group quarters (%)
Residents speaking English at home (%)
Residents speaking English at home - Born in the United States (%)
Residents speaking English at home - Native, born elsewhere (%)
Residents speaking English at home - Foreign born (%)
Residents speaking Spanish at home (%)
Residents speaking Spanish at home - Born in the United States (%)
Residents speaking Spanish at home - Native, born elsewhere (%)
Residents speaking Spanish at home - Foreign born (%)
Residents speaking other language at home (%)
Residents speaking other language at home - Born in the United States (%)
Residents speaking other language at home - Native, born elsewhere (%)
Residents speaking other language at home - Foreign born (%)
Class of Workers - Employee of private company (%)
Class of Workers - Self-employed in own incorporated business (%)
Class of Workers - Private not-for-profit wage and salary workers (%)
Class of Workers - Local government workers (%)
Class of Workers - State government workers (%)
Class of Workers - Federal government workers (%)
Class of Workers - Self-employed workers in own not incorporated business and Unpaid family workers (%)
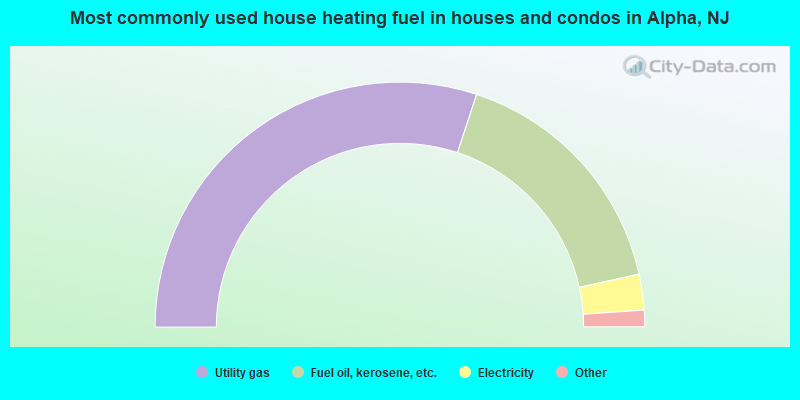
House heating fuel used in houses and condos - Utility gas (%)
House heating fuel used in houses and condos - Bottled, tank, or LP gas (%)
House heating fuel used in houses and condos - Electricity (%)
House heating fuel used in houses and condos - Fuel oil, kerosene, etc. (%)
House heating fuel used in houses and condos - Coal or coke (%)
House heating fuel used in houses and condos - Wood (%)
House heating fuel used in houses and condos - Solar energy (%)
House heating fuel used in houses and condos - Other fuel (%)
House heating fuel used in houses and condos - No fuel used (%)
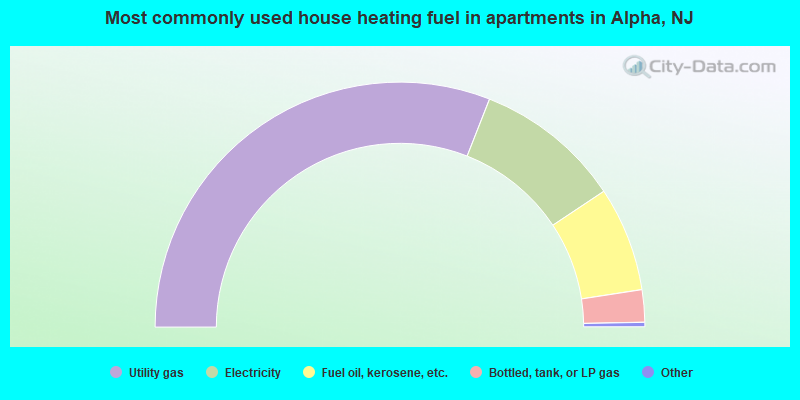
House heating fuel used in apartments - Utility gas (%)
House heating fuel used in apartments - Bottled, tank, or LP gas (%)
House heating fuel used in apartments - Electricity (%)
House heating fuel used in apartments - Fuel oil, kerosene, etc. (%)
House heating fuel used in apartments - Coal or coke (%)
House heating fuel used in apartments - Wood (%)
House heating fuel used in apartments - Solar energy (%)
House heating fuel used in apartments - Other fuel (%)
House heating fuel used in apartments - No fuel used (%)
Armed forces status - In Armed Forces (%)
Armed forces status - Civilian (%)
Armed forces status - Civilian - Veteran (%)
Armed forces status - Civilian - Nonveteran (%)
Fatal accidents locations in years 2005-2021
Fatal accidents locations in 2005
Fatal accidents locations in 2006
Fatal accidents locations in 2007
Fatal accidents locations in 2008
Fatal accidents locations in 2009
Fatal accidents locations in 2010
Fatal accidents locations in 2011
Fatal accidents locations in 2012
Fatal accidents locations in 2013
Fatal accidents locations in 2014
Fatal accidents locations in 2015
Fatal accidents locations in 2016
Fatal accidents locations in 2017
Fatal accidents locations in 2018
Fatal accidents locations in 2019
Fatal accidents locations in 2020
Fatal accidents locations in 2021
Alcohol use - People drinking some alcohol every month (%)
Alcohol use - People not drinking at all (%)
Alcohol use - Average days/month drinking alcohol
Alcohol use - Average drinks/week
Alcohol use - Average days/year people drink much
Audiometry - Average condition of hearing (%)
Audiometry - People that can hear a whisper from across a quiet room (%)
Audiometry - People that can hear normal voice from across a quiet room (%)
Audiometry - Ears ringing, roaring, buzzing (%)
Audiometry - Had a job exposure to loud noise (%)
Audiometry - Had off-work exposure to loud noise (%)
Blood Pressure & Cholesterol - Has high blood pressure (%)
Blood Pressure & Cholesterol - Checking blood pressure at home (%)
Blood Pressure & Cholesterol - Frequently checking blood cholesterol (%)
Blood Pressure & Cholesterol - Has high cholesterol level (%)
Consumer Behavior - Money monthly spent on food at supermarket/grocery store
Consumer Behavior - Money monthly spent on food at other stores
Consumer Behavior - Money monthly spent on eating out
Consumer Behavior - Money monthly spent on carryout/delivered foods
Consumer Behavior - Income spent on food at supermarket/grocery store (%)
Consumer Behavior - Income spent on food at other stores (%)
Consumer Behavior - Income spent on eating out (%)
Consumer Behavior - Income spent on carryout/delivered foods (%)
Current Health Status - General health condition (%)
Current Health Status - Blood donors (%)
Current Health Status - Has blood ever tested for HIV virus (%)
Current Health Status - Left-handed people (%)
Dermatology - People using sunscreen (%)
Diabetes - Diabetics (%)
Diabetes - Had a blood test for high blood sugar (%)
Diabetes - People taking insulin (%)
Diet Behavior & Nutrition - Diet health (%)
Diet Behavior & Nutrition - Milk product consumption (# of products/month)
Diet Behavior & Nutrition - Meals not home prepared (#/week)
Diet Behavior & Nutrition - Meals from fast food or pizza place (#/week)
Diet Behavior & Nutrition - Ready-to-eat foods (#/month)
Diet Behavior & Nutrition - Frozen meals/pizza (#/month)
Drug Use - People that ever used marijuana or hashish (%)
Drug Use - Ever used hard drugs (%)
Drug Use - Ever used any form of cocaine (%)
Drug Use - Ever used heroin (%)
Drug Use - Ever used methamphetamine (%)
Health Insurance - People covered by health insurance (%)
Kidney Conditions-Urology - Avg. # of times urinating at night
Medical Conditions - People with asthma (%)
Medical Conditions - People with anemia (%)
Medical Conditions - People with psoriasis (%)
Medical Conditions - People with overweight (%)
Medical Conditions - Elderly people having difficulties in thinking or remembering (%)
Medical Conditions - People who ever received blood transfusion (%)
Medical Conditions - People having trouble seeing even with glass/contacts (%)
Medical Conditions - People with arthritis (%)
Medical Conditions - People with gout (%)
Medical Conditions - People with congestive heart failure (%)
Medical Conditions - People with coronary heart disease (%)
Medical Conditions - People with angina pectoris (%)
Medical Conditions - People who ever had heart attack (%)
Medical Conditions - People who ever had stroke (%)
Medical Conditions - People with emphysema (%)
Medical Conditions - People with thyroid problem (%)
Medical Conditions - People with chronic bronchitis (%)
Medical Conditions - People with any liver condition (%)
Medical Conditions - People who ever had cancer or malignancy (%)
Mental Health - People who have little interest in doing things (%)
Mental Health - People feeling down, depressed, or hopeless (%)
Mental Health - People who have trouble sleeping or sleeping too much (%)
Mental Health - People feeling tired or having little energy (%)
Mental Health - People with poor appetite or overeating (%)
Mental Health - People feeling bad about themself (%)
Mental Health - People who have trouble concentrating on things (%)
Mental Health - People moving or speaking slowly or too fast (%)
Mental Health - People having thoughts they would be better off dead (%)
Oral Health - Average years since last visit a dentist
Oral Health - People embarrassed because of mouth (%)
Oral Health - People with gum disease (%)
Oral Health - General health of teeth and gums (%)
Oral Health - Average days a week using dental floss/device
Oral Health - Average days a week using mouthwash for dental problem
Oral Health - Average number of teeth
Pesticide Use - Households using pesticides to control insects (%)
Pesticide Use - Households using pesticides to kill weeds (%)
Physical Activity - People doing vigorous-intensity work activities (%)
Physical Activity - People doing moderate-intensity work activities (%)
Physical Activity - People walking or bicycling (%)
Physical Activity - People doing vigorous-intensity recreational activities (%)
Physical Activity - People doing moderate-intensity recreational activities (%)
Physical Activity - Average hours a day doing sedentary activities
Physical Activity - Average hours a day watching TV or videos
Physical Activity - Average hours a day using computer
Physical Functioning - People having limitations keeping them from working (%)
Physical Functioning - People limited in amount of work they can do (%)
Physical Functioning - People that need special equipment to walk (%)
Physical Functioning - People experiencing confusion/memory problems (%)
Physical Functioning - People requiring special healthcare equipment (%)
Prescription Medications - Average number of prescription medicines taking
Preventive Aspirin Use - Adults 40+ taking low-dose aspirin (%)
Reproductive Health - Vaginal deliveries (%)
Reproductive Health - Cesarean deliveries (%)
Reproductive Health - Deliveries resulted in a live birth (%)
Reproductive Health - Pregnancies resulted in a delivery (%)
Reproductive Health - Women breastfeeding newborns (%)
Reproductive Health - Women that had a hysterectomy (%)
Reproductive Health - Women that had both ovaries removed (%)
Reproductive Health - Women that have ever taken birth control pills (%)
Reproductive Health - Women taking birth control pills (%)
Reproductive Health - Women that have ever used Depo-Provera or injectables (%)
Reproductive Health - Women that have ever used female hormones (%)
Sexual Behavior - People 18+ that ever had sex (vaginal, anal, or oral) (%)
Sexual Behavior - Males 18+ that ever had vaginal sex with a woman (%)
Sexual Behavior - Males 18+ that ever performed oral sex on a woman (%)
Sexual Behavior - Males 18+ that ever had anal sex with a woman (%)
Sexual Behavior - Males 18+ that ever had any sex with a man (%)
Sexual Behavior - Females 18+ that ever had vaginal sex with a man (%)
Sexual Behavior - Females 18+ that ever performed oral sex on a man (%)
Sexual Behavior - Females 18+ that ever had anal sex with a man (%)
Sexual Behavior - Females 18+ that ever had any kind of sex with a woman (%)
Sexual Behavior - Average age people first had sex
Sexual Behavior - Average number of female sex partners in lifetime (males 18+)
Sexual Behavior - Average number of female vaginal sex partners in lifetime (males 18+)
Sexual Behavior - Average age people first performed oral sex on a woman (18+)
Sexual Behavior - Average number of woman performed oral sex on in lifetime (18+)
Sexual Behavior - Average number of male sex partners in lifetime (males 18+)
Sexual Behavior - Average number of male anal sex partners in lifetime (males 18+)
Sexual Behavior - Average age people first performed oral sex on a man (18+)
Sexual Behavior - Average number of male oral sex partners in lifetime (18+)
Sexual Behavior - People using protection when performing oral sex (%)
Sexual Behavior - Average number of times people have vaginal or anal sex a year
Sexual Behavior - People having sex without condom (%)
Sexual Behavior - Average number of male sex partners in lifetime (females 18+)
Sexual Behavior - Average number of male vaginal sex partners in lifetime (females 18+)
Sexual Behavior - Average number of female sex partners in lifetime (females 18+)
Sexual Behavior - Circumcised males 18+ (%)
Sleep Disorders - Average hours sleeping at night
Sleep Disorders - People that has trouble sleeping (%)
Smoking-Cigarette Use - People smoking cigarettes (%)
Taste & Smell - People 40+ having problems with smell (%)
Taste & Smell - People 40+ having problems with taste (%)
Taste & Smell - People 40+ that ever had wisdom teeth removed (%)
Taste & Smell - People 40+ that ever had tonsils teeth removed (%)
Taste & Smell - People 40+ that ever had a loss of consciousness because of a head injury (%)
Taste & Smell - People 40+ that ever had a broken nose or other serious injury to face or skull (%)
Taste & Smell - People 40+ that ever had two or more sinus infections (%)
Weight - Average height (inches)
Weight - Average weight (pounds)
Weight - Average BMI
Weight - People that are obese (%)
Weight - People that ever were obese (%)
Weight - People trying to lose weight (%)
Officers per 1,000 residents here:
16.10New Jersey average:
3.39
Latest news from Alpha, NJ collected exclusively by city-data.com from local newspapers, TV, and radio stations
Ancestries: German (17.5%), Hungarian (14.1%), Italian (10.8%), Irish (7.3%), English (6.2%), American (5.3%).
Current Local Time:
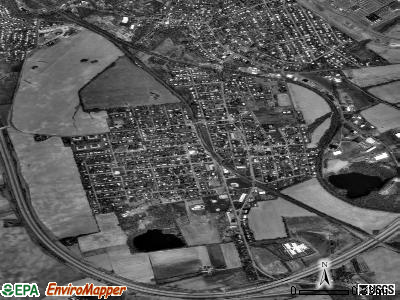
Land area: 1.70 square miles.
Population density: 1,381 people per square mile (low).
129 residents are foreign born (4.0% Latin America , 0.8% Asia ).
This borough:
5.7%New Jersey:
23.2%
Median real estate property taxes paid for housing units with mortgages in 2022: $5,949 (2.1%)Median real estate property taxes paid for housing units with no mortgage in 2022: $6,131 (2.7%)
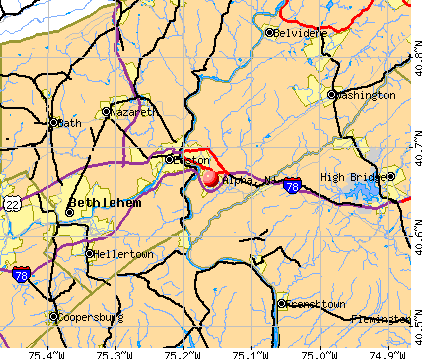
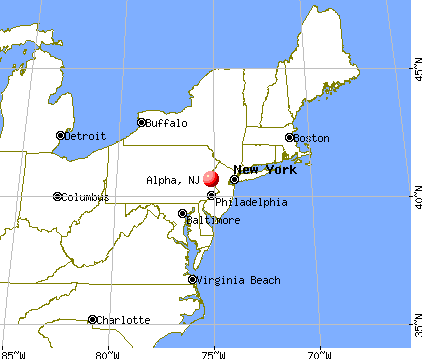
Nearest city with pop. 50,000+: Bethlehem, PA
Nearest city with pop. 200,000+: Philadelphia, PA
Nearest cities:
Latitude: 40.66 N, Longitude: 75.16 W
Unemployment in December 2023:
Population change in the 1990s: +86 (+3.6%).
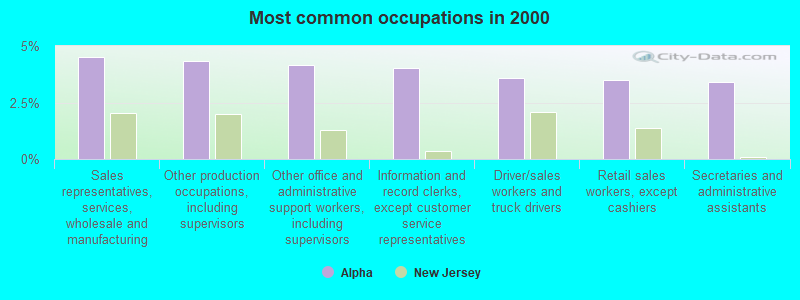
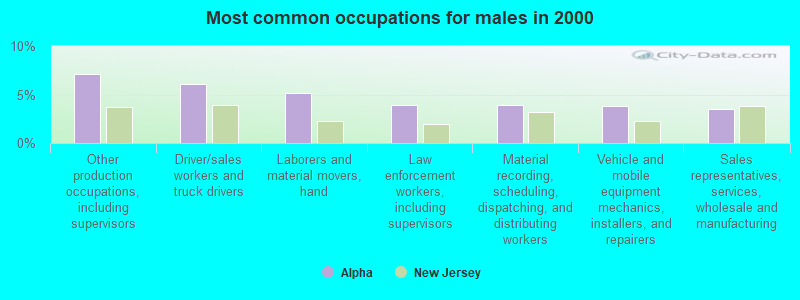
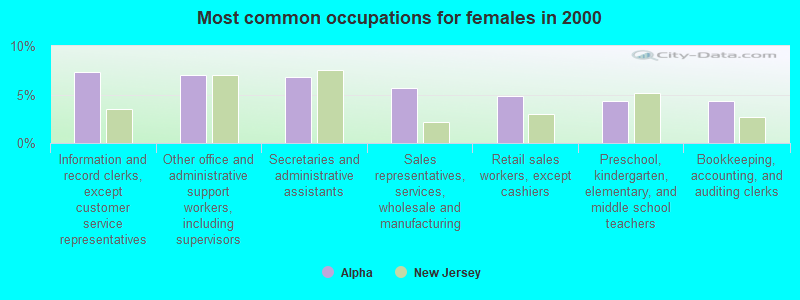
Most common occupations in Alpha, NJ (%)
Both Males Females
Sales representatives, services, wholesale and manufacturing (4.5%)
Other production occupations, including supervisors (4.3%)
Other office and administrative support workers, including supervisors (4.2%)
Information and record clerks, except customer service representatives (4.0%)
Driver/sales workers and truck drivers (3.6%)
Retail sales workers, except cashiers (3.5%)
Secretaries and administrative assistants (3.4%)
Other production occupations, including supervisors (7.1%)
Driver/sales workers and truck drivers (6.1%)
Laborers and material movers, hand (5.2%)
Law enforcement workers, including supervisors (3.9%)
Material recording, scheduling, dispatching, and distributing workers (3.9%)
Vehicle and mobile equipment mechanics, installers, and repairers (3.8%)
Sales representatives, services, wholesale and manufacturing (3.5%)
Information and record clerks, except customer service representatives (7.3%)
Other office and administrative support workers, including supervisors (7.0%)
Secretaries and administrative assistants (6.8%)
Sales representatives, services, wholesale and manufacturing (5.7%)
Retail sales workers, except cashiers (4.8%)
Preschool, kindergarten, elementary, and middle school teachers (4.3%)
Bookkeeping, accounting, and auditing clerks (4.3%)
Tornado activity:
Alpha-area historical tornado activity is slightly above New Jersey state average. It is 7% smaller than the overall U.S. average.
On 7/26/1981, a category F3 (max. wind speeds 158-206 mph) tornado 21.1 miles away from the Alpha borough center injured 2 people and caused between $50,000 and $500,000 in damages.
On 3/21/1976, a category F3 tornado 21.9 miles away from the borough center caused between $500,000 and $5,000,000 in damages.
Earthquake activity:
Alpha-area historical earthquake activity is significantly above New Jersey state average. It is 66% smaller than the overall U.S. average. On 8/23/2011 at 17:51:04, a magnitude 5.8 (5.8 MW, Depth: 3.7 mi, Class: Moderate, Intensity: VI - VII) earthquake occurred 241.6 miles away from the city center On 1/16/1994 at 01:49:16, a magnitude 4.6 (4.6 MB, 4.6 LG, Depth: 3.1 mi, Class: Light, Intensity: IV - V) earthquake occurred 51.6 miles away from Alpha center On 10/7/1983 at 10:18:46, a magnitude 5.3 (5.1 MB, 5.3 LG, 5.1 ML) earthquake occurred 231.3 miles away from the city center On 1/16/1994 at 00:42:43, a magnitude 4.2 (4.2 MB, 4.0 LG, Depth: 3.1 mi) earthquake occurred 50.3 miles away from the city center On 4/20/2002 at 10:50:47, a magnitude 5.3 (5.3 ML, Depth: 3.0 mi) earthquake occurred 276.4 miles away from Alpha center On 4/20/2002 at 10:50:47, a magnitude 5.2 (5.2 MB, 4.2 MS, 5.2 MW, 5.0 MW) earthquake occurred 274.4 miles away from the city center Magnitude types: regional Lg-wave magnitude (LG), body-wave magnitude (MB), local magnitude (ML), surface-wave magnitude (MS), moment magnitude (MW) Natural disasters: The number of natural disasters in Warren County (22) is greater than the US average (15).Major Disasters (Presidential) Declared: 13Emergencies Declared: 9Hurricanes: 6, Floods: 4, Storms: 4, Blizzards: 2, Snowstorms: 2, Water Shortages: 2, Heavy Rain: 1, Tropical Depression: 1, Tropical Storm: 1, Winter Storm: 1, Other: 3 (Note: some incidents may be assigned to more than one category). Hospitals and medical centers near Alpha: PHILLIPSBURG CENTER (Nursing Home, about 2 miles away; PHILLIPSBURG, NJ)
FMC PHILLIPSBURG DIALYSIS CTR (Dialysis Facility, about 2 miles away; PHILLIPSBURG, NJ)
KAQ HOME CARE, INC (Home Health Center, about 3 miles away; PHILLIPSBURG, NJ)
ST LUKE'S WARREN HOSPITAL (about 3 miles away; PHILLIPSBURG, NJ)
BRAKELEY PARK CENTER (Nursing Home, about 3 miles away; PHILLIPSBURG, NJ)
LOPATCONG CENTER (Nursing Home, about 3 miles away; PHILLIPSBURG, NJ)
LEADER NSG AND REHAB EASTON (Nursing Home, about 4 miles away; EASTON, PA)
Colleges/universities with over 2000 students nearest to Alpha:
Lafayette College (about 4 miles; Easton, PA ; Full-time enrollment: 2,562)
Northampton County Area Community College (about 9 miles; Bethlehem, PA ; FT enrollment: 7,195)
Lehigh University (about 13 miles; Bethlehem, PA ; FT enrollment: 6,565)
DeSales University (about 15 miles; Center Valley, PA ; FT enrollment: 2,862)
Muhlenberg College (about 19 miles; Allentown, PA ; FT enrollment: 2,792)
Centenary College (about 22 miles; Hackettstown, NJ ; FT enrollment: 2,271)
East Stroudsburg University of Pennsylvania (about 23 miles; East Stroudsburg, PA ; FT enrollment: 6,195)
Public elementary/middle school in Alpha:
See full list of schools located in Alpha Library in Alpha: W.H. WALTERS FREE PUBLIC LIBRARY Operating income: $126,238; Location: 1001 EAST BLVD; 21,181 books ; 1,222 audio materials ; 1,281 video materials ; 33 state licensed databases ; 5 other licensed databases ; 51 print serial subscriptions )
Birthplace of: Joe Buzas - Baseball player.
Warren County has a predicted average indoor radon screening level greater than 4 pCi/L (pico curies per liter) - Highest Potential Drinking water stations with addresses in Alpha and their reported violations in the past:
ALPHA MUNICIPAL WATER WORKS (Population served: 2,530, Groundwater):
Past health violations:
MCL, Monthly (TCR) - In OCT-2011, Contaminant: Coliform. Follow-up actions: St Public Notif received (OCT-24-2011), St Public Notif requested (OCT-27-2011), St Formal NOV issued (OCT-27-2011), St Compliance achieved (NOV-29-2011)
MCL, Monthly (TCR) - In AUG-2011, Contaminant: Coliform. Follow-up actions: St Public Notif requested (AUG-15-2011), St Formal NOV issued (AUG-15-2011), St Compliance achieved (NOV-29-2011)
Public Education - In JAN-01-2007, Contaminant: Lead and Copper Rule. Follow-up actions: St Compliance achieved (NOV-29-2007), St Admin Penalty assessed (SEP-11-2010)
Public Education - In JAN-01-2006, Contaminant: Lead and Copper Rule. Follow-up actions: St Compliance achieved (NOV-29-2007), St Admin Penalty assessed (SEP-11-2010)
Past monitoring violations:
Monitoring, Source Water (GWR) - Between OCT-28-2011 and JUL-17-2012, Contaminant: E. COLI. Follow-up actions: St Public Notif requested (JUN-12-2012), St Formal NOV issued (JUN-12-2012), St Compliance achieved (JUL-17-2012), St Public Notif received (SEP-12-2012)
Follow-up Or Routine LCR Tap M/R - In JAN-01-2007, Contaminant: Lead and Copper Rule. Follow-up actions: St Compliance achieved (JUN-25-2007), St Formal NOV issued (FEB-25-2009), St Admin Penalty assessed (SEP-11-2010), St Compliance achieved (OCT-07-2010)
Water Quality Parameter M/R - Between JAN-2007 and DEC-2007, Contaminant: Lead and Copper Rule. Follow-up actions: St Admin Penalty assessed (SEP-11-2010), St Compliance achieved (OCT-07-2010)
Monitoring and Reporting (DBP) - Between JAN-2006 and DEC-2006, Contaminant: TTHM. Follow-up actions: St Public Notif requested (DEC-02-2009), St Formal NOV issued (DEC-02-2009), St Admin Penalty assessed (SEP-11-2010), St Compliance achieved (OCT-07-2010)
Water Quality Parameter M/R - Between JAN-2006 and DEC-2006, Contaminant: Lead and Copper Rule. Follow-up actions: St Admin Penalty assessed (SEP-11-2010), St Compliance achieved (OCT-07-2010)
4 other older monitoring violations
Average household size: This borough:
2.5 peopleNew Jersey:
2.7 people
Percentage of family households: This borough:
65.6%Whole state:
69.3%
Percentage of households with unmarried partners: This borough:
7.7%Whole state:
5.9%
Likely homosexual households (counted as self-reported same-sex unmarried-partner households)
Lesbian couples: 0.1% of all households Gay men: 0.0% of all households
7 people in group homes intended for adults in 2010people in other noninstitutional facilities in 2010people in homes for the mentally retarded in 2000people in religious group quarters in 2000
Banks with branches in Alpha (2011 data):
PNC Bank, National Association: Alpha Branch at 331 3rd Avenue, branch established on 1964/08/01. Info updated 2012/03/20: Bank assets: $263,309.6 mil, Deposits: $197,343.0 mil, headquarters in Wilmington, DE, positive income , Commercial Lending Specialization, 3085 total offices , Holding Company: Pnc Financial Services Group, Inc., The
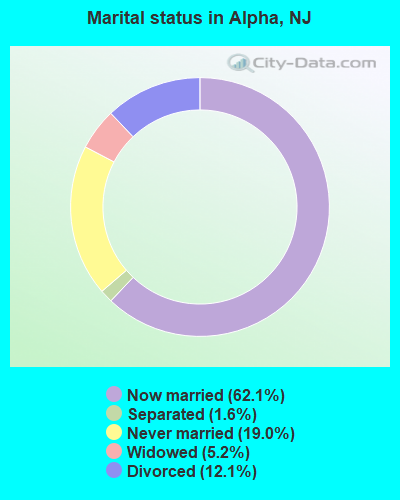
For population 15 years and over in Alpha:
Never married: 19.0%Now married: 62.1%Separated: 1.6%Widowed: 5.2%Divorced: 12.1% For population 25 years and over in Alpha:
High school or higher: 89.3%Bachelor's degree or higher: 21.4%Graduate or professional degree: 5.0%Unemployed: 5.7%Mean travel time to work (commute): 24.8 minutes
Education Gini index (Inequality in education) Here:
11.4New Jersey average:
12.8
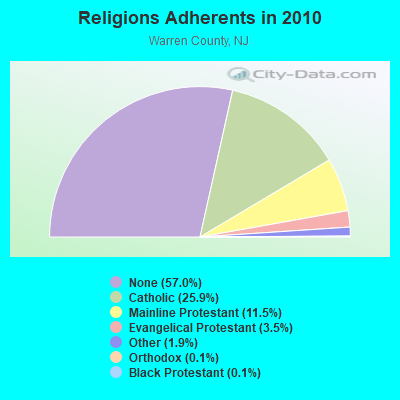
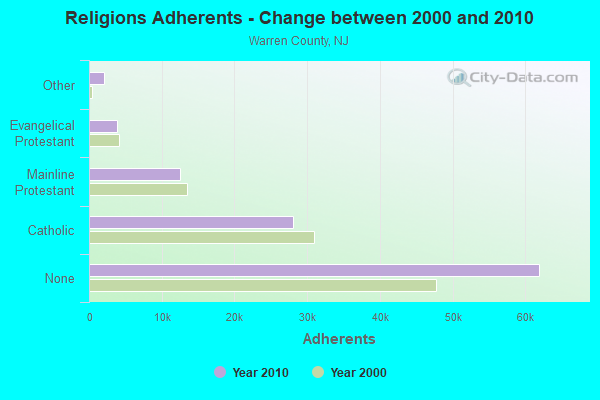
Religion statistics for Alpha, NJ (based on Warren County data)
Religion Adherents Congregations Catholic 28,114 11 Mainline Protestant 12,512 49 Evangelical Protestant 3,805 32 Other 2,040 10 Orthodox 150 2 Black Protestant 122 1 None 61,949 -
Source: Clifford Grammich, Kirk Hadaway, Richard Houseal, Dale E.Jones, Alexei Krindatch, Richie Stanley and Richard H.Taylor. 2012. 2010 U.S.Religion Census: Religious Congregations & Membership Study. Association of Statisticians of American Religious Bodies. Jones, Dale E., et al. 2002. Congregations and Membership in the United States 2000. Nashville, TN: Glenmary Research Center. Graphs represent county-level data
Food Environment Statistics: Number of grocery stores : 25Warren County :
2.28 / 10,000 pop.New Jersey :
2.90 / 10,000 pop.
Number of convenience stores (no gas) : 21Warren County :
1.92 / 10,000 pop.New Jersey :
1.76 / 10,000 pop.
Number of convenience stores (with gas) : 14Warren County :
1.28 / 10,000 pop.State :
0.81 / 10,000 pop.
Number of full-service restaurants : 67Here :
6.12 / 10,000 pop.State :
7.15 / 10,000 pop.
Adult diabetes rate : This county :
8.4%New Jersey :
8.3%
Adult obesity rate : Warren County :
26.9%New Jersey :
23.3%
Low-income preschool obesity rate : This county :
14.1%State :
18.0%
Health and Nutrition: Healthy diet rate : Alpha:
48.8%New Jersey:
50.6%
Average overall health of teeth and gums : This city:
45.1%New Jersey:
48.5%
Average BMI : Alpha:
29.1New Jersey:
28.5
People feeling badly about themselves : People not drinking alcohol at all : Alpha:
11.2%New Jersey:
11.1%
Average hours sleeping at night : Overweight people : This city:
35.6%New Jersey:
33.6%
General health condition : Alpha:
54.9%New Jersey:
56.9%
Average condition of hearing : More about Health and Nutrition of Alpha, NJ Residents
Local government employment and payroll (March 2022)
Function
Full-time employees
Monthly full-time payroll
Average yearly full-time wage
Part-time employees
Monthly part-time payroll
Streets and Highways
3 $21,267 $85,068 0 $0 Financial Administration
1 $7,607 $91,284 0 $0 Other Government Administration
1 $6,884 $82,608 4 $1,873 Health
0 $0 1 $1,074 Parks and Recreation
0 $0 4 $4,095 Police Protection - Officers
0 $0 9 $3,120 Sewerage
0 $0 4 $2,682 Water Supply
0 $0 4 $3,070 Judicial and Legal
0 $0 26 $17,200 Police - Other
0 $0 3 $1,532
Totals for Government
5 $35,758 $85,819 55 $34,646
Alpha government finances - Expenditure in 2017 (per resident):
Construction - Regular Highways: $394,000 ($168.09)
Water Utilities: $308,000 ($131.40)General Public Buildings: $25,000 ($10.67)Current Operations - Sewerage: $605,000 ($258.11)
General - Other: $525,000 ($223.98)Water Utilities: $257,000 ($109.64)Solid Waste Management: $235,000 ($100.26)Central Staff Services: $202,000 ($86.18)Regular Highways: $160,000 ($68.26)Financial Administration: $154,000 ($65.70)Libraries: $92,000 ($39.25)Judicial and Legal Services: $86,000 ($36.69)Parks and Recreation: $48,000 ($20.48)General Public Buildings: $38,000 ($16.21)Protective Inspection and Regulation - Other: $34,000 ($14.51)Local Fire Protection: $33,000 ($14.08)Health - Other: $26,000 ($11.09)Police Protection: $9,000 ($3.84)General - Interest on Debt: $11,000 ($4.69)
Intergovernmental to Local - Other - Police Protection: $564,000 ($240.61)
Other Capital Outlay - Local Fire Protection: $45,000 ($19.20)
Solid Waste Management: $1,000 ($0.43)Total Salaries and Wages: $557,000 ($237.63)
Water Utilities - Interest on Debt: $18,000 ($7.68)
Alpha government finances - Revenue in 2017 (per resident):
Charges - Sewerage: $584,000 ($249.15)
Other: $23,000 ($9.81)Local Intergovernmental - Sewerage: $100,000 ($42.66)
Miscellaneous - Rents: $89,000 ($37.97)
Fines and Forfeits: $20,000 ($8.53)Interest Earnings: $12,000 ($5.12)General Revenue - Other: $4,000 ($1.71)Revenue - Water Utilities: $287,000 ($122.44)
State Intergovernmental - General Local Government Support: $219,000 ($93.43)
Highways: $170,000 ($72.53)Other: $6,000 ($2.56)Health and Hospitals: $2,000 ($0.85)Tax - Property: $2,604,000 ($1110.92)
Other License: $36,000 ($15.36)Public Utilities Sales: $15,000 ($6.40)Alcoholic Beverage License: $8,000 ($3.41)
Alpha government finances - Debt in 2017 (per resident):
Long Term Debt - Beginning Outstanding - Unspecified Public Purpose: $504,000 ($215.02)
Outstanding Unspecified Public Purpose: $386,000 ($164.68)Retired Unspecified Public Purpose: $118,000 ($50.34)
Alpha government finances - Cash and Securities in 2017 (per resident):
Bond Funds - Cash and Securities: $435,000 ($185.58)
Other Funds - Cash and Securities: $3,170,000 ($1352.39)
Businesses in Alpha, NJ
FedEx: 1Lane Furniture: 1 Strongest AM radio stations in Alpha:
WWJZ (640 AM; 50 kW; MOUNT HOLLY, NJ; Owner: ABC, INC.)
WEST (1400 AM; 1 kW; EASTON, PA; Owner: MARANATHA BROADCASTING COMPANY, INC.)
WEEX (1230 AM; 1 kW; EASTON, PA; Owner: NASSAU BROADCASTING II, LLC)
WZZD (990 AM; 50 kW; PHILADELPHIA, PA; Owner: PENNSYLVANIA MEDIA ASSOCIATES, INC.)
KYW (1060 AM; 50 kW; PHILADELPHIA, PA; Owner: INFINITY BROADCASTING OPERATIONS, INC.)
WMCA (570 AM; 50 kW; NEW YORK, NY; Owner: SALEM MEDIA OF NEW YORK, LLC)
WPEN (950 AM; 50 kW; PHILADELPHIA, PA; Owner: GREATER PHILADELPHIA RADIO, INC.)
WCHR (1040 AM; 5 kW; FLEMINGTON, NJ; Owner: NASSAU BROADCASTING II, L.L.C.)
WOR (710 AM; 50 kW; NEW YORK, NY; Owner: BUCKLEY BROADCASTING CORPORATION)
WVCH (740 AM; 50 kW; CHESTER, PA; Owner: WVCH COMMUNICATIONS, INC.)
WNWR (1540 AM; 50 kW; PHILADELPHIA, PA)
WABC (770 AM; 50 kW; NEW YORK, NY; Owner: WABC-AM RADIO, INC.)
WPHT (1210 AM; 50 kW; PHILADELPHIA, PA; Owner: INFINITY BROADCASTING OPERATIONS, INC.)
Strongest FM radio stations in Alpha:
WODE-FM (99.9 FM; EASTON, PA; Owner: NASSAU BROADCASTING II, LLC)
W245AC (96.9 FM; HARMONY TOWNSHIP, NJ; Owner: MERCER COUNTY COMMUNITY COLLEGE)
WZZO (95.1 FM; BETHLEHEM, PA; Owner: CAPSTAR TX LIMITED PARTNERSHIP)
WWPJ (89.5 FM; PEN ARGYL, PA; Owner: MERCER COUNTY COMMUNITY COLLEGE)
WLEV (100.7 FM; ALLENTOWN, PA; Owner: CITADEL BROADCASTING COMPANY)
WLVR-FM (91.3 FM; BETHLEHEM, PA; Owner: LEHIGH UNIVERSITY)
WDIY (88.1 FM; ALLENTOWN, PA; Owner: LEHIGH VALLEY COMMUNITY BR/CST ASSOC)
WJCS (89.3 FM; ALLENTOWN, PA; Owner: BEACON BROADCASTING CORPORATION)
W224AS (92.7 FM; WASHINGTON, NJ; Owner: WRNJ RADIO, INC.)
W278AI (103.5 FM; CENTER VALLEY, PA; Owner: BUX-MONT EDUCATIONAL RADIO ASSOCIATION)
W224AU (92.7 FM; ALLENTOWN, PA; Owner: MERCER COUNTY COMMUNITY COLLEGE)
WSBG (93.5 FM; STROUDSBURG, PA; Owner: NASSAU BROADCASTING II, L.L.C.)
W289AA (105.7 FM; LEBANON TOWNSHIP, NJ; Owner: MERCER COUNTY COMMUNITY COLLEGE)
WCTO (96.1 FM; EASTON, PA; Owner: CITADEL BROADCASTING COMPANY)
W290AC (105.9 FM; PALMERTON, PA; Owner: FAMILY STATIONS, INC.)
W246AA (97.1 FM; ALLENTOWN, ETC., PA; Owner: TEMPLE UNIV. OF THE COMMONWEALTH,ETC)
WWYY (107.1 FM; BELVIDERE, NJ; Owner: NASSAU BROADCASTING HOLDINGS, INC.)
WCVH (90.5 FM; FLEMINGTON, NJ; Owner: HUNTERDON CENTRAL H. S. BD. OF EDUC.)
WKRF (107.9 FM; TOBYHANNA, PA; Owner: ENTERCOM WILKES-BARRE SCRANTON, LLC)
WHCY (106.3 FM; BLAIRSTOWN, NJ; Owner: CLEAR CHANNEL BROADCASTING LICENSES, INC.)
TV broadcast stations around Alpha:
WFMZ-TV (Channel 69; ALLENTOWN, PA; Owner: MARANATHA BROADCASTING COMPANY, INC.)
WLVT-TV (Channel 39; ALLENTOWN, PA; Owner: LEHIGH VALLEY PUBLIC TELECOMMUNICATIONS CORP.)
W07DC (Channel 7; ALLENTOWN/BETHLEHEM, PA; Owner: NEW YORK TIMES MANAGEMENT SERVICES)
WBPH-TV (Channel 60; BETHLEHEM, PA; Owner: SONSHINE FAMILY TELEVISION CORPORATION)
W55BS (Channel 55; BELVIDERE, NJ; Owner: NEW JERSEY PUBLIC BROADCASTING AUTHORITY)
KYW-TV (Channel 3; PHILADELPHIA, PA; Owner: CBS BROADCASTING INC.)
WPHL-TV (Channel 17; PHILADELPHIA, PA; Owner: TRIBUNE TELEVISION COMPANY)
WPPX (Channel 61; WILMINGTON, DE; Owner: PAXSON PHILADELPHIA LICENSE, INC.)
WPVI-TV (Channel 6; PHILADELPHIA, PA; Owner: ABC, INC.)
WPSG (Channel 57; PHILADELPHIA, PA; Owner: VIACOM STATIONS GROUP OF PHILADELPHIA INC.)
WCAU (Channel 10; PHILADELPHIA, PA; Owner: NBC SUBSIDIARY (WCAU-TV), L.P.)
WNJT (Channel 52; TRENTON, NJ; Owner: NEW JERSEY PUBLIC BROADCASTING AUTHORITY)
WGTW (Channel 48; BURLINGTON, NJ; Owner: BRUNSON COMMUNICATIONS, INC.)
WYBE (Channel 35; PHILADELPHIA, PA; Owner: INDEPENDENCE PUBLIC MEDIA OF PHILADELPHIA, INC.)
WHYY-TV (Channel 12; WILMINGTON, DE; Owner: WHYY, INC.)
WELL-LP (Channel 8; WILLOW GROVE, ETC., PA; Owner: WORD OF GOD FELLOWSHIP, INC.)
WTXF-TV (Channel 29; PHILADELPHIA, PA; Owner: FOX TV STATIONS OF PHILADELPHIA)
W46BL (Channel 46; ALLENTOWN-BETHLEHEM, PA; Owner: MARANATHA BROADCASTING COMPANY, INC.)
W25BB (Channel 25; PITTSTOWN, NJ; Owner: NEW JERSEY PUBLIC B/CASTNG AUTHORITY)
National Bridge Inventory (NBI) Statistics 20 Number of bridges190ft / 57.5m Total length $7,520,000 Total costs220,058 Total average daily traffic40,708 Total average daily truck traffic
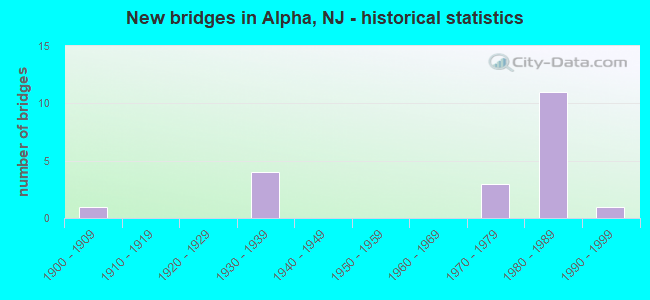
New bridges - historical statistics
1 1900-1909 4 1930-1939 3 1970-1979 11 1980-1989 1 1990-1999
See full National Bridge Inventory statistics for Alpha, NJ
FCC Registered Broadcast Land Mobile Towers: 3
Borough Hall 1001 East Blvd (Lat: 40.663167 Lon: -75.160722), Call Sign: KRI667, Assigned Frequencies: 45.0800 MHz, Grant Date: 11/19/1997, Expiration Date: 01/22/2003, Cancellation Date: 04/27/2003, Registrant: Pohatcong, Township Of, 50 Municipal Dr, Phillipsburg, NJ 08865-7813, Phone: (908) 454-6424 1001 East Blvd (Lat: 40.663167 Lon: -75.160722), Call Sign: WZX921, Licensee ID: L00099289, Assigned Frequencies: 45.2200 MHz, Grant Date: 03/19/2014, Expiration Date: 06/14/2024, Registrant: Township Of Lopatcong Still Valley Rd, Still Valley Rd Rr Crossing At Mp Le71.95 (Lat: 40.648917 Lon: -75.135444), Type: Bant, Structure height: 2.5 m, Overall height: 3.1 m, Call Sign: WQAK519, Licensee ID: L00008014, Assigned Frequencies: 161.070 MHz, 161.055 MHz, Grant Date: 03/26/2014, Expiration Date: 06/22/2024, Certifier: Jerry R Celio, Registrant: Norfolk Southern Railway Company, 650 West Peachtree St, Nw, Box 41, Atlanta, GA 30308, Phone: (404) 660-4050, Fax: (404) 582-6209, Email:
FCC Registered Amateur Radio Licenses: 7
Call Sign: KA2MMZ, Grant Date: 03/20/1996, Expiration Date: 03/20/2006, Cancellation Date: 03/21/2008, Registrant: Richard L Eichlin Jr, 1001 Lee Ave, Alpha, NJ 08865Call Sign: KB2WHA, Grant Date: 11/13/1995, Expiration Date: 11/13/2005, Cancellation Date: 11/14/2007, Registrant: Denise A Reiger, 536 Alpha St, Alpha, NJ 08865Call Sign: W2TLP, Grant Date: 05/20/1997, Expiration Date: 05/20/2007, Cancellation Date: 05/21/2009, Registrant: Francis J Murray, 735 Schley Ave, Alpha, NJ 08865Call Sign: WB2SEM, Licensee ID: L01153788, Grant Date: 07/30/2016, Expiration Date: 08/14/2026, Certifier: Chester W Elspass, Registrant: Chester W Elspass, 496 Franklin St, Alpha, NJ 08865Call Sign: WD8BNT, Grant Date: 05/13/1996, Expiration Date: 05/13/2006, Cancellation Date: 05/14/2008, Registrant: Ralph G Radecky, 901 2nd Ave, Alpha, NJ 08865Call Sign: KD2JUN, Licensee ID: L01978738, Grant Date: 11/18/2015, Expiration Date: 11/18/2025, Certifier: Neal M Stokes, Registrant: Neal M Stokes, 568 Alpha Street, Alpha, NJ 08865-4330Call Sign: W2AWD, Previous Call Sign: KD2WAU, Licensee ID: L02433873, Grant Date: 04/16/2021, Expiration Date: 04/16/2031, Certifier: David R Sica, Registrant: David R Sica, 642 Grant Street, Alpha, NJ 08865FAA Registered Aircraft: 8 (
See the full list of FAA Registered Aircraft in Alpha )
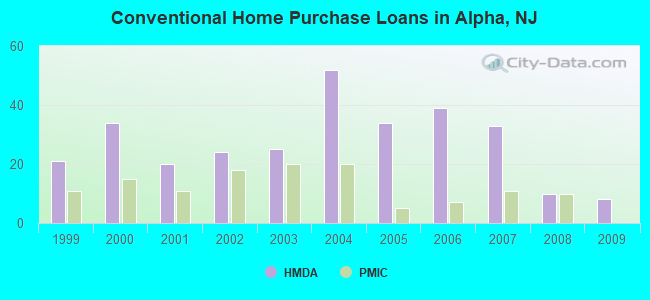
Home Mortgage Disclosure Act Aggregated Statistics For Year 2009(Based on 1 full tract) A) FHA, FSA/RHS & VA B) Conventional C) Refinancings D) Home Improvement Loans F) Non-occupant Loans on Number Average Value Number Average Value Number Average Value Number Average Value Number Average Value
LOANS ORIGINATED 18 $172,111 8 $148,750 43 $171,000 8 $28,000 1 $109,000 APPLICATIONS APPROVED, NOT ACCEPTED 3 $150,333 0 $0 6 $126,833 1 $75,000 0 $0 APPLICATIONS DENIED 1 $210,000 1 $200,000 28 $189,357 3 $73,000 1 $71,000 APPLICATIONS WITHDRAWN 5 $190,200 1 $155,000 18 $172,778 2 $130,500 0 $0 FILES CLOSED FOR INCOMPLETENESS 1 $187,000 0 $0 2 $187,000 0 $0 0 $0
Aggregated Statistics For Year 2008(Based on 1 full tract) A) FHA, FSA/RHS & VA B) Conventional C) Refinancings D) Home Improvement Loans F) Non-occupant Loans on Number Average Value Number Average Value Number Average Value Number Average Value Number Average Value
LOANS ORIGINATED 9 $176,222 10 $189,000 25 $146,840 5 $49,400 6 $169,833 APPLICATIONS APPROVED, NOT ACCEPTED 1 $259,000 3 $230,000 9 $118,667 1 $5,000 1 $86,000 APPLICATIONS DENIED 1 $166,000 2 $114,000 24 $201,750 7 $78,143 2 $202,500 APPLICATIONS WITHDRAWN 2 $219,500 1 $219,000 17 $201,412 0 $0 0 $0 FILES CLOSED FOR INCOMPLETENESS 0 $0 0 $0 3 $273,000 0 $0 0 $0
Aggregated Statistics For Year 2007(Based on 1 full tract) A) FHA, FSA/RHS & VA B) Conventional C) Refinancings D) Home Improvement Loans F) Non-occupant Loans on Number Average Value Number Average Value Number Average Value Number Average Value Number Average Value
LOANS ORIGINATED 2 $190,500 33 $163,667 50 $170,540 18 $40,611 8 $136,500 APPLICATIONS APPROVED, NOT ACCEPTED 0 $0 5 $105,800 13 $155,692 2 $23,500 0 $0 APPLICATIONS DENIED 1 $220,000 6 $183,833 39 $168,974 16 $47,688 1 $239,000 APPLICATIONS WITHDRAWN 2 $128,000 4 $130,750 13 $190,462 1 $50,000 1 $150,000 FILES CLOSED FOR INCOMPLETENESS 0 $0 1 $244,000 5 $244,800 0 $0 1 $280,000
Aggregated Statistics For Year 2006(Based on 1 full tract) A) FHA, FSA/RHS & VA B) Conventional C) Refinancings D) Home Improvement Loans E) Loans on Dwellings For 5+ Families F) Non-occupant Loans on Number Average Value Number Average Value Number Average Value Number Average Value Number Average Value Number Average Value
LOANS ORIGINATED 0 $0 39 $170,872 75 $173,400 20 $50,400 0 $0 4 $145,750 APPLICATIONS APPROVED, NOT ACCEPTED 0 $0 6 $151,167 10 $221,700 2 $62,500 0 $0 1 $77,000 APPLICATIONS DENIED 1 $130,000 13 $147,231 56 $176,036 11 $37,364 1 $75,000 5 $212,800 APPLICATIONS WITHDRAWN 1 $274,000 9 $107,889 20 $188,200 2 $59,000 0 $0 1 $200,000 FILES CLOSED FOR INCOMPLETENESS 1 $274,000 2 $156,000 5 $244,400 0 $0 0 $0 0 $0
Aggregated Statistics For Year 2005(Based on 1 full tract) A) FHA, FSA/RHS & VA B) Conventional C) Refinancings D) Home Improvement Loans E) Loans on Dwellings For 5+ Families F) Non-occupant Loans on Number Average Value Number Average Value Number Average Value Number Average Value Number Average Value Number Average Value
LOANS ORIGINATED 2 $141,000 34 $137,235 88 $132,227 19 $70,684 0 $0 7 $98,857 APPLICATIONS APPROVED, NOT ACCEPTED 0 $0 3 $172,667 15 $136,733 5 $36,800 0 $0 3 $122,000 APPLICATIONS DENIED 1 $246,000 3 $153,000 50 $177,480 21 $41,286 0 $0 1 $10,000 APPLICATIONS WITHDRAWN 0 $0 4 $114,000 35 $176,543 2 $106,500 1 $25,000 4 $117,500 FILES CLOSED FOR INCOMPLETENESS 0 $0 1 $140,000 15 $193,600 0 $0 0 $0 0 $0
Aggregated Statistics For Year 2004(Based on 1 full tract) A) FHA, FSA/RHS & VA B) Conventional C) Refinancings D) Home Improvement Loans F) Non-occupant Loans on G) Loans On Manufactured Number Average Value Number Average Value Number Average Value Number Average Value Number Average Value Number Average Value
LOANS ORIGINATED 5 $187,200 52 $150,731 72 $133,778 17 $66,588 13 $155,692 0 $0 APPLICATIONS APPROVED, NOT ACCEPTED 0 $0 5 $122,800 14 $167,429 2 $134,000 1 $146,000 1 $9,000 APPLICATIONS DENIED 0 $0 0 $0 33 $121,364 5 $83,000 4 $118,500 0 $0 APPLICATIONS WITHDRAWN 1 $189,000 5 $192,400 28 $147,143 4 $74,250 0 $0 0 $0 FILES CLOSED FOR INCOMPLETENESS 0 $0 2 $115,500 3 $112,000 1 $15,000 0 $0 0 $0
Aggregated Statistics For Year 2003(Based on 1 full tract) A) FHA, FSA/RHS & VA B) Conventional C) Refinancings D) Home Improvement Loans F) Non-occupant Loans on Number Average Value Number Average Value Number Average Value Number Average Value Number Average Value
LOANS ORIGINATED 8 $217,000 25 $155,680 137 $115,022 18 $56,000 9 $111,444 APPLICATIONS APPROVED, NOT ACCEPTED 1 $127,000 10 $141,400 20 $102,500 2 $16,500 2 $62,500 APPLICATIONS DENIED 1 $102,000 5 $109,800 43 $110,023 6 $31,167 6 $107,667 APPLICATIONS WITHDRAWN 0 $0 5 $109,200 36 $131,750 1 $50,000 1 $102,000 FILES CLOSED FOR INCOMPLETENESS 1 $190,000 3 $143,000 4 $154,500 1 $150,000 0 $0
Aggregated Statistics For Year 2002(Based on 1 full tract) A) FHA, FSA/RHS & VA B) Conventional C) Refinancings D) Home Improvement Loans F) Non-occupant Loans on Number Average Value Number Average Value Number Average Value Number Average Value Number Average Value
LOANS ORIGINATED 14 $136,429 24 $121,750 45 $122,889 14 $37,500 5 $104,200 APPLICATIONS APPROVED, NOT ACCEPTED 0 $0 3 $166,000 15 $108,800 4 $36,750 0 $0 APPLICATIONS DENIED 0 $0 9 $83,556 23 $105,000 3 $46,667 2 $91,500 APPLICATIONS WITHDRAWN 1 $76,000 1 $98,000 34 $120,176 1 $13,000 0 $0 FILES CLOSED FOR INCOMPLETENESS 0 $0 0 $0 5 $121,400 0 $0 0 $0
Aggregated Statistics For Year 2001(Based on 1 full tract) A) FHA, FSA/RHS & VA B) Conventional C) Refinancings D) Home Improvement Loans E) Loans on Dwellings For 5+ Families F) Non-occupant Loans on Number Average Value Number Average Value Number Average Value Number Average Value Number Average Value Number Average Value
LOANS ORIGINATED 13 $117,462 20 $102,400 49 $103,082 14 $17,286 1 $75,000 5 $93,800 APPLICATIONS APPROVED, NOT ACCEPTED 1 $207,000 4 $91,250 10 $85,200 2 $20,000 0 $0 1 $128,000 APPLICATIONS DENIED 4 $106,750 4 $103,500 16 $67,062 2 $16,500 0 $0 1 $20,000 APPLICATIONS WITHDRAWN 0 $0 1 $41,000 18 $108,222 5 $19,200 0 $0 0 $0 FILES CLOSED FOR INCOMPLETENESS 0 $0 0 $0 2 $88,500 0 $0 0 $0 0 $0
Aggregated Statistics For Year 2000(Based on 1 full tract) A) FHA, FSA/RHS & VA B) Conventional C) Refinancings D) Home Improvement Loans F) Non-occupant Loans on Number Average Value Number Average Value Number Average Value Number Average Value Number Average Value
LOANS ORIGINATED 9 $107,222 34 $100,794 18 $72,833 8 $21,375 7 $82,714 APPLICATIONS APPROVED, NOT ACCEPTED 0 $0 6 $90,167 8 $88,625 0 $0 0 $0 APPLICATIONS DENIED 1 $102,000 5 $73,000 7 $58,286 3 $27,667 1 $80,000 APPLICATIONS WITHDRAWN 0 $0 7 $102,000 13 $62,769 4 $46,500 3 $41,000 FILES CLOSED FOR INCOMPLETENESS 1 $65,000 1 $15,000 5 $108,000 0 $0 0 $0
Aggregated Statistics For Year 1999(Based on 1 partial tract) A) FHA, FSA/RHS & VA B) Conventional C) Refinancings D) Home Improvement Loans E) Loans on Dwellings For 5+ Families F) Non-occupant Loans on Number Average Value Number Average Value Number Average Value Number Average Value Number Average Value Number Average Value
LOANS ORIGINATED 12 $109,859 21 $102,007 30 $77,191 9 $17,098 2 $80,695 8 $68,496 APPLICATIONS APPROVED, NOT ACCEPTED 1 $108,840 3 $55,673 11 $73,955 1 $9,380 0 $0 1 $91,020 APPLICATIONS DENIED 1 $110,720 4 $71,310 20 $88,341 8 $12,550 0 $0 2 $28,150 APPLICATIONS WITHDRAWN 1 $124,790 1 $60,990 19 $70,718 2 $11,730 0 $0 2 $3,755 FILES CLOSED FOR INCOMPLETENESS 0 $0 3 $93,830 8 $85,855 1 $33,780 0 $0 0 $0
Detailed HMDA statistics for the following Tracts:
0324.00
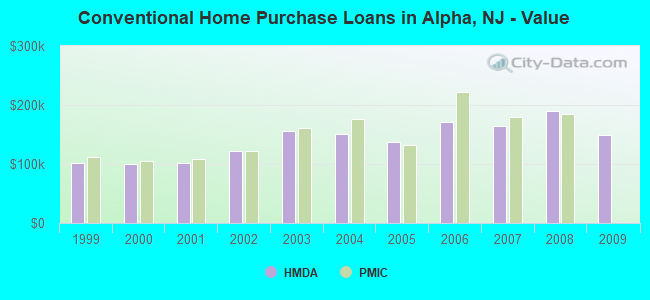
Private Mortgage Insurance Companies Aggregated Statistics For Year 2009(Based on 1 full tract) B) Refinancings Number Average Value
LOANS ORIGINATED 2 $188,500 APPLICATIONS APPROVED, NOT ACCEPTED 0 $0 APPLICATIONS DENIED 0 $0 APPLICATIONS WITHDRAWN 0 $0 FILES CLOSED FOR INCOMPLETENESS 0 $0
Aggregated Statistics For Year 2008(Based on 1 full tract) A) Conventional B) Refinancings C) Non-occupant Loans on Number Average Value Number Average Value Number Average Value
LOANS ORIGINATED 10 $184,500 3 $194,333 1 $153,000 APPLICATIONS APPROVED, NOT ACCEPTED 3 $262,000 4 $254,250 1 $142,000 APPLICATIONS DENIED 0 $0 0 $0 0 $0 APPLICATIONS WITHDRAWN 0 $0 0 $0 0 $0 FILES CLOSED FOR INCOMPLETENESS 0 $0 0 $0 0 $0
Aggregated Statistics For Year 2007(Based on 1 full tract) A) Conventional B) Refinancings C) Non-occupant Loans on Number Average Value Number Average Value Number Average Value
LOANS ORIGINATED 11 $180,273 9 $229,889 1 $77,000 APPLICATIONS APPROVED, NOT ACCEPTED 2 $185,000 3 $188,667 0 $0 APPLICATIONS DENIED 0 $0 0 $0 0 $0 APPLICATIONS WITHDRAWN 0 $0 0 $0 0 $0 FILES CLOSED FOR INCOMPLETENESS 0 $0 0 $0 0 $0
Aggregated Statistics For Year 2006(Based on 1 full tract) A) Conventional B) Refinancings Number Average Value Number Average Value
LOANS ORIGINATED 7 $222,571 5 $210,000 APPLICATIONS APPROVED, NOT ACCEPTED 1 $270,000 3 $160,000 APPLICATIONS DENIED 0 $0 0 $0 APPLICATIONS WITHDRAWN 1 $147,000 1 $107,000 FILES CLOSED FOR INCOMPLETENESS 0 $0 0 $0
Aggregated Statistics For Year 2005(Based on 1 full tract) A) Conventional B) Refinancings Number Average Value Number Average Value
LOANS ORIGINATED 5 $133,000 7 $184,857 APPLICATIONS APPROVED, NOT ACCEPTED 0 $0 0 $0 APPLICATIONS DENIED 0 $0 0 $0 APPLICATIONS WITHDRAWN 0 $0 0 $0 FILES CLOSED FOR INCOMPLETENESS 0 $0 0 $0
Aggregated Statistics For Year 2004(Based on 1 full tract) A) Conventional B) Refinancings C) Non-occupant Loans on Number Average Value Number Average Value Number Average Value
LOANS ORIGINATED 20 $175,900 4 $166,250 2 $140,500 APPLICATIONS APPROVED, NOT ACCEPTED 5 $159,600 10 $147,600 0 $0 APPLICATIONS DENIED 0 $0 0 $0 0 $0 APPLICATIONS WITHDRAWN 0 $0 0 $0 0 $0 FILES CLOSED FOR INCOMPLETENESS 0 $0 1 $135,000 0 $0
Aggregated Statistics For Year 2003(Based on 1 full tract) A) Conventional B) Refinancings C) Non-occupant Loans on Number Average Value Number Average Value Number Average Value
LOANS ORIGINATED 20 $160,550 10 $148,000 4 $104,250 APPLICATIONS APPROVED, NOT ACCEPTED 1 $212,000 6 $179,500 0 $0 APPLICATIONS DENIED 0 $0 0 $0 0 $0 APPLICATIONS WITHDRAWN 0 $0 1 $144,000 0 $0 FILES CLOSED FOR INCOMPLETENESS 0 $0 0 $0 0 $0
Aggregated Statistics For Year 2002(Based on 1 full tract) A) Conventional B) Refinancings C) Non-occupant Loans on Number Average Value Number Average Value Number Average Value
LOANS ORIGINATED 18 $121,889 5 $155,800 3 $109,333 APPLICATIONS APPROVED, NOT ACCEPTED 3 $83,667 3 $165,000 1 $43,000 APPLICATIONS DENIED 0 $0 0 $0 0 $0 APPLICATIONS WITHDRAWN 1 $43,000 0 $0 1 $43,000 FILES CLOSED FOR INCOMPLETENESS 0 $0 0 $0 0 $0
Aggregated Statistics For Year 2001(Based on 1 full tract) A) Conventional B) Refinancings C) Non-occupant Loans on Number Average Value Number Average Value Number Average Value
LOANS ORIGINATED 11 $108,727 10 $123,400 2 $59,000 APPLICATIONS APPROVED, NOT ACCEPTED 1 $140,000 3 $98,000 0 $0 APPLICATIONS DENIED 0 $0 0 $0 0 $0 APPLICATIONS WITHDRAWN 1 $108,000 0 $0 0 $0 FILES CLOSED FOR INCOMPLETENESS 0 $0 0 $0 0 $0
Aggregated Statistics For Year 2000(Based on 1 full tract) A) Conventional B) Refinancings C) Non-occupant Loans on Number Average Value Number Average Value Number Average Value
LOANS ORIGINATED 15 $105,533 4 $93,250 2 $115,000 APPLICATIONS APPROVED, NOT ACCEPTED 3 $130,333 1 $426,000 0 $0 APPLICATIONS DENIED 0 $0 0 $0 0 $0 APPLICATIONS WITHDRAWN 0 $0 0 $0 0 $0 FILES CLOSED FOR INCOMPLETENESS 0 $0 0 $0 0 $0
Aggregated Statistics For Year 1999(Based on 1 partial tract) A) Conventional B) Refinancings Number Average Value Number Average Value
LOANS ORIGINATED 11 $112,511 3 $103,213 APPLICATIONS APPROVED, NOT ACCEPTED 0 $0 0 $0 APPLICATIONS DENIED 1 $106,970 0 $0 APPLICATIONS WITHDRAWN 0 $0 0 $0 FILES CLOSED FOR INCOMPLETENESS 0 $0 0 $0
Detailed PMIC statistics for the following Tracts:
0324.00
Alpha compared to New Jersey state average:
Median house value below state average. Unemployed percentage below state average. Black race population percentage significantly below state average. Hispanic race population percentage below state average. Foreign-born population percentage significantly below state average. Length of stay since moving in significantly above state average. House age above state average.
#34 on the list of "Top 101 cities with the most residents born in Costa Rica (population 500+)"
#4 on the list of "Top 101 counties with the lowest Ozone (1-hour) air pollution readings in 2012 (ppm)"
#18 on the list of "Top 101 counties with the largest decrease in the number of births per 1000 residents 2000-2006 to 2007-2013 (pop 50,000+)"
#32 on the list of "Top 101 counties with the highest percentage of residents that smoked 100+ cigarettes in their lives"
#43 on the list of "Top 101 counties with the lowest surface withdrawal of fresh water for public supply (pop. 50,000+)"
#54 on the list of "Top 101 counties with the lowest number of births per 1000 residents 2007-2013"
Top Patent Applicants
Konstantinos Koliopoulos (1)
John Pierre Curtis (1)
Joseph K. Banis (1)
Frank J. Jankoski, Jr. (1)
Total of 4 patent applications in 2008-2024.


 Recent articles from our blog. Our writers, many of them Ph.D. graduates or candidates, create easy-to-read articles on a wide variety of topics.

 (11.6 miles