Ashwaubenon, Wisconsin
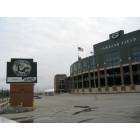
Ashwaubenon: Lambeau Field, home of the Green Bay Packers
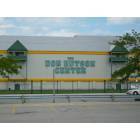
Ashwaubenon: Green Bay Packers practice facility
- add
your
Submit your own pictures of this village and show them to the world
- OSM Map
- General Map
- Google Map
- MSN Map
Population change since 2000: -4.6%
 |
| Males: 7,875 | |
| Females: 8,942 |
| Median resident age: | 41.1 years |
| Wisconsin median age: | 40.4 years |
Zip codes: 54115, 54155, 54304, 54313.
Ashwaubenon Zip Code Map| Ashwaubenon: | $65,060 |
| WI: | $70,996 |
Estimated per capita income in 2022: $40,945 (it was $23,539 in 2000)
Ashwaubenon village income, earnings, and wages data
Estimated median house or condo value in 2022: $247,896 (it was $121,300 in 2000)
| Ashwaubenon: | $247,896 |
| WI: | $252,800 |
Mean prices in 2022: all housing units: $287,597; detached houses: $299,013; townhouses or other attached units: $230,209; in 2-unit structures: $211,638; in 3-to-4-unit structures: $208,261; in 5-or-more-unit structures: $170,104; mobile homes: $72,078
Median gross rent in 2022: $862.
(10.3% for White Non-Hispanic residents, 49.8% for Black residents, 32.3% for Hispanic or Latino residents, 3.6% for American Indian residents, 75.3% for other race residents, 3.6% for two or more races residents)
Detailed information about poverty and poor residents in Ashwaubenon, WI
Compare current foreclosures near Ashwaubenon, WI:
| Photo | Address | Area | Beds / Baths | Price | Details |
|---|---|---|---|---|---|

|
#1
Sumac Pl
Green Bay, WI 54313
|
4,704 sq. feet
|
5 baths 5 beds |
show details | |

|
#2
Crooks St
Green Bay, WI 54301
|
1,344 sq. feet
|
1 baths 4 beds |
show details | |

|
#3
W Factory St
Seymour, WI 54165
|
1,888 sq. feet
|
2 baths 4 beds |
show details | |

|
#4
Foote St
Seymour, WI 54165
|
1,616 sq. feet
|
1 baths 3 beds |
show details | |

|
#5
S Norwood Ave
Green Bay, WI 54304
|
- sq. feet
|
- baths - beds |
$29,000
|
show details |

|
#6
Desnoyer St
Kaukauna, WI 54130
|
921 sq. feet
|
1 baths 2 beds |
show details | |

|
#7
George St
Kaukauna, WI 54130
|
1,440 sq. feet
|
2 baths 3 beds |
show details | |

|
#8
Cora St
Green Bay, WI 54303
|
- sq. feet
|
2 baths 4 beds |
show details | |

|
#9
3rd St
Green Bay, WI 54304
|
- sq. feet
|
- baths - beds |
$60,000
|
show details |

|
#10
Wirtz Ave
Green Bay, WI 54304
|
- sq. feet
|
- baths - beds |
$15,000
|
show details |
| Photo | Address | Area | Beds / Baths | Price | Details |
|---|---|---|---|---|---|

|
#11
Anchor Dr
Green Bay, WI 54313
|
- sq. feet
|
- baths - beds |
show details | |

|
#12
Jaymar St
Green Bay, WI 54313
|
- sq. feet
|
- baths - beds |
show details | |

|
#13
Woodale Ave Apt 2
Green Bay, WI 54313
|
- sq. feet
|
- baths - beds |
show details | |

|
#14
Burgoyne Ct Apt 58
De Pere, WI 54115
|
- sq. feet
|
- baths - beds |
show details | |

|
#15
Kenhill Dr
Green Bay, WI 54313
|
- sq. feet
|
- baths - beds |
show details | |

|
#16
Manitowoc Rd Apt 202
Green Bay, WI 54302
|
- sq. feet
|
- baths - beds |
show details | |

|
#17
Brosig St Apt D
Green Bay, WI 54311
|
- sq. feet
|
- baths - beds |
show details | |

|
#18
N Danz Ave # 9
Green Bay, WI 54302
|
- sq. feet
|
- baths - beds |
show details | |

|
#19
Rachel Dr
Green Bay, WI 54311
|
- sq. feet
|
- baths - beds |
show details | |

|
#20
Samantha St Apt 51
De Pere, WI 54115
|
- sq. feet
|
- baths - beds |
show details |
| Photo | Address | Area | Beds / Baths | Price | Details |
|---|---|---|---|---|---|

|
#21
Bufflehead Ln
Green Bay, WI 54311
|
- sq. feet
|
- baths - beds |
show details | |

|
#22
Allouez Ave
Green Bay, WI 54311
|
- sq. feet
|
- baths - beds |
show details | |

|
#23
Peters St
Green Bay, WI 54302
|
- sq. feet
|
- baths - beds |
show details | |

|
#24
Scotney Castle Ct
Green Bay, WI 54313
|
- sq. feet
|
- baths - beds |
show details | |

|
#25
Centennial Centre Blvd Apt 44
Oneida, WI 54155
|
- sq. feet
|
- baths - beds |
show details | |

|
#26
Redstone Trl Apt 1
Green Bay, WI 54313
|
- sq. feet
|
- baths - beds |
show details | |

|
#27
Appian Way
Green Bay, WI 54302
|
- sq. feet
|
- baths - beds |
show details | |

|
#28
Maple Hills Dr
Green Bay, WI 54313
|
- sq. feet
|
- baths - beds |
show details | |

|
#29
Stella Ct Unit 69
Oneida, WI 54155
|
- sq. feet
|
- baths - beds |
show details | |

|
#30
Sherry Ln
Green Bay, WI 54302
|
- sq. feet
|
- baths - beds |
show details |
| Photo | Address | Area | Beds / Baths | Price | Details |
|---|---|---|---|---|---|

|
#31
Rothe St Apt 5
Green Bay, WI 54302
|
- sq. feet
|
- baths - beds |
show details | |

|
#32
Eastman Ave Apt 1
Green Bay, WI 54302
|
- sq. feet
|
- baths - beds |
show details | |

|
#33
Sycamore Dr Apt 5
Green Bay, WI 54311
|
- sq. feet
|
- baths - beds |
show details | |

|
#34
Clement St # 8
Green Bay, WI 54302
|
- sq. feet
|
- baths - beds |
show details | |

|
#35
Eastman Ave Apt 5
Green Bay, WI 54302
|
- sq. feet
|
- baths - beds |
show details | |

|
#36
Centennial Centre Blvd Apt 27
Oneida, WI 54155
|
- sq. feet
|
- baths - beds |
show details | |

|
#37
Hemlock Ct
Green Bay, WI 54311
|
- sq. feet
|
- baths - beds |
show details | |

|
#38
Rockwell Rd
Green Bay, WI 54313
|
- sq. feet
|
- baths - beds |
show details | |

|
#39
Fredrick Ct # 4
Green Bay, WI 54313
|
- sq. feet
|
- baths - beds |
show details | |

|
#40
August St Apt D
Green Bay, WI 54302
|
- sq. feet
|
- baths - beds |
show details |
| Photo | Address | Area | Beds / Baths | Price | Details |
|---|---|---|---|---|---|

|
#41
Pilgrim Way Apt 15
Green Bay, WI 54304
|
- sq. feet
|
- baths - beds |
show details | |

|
#42
Angels Path Apt 52
De Pere, WI 54115
|
- sq. feet
|
- baths - beds |
show details | |

|
#43
Black Earth Dr
De Pere, WI 54115
|
- sq. feet
|
- baths - beds |
show details | |

|
#44
N Military Ave Apt 12
Green Bay, WI 54303
|
- sq. feet
|
- baths - beds |
show details | |

|
#45
Riverdale Dr
Oneida, WI 54155
|
- sq. feet
|
- baths - beds |
show details | |

|
#46
Westminster Dr Apt 4
Green Bay, WI 54302
|
- sq. feet
|
- baths - beds |
show details | |

|
#47
Nier Ct
Green Bay, WI 54303
|
- sq. feet
|
- baths - beds |
show details | |

|
#48
Roland Ln Apt 15
Green Bay, WI 54303
|
- sq. feet
|
- baths - beds |
show details | |

|
#49
E Walnut St
Green Bay, WI 54301
|
- sq. feet
|
- baths - beds |
show details | |

|
Check over 1 million property listings on Foreclosure.com!
|
browse all offers | |||


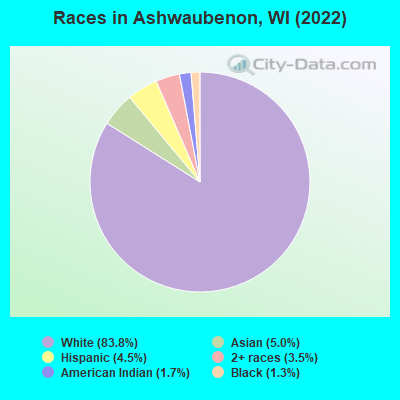
- 14,27483.8%White alone
- 8545.0%Asian alone
- 7604.5%Hispanic
- 5903.5%Two or more races
- 2851.7%American Indian alone
- 2241.3%Black alone
Races in Ashwaubenon detailed stats: ancestries, foreign born residents, place of birth
According to our research of Wisconsin and other state lists, there were 5 registered sex offenders living in Ashwaubenon, Wisconsin as of June 16, 2024.
The ratio of all residents to sex offenders in Ashwaubenon is 3,482 to 1.
The ratio of registered sex offenders to all residents in this city is much lower than the state average.
Type |
2009 |
2010 |
2011 |
2012 |
2013 |
2016 |
2017 |
2018 |
2019 |
2020 |
2021 |
2022 |
|---|---|---|---|---|---|---|---|---|---|---|---|---|
| Murders (per 100,000) | 0 (0.0) | 0 (0.0) | 0 (0.0) | 1 (5.8) | 0 (0.0) | 0 (0.0) | 0 (0.0) | 0 (0.0) | 0 (0.0) | 1 (5.8) | 1 (5.9) | 0 (0.0) |
| Rapes (per 100,000) | 9 (52.3) | 11 (64.8) | 3 (17.6) | 6 (34.9) | 5 (29.2) | 7 (40.7) | 5 (28.9) | 6 (34.7) | 9 (52.0) | 13 (75.7) | 4 (23.5) | 12 (71.3) |
| Robberies (per 100,000) | 1 (5.8) | 0 (0.0) | 3 (17.6) | 2 (11.6) | 7 (40.8) | 2 (11.6) | 1 (5.8) | 2 (11.6) | 1 (5.8) | 3 (17.5) | 2 (11.8) | 1 (5.9) |
| Assaults (per 100,000) | 11 (64.0) | 6 (35.4) | 11 (64.6) | 32 (186.0) | 2 (11.7) | 12 (69.7) | 13 (75.0) | 6 (34.7) | 10 (57.8) | 17 (98.9) | 9 (52.9) | 12 (71.3) |
| Burglaries (per 100,000) | 60 (348.9) | 53 (312.4) | 37 (217.2) | 55 (319.7) | 48 (280.0) | 39 (226.5) | 26 (150.1) | 36 (207.9) | 21 (121.3) | 15 (87.3) | 21 (123.5) | 24 (142.6) |
| Thefts (per 100,000) | 502 (2,919) | 550 (3,242) | 587 (3,445) | 594 (3,453) | 684 (3,990) | 507 (2,944) | 583 (3,365) | 474 (2,737) | 446 (2,576) | 240 (1,397) | 309 (1,817) | 318 (1,889) |
| Auto thefts (per 100,000) | 15 (87.2) | 15 (88.4) | 15 (88.0) | 13 (75.6) | 14 (81.7) | 13 (75.5) | 13 (75.0) | 19 (109.7) | 12 (69.3) | 28 (163.0) | 29 (170.5) | 17 (101.0) |
| Arson (per 100,000) | 1 (5.8) | 0 (0.0) | 0 (0.0) | 0 (0.0) | 0 (0.0) | 0 (0.0) | 0 (0.0) | 2 (11.6) | 0 (0.0) | 0 (0.0) | 0 (0.0) | 0 (0.0) |
| City-Data.com crime index | 204.6 | 217.6 | 192.3 | 246.7 | 223.6 | 189.6 | 190.9 | 170.9 | 172.0 | 172.2 | 139.6 | 166.7 |
The City-Data.com crime index weighs serious crimes and violent crimes more heavily. Higher means more crime, U.S. average is 246.1. It adjusts for the number of visitors and daily workers commuting into cities.
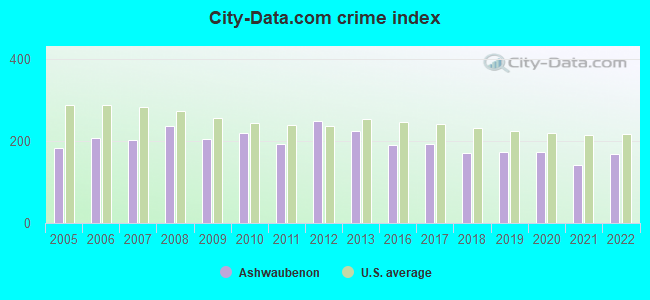
Crime rate in Ashwaubenon detailed stats: murders, rapes, robberies, assaults, burglaries, thefts, arson
Full-time law enforcement employees in 2021, including police officers: 56 (51 officers - 48 male; 3 female).
| Officers per 1,000 residents here: | 3.00 |
| Wisconsin average: | 2.07 |
 Recent articles from our blog. Our writers, many of them Ph.D. graduates or candidates, create easy-to-read articles on a wide variety of topics.

 | Thinking of moving to Green Bay. Pros and cons? (23 replies) |
| Curious, what do people think of WI? (202 replies) |
| looking to retire in eagle river or surrounding areas (34 replies) |
| Area that might be best for me? (72 replies) |
| Green Bay Lacks Vision, Zoning and Leadership (83 replies) |
| Green Bay: A Warning For Those Moving Here... (104 replies) |
Latest news from Ashwaubenon, WI collected exclusively by city-data.com from local newspapers, TV, and radio stations
Ancestries: German (24.0%), Irish (11.1%), American (9.3%), Polish (4.9%), Belgian (3.5%), European (2.9%).
Current Local Time: CST time zone
Incorporated in 1977
Elevation: 590 feet
Land area: 12.4 square miles.
Population density: 1,359 people per square mile (low).
758 residents are foreign born (2.8% Asia, 1.2% Latin America).
| This village: | 4.4% |
| Wisconsin: | 5.0% |
Median real estate property taxes paid for housing units with mortgages in 2022: $2,985 (1.2%)
Median real estate property taxes paid for housing units with no mortgage in 2022: $2,957 (1.2%)
Nearest city with pop. 50,000+: Green Bay, WI  (3.8 miles , pop. 102,313).
Nearest city with pop. 200,000+: Milwaukee, WI (99.5 miles , pop. 596,974).
Nearest city with pop. 1,000,000+: Chicago, IL (184.2 miles , pop. 2,896,016).
Nearest cities:
), ), ), )Latitude: 44.49 N, Longitude: 88.08 W
Daytime population change due to commuting: +18,793 (+110.3%)
Workers who live and work in this village: 3,795 (42.9%)
Area code commonly used in this area: 920
Ashwaubenon, Wisconsin accommodation & food services, waste management - Economy and Business Data
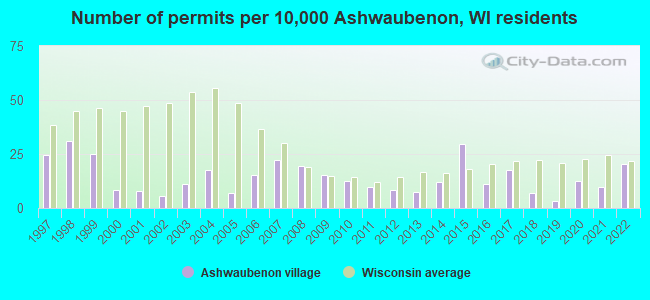
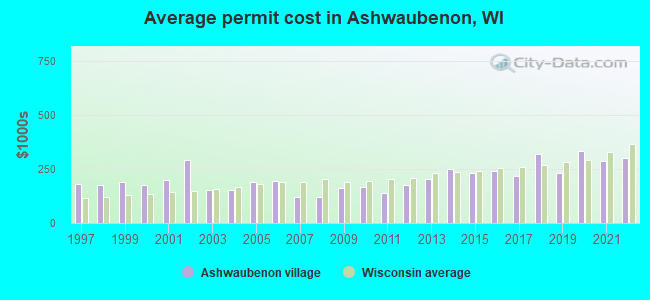
Single-family new house construction building permits:
- 2022: 36 buildings, average cost: $302,600
- 2021: 17 buildings, average cost: $289,100
- 2020: 22 buildings, average cost: $332,900
- 2019: 6 buildings, average cost: $231,100
- 2018: 12 buildings, average cost: $321,300
- 2017: 31 buildings, average cost: $219,000
- 2016: 20 buildings, average cost: $242,700
- 2015: 52 buildings, average cost: $230,000
- 2014: 21 buildings, average cost: $251,800
- 2013: 13 buildings, average cost: $205,000
- 2012: 15 buildings, average cost: $174,500
- 2011: 17 buildings, average cost: $141,200
- 2010: 22 buildings, average cost: $169,400
- 2009: 27 buildings, average cost: $160,500
- 2008: 34 buildings, average cost: $121,700
- 2007: 39 buildings, average cost: $120,700
- 2006: 27 buildings, average cost: $196,800
- 2005: 12 buildings, average cost: $189,400
- 2004: 31 buildings, average cost: $154,300
- 2003: 20 buildings, average cost: $150,600
- 2002: 10 buildings, average cost: $294,000
- 2001: 14 buildings, average cost: $197,900
- 2000: 15 buildings, average cost: $176,900
- 1999: 44 buildings, average cost: $189,400
- 1998: 55 buildings, average cost: $175,100
- 1997: 43 buildings, average cost: $183,400
| Here: | 2.4% |
| Wisconsin: | 2.7% |
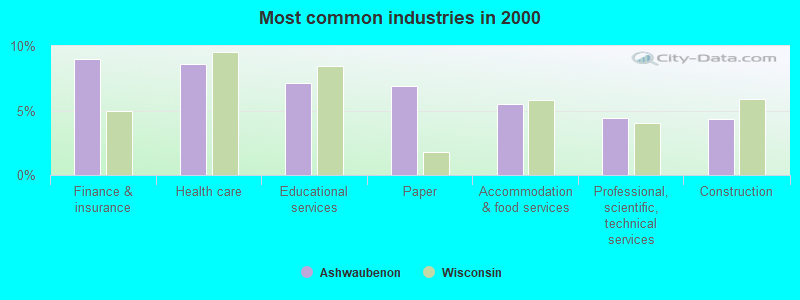
- Finance & insurance (9.0%)
- Health care (8.6%)
- Educational services (7.1%)
- Paper (6.9%)
- Accommodation & food services (5.5%)
- Professional, scientific, technical services (4.4%)
- Construction (4.4%)
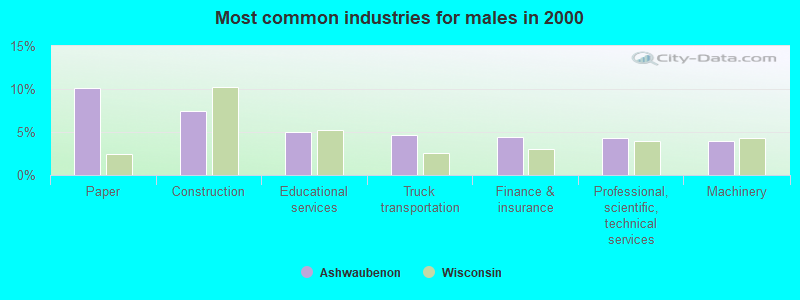
- Paper (10.1%)
- Construction (7.4%)
- Educational services (5.0%)
- Truck transportation (4.7%)
- Finance & insurance (4.4%)
- Professional, scientific, technical services (4.3%)
- Machinery (3.9%)
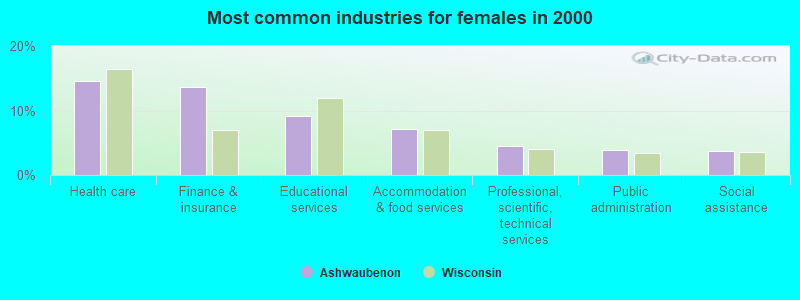
- Health care (14.5%)
- Finance & insurance (13.7%)
- Educational services (9.2%)
- Accommodation & food services (7.2%)
- Professional, scientific, technical services (4.6%)
- Public administration (3.9%)
- Social assistance (3.7%)
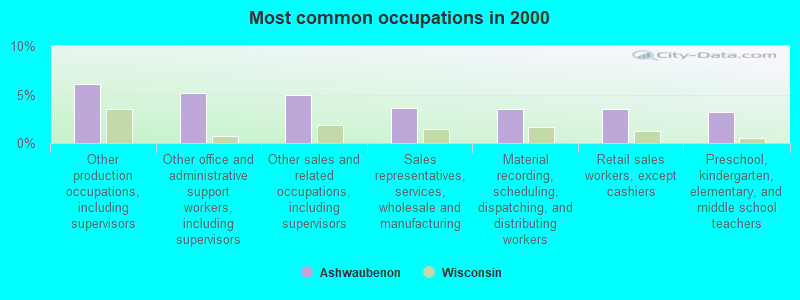
- Other production occupations, including supervisors (6.0%)
- Other office and administrative support workers, including supervisors (5.1%)
- Other sales and related occupations, including supervisors (4.9%)
- Sales representatives, services, wholesale and manufacturing (3.6%)
- Material recording, scheduling, dispatching, and distributing workers (3.5%)
- Retail sales workers, except cashiers (3.5%)
- Preschool, kindergarten, elementary, and middle school teachers (3.2%)
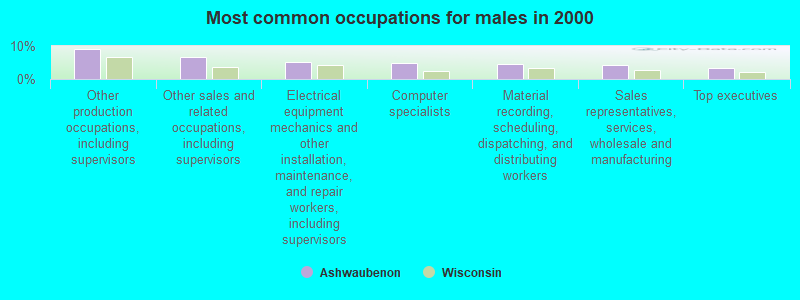
- Other production occupations, including supervisors (9.1%)
- Other sales and related occupations, including supervisors (6.7%)
- Electrical equipment mechanics and other installation, maintenance, and repair workers, including supervisors (5.3%)
- Computer specialists (4.8%)
- Material recording, scheduling, dispatching, and distributing workers (4.6%)
- Sales representatives, services, wholesale and manufacturing (4.3%)
- Top executives (3.4%)
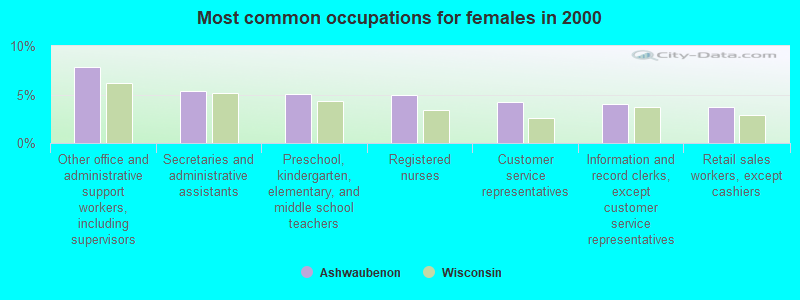
- Other office and administrative support workers, including supervisors (7.8%)
- Secretaries and administrative assistants (5.3%)
- Preschool, kindergarten, elementary, and middle school teachers (5.0%)
- Registered nurses (5.0%)
- Customer service representatives (4.3%)
- Information and record clerks, except customer service representatives (4.0%)
- Retail sales workers, except cashiers (3.7%)
Average climate in Ashwaubenon, Wisconsin
Based on data reported by over 4,000 weather stations


|
|

(lower is better)
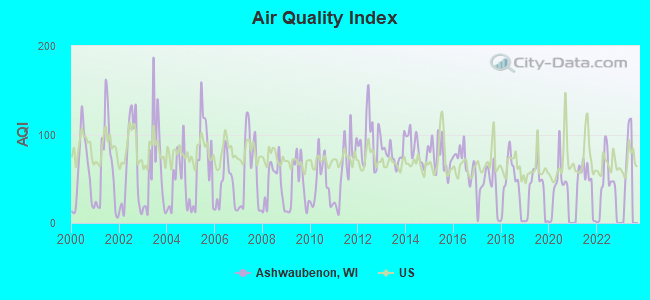
Air Quality Index (AQI) level in 2022 was 37.4. This is significantly better than average.
| City: | 37.4 |
| U.S.: | 72.6 |
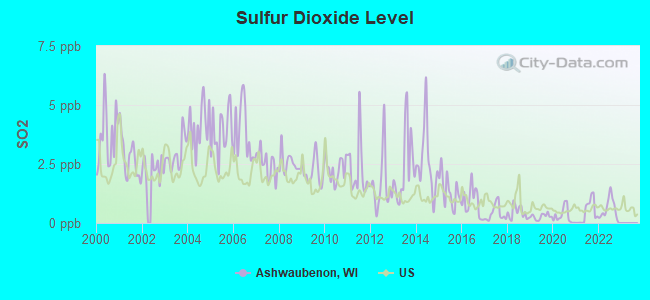
Sulfur Dioxide (SO2) [ppb] level in 2022 was 0.556. This is significantly better than average. Closest monitor was 3.0 miles away from the city center.
| City: | 0.556 |
| U.S.: | 1.515 |
Ozone [ppb] level in 2022 was 31.8. This is about average. Closest monitor was 2.6 miles away from the city center.
| City: | 31.8 |
| U.S.: | 33.3 |
Particulate Matter (PM2.5) [µg/m3] level in 2016 was 6.87. This is about average. Closest monitor was 4.8 miles away from the city center.
| City: | 6.87 |
| U.S.: | 8.11 |
Tornado activity:
Ashwaubenon-area historical tornado activity is slightly below Wisconsin state average. It is 5% smaller than the overall U.S. average.
On 4/27/1984, a category F4 (max. wind speeds 207-260 mph) tornado 11.0 miles away from the Ashwaubenon village center killed one person and injured 19 people and caused between $500,000 and $5,000,000 in damages.
On 7/5/1994, a category F4 tornado 19.3 miles away from the village center injured 2 people and caused between $500,000 and $5,000,000 in damages.
Earthquake activity:
Ashwaubenon-area historical earthquake activity is significantly above Wisconsin state average. It is 22% smaller than the overall U.S. average.On 5/2/2015 at 16:23:07, a magnitude 4.2 (4.2 MW, Depth: 2.8 mi, Class: Light, Intensity: IV - V) earthquake occurred 205.1 miles away from Ashwaubenon center
On 4/18/2008 at 09:36:59, a magnitude 5.4 (5.1 MB, 4.8 MS, 5.4 MW, 5.2 MW, Class: Moderate, Intensity: VI - VII) earthquake occurred 417.6 miles away from Ashwaubenon center
On 6/28/2004 at 06:10:52, a magnitude 4.2 (4.2 MW, Depth: 6.2 mi) earthquake occurred 213.4 miles away from Ashwaubenon center
On 6/10/1987 at 23:48:54, a magnitude 5.1 (4.9 MB, 4.4 MS, 4.6 MS, 5.1 LG) earthquake occurred 392.0 miles away from the city center
On 2/10/2010 at 09:59:35, a magnitude 3.8 (3.8 MW, Depth: 6.2 mi, Class: Light, Intensity: II - III) earthquake occurred 175.4 miles away from the city center
On 4/18/2008 at 09:36:59, a magnitude 5.2 (5.2 MW, Depth: 8.9 mi) earthquake occurred 417.6 miles away from Ashwaubenon center
Magnitude types: regional Lg-wave magnitude (LG), body-wave magnitude (MB), surface-wave magnitude (MS), moment magnitude (MW)
Natural disasters:
The number of natural disasters in Brown County (7) is smaller than the US average (15).Major Disasters (Presidential) Declared: 5
Emergencies Declared: 2
Causes of natural disasters: Floods: 4, Storms: 4, Tornadoes: 2, Drought: 1, Hurricane: 1, Other: 1 (Note: some incidents may be assigned to more than one category).
Hospitals and medical centers near Ashwaubenon:
- WOODSIDE LUTHERAN HOME (Nursing Home, about 1 miles away; GREEN BAY, WI)
- KINDRED TRANSITIONAL CARE AND REHAB-SAN LUIS (Nursing Home, about 1 miles away; GREEN BAY, WI)
- SAN LUIS MANOR (Nursing Home, about 1 miles away; GREEN BAY, WI)
- ASERACARE HOSPICE (Hospital, about 2 miles away; GREEN BAY, WI)
- HEARTLAND HOME HLTH CARE (Home Health Center, about 3 miles away; DE PERE, WI)
- SOUTHERNCARE GREEN BAY (Hospital, about 3 miles away; GREEN BAY, WI)
- RENNES HEALTH CENTER (Nursing Home, about 3 miles away; DE PERE, WI)
Colleges/universities with over 2000 students nearest to Ashwaubenon:
- Northeast Wisconsin Technical College (about 3 miles; Green Bay, WI; Full-time enrollment: 6,069)
- Saint Norbert College (about 4 miles; De Pere, WI; FT enrollment: 2,324)
- University of Wisconsin-Green Bay (about 9 miles; Green Bay, WI; FT enrollment: 5,415)
- Lawrence University (about 23 miles; Appleton, WI; FT enrollment: 2,821)
- Fox Valley Technical College (about 24 miles; Appleton, WI; FT enrollment: 5,682)
- University of Wisconsin-Oshkosh (about 40 miles; Oshkosh, WI; FT enrollment: 10,637)
- Lakeland College (about 46 miles; Plymouth, WI; FT enrollment: 2,395)
User-submitted facts and corrections:
- In addition to 54313, the zip code 54304 is also found in Ashwaubenon.
Points of interest:
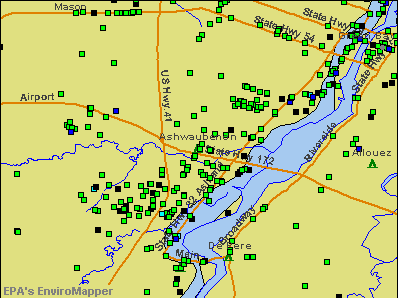
Notable locations in Ashwaubenon: National Railroad Museum (A), Austin Straubel International Airport Fire Department (B), Ashwaubenon Department of Public Safety Fire Station (C), Brown County Veterans Memorial Arena (D). Display/hide their locations on the map
Shopping Center: Bay Park Square Shopping Center (1). Display/hide its location on the map
Cemeteries: Ashwaubenon Cemetery (1), Mount Calvary Cemetery (2). Display/hide their locations on the map
Creeks: Ashwaubenon Creek (A), Dutchman Creek (B). Display/hide their locations on the map
Parks in Ashwaubenon include: Cooke Park (1), Canterbury Park (2), Ashwaumobay Memorial Park (3), Fort Howard Park (4), Smith Park (5). Display/hide their locations on the map
Birthplace of: Mike Taylor (linebacker, born c. 1990) - Football player.
| This village: | 2.2 people |
| Wisconsin: | 2.4 people |
| This village: | 61.3% |
| Whole state: | 64.4% |
| This village: | 7.2% |
| Whole state: | 7.3% |
Likely homosexual households (counted as self-reported same-sex unmarried-partner households)
- Lesbian couples: 0.2% of all households
- Gay men: 0.2% of all households
People in group quarters in Ashwaubenon in 2010:
- 249 people in nursing facilities/skilled-nursing facilities
- 17 people in residential treatment centers for juveniles (non-correctional)
- 8 people in group homes intended for adults
People in group quarters in Ashwaubenon in 2000:
- 371 people in nursing homes
- 36 people in other noninstitutional group quarters
- 8 people in homes for the mentally ill
For population 15 years and over in Ashwaubenon:
- Never married: 33.9%
- Now married: 48.1%
- Separated: 0.6%
- Widowed: 6.7%
- Divorced: 10.7%
For population 25 years and over in Ashwaubenon:
- High school or higher: 95.5%
- Bachelor's degree or higher: 35.6%
- Graduate or professional degree: 11.5%
- Unemployed: 2.8%
- Mean travel time to work (commute): 13.8 minutes
| Here: | 10.2 |
| Wisconsin average: | 10.4 |
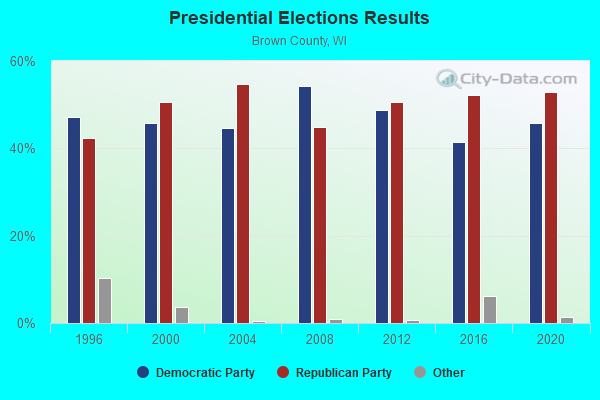
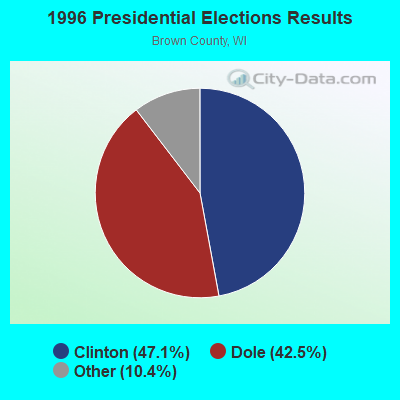
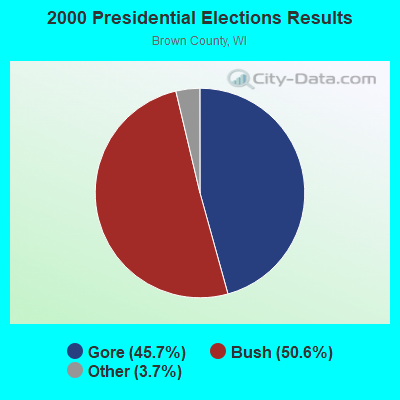
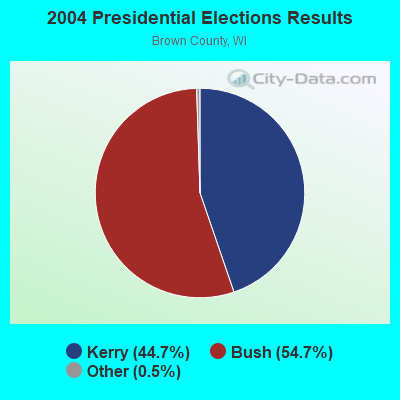
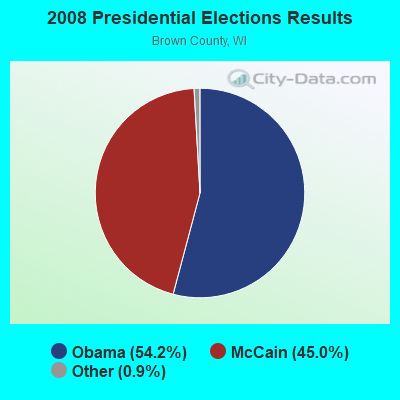
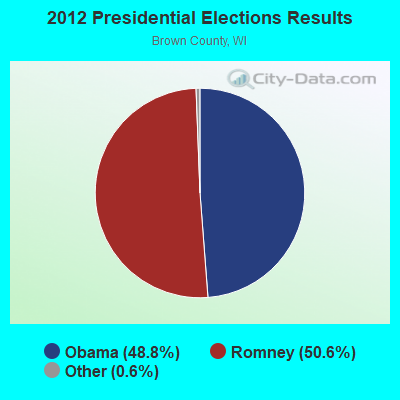
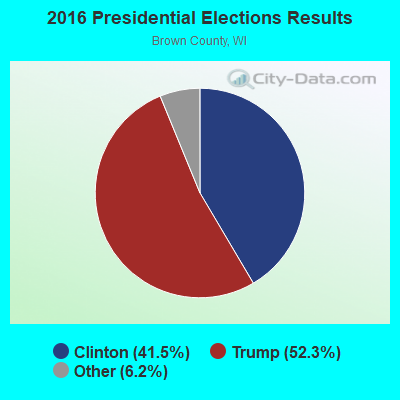

Graphs represent county-level data. Detailed 2008 Election Results
Religion statistics for Ashwaubenon, WI (based on Brown County data)
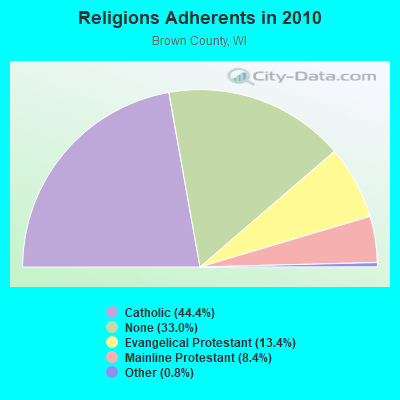
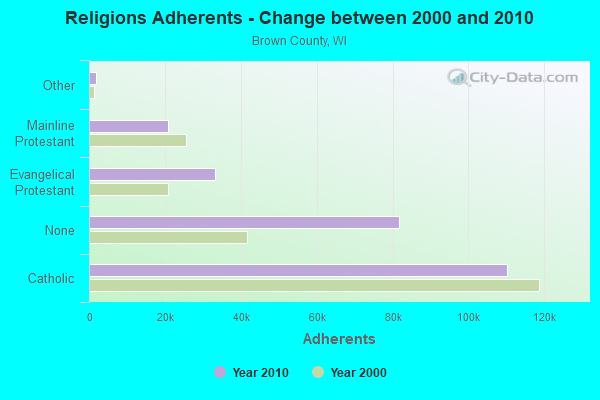
| Religion | Adherents | Congregations |
|---|---|---|
| Catholic | 110,123 | 35 |
| Evangelical Protestant | 33,156 | 79 |
| Mainline Protestant | 20,941 | 40 |
| Other | 1,913 | 12 |
| Orthodox | 100 | 1 |
| None | 81,774 | - |
Food Environment Statistics:
| Brown County: | 1.36 / 10,000 pop. |
| Wisconsin: | 1.86 / 10,000 pop. |
| This county: | 0.12 / 10,000 pop. |
| Wisconsin: | 0.11 / 10,000 pop. |
| This county: | 0.29 / 10,000 pop. |
| Wisconsin: | 0.38 / 10,000 pop. |
| Here: | 3.74 / 10,000 pop. |
| State: | 4.12 / 10,000 pop. |
| Brown County: | 8.43 / 10,000 pop. |
| Wisconsin: | 8.64 / 10,000 pop. |
| This county: | 7.0% |
| Wisconsin: | 7.6% |
| This county: | 26.7% |
| Wisconsin: | 27.5% |
| Brown County: | 13.1% |
| State: | 13.0% |
Health and Nutrition:
| Ashwaubenon: | 50.3% |
| State: | 49.5% |
| Ashwaubenon: | 48.4% |
| Wisconsin: | 46.6% |
| Here: | 28.4 |
| Wisconsin: | 28.7 |
| This city: | 23.2% |
| State: | 21.4% |
| This city: | 9.2% |
| State: | 10.2% |
| Here: | 6.9 |
| Wisconsin: | 6.8 |
| Ashwaubenon: | 32.7% |
| Wisconsin: | 34.0% |
| This city: | 58.2% |
| Wisconsin: | 56.3% |
| Here: | 79.6% |
| Wisconsin: | 78.5% |
More about Health and Nutrition of Ashwaubenon, WI Residents
| Local government employment and payroll (March 2022) | |||||
| Function | Full-time employees | Monthly full-time payroll | Average yearly full-time wage | Part-time employees | Monthly part-time payroll |
|---|---|---|---|---|---|
| Police Protection - Officers | 47 | $393,307 | $100,419 | 0 | $0 |
| Streets and Highways | 12 | $73,890 | $73,890 | 0 | $0 |
| Parks and Recreation | 7 | $41,270 | $70,749 | 34 | $12,707 |
| Other and Unallocable | 7 | $38,744 | $66,418 | 1 | $259 |
| Other Government Administration | 7 | $40,576 | $69,559 | 6 | $4,088 |
| Financial Administration | 5 | $31,564 | $75,754 | 0 | $0 |
| Solid Waste Management | 4 | $21,348 | $64,044 | 0 | $0 |
| Police - Other | 4 | $18,959 | $56,877 | 15 | $12,832 |
| Sewerage | 3 | $17,002 | $68,008 | 0 | $0 |
| Water Supply | 3 | $17,883 | $71,532 | 0 | $0 |
| Natural Resources | 2 | $14,535 | $87,210 | 1 | $263 |
| Fire - Other | 1 | $5,157 | $61,884 | 2 | $1,475 |
| Judicial and Legal | 1 | $9,215 | $110,580 | 2 | $4,005 |
| Firefighters | 0 | $0 | 16 | $4,772 | |
| Totals for Government | 103 | $723,450 | $84,285 | 77 | $40,401 |
Ashwaubenon government finances - Expenditure in 2021 (per resident):
- Construction - Regular Highways: $6,845,000 ($407.03)
General - Other: $212,000 ($12.61)
General Public Buildings: $209,000 ($12.43)
Police Protection: $124,000 ($7.37)
Parks and Recreation: $53,000 ($3.15)
Local Fire Protection: $1,000 ($0.06)
Health - Other: $1,000 ($0.06)
- Current Operations - Sewerage: $6,007,000 ($357.20)
Water Utilities: $5,221,000 ($310.46)
Police Protection: $4,064,000 ($241.66)
Regular Highways: $3,060,000 ($181.96)
Local Fire Protection: $1,994,000 ($118.57)
Health - Other: $1,891,000 ($112.45)
Parks and Recreation: $1,533,000 ($91.16)
Central Staff Services: $870,000 ($51.73)
Solid Waste Management: $841,000 ($50.01)
Financial Administration: $521,000 ($30.98)
Judicial and Legal Services: $305,000 ($18.14)
General - Other: $303,000 ($18.02)
Transit Utilities: $220,000 ($13.08)
Protective Inspection and Regulation - Other: $179,000 ($10.64)
General Public Buildings: $149,000 ($8.86)
Natural Resources - Other: $13,000 ($0.77)
- General - Interest on Debt: $1,989,000 ($118.27)
Ashwaubenon government finances - Revenue in 2021 (per resident):
- Charges - Sewerage: $4,870,000 ($289.59)
Regular Highways: $1,356,000 ($80.63)
Other: $757,000 ($45.01)
Parks and Recreation: $162,000 ($9.63)
Solid Waste Management: $6,000 ($0.36)
Parking Facilities: $3,000 ($0.18)
Natural Resources - Other: $2,000 ($0.12)
- Federal Intergovernmental - General Local Government Support: $7,000 ($0.42)
- Local Intergovernmental - Other: $699,000 ($41.57)
- Miscellaneous - General Revenue - Other: $1,380,000 ($82.06)
Sale of Property: $344,000 ($20.46)
Interest Earnings: $205,000 ($12.19)
Fines and Forfeits: $197,000 ($11.71)
Rents: $126,000 ($7.49)
Donations From Private Sources: $18,000 ($1.07)
Special Assessments: $3,000 ($0.18)
- Revenue - Water Utilities: $3,369,000 ($200.33)
- State Intergovernmental - General Local Government Support: $2,883,000 ($171.43)
Highways: $982,000 ($58.39)
Education: $344,000 ($20.46)
Other: $294,000 ($17.48)
- Tax - Property: $16,931,000 ($1006.78)
Other License: $416,000 ($24.74)
Occupation and Business License - Other: $293,000 ($17.42)
Other Selective Sales: $205,000 ($12.19)
Ashwaubenon government finances - Debt in 2021 (per resident):
- Long Term Debt - Outstanding Unspecified Public Purpose: $64,690,000 ($3846.70)
Beginning Outstanding - Unspecified Public Purpose: $62,519,000 ($3717.61)
Issue, Unspecified Public Purpose: $17,600,000 ($1046.56)
Retired Unspecified Public Purpose: $15,429,000 ($917.46)
5.04% of this county's 2021 resident taxpayers lived in other counties in 2020 ($64,264 average adjusted gross income)
| Here: | 5.04% |
| Wisconsin average: | 6.07% |
0.02% of residents moved from foreign countries ($156 average AGI)
Brown County: 0.02% Wisconsin average: 0.00%
Top counties from which taxpayers relocated into this county between 2020 and 2021:
| from Outagamie County, WI | |
| from Oconto County, WI | |
| from Milwaukee County, WI |
4.95% of this county's 2020 resident taxpayers moved to other counties in 2021 ($63,518 average adjusted gross income)
| Here: | 4.95% |
| Wisconsin average: | 6.10% |
0.02% of residents moved to foreign countries ($127 average AGI)
Brown County: 0.02% Wisconsin average: 0.00%
Top counties to which taxpayers relocated from this county between 2020 and 2021:
| to Outagamie County, WI | |
| to Oconto County, WI | |
| to Winnebago County, WI |
| Businesses in Ashwaubenon, WI | ||||
| Name | Count | Name | Count | |
|---|---|---|---|---|
| AT&T | 1 | Long John Silver's | 1 | |
| Buffalo Wild Wings | 1 | Nike | 2 | |
| Burger King | 1 | OfficeMax | 1 | |
| Chico's | 1 | Red Lobster | 1 | |
| Famous Footwear | 1 | Rue21 | 1 | |
| Fashion Bug | 1 | Starbucks | 1 | |
| FedEx | 1 | Taco Bell | 1 | |
| H&R Block | 1 | Vans | 1 | |
| JCPenney | 1 | Verizon Wireless | 1 | |
| KFC | 1 | Walgreens | 1 | |
| Kohl's | 1 | Wendy's | 1 | |
| Lane Bryant | 1 | |||
Strongest AM radio stations in Ashwaubenon:
- WTAQ (1360 AM; 10 kW; GREEN BAY, WI; Owner: MIDWEST COMMUNICATIONS, INC.)
- WNFL (1440 AM; 5 kW; GREEN BAY, WI; Owner: MIDWEST COMMUNICATIONS, INC.)
- WNAM (1280 AM; 50 kW; NEENAH-MENASHA, WI; Owner: CUMULUS LICENSING CORP.)
- WDUZ (1400 AM; 1 kW; GREEN BAY, WI; Owner: CUMULUS LICENSING CORP.)
- WHBY (1150 AM; 25 kW; KIMBERLY, WI; Owner: WOODWARD COMMUNICATIONS, INC.)
- WSPT (1010 AM; 50 kW; STEVENS POINT, WI)
- WSAU (550 AM; 20 kW; WAUSAU, WI; Owner: WRIG, INC.)
- WTMJ (620 AM; 50 kW; MILWAUKEE, WI; Owner: JOURNAL BROADCAST CORPORATION)
- WCUB (980 AM; 5 kW; TWO RIVERS, WI; Owner: CUB RADIO, INC.)
- WTCM (580 AM; 35 kW; TRAVERSE CITY, MI; Owner: WTCM RADIO, INC.)
- WISN (1130 AM; 50 kW; MILWAUKEE, WI; Owner: CAPSTAR TX LIMITED PARTNERSHIP)
- WLDR (1210 AM; daytime; 50 kW; KINGSLEY, MI; Owner: FORT BEND BROADCASTING COMPANY)
- WFCL (1380 AM; 4 kW; CLINTONVILLE, WI; Owner: RESULTS BROADCASTING CORP.)
Strongest FM radio stations in Ashwaubenon:
- WIXX (101.1 FM; GREEN BAY, WI; Owner: MIDWEST COMMUNICATIONS, INC.)
- WPNE-FM (89.3 FM; GREEN BAY, WI; Owner: WISCONSIN EDUCATIONAL COMMUNICATIONS BOARD)
- W270AJ (101.9 FM; GREEN BAY, WI; Owner: MIDWEST COMMUNICATIONS, INC)
- WKSZ (95.9 FM; DE PERE, WI; Owner: WOODWARD COMMUNICATIONS INC)
- WHID (88.1 FM; GREEN BAY, WI; Owner: BD OF REGENTS OF THE UNIV OF WI SYS)
- WOGB (103.1 FM; KAUKAUNA, WI; Owner: CUMULUS LICENSING CORP.)
- WEMY (91.5 FM; GREEN BAY, WI; Owner: EVANGEL MINISTRIES, INC)
- WXWX (107.5 FM; BRILLION, WI; Owner: CUMULUS LICENSING CORP.)
- WJLW (106.7 FM; ALLOUEZ, WI; Owner: CUMULUS LICENSING CORP)
- WORQ (90.1 FM; GREEN BAY, WI; Owner: LAKESHORE COMMUNICATIONS, INC.)
- WAPL-FM (105.7 FM; APPLETON, WI; Owner: WOODWARD COMMUNICATIONS, INC.)
- WQLH (98.5 FM; GREEN BAY, WI; Owner: CUMULUS LICENSING CORP.)
- WECB (104.3 FM; SEYMOUR, WI; Owner: WOODWARD COMMUNICATIONS, INC.)
- WPCK (104.9 FM; KAUKAUNA, WI; Owner: MIDWEST DIMENSIONS, INC.)
- WLYD (99.7 FM; STURGEON BAY, WI; Owner: MIDWEST COMMUNICATIONS INC)
- WRVM (102.7 FM; SURING, WI; Owner: WRVM, INC.)
- WOZZ (93.5 FM; NEW LONDON, WI; Owner: MIDWEST COMMUNICATIONS, INC)
- WNCY-FM (100.3 FM; NEENAH-MENASHA, WI; Owner: MIDWEST COMMUNICATIONS, INC.)
- WLFM (91.1 FM; APPLETON, WI; Owner: LAWRENCE UNIVERSITY OF WISCONSIN)
- WBDK (96.7 FM; ALGOMA, WI; Owner: NICOLET BROADCASTING, INC.)
TV broadcast stations around Ashwaubenon:
- WBAY-TV (Channel 2; GREEN BAY, WI; Owner: YOUNG BROADCASTING OF GREEN BAY, INC.)
- WPNE (Channel 38; GREEN BAY, WI; Owner: WISCONSIN EDUCATIONAL COMMUNICATIONS BOARD)
- WLUK-TV (Channel 11; GREEN BAY, WI; Owner: EMMIS TELEVISION LICENSE CORPORATION)
- WFRV-TV (Channel 5; GREEN BAY, WI; Owner: CBS BROADCASTING INC.)
- WGBA (Channel 26; GREEN BAY, WI; Owner: ARIES TELECOMMUNICATION CORPORATION)
- W49CB (Channel 49; GREEN BAY, WI; Owner: TRINITY BROADCASTING NETWORK)
- WACY (Channel 32; APPLETON, WI; Owner: ACE TV, INC.)
- WIWB (Channel 14; SURING, WI; Owner: ACME TV LICENSES OF WISCONSIN, LLC)
- W30BU (Channel 30; GREEN BAY, WI; Owner: THREE ANGELS BROADCASTING NETWORK)
- WMMF-TV (Channel 68; FOND DU LAC, WI; Owner: PAPPAS TELECASTING OF WISCONSIN, A CALIFORNIA LTD PARTNRSHP)
- National Bridge Inventory (NBI) Statistics
- 97Number of bridges
- 1,309ft / 399mTotal length
- $4,905,000Total costs
- 2,184,530Total average daily traffic
- 56,451Total average daily truck traffic
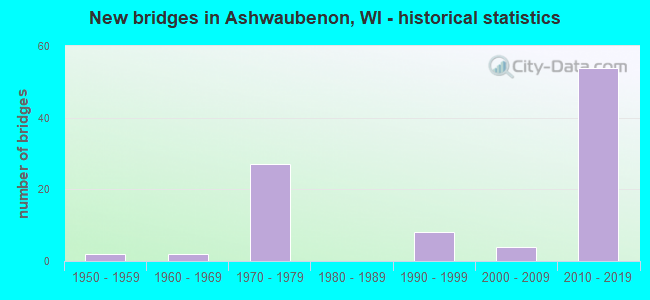
- New bridges - historical statistics
- 21950-1959
- 21960-1969
- 271970-1979
- 81990-1999
- 42000-2009
- 542010-2019
FCC Registered Cell Phone Towers:
1 (See the full list of FCC Registered Cell Phone Towers in Ashwaubenon)FCC Registered Antenna Towers:
40 (See the full list of FCC Registered Antenna Towers)FCC Registered Broadcast Land Mobile Towers:
6- 3 Km W Of Us41 .3 Km N Of Hwy 172 (Lat: 44.491111 Lon: -88.093444), Type: Tower, Structure height: 28 m, Overall height: 31 m, Call Sign: WPPG624,
Assigned Frequencies: 5350.00 MHz, Grant Date: 12/10/1999, Expiration Date: 12/10/2004, Cancellation Date: 02/12/2005, Certifier: Douglas G Kiel, Registrant: Hogan & Hartson L.L.P., 555 Thirteenth Street, Nw, Washington, DC 20004-1109, Phone: (202) 637-6845, Fax: (202) 634-7591, Email:
- Lat: 44.490278 Lon: -88.071111, Call Sign: WPSQ568, Licensee ID: L00303561,
Assigned Frequencies: 461.037 MHz, 462.912 MHz, 466.287 MHz, 469.487 MHz, Grant Date: 05/17/2011, Expiration Date: 07/12/2021, Cancellation Date: 10/09/2021, Certifier: Joan Anderberg, Registrant: Target 1247, 1000 Nicollet Mall Tpn 0910, Minneapolis, MN 55403, Phone: (612) 761-1010, Fax: (612) 761-1138, Email:
- Lat: 44.490278 Lon: -88.671111, Call Sign: WPTQ666,
Assigned Frequencies: 461.037 MHz, 462.912 MHz, 466.287 MHz, 469.487 MHz, Grant Date: 09/17/2011, Expiration Date: 11/26/2021, Cancellation Date: 01/29/2022, Certifier: Joan Anderberg, Registrant: Advanced Wireless Communications, 20855 Kensington Blvd, Lakeville, MN 55044-7486, Phone: (952) 469-0122
- 2627 South Oneid Street (Lat: 44.481111 Lon: -88.070556), Call Sign: WQBD984,
Assigned Frequencies: 469.212 MHz, 469.037 MHz, 469.237 MHz, 469.062 MHz, 469.262 MHz, 469.087 MHz, 469.287 MHz, 469.112 MHz, 469.312 MHz, 469.137 MHz... (+21 more), Grant Date: 09/24/2004, Expiration Date: 09/24/2014, Cancellation Date: 11/29/2014, Certifier: Gary E Witzel, Registrant: Panasonic Digital Communications&security Company, 1707 N. Randall Road, E1-D9, Elgin, IL 60123-7847, Phone: (847) 468-5318, Fax: (847) 574-7614, Email:
- 1391 North Rd (Lat: 44.490861 Lon: -88.092222), Type: Ltower, Structure height: 28 m, Overall height: 31.1 m, Call Sign: WQCX459,
Assigned Frequencies: 5350.00 MHz, Grant Date: 04/21/2015, Expiration Date: 06/16/2025, Certifier: William Appleton, Registrant: Baker & Hostetler LLP, 1050 Connecticut Ave., Nw, Suite 1100, Washington, DC 20036, Phone: (202) 861-1580, Email:
- 800 Willard Dr (Lat: 44.485833 Lon: -88.062778), Call Sign: WQFF952,
Assigned Frequencies: 466.962 MHz, 461.712 MHz, Grant Date: 06/02/2016, Expiration Date: 07/06/2026, Certifier: Lisa Monnig, Registrant: Bearcom Operating LLC, ., Dallas, TX 75355-9001, Phone: (800) 458-9887, Fax: (214) 355-1714, Email:
FCC Registered Microwave Towers:
1- GRN BAY #1, 261 S Broadway St (Lat: 44.471639 Lon: -88.059250), Overall height: 12.2 m, Call Sign: WLL976, Licensee ID: L00016000,
Assigned Frequencies: 11305.0 MHz, Grant Date: 03/13/2001, Expiration Date: 02/01/2011, Cancellation Date: 03/16/2005, Registrant: Norlight Telecommunications, Inc., 13935 Bishop Woods Drive, Brookfield, WI 53005, Phone: (262) 792-9700, Fax: (262) 792-7767, Email:
FCC Registered Amateur Radio Licenses:
2- Call Sign: KA0IME, Licensee ID: L00946362, Grant Date: 12/02/2014, Expiration Date: 02/24/2025, Certifier: Robert L Ferguson, Registrant: Robert L Ferguson, 2131 S Ridge Rd, Ashwaubenon, WI 54304
- Call Sign: N9NFF, Licensee ID: L00806719, Grant Date: 08/23/1994, Expiration Date: 11/19/2001, Cancellation Date: 11/20/2003, Registrant: William N Ehrendreich, 2015 Hilltop Dr, Ashwaubenon, WI 54313-5380
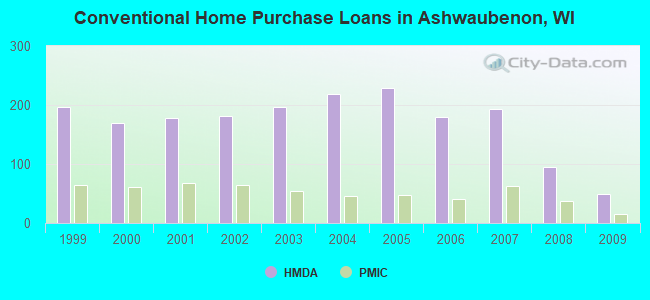
| Home Mortgage Disclosure Act Aggregated Statistics For Year 2009 (Based on 2 full and 2 partial tracts) | ||||||||||||||
| A) FHA, FSA/RHS & VA Home Purchase Loans | B) Conventional Home Purchase Loans | C) Refinancings | D) Home Improvement Loans | E) Loans on Dwellings For 5+ Families | F) Non-occupant Loans on < 5 Family Dwellings (A B C & D) | G) Loans On Manufactured Home Dwelling (A B C & D) | ||||||||
|---|---|---|---|---|---|---|---|---|---|---|---|---|---|---|
| Number | Average Value | Number | Average Value | Number | Average Value | Number | Average Value | Number | Average Value | Number | Average Value | Number | Average Value | |
| LOANS ORIGINATED | 46 | $131,299 | 50 | $125,493 | 543 | $122,367 | 30 | $43,483 | 5 | $531,838 | 22 | $89,485 | 0 | $0 |
| APPLICATIONS APPROVED, NOT ACCEPTED | 1 | $80,680 | 2 | $86,975 | 40 | $120,681 | 1 | $7,580 | 0 | $0 | 0 | $0 | 0 | $0 |
| APPLICATIONS DENIED | 6 | $139,102 | 4 | $112,805 | 81 | $132,840 | 14 | $22,414 | 0 | $0 | 2 | $75,000 | 1 | $15,000 |
| APPLICATIONS WITHDRAWN | 2 | $111,000 | 4 | $109,180 | 55 | $121,061 | 2 | $53,270 | 0 | $0 | 2 | $116,140 | 0 | $0 |
| FILES CLOSED FOR INCOMPLETENESS | 0 | $0 | 0 | $0 | 18 | $148,135 | 0 | $0 | 0 | $0 | 0 | $0 | 0 | $0 |
Detailed HMDA statistics for the following Tracts: 0213.01 , 0213.02, 0213.03, 0213.04
| Private Mortgage Insurance Companies Aggregated Statistics For Year 2009 (Based on 2 full and 2 partial tracts) | ||||
| A) Conventional Home Purchase Loans | B) Refinancings | |||
|---|---|---|---|---|
| Number | Average Value | Number | Average Value | |
| LOANS ORIGINATED | 15 | $150,223 | 20 | $147,670 |
| APPLICATIONS APPROVED, NOT ACCEPTED | 1 | $170,000 | 6 | $141,895 |
| APPLICATIONS DENIED | 1 | $165,920 | 3 | $191,620 |
| APPLICATIONS WITHDRAWN | 2 | $230,960 | 1 | $90,330 |
| FILES CLOSED FOR INCOMPLETENESS | 0 | $0 | 1 | $176,000 |
Detailed PMIC statistics for the following Tracts: 0213.01 , 0213.02, 0213.03, 0213.04

2003 - 2018 National Fire Incident Reporting System (NFIRS) incidents
- Fire incident types reported to NFIRS in Ashwaubenon, WI
- 15939.8%Structure Fires
- 10726.8%Mobile Property/Vehicle Fires
- 10225.6%Outside Fires
- 317.8%Other
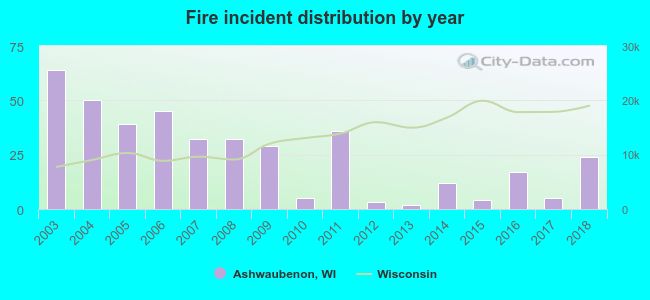 According to the data from the years 2003 - 2018 the average number of fire incidents per year is 25. The highest number of fires - 64 took place in 2003, and the least - 2 in 2013. The data has a dropping trend.
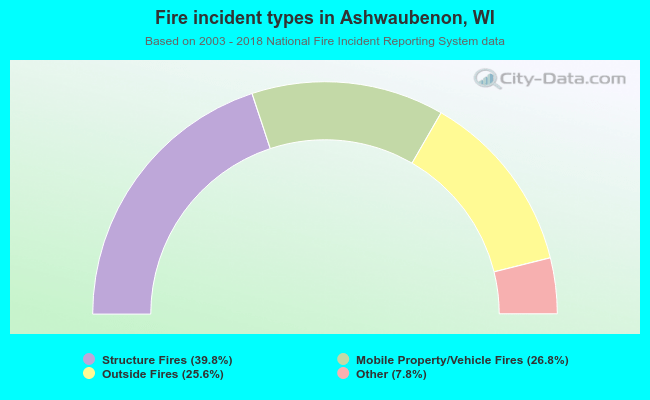 When looking into fire subcategories, the most incidents belonged to: Structure Fires (39.8%), and Mobile Property/Vehicle Fires (26.8%).
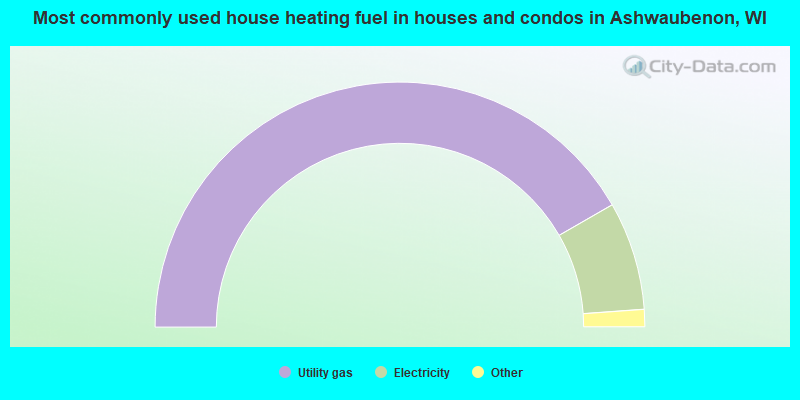
- 83.3%Utility gas
- 14.3%Electricity
- 1.7%Bottled, tank, or LP gas
- 0.3%Wood
- 0.3%No fuel used
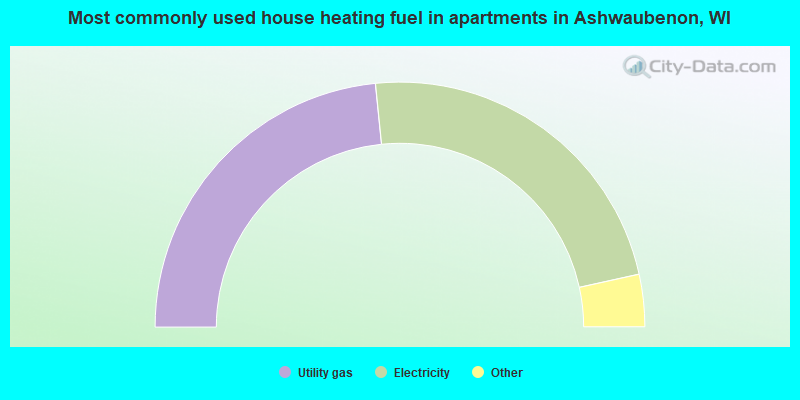
- 46.8%Utility gas
- 46.3%Electricity
- 2.8%Other fuel
- 2.6%Bottled, tank, or LP gas
- 1.4%No fuel used
Ashwaubenon compared to Wisconsin state average:
- Unemployed percentage significantly below state average.
- Black race population percentage significantly below state average.
- Hispanic race population percentage below state average.
- Length of stay since moving in significantly above state average.
- House age below state average.
- Percentage of population with a bachelor's degree or higher above state average.
Ashwaubenon on our top lists:
- #79 on the list of "Top 101 cities that people commute into (largest positive percentage daily daytime population change due to commuting) (population 5,000+)"
- #12 on the list of "Top 101 counties with the lowest percentage of residents relocating to foreign countries in 2011"
- #65 on the list of "Top 101 counties with the highest Sulfur Oxides Annual air pollution readings in 2012 (µg/m3)"
- #83 on the list of "Top 101 counties with the lowest percentage of residents relocating from foreign countries between 2010 and 2011"
- #90 on the list of "Top 101 counties with the largest increase in the number of births per 1000 residents 2000-2006 to 2007-2013 (pop 50,000+)"

|
Total of 1 patent application in 2008-2024.