Bel Air, Maryland Submit your own pictures of this town and show them to the world
OSM Map
General Map
Google Map
MSN Map
OSM Map
General Map
Google Map
MSN Map
OSM Map
General Map
Google Map
MSN Map
OSM Map
General Map
Google Map
MSN Map
Please wait while loading the map...
Population in 2022: 10,596 (100% urban, 0% rural). Population change since 2000: +5.1%Males: 5,241 Females: 5,355
March 2022 cost of living index in Bel Air: 106.8 (more than average, U.S. average is 100) Percentage of residents living in poverty in 2022: 17.9%for White Non-Hispanic residents , 60.0% for Black residents , 32.5% for Hispanic or Latino residents , 60.0% for other race residents , 4.2% for two or more races residents )
Profiles of local businesses
Business Search - 14 Million verified businesses
Data:
Median household income ($)
Median household income (% change since 2000)
Household income diversity
Ratio of average income to average house value (%)
Ratio of average income to average rent
Median household income ($) - White
Median household income ($) - Black or African American
Median household income ($) - Asian
Median household income ($) - Hispanic or Latino
Median household income ($) - American Indian and Alaska Native
Median household income ($) - Multirace
Median household income ($) - Other Race
Median household income for houses/condos with a mortgage ($)
Median household income for apartments without a mortgage ($)
Races - White alone (%)
Races - White alone (% change since 2000)
Races - Black alone (%)
Races - Black alone (% change since 2000)
Races - American Indian alone (%)
Races - American Indian alone (% change since 2000)
Races - Asian alone (%)
Races - Asian alone (% change since 2000)
Races - Hispanic (%)
Races - Hispanic (% change since 2000)
Races - Native Hawaiian and Other Pacific Islander alone (%)
Races - Native Hawaiian and Other Pacific Islander alone (% change since 2000)
Races - Two or more races (%)
Races - Two or more races (% change since 2000)
Races - Other race alone (%)
Races - Other race alone (% change since 2000)
Racial diversity
Unemployment (%)
Unemployment (% change since 2000)
Unemployment (%) - White
Unemployment (%) - Black or African American
Unemployment (%) - Asian
Unemployment (%) - Hispanic or Latino
Unemployment (%) - American Indian and Alaska Native
Unemployment (%) - Multirace
Unemployment (%) - Other Race
Population density (people per square mile)
Population - Males (%)
Population - Females (%)
Population - Males (%) - White
Population - Males (%) - Black or African American
Population - Males (%) - Asian
Population - Males (%) - Hispanic or Latino
Population - Males (%) - American Indian and Alaska Native
Population - Males (%) - Multirace
Population - Males (%) - Other Race
Population - Females (%) - White
Population - Females (%) - Black or African American
Population - Females (%) - Asian
Population - Females (%) - Hispanic or Latino
Population - Females (%) - American Indian and Alaska Native
Population - Females (%) - Multirace
Population - Females (%) - Other Race
Coronavirus confirmed cases (Jun 16, 2024)
Deaths caused by coronavirus (Jun 16, 2024)
Coronavirus confirmed cases (per 100k population) (Jun 16, 2024)
Deaths caused by coronavirus (per 100k population) (Jun 16, 2024)
Daily increase in number of cases (Jun 16, 2024)
Weekly increase in number of cases (Jun 16, 2024)
Cases doubled (in days) (Jun 16, 2024)
Hospitalized patients (Apr 18, 2022)
Negative test results (Apr 18, 2022)
Total test results (Apr 18, 2022)
COVID Vaccine doses distributed (per 100k population) (Sep 19, 2023)
COVID Vaccine doses administered (per 100k population) (Sep 19, 2023)
COVID Vaccine doses distributed (Sep 19, 2023)
COVID Vaccine doses administered (Sep 19, 2023)
Likely homosexual households (%)
Likely homosexual households (% change since 2000)
Likely homosexual households - Lesbian couples (%)
Likely homosexual households - Lesbian couples (% change since 2000)
Likely homosexual households - Gay men (%)
Likely homosexual households - Gay men (% change since 2000)
Cost of living index
Median gross rent ($)
Median contract rent ($)
Median monthly housing costs ($)
Median house or condo value ($)
Median house or condo value ($ change since 2000)
Mean house or condo value by units in structure - 1, detached ($)
Mean house or condo value by units in structure - 1, attached ($)
Mean house or condo value by units in structure - 2 ($)
Mean house or condo value by units in structure by units in structure - 3 or 4 ($)
Mean house or condo value by units in structure - 5 or more ($)
Mean house or condo value by units in structure - Boat, RV, van, etc. ($)
Mean house or condo value by units in structure - Mobile home ($)
Median house or condo value ($) - White
Median house or condo value ($) - Black or African American
Median house or condo value ($) - Asian
Median house or condo value ($) - Hispanic or Latino
Median house or condo value ($) - American Indian and Alaska Native
Median house or condo value ($) - Multirace
Median house or condo value ($) - Other Race
Median resident age
Resident age diversity
Median resident age - Males
Median resident age - Females
Median resident age - White
Median resident age - Black or African American
Median resident age - Asian
Median resident age - Hispanic or Latino
Median resident age - American Indian and Alaska Native
Median resident age - Multirace
Median resident age - Other Race
Median resident age - Males - White
Median resident age - Males - Black or African American
Median resident age - Males - Asian
Median resident age - Males - Hispanic or Latino
Median resident age - Males - American Indian and Alaska Native
Median resident age - Males - Multirace
Median resident age - Males - Other Race
Median resident age - Females - White
Median resident age - Females - Black or African American
Median resident age - Females - Asian
Median resident age - Females - Hispanic or Latino
Median resident age - Females - American Indian and Alaska Native
Median resident age - Females - Multirace
Median resident age - Females - Other Race
Commute - mean travel time to work (minutes)
Travel time to work - Less than 5 minutes (%)
Travel time to work - Less than 5 minutes (% change since 2000)
Travel time to work - 5 to 9 minutes (%)
Travel time to work - 5 to 9 minutes (% change since 2000)
Travel time to work - 10 to 19 minutes (%)
Travel time to work - 10 to 19 minutes (% change since 2000)
Travel time to work - 20 to 29 minutes (%)
Travel time to work - 20 to 29 minutes (% change since 2000)
Travel time to work - 30 to 39 minutes (%)
Travel time to work - 30 to 39 minutes (% change since 2000)
Travel time to work - 40 to 59 minutes (%)
Travel time to work - 40 to 59 minutes (% change since 2000)
Travel time to work - 60 to 89 minutes (%)
Travel time to work - 60 to 89 minutes (% change since 2000)
Travel time to work - 90 or more minutes (%)
Travel time to work - 90 or more minutes (% change since 2000)
Marital status - Never married (%)
Marital status - Now married (%)
Marital status - Separated (%)
Marital status - Widowed (%)
Marital status - Divorced (%)
Median family income ($)
Median family income (% change since 2000)
Median non-family income ($)
Median non-family income (% change since 2000)
Median per capita income ($)
Median per capita income (% change since 2000)
Median family income ($) - White
Median family income ($) - Black or African American
Median family income ($) - Asian
Median family income ($) - Hispanic or Latino
Median family income ($) - American Indian and Alaska Native
Median family income ($) - Multirace
Median family income ($) - Other Race
Median year house/condo built
Median year apartment built
Year house built - Built 2005 or later (%)
Year house built - Built 2000 to 2004 (%)
Year house built - Built 1990 to 1999 (%)
Year house built - Built 1980 to 1989 (%)
Year house built - Built 1970 to 1979 (%)
Year house built - Built 1960 to 1969 (%)
Year house built - Built 1950 to 1959 (%)
Year house built - Built 1940 to 1949 (%)
Year house built - Built 1939 or earlier (%)
Average household size
Household density (households per square mile)
Average household size - White
Average household size - Black or African American
Average household size - Asian
Average household size - Hispanic or Latino
Average household size - American Indian and Alaska Native
Average household size - Multirace
Average household size - Other Race
Occupied housing units (%)
Vacant housing units (%)
Owner occupied housing units (%)
Renter occupied housing units (%)
Vacancy status - For rent (%)
Vacancy status - For sale only (%)
Vacancy status - Rented or sold, not occupied (%)
Vacancy status - For seasonal, recreational, or occasional use (%)
Vacancy status - For migrant workers (%)
Vacancy status - Other vacant (%)
Residents with income below the poverty level (%)
Residents with income below 50% of the poverty level (%)
Children below poverty level (%)
Poor families by family type - Married-couple family (%)
Poor families by family type - Male, no wife present (%)
Poor families by family type - Female, no husband present (%)
Poverty status for native-born residents (%)
Poverty status for foreign-born residents (%)
Poverty among high school graduates not in families (%)
Poverty among people who did not graduate high school not in families (%)
Residents with income below the poverty level (%) - White
Residents with income below the poverty level (%) - Black or African American
Residents with income below the poverty level (%) - Asian
Residents with income below the poverty level (%) - Hispanic or Latino
Residents with income below the poverty level (%) - American Indian and Alaska Native
Residents with income below the poverty level (%) - Multirace
Residents with income below the poverty level (%) - Other Race
Air pollution - Air Quality Index (AQI)
Air pollution - CO
Air pollution - NO2
Air pollution - SO2
Air pollution - Ozone
Air pollution - PM10
Air pollution - PM25
Air pollution - Pb
Crime - Murders per 100,000 population
Crime - Rapes per 100,000 population
Crime - Robberies per 100,000 population
Crime - Assaults per 100,000 population
Crime - Burglaries per 100,000 population
Crime - Thefts per 100,000 population
Crime - Auto thefts per 100,000 population
Crime - Arson per 100,000 population
Crime - City-data.com crime index
Crime - Violent crime index
Crime - Property crime index
Crime - Murders per 100,000 population (5 year average)
Crime - Rapes per 100,000 population (5 year average)
Crime - Robberies per 100,000 population (5 year average)
Crime - Assaults per 100,000 population (5 year average)
Crime - Burglaries per 100,000 population (5 year average)
Crime - Thefts per 100,000 population (5 year average)
Crime - Auto thefts per 100,000 population (5 year average)
Crime - Arson per 100,000 population (5 year average)
Crime - City-data.com crime index (5 year average)
Crime - Violent crime index (5 year average)
Crime - Property crime index (5 year average)
1996 Presidential Elections Results (%) - Democratic Party (Clinton)
1996 Presidential Elections Results (%) - Republican Party (Dole)
1996 Presidential Elections Results (%) - Other
2000 Presidential Elections Results (%) - Democratic Party (Gore)
2000 Presidential Elections Results (%) - Republican Party (Bush)
2000 Presidential Elections Results (%) - Other
2004 Presidential Elections Results (%) - Democratic Party (Kerry)
2004 Presidential Elections Results (%) - Republican Party (Bush)
2004 Presidential Elections Results (%) - Other
2008 Presidential Elections Results (%) - Democratic Party (Obama)
2008 Presidential Elections Results (%) - Republican Party (McCain)
2008 Presidential Elections Results (%) - Other
2012 Presidential Elections Results (%) - Democratic Party (Obama)
2012 Presidential Elections Results (%) - Republican Party (Romney)
2012 Presidential Elections Results (%) - Other
2016 Presidential Elections Results (%) - Democratic Party (Clinton)
2016 Presidential Elections Results (%) - Republican Party (Trump)
2016 Presidential Elections Results (%) - Other
2020 Presidential Elections Results (%) - Democratic Party (Biden)
2020 Presidential Elections Results (%) - Republican Party (Trump)
2020 Presidential Elections Results (%) - Other
Ancestries Reported - Arab (%)
Ancestries Reported - Czech (%)
Ancestries Reported - Danish (%)
Ancestries Reported - Dutch (%)
Ancestries Reported - English (%)
Ancestries Reported - French (%)
Ancestries Reported - French Canadian (%)
Ancestries Reported - German (%)
Ancestries Reported - Greek (%)
Ancestries Reported - Hungarian (%)
Ancestries Reported - Irish (%)
Ancestries Reported - Italian (%)
Ancestries Reported - Lithuanian (%)
Ancestries Reported - Norwegian (%)
Ancestries Reported - Polish (%)
Ancestries Reported - Portuguese (%)
Ancestries Reported - Russian (%)
Ancestries Reported - Scotch-Irish (%)
Ancestries Reported - Scottish (%)
Ancestries Reported - Slovak (%)
Ancestries Reported - Subsaharan African (%)
Ancestries Reported - Swedish (%)
Ancestries Reported - Swiss (%)
Ancestries Reported - Ukrainian (%)
Ancestries Reported - United States (%)
Ancestries Reported - Welsh (%)
Ancestries Reported - West Indian (%)
Ancestries Reported - Other (%)
Educational Attainment - No schooling completed (%)
Educational Attainment - Less than high school (%)
Educational Attainment - High school or equivalent (%)
Educational Attainment - Less than 1 year of college (%)
Educational Attainment - 1 or more years of college (%)
Educational Attainment - Associate degree (%)
Educational Attainment - Bachelor's degree (%)
Educational Attainment - Master's degree (%)
Educational Attainment - Professional school degree (%)
Educational Attainment - Doctorate degree (%)
School Enrollment - Nursery, preschool (%)
School Enrollment - Kindergarten (%)
School Enrollment - Grade 1 to 4 (%)
School Enrollment - Grade 5 to 8 (%)
School Enrollment - Grade 9 to 12 (%)
School Enrollment - College undergrad (%)
School Enrollment - Graduate or professional (%)
School Enrollment - Not enrolled in school (%)
School enrollment - Public schools (%)
School enrollment - Private schools (%)
School enrollment - Not enrolled (%)
Median number of rooms in houses and condos
Median number of rooms in apartments
Housing units lacking complete plumbing facilities (%)
Housing units lacking complete kitchen facilities (%)
Density of houses
Urban houses (%)
Rural houses (%)
Households with people 60 years and over (%)
Households with people 65 years and over (%)
Households with people 75 years and over (%)
Households with one or more nonrelatives (%)
Households with no nonrelatives (%)
Population in households (%)
Family households (%)
Nonfamily households (%)
Population in families (%)
Family households with own children (%)
Median number of bedrooms in owner occupied houses
Mean number of bedrooms in owner occupied houses
Median number of bedrooms in renter occupied houses
Mean number of bedrooms in renter occupied houses
Median number of vehichles in owner occupied houses
Mean number of vehichles in owner occupied houses
Median number of vehichles in renter occupied houses
Mean number of vehichles in renter occupied houses
Mortgage status - with mortgage (%)
Mortgage status - with second mortgage (%)
Mortgage status - with home equity loan (%)
Mortgage status - with both second mortgage and home equity loan (%)
Mortgage status - without a mortgage (%)
Average family size
Average family size - White
Average family size - Black or African American
Average family size - Asian
Average family size - Hispanic or Latino
Average family size - American Indian and Alaska Native
Average family size - Multirace
Average family size - Other Race
Geographical mobility - Same house 1 year ago (%)
Geographical mobility - Moved within same county (%)
Geographical mobility - Moved from different county within same state (%)
Geographical mobility - Moved from different state (%)
Geographical mobility - Moved from abroad (%)
Place of birth - Born in state of residence (%)
Place of birth - Born in other state (%)
Place of birth - Native, outside of US (%)
Place of birth - Foreign born (%)
Housing units in structures - 1, detached (%)
Housing units in structures - 1, attached (%)
Housing units in structures - 2 (%)
Housing units in structures - 3 or 4 (%)
Housing units in structures - 5 to 9 (%)
Housing units in structures - 10 to 19 (%)
Housing units in structures - 20 to 49 (%)
Housing units in structures - 50 or more (%)
Housing units in structures - Mobile home (%)
Housing units in structures - Boat, RV, van, etc. (%)
House/condo owner moved in on average (years ago)
Renter moved in on average (years ago)
Year householder moved into unit - Moved in 1999 to March 2000 (%)
Year householder moved into unit - Moved in 1995 to 1998 (%)
Year householder moved into unit - Moved in 1990 to 1994 (%)
Year householder moved into unit - Moved in 1980 to 1989 (%)
Year householder moved into unit - Moved in 1970 to 1979 (%)
Year householder moved into unit - Moved in 1969 or earlier (%)
Means of transportation to work - Drove car alone (%)
Means of transportation to work - Carpooled (%)
Means of transportation to work - Public transportation (%)
Means of transportation to work - Bus or trolley bus (%)
Means of transportation to work - Streetcar or trolley car (%)
Means of transportation to work - Subway or elevated (%)
Means of transportation to work - Railroad (%)
Means of transportation to work - Ferryboat (%)
Means of transportation to work - Taxicab (%)
Means of transportation to work - Motorcycle (%)
Means of transportation to work - Bicycle (%)
Means of transportation to work - Walked (%)
Means of transportation to work - Other means (%)
Working at home (%)
Industry diversity
Most Common Industries - Agriculture, forestry, fishing and hunting, and mining (%)
Most Common Industries - Agriculture, forestry, fishing and hunting (%)
Most Common Industries - Mining, quarrying, and oil and gas extraction (%)
Most Common Industries - Construction (%)
Most Common Industries - Manufacturing (%)
Most Common Industries - Wholesale trade (%)
Most Common Industries - Retail trade (%)
Most Common Industries - Transportation and warehousing, and utilities (%)
Most Common Industries - Transportation and warehousing (%)
Most Common Industries - Utilities (%)
Most Common Industries - Information (%)
Most Common Industries - Finance and insurance, and real estate and rental and leasing (%)
Most Common Industries - Finance and insurance (%)
Most Common Industries - Real estate and rental and leasing (%)
Most Common Industries - Professional, scientific, and management, and administrative and waste management services (%)
Most Common Industries - Professional, scientific, and technical services (%)
Most Common Industries - Management of companies and enterprises (%)
Most Common Industries - Administrative and support and waste management services (%)
Most Common Industries - Educational services, and health care and social assistance (%)
Most Common Industries - Educational services (%)
Most Common Industries - Health care and social assistance (%)
Most Common Industries - Arts, entertainment, and recreation, and accommodation and food services (%)
Most Common Industries - Arts, entertainment, and recreation (%)
Most Common Industries - Accommodation and food services (%)
Most Common Industries - Other services, except public administration (%)
Most Common Industries - Public administration (%)
Occupation diversity
Most Common Occupations - Management, business, science, and arts occupations (%)
Most Common Occupations - Management, business, and financial occupations (%)
Most Common Occupations - Management occupations (%)
Most Common Occupations - Business and financial operations occupations (%)
Most Common Occupations - Computer, engineering, and science occupations (%)
Most Common Occupations - Computer and mathematical occupations (%)
Most Common Occupations - Architecture and engineering occupations (%)
Most Common Occupations - Life, physical, and social science occupations (%)
Most Common Occupations - Education, legal, community service, arts, and media occupations (%)
Most Common Occupations - Community and social service occupations (%)
Most Common Occupations - Legal occupations (%)
Most Common Occupations - Education, training, and library occupations (%)
Most Common Occupations - Arts, design, entertainment, sports, and media occupations (%)
Most Common Occupations - Healthcare practitioners and technical occupations (%)
Most Common Occupations - Health diagnosing and treating practitioners and other technical occupations (%)
Most Common Occupations - Health technologists and technicians (%)
Most Common Occupations - Service occupations (%)
Most Common Occupations - Healthcare support occupations (%)
Most Common Occupations - Protective service occupations (%)
Most Common Occupations - Fire fighting and prevention, and other protective service workers including supervisors (%)
Most Common Occupations - Law enforcement workers including supervisors (%)
Most Common Occupations - Food preparation and serving related occupations (%)
Most Common Occupations - Building and grounds cleaning and maintenance occupations (%)
Most Common Occupations - Personal care and service occupations (%)
Most Common Occupations - Sales and office occupations (%)
Most Common Occupations - Sales and related occupations (%)
Most Common Occupations - Office and administrative support occupations (%)
Most Common Occupations - Natural resources, construction, and maintenance occupations (%)
Most Common Occupations - Farming, fishing, and forestry occupations (%)
Most Common Occupations - Construction and extraction occupations (%)
Most Common Occupations - Installation, maintenance, and repair occupations (%)
Most Common Occupations - Production, transportation, and material moving occupations (%)
Most Common Occupations - Production occupations (%)
Most Common Occupations - Transportation occupations (%)
Most Common Occupations - Material moving occupations (%)
People in Group quarters - Institutionalized population (%)
People in Group quarters - Correctional institutions (%)
People in Group quarters - Federal prisons and detention centers (%)
People in Group quarters - Halfway houses (%)
People in Group quarters - Local jails and other confinement facilities (including police lockups) (%)
People in Group quarters - Military disciplinary barracks (%)
People in Group quarters - State prisons (%)
People in Group quarters - Other types of correctional institutions (%)
People in Group quarters - Nursing homes (%)
People in Group quarters - Hospitals/wards, hospices, and schools for the handicapped (%)
People in Group quarters - Hospitals/wards and hospices for chronically ill (%)
People in Group quarters - Hospices or homes for chronically ill (%)
People in Group quarters - Military hospitals or wards for chronically ill (%)
People in Group quarters - Other hospitals or wards for chronically ill (%)
People in Group quarters - Hospitals or wards for drug/alcohol abuse (%)
People in Group quarters - Mental (Psychiatric) hospitals or wards (%)
People in Group quarters - Schools, hospitals, or wards for the mentally retarded (%)
People in Group quarters - Schools, hospitals, or wards for the physically handicapped (%)
People in Group quarters - Institutions for the deaf (%)
People in Group quarters - Institutions for the blind (%)
People in Group quarters - Orthopedic wards and institutions for the physically handicapped (%)
People in Group quarters - Wards in general hospitals for patients who have no usual home elsewhere (%)
People in Group quarters - Wards in military hospitals for patients who have no usual home elsewhere (%)
People in Group quarters - Juvenile institutions (%)
People in Group quarters - Long-term care (%)
People in Group quarters - Homes for abused, dependent, and neglected children (%)
People in Group quarters - Residential treatment centers for emotionally disturbed children (%)
People in Group quarters - Training schools for juvenile delinquents (%)
People in Group quarters - Short-term care, detention or diagnostic centers for delinquent children (%)
People in Group quarters - Type of juvenile institution unknown (%)
People in Group quarters - Noninstitutionalized population (%)
People in Group quarters - College dormitories (includes college quarters off campus) (%)
People in Group quarters - Military quarters (%)
People in Group quarters - On base (%)
People in Group quarters - Barracks, unaccompanied personnel housing (UPH), (Enlisted/Officer), ;and similar group living quarters for military personnel (%)
People in Group quarters - Transient quarters for temporary residents (%)
People in Group quarters - Military ships (%)
People in Group quarters - Group homes (%)
People in Group quarters - Homes or halfway houses for drug/alcohol abuse (%)
People in Group quarters - Homes for the mentally ill (%)
People in Group quarters - Homes for the mentally retarded (%)
People in Group quarters - Homes for the physically handicapped (%)
People in Group quarters - Other group homes (%)
People in Group quarters - Religious group quarters (%)
People in Group quarters - Dormitories (%)
People in Group quarters - Agriculture workers' dormitories on farms (%)
People in Group quarters - Job Corps and vocational training facilities (%)
People in Group quarters - Other workers' dormitories (%)
People in Group quarters - Crews of maritime vessels (%)
People in Group quarters - Other nonhousehold living situations (%)
People in Group quarters - Other noninstitutional group quarters (%)
Residents speaking English at home (%)
Residents speaking English at home - Born in the United States (%)
Residents speaking English at home - Native, born elsewhere (%)
Residents speaking English at home - Foreign born (%)
Residents speaking Spanish at home (%)
Residents speaking Spanish at home - Born in the United States (%)
Residents speaking Spanish at home - Native, born elsewhere (%)
Residents speaking Spanish at home - Foreign born (%)
Residents speaking other language at home (%)
Residents speaking other language at home - Born in the United States (%)
Residents speaking other language at home - Native, born elsewhere (%)
Residents speaking other language at home - Foreign born (%)
Class of Workers - Employee of private company (%)
Class of Workers - Self-employed in own incorporated business (%)
Class of Workers - Private not-for-profit wage and salary workers (%)
Class of Workers - Local government workers (%)
Class of Workers - State government workers (%)
Class of Workers - Federal government workers (%)
Class of Workers - Self-employed workers in own not incorporated business and Unpaid family workers (%)
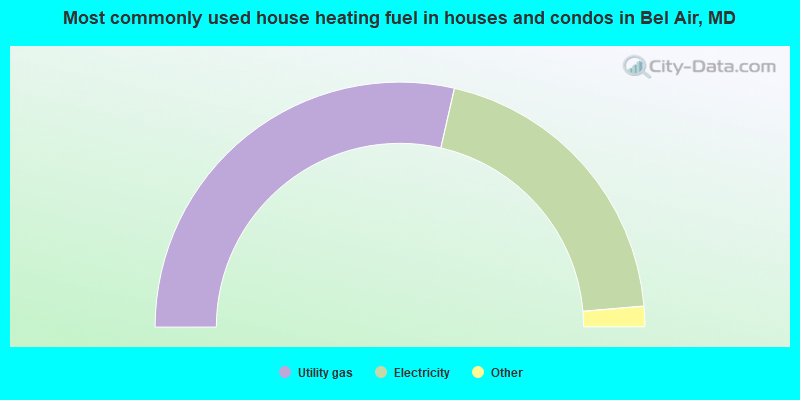
House heating fuel used in houses and condos - Utility gas (%)
House heating fuel used in houses and condos - Bottled, tank, or LP gas (%)
House heating fuel used in houses and condos - Electricity (%)
House heating fuel used in houses and condos - Fuel oil, kerosene, etc. (%)
House heating fuel used in houses and condos - Coal or coke (%)
House heating fuel used in houses and condos - Wood (%)
House heating fuel used in houses and condos - Solar energy (%)
House heating fuel used in houses and condos - Other fuel (%)
House heating fuel used in houses and condos - No fuel used (%)
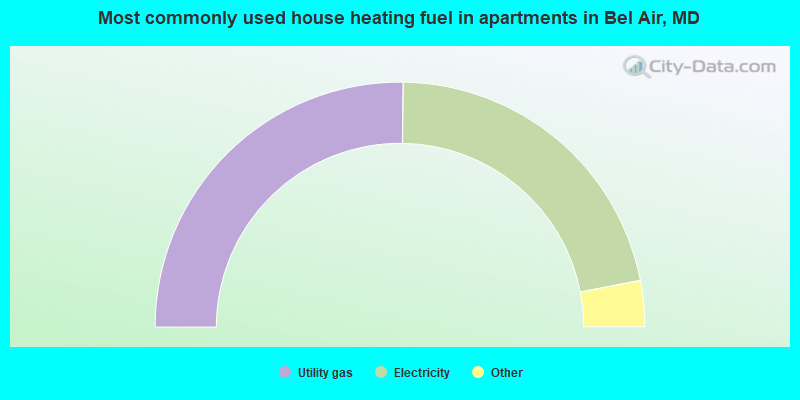
House heating fuel used in apartments - Utility gas (%)
House heating fuel used in apartments - Bottled, tank, or LP gas (%)
House heating fuel used in apartments - Electricity (%)
House heating fuel used in apartments - Fuel oil, kerosene, etc. (%)
House heating fuel used in apartments - Coal or coke (%)
House heating fuel used in apartments - Wood (%)
House heating fuel used in apartments - Solar energy (%)
House heating fuel used in apartments - Other fuel (%)
House heating fuel used in apartments - No fuel used (%)
Armed forces status - In Armed Forces (%)
Armed forces status - Civilian (%)
Armed forces status - Civilian - Veteran (%)
Armed forces status - Civilian - Nonveteran (%)
Fatal accidents locations in years 2005-2021
Fatal accidents locations in 2005
Fatal accidents locations in 2006
Fatal accidents locations in 2007
Fatal accidents locations in 2008
Fatal accidents locations in 2009
Fatal accidents locations in 2010
Fatal accidents locations in 2011
Fatal accidents locations in 2012
Fatal accidents locations in 2013
Fatal accidents locations in 2014
Fatal accidents locations in 2015
Fatal accidents locations in 2016
Fatal accidents locations in 2017
Fatal accidents locations in 2018
Fatal accidents locations in 2019
Fatal accidents locations in 2020
Fatal accidents locations in 2021
Alcohol use - People drinking some alcohol every month (%)
Alcohol use - People not drinking at all (%)
Alcohol use - Average days/month drinking alcohol
Alcohol use - Average drinks/week
Alcohol use - Average days/year people drink much
Audiometry - Average condition of hearing (%)
Audiometry - People that can hear a whisper from across a quiet room (%)
Audiometry - People that can hear normal voice from across a quiet room (%)
Audiometry - Ears ringing, roaring, buzzing (%)
Audiometry - Had a job exposure to loud noise (%)
Audiometry - Had off-work exposure to loud noise (%)
Blood Pressure & Cholesterol - Has high blood pressure (%)
Blood Pressure & Cholesterol - Checking blood pressure at home (%)
Blood Pressure & Cholesterol - Frequently checking blood cholesterol (%)
Blood Pressure & Cholesterol - Has high cholesterol level (%)
Consumer Behavior - Money monthly spent on food at supermarket/grocery store
Consumer Behavior - Money monthly spent on food at other stores
Consumer Behavior - Money monthly spent on eating out
Consumer Behavior - Money monthly spent on carryout/delivered foods
Consumer Behavior - Income spent on food at supermarket/grocery store (%)
Consumer Behavior - Income spent on food at other stores (%)
Consumer Behavior - Income spent on eating out (%)
Consumer Behavior - Income spent on carryout/delivered foods (%)
Current Health Status - General health condition (%)
Current Health Status - Blood donors (%)
Current Health Status - Has blood ever tested for HIV virus (%)
Current Health Status - Left-handed people (%)
Dermatology - People using sunscreen (%)
Diabetes - Diabetics (%)
Diabetes - Had a blood test for high blood sugar (%)
Diabetes - People taking insulin (%)
Diet Behavior & Nutrition - Diet health (%)
Diet Behavior & Nutrition - Milk product consumption (# of products/month)
Diet Behavior & Nutrition - Meals not home prepared (#/week)
Diet Behavior & Nutrition - Meals from fast food or pizza place (#/week)
Diet Behavior & Nutrition - Ready-to-eat foods (#/month)
Diet Behavior & Nutrition - Frozen meals/pizza (#/month)
Drug Use - People that ever used marijuana or hashish (%)
Drug Use - Ever used hard drugs (%)
Drug Use - Ever used any form of cocaine (%)
Drug Use - Ever used heroin (%)
Drug Use - Ever used methamphetamine (%)
Health Insurance - People covered by health insurance (%)
Kidney Conditions-Urology - Avg. # of times urinating at night
Medical Conditions - People with asthma (%)
Medical Conditions - People with anemia (%)
Medical Conditions - People with psoriasis (%)
Medical Conditions - People with overweight (%)
Medical Conditions - Elderly people having difficulties in thinking or remembering (%)
Medical Conditions - People who ever received blood transfusion (%)
Medical Conditions - People having trouble seeing even with glass/contacts (%)
Medical Conditions - People with arthritis (%)
Medical Conditions - People with gout (%)
Medical Conditions - People with congestive heart failure (%)
Medical Conditions - People with coronary heart disease (%)
Medical Conditions - People with angina pectoris (%)
Medical Conditions - People who ever had heart attack (%)
Medical Conditions - People who ever had stroke (%)
Medical Conditions - People with emphysema (%)
Medical Conditions - People with thyroid problem (%)
Medical Conditions - People with chronic bronchitis (%)
Medical Conditions - People with any liver condition (%)
Medical Conditions - People who ever had cancer or malignancy (%)
Mental Health - People who have little interest in doing things (%)
Mental Health - People feeling down, depressed, or hopeless (%)
Mental Health - People who have trouble sleeping or sleeping too much (%)
Mental Health - People feeling tired or having little energy (%)
Mental Health - People with poor appetite or overeating (%)
Mental Health - People feeling bad about themself (%)
Mental Health - People who have trouble concentrating on things (%)
Mental Health - People moving or speaking slowly or too fast (%)
Mental Health - People having thoughts they would be better off dead (%)
Oral Health - Average years since last visit a dentist
Oral Health - People embarrassed because of mouth (%)
Oral Health - People with gum disease (%)
Oral Health - General health of teeth and gums (%)
Oral Health - Average days a week using dental floss/device
Oral Health - Average days a week using mouthwash for dental problem
Oral Health - Average number of teeth
Pesticide Use - Households using pesticides to control insects (%)
Pesticide Use - Households using pesticides to kill weeds (%)
Physical Activity - People doing vigorous-intensity work activities (%)
Physical Activity - People doing moderate-intensity work activities (%)
Physical Activity - People walking or bicycling (%)
Physical Activity - People doing vigorous-intensity recreational activities (%)
Physical Activity - People doing moderate-intensity recreational activities (%)
Physical Activity - Average hours a day doing sedentary activities
Physical Activity - Average hours a day watching TV or videos
Physical Activity - Average hours a day using computer
Physical Functioning - People having limitations keeping them from working (%)
Physical Functioning - People limited in amount of work they can do (%)
Physical Functioning - People that need special equipment to walk (%)
Physical Functioning - People experiencing confusion/memory problems (%)
Physical Functioning - People requiring special healthcare equipment (%)
Prescription Medications - Average number of prescription medicines taking
Preventive Aspirin Use - Adults 40+ taking low-dose aspirin (%)
Reproductive Health - Vaginal deliveries (%)
Reproductive Health - Cesarean deliveries (%)
Reproductive Health - Deliveries resulted in a live birth (%)
Reproductive Health - Pregnancies resulted in a delivery (%)
Reproductive Health - Women breastfeeding newborns (%)
Reproductive Health - Women that had a hysterectomy (%)
Reproductive Health - Women that had both ovaries removed (%)
Reproductive Health - Women that have ever taken birth control pills (%)
Reproductive Health - Women taking birth control pills (%)
Reproductive Health - Women that have ever used Depo-Provera or injectables (%)
Reproductive Health - Women that have ever used female hormones (%)
Sexual Behavior - People 18+ that ever had sex (vaginal, anal, or oral) (%)
Sexual Behavior - Males 18+ that ever had vaginal sex with a woman (%)
Sexual Behavior - Males 18+ that ever performed oral sex on a woman (%)
Sexual Behavior - Males 18+ that ever had anal sex with a woman (%)
Sexual Behavior - Males 18+ that ever had any sex with a man (%)
Sexual Behavior - Females 18+ that ever had vaginal sex with a man (%)
Sexual Behavior - Females 18+ that ever performed oral sex on a man (%)
Sexual Behavior - Females 18+ that ever had anal sex with a man (%)
Sexual Behavior - Females 18+ that ever had any kind of sex with a woman (%)
Sexual Behavior - Average age people first had sex
Sexual Behavior - Average number of female sex partners in lifetime (males 18+)
Sexual Behavior - Average number of female vaginal sex partners in lifetime (males 18+)
Sexual Behavior - Average age people first performed oral sex on a woman (18+)
Sexual Behavior - Average number of woman performed oral sex on in lifetime (18+)
Sexual Behavior - Average number of male sex partners in lifetime (males 18+)
Sexual Behavior - Average number of male anal sex partners in lifetime (males 18+)
Sexual Behavior - Average age people first performed oral sex on a man (18+)
Sexual Behavior - Average number of male oral sex partners in lifetime (18+)
Sexual Behavior - People using protection when performing oral sex (%)
Sexual Behavior - Average number of times people have vaginal or anal sex a year
Sexual Behavior - People having sex without condom (%)
Sexual Behavior - Average number of male sex partners in lifetime (females 18+)
Sexual Behavior - Average number of male vaginal sex partners in lifetime (females 18+)
Sexual Behavior - Average number of female sex partners in lifetime (females 18+)
Sexual Behavior - Circumcised males 18+ (%)
Sleep Disorders - Average hours sleeping at night
Sleep Disorders - People that has trouble sleeping (%)
Smoking-Cigarette Use - People smoking cigarettes (%)
Taste & Smell - People 40+ having problems with smell (%)
Taste & Smell - People 40+ having problems with taste (%)
Taste & Smell - People 40+ that ever had wisdom teeth removed (%)
Taste & Smell - People 40+ that ever had tonsils teeth removed (%)
Taste & Smell - People 40+ that ever had a loss of consciousness because of a head injury (%)
Taste & Smell - People 40+ that ever had a broken nose or other serious injury to face or skull (%)
Taste & Smell - People 40+ that ever had two or more sinus infections (%)
Weight - Average height (inches)
Weight - Average weight (pounds)
Weight - Average BMI
Weight - People that are obese (%)
Weight - People that ever were obese (%)
Weight - People trying to lose weight (%)
Officers per 1,000 residents here:
3.02Maryland average:
2.47
Latest news from Bel Air, MD collected exclusively by city-data.com from local newspapers, TV, and radio stations
Ancestries: German (12.1%), Irish (6.7%), English (6.3%), Italian (5.8%), American (4.2%), European (4.0%).
Current Local Time:
Land area: 2.81 square miles.
Population density: 3,767 people per square mile (average).
810 residents are foreign born (3.8% Asia , 2.6% Latin America , 0.8% Europe ).
This town:
7.5%Maryland:
15.7%
Median real estate property taxes paid for housing units with mortgages in 2022: $3,242 (1.0%)Median real estate property taxes paid for housing units with no mortgage in 2022: $2,485 (0.9%)
Nearest city with pop. 50,000+: Towson, MD
Nearest city with pop. 200,000+: Baltimore, MD
Nearest city with pop. 1,000,000+: Philadelphia, PA
Nearest cities:
Latitude: 39.54 N, Longitude: 76.35 W
Daytime population change due to commuting: +12,051 (+112.2%)Workers who live and work in this town: 2,040 (37.9%)
Property values in Bel Air, MD
Bel Air tourist attractions:
Single-family new house construction building permits:
2020: 2 buildings , average cost: $290,0002019: 46 buildings , average cost: $178,3002018: 27 buildings , average cost: $126,8002017: 14 buildings , average cost: $137,2002016: 3 buildings , average cost: $115,0002015: 5 buildings , average cost: $115,0002014: 2 buildings , average cost: $162,5002013: 6 buildings , average cost: $139,2002012: 5 buildings , average cost: $150,7002011: 26 buildings , average cost: $104,2002010: 14 buildings , average cost: $90,7002009: 1 building , cost: $250,0002008: 1 building , cost: $187,0002006: 3 buildings , average cost: $190,0002005: 6 buildings , average cost: $280,3002004: 3 buildings , average cost: $168,3002003: 4 buildings , average cost: $187,5002002: 2 buildings , average cost: $160,0002001: 4 buildings , average cost: $116,3002000: 4 buildings , average cost: $111,3001999: 20 buildings , average cost: $112,9001998: 4 buildings , average cost: $111,3001997: 16 buildings , average cost: $110,800Unemployment in December 2023:
Population change in the 1990s: +991 (+10.9%).
Most common occupations in Bel Air, MD (%)
Both Males Females
Secretaries and administrative assistants (5.2%)
Material recording, scheduling, dispatching, and distributing workers (3.4%)
Retail sales workers, except cashiers (3.4%)
Other management occupations, except farmers and farm managers (3.2%)
Preschool, kindergarten, elementary, and middle school teachers (3.0%)
Information and record clerks, except customer service representatives (3.0%)
Other office and administrative support workers, including supervisors (2.9%)
Electrical equipment mechanics and other installation, maintenance, and repair workers, including supervisors (5.4%)
Material recording, scheduling, dispatching, and distributing workers (4.4%)
Sales representatives, services, wholesale and manufacturing (4.0%)
Building and grounds cleaning and maintenance occupations (3.9%)
Operations specialties managers, except financial managers (3.6%)
Other production occupations, including supervisors (3.6%)
Engineers (3.2%)
Secretaries and administrative assistants (10.6%)
Information and record clerks, except customer service representatives (5.2%)
Other office and administrative support workers, including supervisors (4.8%)
Retail sales workers, except cashiers (4.7%)
Financial clerks, except bookkeeping, accounting and auditing clerks (4.6%)
Preschool, kindergarten, elementary, and middle school teachers (4.4%)
Cashiers (3.9%)
Tornado activity:
Bel Air-area historical tornado activity is slightly above Maryland state average. It is 19% greater than the overall U.S. average.
On 6/9/1961, a category F3 (max. wind speeds 158-206 mph) tornado 25.7 miles away from the Bel Air town center caused between $50,000 and $500,000 in damages.
On 7/19/1996, a category F3 tornado 32.3 miles away from the town center injured 3 people and caused $5 million in damages.
Earthquake activity:
Bel Air-area historical earthquake activity is significantly above Maryland state average. It is 61% smaller than the overall U.S. average. On 8/23/2011 at 17:51:04, a magnitude 5.8 (5.8 MW, Depth: 3.7 mi, Class: Moderate, Intensity: VI - VII) earthquake occurred 141.4 miles away from the city center On 1/16/1994 at 01:49:16, a magnitude 4.6 (4.6 MB, 4.6 LG, Depth: 3.1 mi, Class: Light, Intensity: IV - V) earthquake occurred 57.3 miles away from the city center On 9/25/1998 at 19:52:52, a magnitude 5.2 (4.8 MB, 4.3 MS, 5.2 LG, 4.5 MW, Depth: 3.1 mi) earthquake occurred 252.1 miles away from the city center On 1/16/1994 at 00:42:43, a magnitude 4.2 (4.2 MB, 4.0 LG, Depth: 3.1 mi) earthquake occurred 57.6 miles away from Bel Air center On 11/30/2017 at 21:47:31, a magnitude 4.1 (4.1 MW, Depth: 6.1 mi) earthquake occurred 54.3 miles away from Bel Air center On 8/25/2011 at 05:07:52, a magnitude 4.5 (4.5 ML, Depth: 4.2 mi) earthquake occurred 140.4 miles away from the city center Magnitude types: regional Lg-wave magnitude (LG), body-wave magnitude (MB), local magnitude (ML), surface-wave magnitude (MS), moment magnitude (MW) Natural disasters: The number of natural disasters in Harford County (17) is near the US average (15).Major Disasters (Presidential) Declared: 12Emergencies Declared: 5Hurricanes: 7, Snowstorms: 4, Winter Storms: 4, Tropical Storms: 2, Blizzard: 1, Flood: 1, Snowfall: 1, Storm: 1, Other: 1 (Note: some incidents may be assigned to more than one category). Hospitals and medical centers in Bel Air: HARFORD HHA/HOSPICE (52 EAST BROADWAY) HARFORD SURGERY PAVILION (520 UPPER CHESAPEAKE DR) UPPER CHESAPEAKE MEDICAL CENTER (Voluntary non-profit - Other, 500 UPPER CHESAPEAKE DRIVE) BEL AIR HEALTH AND REHABILITATION CENTER (410 EAST MCPHAIL ROAD)
LORIEN NSG AND REHAB CTR BELAIR (1909 EMORTON ROAD)
DAVITA - BELAIR (2225 OLD EMMORTON RD STE 100)
Heliports located in Bel Air: Amtrak station near Bel Air: 11 miles: ABERDEEN (S. PHILADELPHIA & BELAIR AVE.) Services: free short-term parking, intercity bus service.
Operable nuclear power plants near Bel Air:
14 miles: Peach Bottom 2 and 3 in Delta, PA.
Colleges/Universities in Bel Air: Harford Community College Full-time enrollment: 4,530; Location: 401 Thomas Run Rd; Public; Website: www.harford.edu)
The Colorlab Academy of Hair Full-time enrollment: 63; Location: 227 Archer St; Private, for-profit; Website: thecolorlabacademy.com)
Other colleges/universities with over 2000 students near Bel Air:
The Community College of Baltimore County (about 15 miles; Baltimore, MD ; Full-time enrollment: 15,217)
Towson University (about 18 miles; Towson, MD ; FT enrollment: 19,618)
Morgan State University (about 19 miles; Baltimore, MD ; FT enrollment: 7,113)
Loyola University Maryland (about 20 miles; Baltimore, MD ; FT enrollment: 5,215)
Stevenson University (about 21 miles; Stevenson, MD ; FT enrollment: 3,862)
Johns Hopkins University (about 21 miles; Baltimore, MD ; FT enrollment: 20,568)
University of Baltimore (about 22 miles; Baltimore, MD ; FT enrollment: 3,592)
Public high schools in Bel Air:
Private high schools in Bel Air: JOHN CARROLL SCHOOL Students: 690, Location: 703 E CHURCHVILLE RD, Grades: 9-12)THE ARROW CENTER FOR EDUCATION-FAIR MEADOWS Students: 42, Location: 2416 CRESWELL RD, Grades: UG-12)
EMMORTON BAPTIST ACADEMY Students: 17, Location: 106 PLUMTREE RD, Grades: KG-10)
Biggest public elementary/middle schools in Bel Air: FOUNTAIN GREEN ELEMENTARY Location: 517 FOUNTAIN GREEN RD, Grades: KG-5)EMMORTON ELEMENTARY Location: 2502 TOLLGATE RD, Grades: KG-5)BEL AIR ELEMENTARY Location: 30 E LEE ST, Grades: PK-5)SOUTHAMPTON MIDDLE Location: 1200 MOORES MILL RD, Grades: 6-8)HICKORY ELEMENTARY Location: 2100 CONOWINGO RD, Grades: KG-5)HOMESTEAD/WAKEFIELD ELEMENTARY Location: 900 S MAIN ST, Grades: PK-5)PROSPECT MILL ELEMENTARY Location: 101 PROSPECT MILL RD, Grades: PK-5)BEL AIR MIDDLE Location: 99 IDLEWILD STREET, Grades: 6-8)PATTERSON MILL MIDDLE SCHOOL Location: 85 PATTERSON MILL RD, Grades: 6-8)RED PUMP ELEMENTARY SCHOOL Location: 600 RED PUMP ROAD, Grades: KG-5)
Private elementary/middle schools in Bel Air: ST MARGARET SCHOOL Students: 731, Location: 205 N HICKORY AVE, Grades: PK-8)
HARFORD DAY SCHOOL Students: 291, Location: 715 MOORES MILL RD, Grades: PK-8)
THE HIGHLANDS SCHOOL Students: 69, Location: 2409 CRESWELL RD, Grades: KG-8)BEL FOREST CHRISTIAN ACADEMY Students: 62, Location: 603 VALE RD, Grades: PK-8)
See full list of schools located in Bel Air
Notable locations in Bel Air: (A) , Harford County Sheriff's Office (B) , Harford County Jail (C) , Harford County Courthouse (D) , Bel Air Branch Harford County Library (E) , Bel Air Armory (F) , Bel Air Police Department (G) , Bel Air Volunteer Fire Company Incorporated Bel Air Station (H) . Display/hide their locations on the map
Shopping Centers: (1) , Bel Air Plaza Shopping Center (2) , Bel Air Town Shopping Center (3) , Harford Mall Business Center (4) , Harford Mall Shopping Center (5) , Main Street Shopping Center (6) , McPhail Crossing Shopping Center (7) . Display/hide their locations on the map
Churches in Bel Air include: (A) , Calvary Church (B) , Emmanuel Church (C) , Way of Life Community Church (D) , Chabad of Harford County (E) , Bel Air United Methodist Church (F) , Calvary Baptist Church (G) , First Presbyterian Church (H) , New Hope Baptist Church (I) . Display/hide their locations on the map
Reservoir: (A) . Display/hide its location on the map
Parks in Bel Air include: (1) , Aquila Scott Park (2) , Bel Air Park (3) , Homestead Park (4) , Majors Choice Park (5) , Plum Tree Park (6) . Display/hide their locations on the map
Tourist attractions: (1) , Harford County - Libraries- Tdd-For (Cultural Attractions- Events- & Facilities; 1221A Brass Mill Road) (2) , Boardwalk Fun (Amusement & Theme Parks; Harford Mall) (3) , AAA Travel (Tours & Charters; 520 Baltimore Pike) (4) . Display/hide their approximate locations on the map
Hotels: (1) , SpringHill Suites Edgewood/Aberdeen (1420 Handlir Drive) (2) , Country Inn & Suites (1435 Handlir Drive) (3) . Display/hide their approximate locations on the map
Courts: (1) , Harford County - Circuit Court- Clerk's Office- Courthouse Bel Air (Courthouse) (2) , Harford County - Court Reporters- Courthouse Bel Air- Circuit Court (220 South Main Street) (3) , Maryland State Government - Courts- Harford County- District Court- Commissi (1030 Rock Spring Road) (4) . Display/hide their approximate locations on the map
Birthplace of: Jim Kehoe - Distance runner, Laura Bryna - Country singer, Chris Clunie - College basketball player (Davidson Wildcats).
Harford County has a predicted average indoor radon screening level greater than 4 pCi/L (pico curies per liter) - Highest Potential Drinking water stations with addresses in Bel Air and their reported violations in the past:
HARFORD COMMUNITY COLLEGE (Address: 401 THOMAS RUN ROAD Population served: 2,500, Groundwater):
Past health violations:
MCL, Monthly (TCR) - In SEP-2005, Contaminant: Coliform. Follow-up actions: St Compliance achieved (SEP-16-2005), St Public Notif requested (SEP-29-2005), St Violation/Reminder Notice (SEP-29-2005), St Public Notif received (OCT-07-2005)
Past monitoring violations:
4 routine major monitoring violations
One minor monitoring violation
25 regular monitoring violations
Address: 102 SOUTH HICKORY AVENUE Population served: 1,389, Groundwater):
Past monitoring violations:
Water Quality Parameter M/R - Between JAN-2009 and JUN-2009, Contaminant: Lead and Copper Rule. Follow-up actions: St Compliance achieved (AUG-03-2009)
Address: 102 SOUTH HICKORY AVENUE Population served: 1,230, Groundwater):
Past health violations:
MCL, Average - In AUG-2012, Contaminant: Nitrate. Follow-up actions: St Public Notif requested (AUG-16-2012), St Violation/Reminder Notice (AUG-16-2012), St Public Notif received (SEP-10-2012), St Compliance achieved (SEP-11-2012)
MCL, Single Sample - In AUG-2009, Contaminant: Nitrate. Follow-up actions: St Violation/Reminder Notice (AUG-26-2009), St Public Notif received (AUG-28-2009), St Public Notif requested (AUG-28-2009), St Compliance achieved (SEP-03-2009)
Past monitoring violations:
One regular monitoring violation
Address: 102 SOUTH HICKORY AVENUE Population served: 1,096, Groundwater):
Past health violations:
MCL, Acute (TCR) - In SEP-2005, Contaminant: Coliform. Follow-up actions: St Public Notif received (SEP-13-2005), St Public Notif requested (SEP-13-2005), St Compliance achieved (OCT-04-2005)
MCL, Monthly (TCR) - In AUG-2005, Contaminant: Coliform. Follow-up actions: St Public Notif requested (AUG-31-2005), St Violation/Reminder Notice (AUG-31-2005), St Public Notif received (AUG-31-2005), St Compliance achieved (OCT-04-2005)
Past monitoring violations:
Monitoring and Reporting (DBP) - Between JAN-2011 and DEC-2013, Contaminant: Total Haloacetic Acids (HAA5). Follow-up actions: St Public Notif requested (FEB-20-2014), St Compliance achieved (MAR-11-2014), St Public Notif received (MAY-07-2014)
Monitoring and Reporting (DBP) - Between JAN-2011 and DEC-2013, Contaminant: TTHM. Follow-up actions: St Public Notif requested (FEB-20-2014), St Compliance achieved (MAR-11-2014), St Public Notif received (MAY-07-2014)
One regular monitoring violation
Address: 102 SOUTH HICKORY AVENUE Population served: 1,041, Groundwater):
Past monitoring violations:
Monitoring and Reporting (DBP) - Between JAN-2011 and DEC-2013, Contaminant: Total Haloacetic Acids (HAA5). Follow-up actions: St Public Notif requested (FEB-20-2014), St Compliance achieved (MAR-11-2014), St Public Notif received (MAY-07-2014)
Monitoring and Reporting (DBP) - Between JAN-2011 and DEC-2013, Contaminant: TTHM. Follow-up actions: St Public Notif requested (FEB-20-2014), St Compliance achieved (MAR-11-2014), St Public Notif received (MAY-07-2014)
Address: 102 SOUTH HICKORY AVENUE Population served: 691, Groundwater):
Past health violations:
MCL, Monthly (TCR) - In OCT-2005, Contaminant: Coliform. Follow-up actions: St Public Notif requested (OCT-31-2005), St Violation/Reminder Notice (OCT-31-2005), St Public Notif received (NOV-02-2005), St Compliance achieved (NOV-11-2005)
Past monitoring violations:
Monitoring and Reporting (DBP) - Between JAN-2011 and DEC-2013, Contaminant: Total Haloacetic Acids (HAA5). Follow-up actions: St Public Notif requested (FEB-20-2014), St Compliance achieved (MAR-11-2014), St Public Notif received (MAY-07-2014)
Monitoring and Reporting (DBP) - Between JAN-2011 and DEC-2013, Contaminant: TTHM. Follow-up actions: St Public Notif requested (FEB-20-2014), St Compliance achieved (MAR-11-2014), St Public Notif received (MAY-07-2014)
Address: 102 SOUTH HICKORY AVENUE Population served: 637, Groundwater):
Past health violations:
MCL, Single Sample - In JUL-2013, Contaminant: Nitrate. Follow-up actions: St Public Notif requested (JUL-23-2013), St Violation/Reminder Notice (JUL-23-2013), St Public Notif received (JUL-23-2013), St Compliance achieved (AUG-28-2013)
MCL, Single Sample - In AUG-2011, Contaminant: Nitrate. Follow-up actions: St Public Notif requested (AUG-08-2011), St Violation/Reminder Notice (AUG-08-2011), St Public Notif received (AUG-08-2011), St Compliance achieved (SEP-08-2011)
Address: 101 NORTH MAIN ST. SUITE B Population served: 310, Groundwater):
Past health violations:
MCL, Monthly (TCR) - In JAN-2014, Contaminant: Coliform. Follow-up actions: St Violation/Reminder Notice (FEB-04-2012), St Public Notif received (FEB-08-2014), St Compliance achieved (2 times from FEB-14-2014 to MAR-31-2014)
Drinking water stations with addresses in Bel Air that have no violations reported:
MARYLAND AMERICAN WATER COMPANY (Address: 260 GATEWAY DR SUITE 17-18 B Population served: 13,200, Primary Water Source Type: Surface water)
NORTH HARFORD HIGH SCHOOL (Address: 102 SOUTH HICKORY AVENUE Population served: 1,571, Primary Water Source Type: Groundwater)
JARRETTSVILLE ELEMENTARY (Address: 102 SOUTH HICKORY AVENUE Population served: 558, Primary Water Source Type: Groundwater)
NORTH HARFORD ELEMENTARY (Address: 102 SOUTH HICKORY AVENUE Population served: 493, Primary Water Source Type: Groundwater)
NORTH BEND ELEMENTARY SCHOOL (Address: 102 SOUTH HICKORY AVENUE Population served: 446, Primary Water Source Type: Groundwater)
CHURCHVILLE ELEMENTARY SCHOOL (Address: 102 SOUTH HICKORY AVENUE Population served: 430, Primary Water Source Type: Groundwater)
JOHN ARCHER SCHOOL (Address: 102 SOUTH HICKORY AVENUE Population served: 292, Primary Water Source Type: Groundwater)
DUBLIN ELEMENTARY SCHOOL (Address: 102 SOUTH HICKORY AVENUE Population served: 290, Primary Water Source Type: Groundwater)
TRINITY REFORMED BAPTIST CHURCH (Population served: 242, Primary Water Source Type: Groundwater)
NORRISVILLE ELEMENTARY SCHOOL (Address: 102 SOUTH HICKORY AVENUE Population served: 213, Primary Water Source Type: Groundwater)
Average household size: This town:
2.2 peopleMaryland:
2.6 people
Percentage of family households: This town:
57.2%Whole state:
67.1%
Percentage of households with unmarried partners: This town:
6.3%Whole state:
6.4%
Likely homosexual households (counted as self-reported same-sex unmarried-partner households)
Lesbian couples: 0.2% of all households Gay men: 0.0% of all households
People in group quarters in Bel Air in 2010:
142 people in nursing facilities/skilled-nursing facilities
30 people in workers' group living quarters and job corps centers
21 people in group homes intended for adults
13 people in residential treatment centers for adults
11 people in other noninstitutional facilities
5 people in emergency and transitional shelters (with sleeping facilities) for people experiencing homelessness
People in group quarters in Bel Air in 2000:
358 people in local jails and other confinement facilities (including police lockups)
147 people in nursing homes
47 people in other noninstitutional group quarters
15 people in homes or halfway houses for drug/alcohol abuse
Banks with most branches in Bel Air (2011 data):
Manufacturers and Traders Trust Company: Bel Air Main Branch, Plumtree, Fountain Green Branch, Bel Air Plaza Branch, Bel Air Drive-In Branch. Info updated 2011/08/08: Bank assets: $76,887.1 mil, Deposits: $60,064.2 mil, headquarters in Buffalo, NY, positive income , Commercial Lending Specialization, 808 total offices , Holding Company: M&T Bank Corporation
Bank of America, National Association: Bel Air Main Branch, Forest Hill Branch, Tollgate Road Branch. Info updated 2009/11/18: Bank assets: $1,451,969.3 mil, Deposits: $1,077,176.8 mil, headquarters in Charlotte, NC, positive income , 5782 total offices , Holding Company: Bank Of America Corporation
Branch Banking and Trust Company: Bel Air Main Branch, Festival Branch, Bel Air Downtown Branch. Info updated 2010/03/29: Bank assets: $168,867.6 mil, Deposits: $127,549.5 mil, headquarters in Winston Salem, NC, positive income , Commercial Lending Specialization, 1793 total offices , Holding Company: Bb&T Corporation
Harford Bank: Hickory Branch, Bel Air Branch, Marketplace Drive Branch. Info updated 2010/05/27: Bank assets: $282.8 mil, Deposits: $226.2 mil, headquarters in Aberdeen, MD, positive income , Commercial Lending Specialization, 8 total offices
PNC Bank, National Association: Bel Air South Branch at 130 South Bond Street, branch established on 1914/03/13; Bel Air North Branch at 140 North Main Street, branch established on 1978/02/14. Info updated 2012/03/20: Bank assets: $263,309.6 mil, Deposits: $197,343.0 mil, headquarters in Wilmington, DE, positive income , Commercial Lending Specialization, 3085 total offices , Holding Company: Pnc Financial Services Group, Inc., The
Baltimore County Savings Bank: 517 Belair Plaza Branch at 517 Bel Air Rd, branch established on 1986/06/30; North Fountain Green Road at 2128 N. Fountain Green Rd, branch established on 2000/04/17. Info updated 2011/10/06: Bank assets: $639.0 mil, Deposits: $563.0 mil, headquarters in Nottingham, MD, positive income , Commercial Lending Specialization, 17 total offices , Holding Company: Bcsb Bancorp, Inc.
First Mariner Bank: Hickory Branch at 1403 Conwingo Drive, branch established on 2007/07/16; Bel Air Branch at 12 A Bel Air South Parkway, branch established on 1995/06/22. Info updated 2006/10/11: Bank assets: $1,179.4 mil, Deposits: $1,014.8 mil, headquarters in Baltimore, MD, negative income in the last year , Commercial Lending Specialization, 22 total offices , Holding Company: First Mariner Bancorp
Madison Square Federal Savings Bank: Bel Air Branch at 126 North Main Street, branch established on 2008/06/30. Info updated 2011/07/21: Bank assets: $152.2 mil, Deposits: $139.1 mil, headquarters in Baltimore, MD, positive income , Mortgage Lending Specialization, 4 total offices
Rosedale Federal Savings and Loan Association: 1009 Churchville Road Branch at 1009 Churchville Road, branch established on 1908/01/01. Info updated 2012/02/06: Bank assets: $785.1 mil, Deposits: $623.1 mil, headquarters in Baltimore, MD, positive income , 9 total offices
11 other banks with 11 local branches
For population 15 years and over in Bel Air:
Never married: 35.3%Now married: 40.5%Separated: 1.4%Widowed: 5.9%Divorced: 16.9% For population 25 years and over in Bel Air:
High school or higher: 92.5%Bachelor's degree or higher: 37.2%Graduate or professional degree: 13.6%Unemployed: 2.6%Mean travel time to work (commute): 23.7 minutes
Education Gini index (Inequality in education) Here:
11.2Maryland average:
12.7
Religion statistics for Bel Air, MD (based on Harford County data)
Religion Adherents Congregations Catholic 44,618 9 Evangelical Protestant 23,645 97 Mainline Protestant 22,305 65 Other 2,675 10 Black Protestant 1,628 9 Orthodox 900 2 None 149,055 -
Source: Clifford Grammich, Kirk Hadaway, Richard Houseal, Dale E.Jones, Alexei Krindatch, Richie Stanley and Richard H.Taylor. 2012. 2010 U.S.Religion Census: Religious Congregations & Membership Study. Association of Statisticians of American Religious Bodies. Jones, Dale E., et al. 2002. Congregations and Membership in the United States 2000. Nashville, TN: Glenmary Research Center. Graphs represent county-level data
Food Environment Statistics: Number of grocery stores : 35Here :
1.46 / 10,000 pop.Maryland :
1.96 / 10,000 pop.
Number of supercenters and club stores : 1Here :
0.04 / 10,000 pop.State :
0.07 / 10,000 pop.
Number of convenience stores (no gas) : 31This county :
1.29 / 10,000 pop.Maryland :
1.22 / 10,000 pop.
Number of convenience stores (with gas) : 57Harford County :
2.38 / 10,000 pop.Maryland :
2.05 / 10,000 pop.
Number of full-service restaurants : 106Here :
4.43 / 10,000 pop.State :
5.40 / 10,000 pop.
Adult diabetes rate : Harford County :
8.9%State :
9.1%
Adult obesity rate : Harford County :
27.3%State :
26.7%
Low-income preschool obesity rate : This county :
14.5%Maryland :
15.5%
Health and Nutrition: Healthy diet rate : Bel Air:
48.3%Maryland:
50.1%
Average overall health of teeth and gums : This city:
43.6%Maryland:
47.6%
People feeling badly about themselves : People not drinking alcohol at all : Bel Air:
11.5%Maryland:
11.3%
Average hours sleeping at night : Overweight people : Bel Air:
32.7%Maryland:
34.1%
General health condition : This city:
53.8%State:
56.5%
Average condition of hearing : Bel Air:
76.8%Maryland:
80.5%
More about Health and Nutrition of Bel Air, MD Residents
Local government employment and payroll (March 2022)
Function
Full-time employees
Monthly full-time payroll
Average yearly full-time wage
Part-time employees
Monthly part-time payroll
Police Protection - Officers
33 $112,461 $40,895 0 $0 Streets and Highways
19 $60,401 $38,148 1 $3,308 Other Government Administration
14 $29,615 $25,384 1 $5,403 Police - Other
11 $25,781 $28,125 3 $6,550 Financial Administration
4 $14,594 $43,782 2 $8,873 Other and Unallocable
3 $22,462 $89,848 1 $3,510 Solid Waste Management
3 $6,224 $24,896 0 $0 Sewerage
2 $4,785 $28,710 0 $0
Totals for Government
89 $276,323 $37,257 8 $27,643
Bel Air government finances - Expenditure in 2021 (per resident):
Construction - Regular Highways: $520,000 ($49.08)
Current Operations - Police Protection: $5,218,000 ($492.45)
Sewerage: $2,677,000 ($252.64)General - Other: $2,406,000 ($227.07)Regular Highways: $1,091,000 ($102.96)Financial Administration: $1,014,000 ($95.70)Central Staff Services: $1,013,000 ($95.60)Solid Waste Management: $739,000 ($69.74)General Public Buildings: $731,000 ($68.99)Parks and Recreation: $197,000 ($18.59)Parking Facilities: $164,000 ($15.48)Local Fire Protection: $160,000 ($15.10)Electric Utilities: $99,000 ($9.34)Protective Inspection and Regulation - Other: $60,000 ($5.66)Judicial and Legal Services: $38,000 ($3.59)General - Interest on Debt: $119,000 ($11.23)
Other Capital Outlay - Central Staff Services: $75,000 ($7.08)
Financial Administration: $63,000 ($5.95)Police Protection: $61,000 ($5.76)Regular Highways: $21,000 ($1.98)General - Other: $11,000 ($1.04)General Public Building: $3,000 ($0.28)Total Salaries and Wages: $9,260,000 ($873.91)
Bel Air government finances - Revenue in 2021 (per resident):
Charges - Sewerage: $2,744,000 ($258.97)
Parking Facilities: $307,000 ($28.97)Regular Highways: $79,000 ($7.46)Parks and Recreation: $67,000 ($6.32)Other: $65,000 ($6.13)Federal Intergovernmental - Other: $49,000 ($4.62)
Local Intergovernmental - Highways: $156,000 ($14.72)
General Local Government Support: $8,000 ($0.76)Other: $4,000 ($0.38)Miscellaneous - Fines and Forfeits: $607,000 ($57.29)
General Revenue - Other: $217,000 ($20.48)Sale of Property: $56,000 ($5.29)Interest Earnings: $43,000 ($4.06)Rents: $39,000 ($3.68)Donations From Private Sources: $36,000 ($3.40)State Intergovernmental - Highways: $475,000 ($44.83)
Other: $284,000 ($26.80)Tax - Property: $8,531,000 ($805.12)
Individual Income: $2,582,000 ($243.68)Public Utility License: $143,000 ($13.50)Occupation and Business License - Other: $54,000 ($5.10)Amusements Sales: $43,000 ($4.06)Other License: $35,000 ($3.30)
Bel Air government finances - Debt in 2021 (per resident):
Long Term Debt - Beginning Outstanding - Unspecified Public Purpose: $2,979,000 ($281.14)
Outstanding Unspecified Public Purpose: $2,918,000 ($275.39)Retired Unspecified Public Purpose: $531,000 ($50.11)Issue, Unspecified Public Purpose: $471,000 ($44.45)
Bel Air government finances - Cash and Securities in 2021 (per resident):
Other Funds - Cash and Securities: $11,634,000 ($1097.96)
6.78% of this county's 2021 resident taxpayers lived in other counties in 2020 ($70,993 average adjusted gross income )
Here:
6.78%Maryland average:
7.42%
0.05% of residents moved from foreign countries ($677 average AGI )Harford County:
0.05%Maryland average:
0.05%
Top counties from which taxpayers relocated into this county between 2020 and 2021:
6.41% of this county's 2020 resident taxpayers moved to other counties in 2021 ($73,548 average adjusted gross income )
Here:
6.41%Maryland average:
7.91%
0.03% of residents moved to foreign countries ($452 average AGI )Harford County:
0.03%Maryland average:
0.04%
Top counties to which taxpayers relocated from this county between 2020 and 2021:
Businesses in Bel Air, MD
Name Count Name Count
7-Eleven 5 Marriott 1 AT&T 2 Marshalls 1 Advance Auto Parts 2 MasterBrand Cabinets 2 Aeropostale 1 Mazda 1 American Eagle Outfitters 1 McDonald's 4 Applebee's 1 Men's Wearhouse 2 Arby's 1 Motherhood Maternity 1 BMW 1 New Balance 1 Baja Fresh Mexican Grill 1 New York & Co 1 Barnes & Noble 1 Nike 6 Baskin-Robbins 1 Nissan 1 Bath & Body Works 1 Office Depot 1 Bed Bath & Beyond 1 Old Navy 1 Blockbuster 1 Outback 1 Buffalo Wild Wings 1 Outback Steakhouse 1 Burger King 2 Pac Sun 1 Charlotte Russe 1 Panera Bread 1 Chipotle 1 Papa John's Pizza 1 Chuck E. Cheese's 1 Payless 2 Cold Stone Creamery 1 Penske 1 Cracker Barrel 1 PetSmart 1 Cricket Wireless 1 Pier 1 Imports 1 Curves 1 Pizza Hut 2 DHL 1 Qdoba Mexican Grill 1 Dairy Queen 1 Quiznos 1 Deb 1 RadioShack 1 Domino's Pizza 2 Red Robin 1 DressBarn 2 Rite Aid 3 Dressbarn 2 Ruby Tuesday 2 Dunkin Donuts 2 Safeway 1 Extended Stay America 1 Sears 1 FedEx 8 Spencer Gifts 1 Finish Line 1 Sprint Nextel 2 Firestone Complete Auto Care 1 Staples 1 Ford 1 Starbucks 4 GNC 4 Subaru 1 GameStop 2 Subway 4 Giant 1 T-Mobile 2 H&R Block 2 T.G.I. Driday's 1 Holiday Inn 1 T.J.Maxx 1 Hollister Co. 1 Taco Bell 1 Home Depot 1 Talbots 1 Hot Topic 1 Target 1 Hyundai 1 The Room Place 1 JoS. A. Bank 1 Toys"R"Us 1 Jones New York 1 True Value 1 Journeys 1 U-Haul 1 Justice 1 UPS 13 KFC 1 Vans 1 Kohl's 1 Verizon Wireless 1 Kroger 1 Victoria's Secret 1 La-Z-Boy 1 Vons 1 Lane Bryant 1 Waffle House 1 Little Caesars Pizza 1 Walgreens 2 Macy's 1 Wendy's 2
Strongest AM radio stations in Bel Air:
WWLG (1370 AM; 50 kW; BALTIMORE, MD; Owner: M-10 BROADCASTING, INC.)
WCBM (680 AM; 50 kW; BALTIMORE, MD; Owner: WCBM MARYLAND, INC.)
WBAL (1090 AM; 50 kW; BALTIMORE, MD; Owner: HEARST RADIO, INC.)
WGOP (700 AM; daytime; 25 kW; WALKERSVILLE, MD; Owner: BIRACH BROADCASTING CORPORATION)
WJSS (1330 AM; 5 kW; HAVRE DE GRACE, MD; Owner: PEOPLES BROADCAST NETWORK, LLC)
WBIS (1190 AM; 50 kW; ANNAPOLIS, MD; Owner: NATIONS RADIO, LLC)
WVCH (740 AM; 50 kW; CHESTER, PA; Owner: WVCH COMMUNICATIONS, INC.)
WTEM (980 AM; 50 kW; WASHINGTON, DC; Owner: AMFM RADIO LICENSES, L.L.C.)
WNST (1570 AM; 5 kW; TOWSON, MD)
WMET (1150 AM; 50 kW; GAITHERSBURG, MD; Owner: BELTWAY ACQUISITION CORPORATION)
WCAO (600 AM; 5 kW; BALTIMORE, MD; Owner: CITICASTERS LICENSES, L.P.)
WTOP (1500 AM; 50 kW; WASHINGTON, DC; Owner: BONNEVILLE HOLDING COMPANY)
WPEN (950 AM; 50 kW; PHILADELPHIA, PA; Owner: GREATER PHILADELPHIA RADIO, INC.)
Strongest FM radio stations in Bel Air:
WHFC (91.1 FM; BEL AIR, MD; Owner: HARFORD COMMUNITY COLLEGE)
WLIF (101.9 FM; BALTIMORE, MD; Owner: INFINITY WLIF, INC.)
WSMJ (104.3 FM; BALTIMORE, MD; Owner: CITICASTERS LICENSES, L.P.)
WWMX (106.5 FM; BALTIMORE, MD; Owner: INFINITY RADIO OPERATIONS INC.)
WXCY (103.7 FM; HAVRE DE GRACE, MD; Owner: DELMARVA BROADCASTING COMPANY)
WIYY (97.9 FM; BALTIMORE, MD; Owner: HEARST RADIO, INC.)
WZBA (100.7 FM; WESTMINSTER, MD; Owner: SHAMROCK COMMUNICATIONS, INC.)
WSOX (96.1 FM; RED LION, PA; Owner: LANCASTER-YORK BROADCASTING, LLC)
WARM-FM (103.3 FM; YORK, PA; Owner: WSBA LICO, INC.)
WDAC (94.5 FM; LANCASTER, PA; Owner: WDAC RADIO COMPANY)
WROZ (101.3 FM; LANCASTER, PA; Owner: HALL COMMUNICATIONS, INC.)
WPOC (93.1 FM; BALTIMORE, MD; Owner: CITICASTERS LICENSES, L.P.)
WXYV (105.7 FM; CATONSVILLE, MD; Owner: INFINITY RADIO OPERATIONS INC.)
WERQ-FM (92.3 FM; BALTIMORE, MD; Owner: RADIO ONE LICENSES, LLC)
WBJC (91.5 FM; BALTIMORE, MD; Owner: BALTIMORE CITY COMMUNITY COLLEGE)
WYCR (98.5 FM; YORK-HANOVER, PA; Owner: RADIO HANOVER, INC.)
WYPR (88.1 FM; BALTIMORE, MD; Owner: WYPR LICENSE HOLDING LLC)
WQSR (102.7 FM; BALTIMORE, MD; Owner: INFINITY OF CHESAPEAKE LICENSEE CORP.)
WGTY (107.7 FM; GETTYSBURG, PA; Owner: TIMES AND NEWS PUBLISHING COMPANY)
WRBS (95.1 FM; BALTIMORE, MD; Owner: PETER & JOHN RADIO FELLOWSHIP, INC.)
TV broadcast stations around Bel Air:
WBAL-TV (Channel 11; BALTIMORE, MD; Owner: WBAL HEARST-ARGYLE TV, INC. (CA CORP.))
WMAR-TV (Channel 2; BALTIMORE, MD; Owner: SCRIPPS HOWARD BROADCASTING COMPANY)
WBFF (Channel 45; BALTIMORE, MD; Owner: CHESAPEAKE TELEVISION LICENSEE, LLC)
WNUV (Channel 54; BALTIMORE, MD; Owner: BALTIMORE (WNUV-TV) LICENSEE, INC.)
WJZ-TV (Channel 13; BALTIMORE, MD; Owner: VIACOM INC.)
WMPB (Channel 67; BALTIMORE, MD; Owner: MARYLAND PUBLIC BROADCASTING COMMISSION)
WUTB (Channel 24; BALTIMORE, MD; Owner: FOX TELEVISION STATIONS, INC.)
WTSD-CA (Channel 14; WILMINGTON, DE; Owner: PRIORITY COMMUNICATIONS MINISTRIES, INC.)
WPMT (Channel 43; YORK, PA; Owner: TRIBUNE TELEVISION COMPANY)
WMPT (Channel 22; ANNAPOLIS, MD; Owner: MARYLAND PUBLIC BROADCASTING COMMISSION)
WGAL (Channel 8; LANCASTER, PA; Owner: WGAL HEARST-ARGYLE TELEVISION, INC.)
WMJF-LP (Channel 16; TOWSON, MD; Owner: TOWSON UNIVERSITY)
National Bridge Inventory (NBI) Statistics 9 Number of bridges105ft / 31.9m Total length $1,986,000 Total costs198,473 Total average daily traffic11,101 Total average daily truck traffic248,404 Total future (year 2026) average daily traffic
Home Mortgage Disclosure Act Aggregated Statistics For Year 2009(Based on 3 partial tracts) A) FHA, FSA/RHS & VA B) Conventional C) Refinancings D) Home Improvement Loans F) Non-occupant Loans on G) Loans On Manufactured Number Average Value Number Average Value Number Average Value Number Average Value Number Average Value Number Average Value
LOANS ORIGINATED 57 $231,352 52 $200,105 271 $210,012 15 $97,935 19 $183,663 0 $0 APPLICATIONS APPROVED, NOT ACCEPTED 5 $229,228 2 $129,825 26 $180,242 0 $0 1 $176,420 0 $0 APPLICATIONS DENIED 6 $226,478 6 $200,502 62 $219,010 2 $144,420 3 $185,180 0 $0 APPLICATIONS WITHDRAWN 9 $253,917 9 $213,821 56 $221,148 1 $14,740 4 $224,130 0 $0 FILES CLOSED FOR INCOMPLETENESS 0 $0 1 $14,970 8 $241,578 1 $30,350 1 $124,370 1 $14,970
Aggregated Statistics For Year 2008(Based on 3 partial tracts) A) FHA, FSA/RHS & VA B) Conventional C) Refinancings D) Home Improvement Loans E) Loans on Dwellings For 5+ Families F) Non-occupant Loans on G) Loans On Manufactured Number Average Value Number Average Value Number Average Value Number Average Value Number Average Value Number Average Value Number Average Value
LOANS ORIGINATED 32 $241,844 71 $211,596 146 $196,528 20 $77,042 1 $751,110 17 $196,835 0 $0 APPLICATIONS APPROVED, NOT ACCEPTED 2 $196,370 6 $197,077 15 $237,913 3 $72,587 0 $0 2 $87,405 0 $0 APPLICATIONS DENIED 3 $290,200 6 $210,877 49 $214,100 9 $18,213 0 $0 7 $108,941 1 $73,770 APPLICATIONS WITHDRAWN 6 $256,463 5 $254,294 26 $245,965 2 $117,625 0 $0 3 $145,687 0 $0 FILES CLOSED FOR INCOMPLETENESS 1 $213,310 1 $206,270 2 $348,005 2 $161,535 0 $0 1 $143,730 0 $0
Aggregated Statistics For Year 2007(Based on 3 partial tracts) A) FHA, FSA/RHS & VA B) Conventional C) Refinancings D) Home Improvement Loans E) Loans on Dwellings For 5+ Families F) Non-occupant Loans on G) Loans On Manufactured Number Average Value Number Average Value Number Average Value Number Average Value Number Average Value Number Average Value Number Average Value
LOANS ORIGINATED 10 $239,024 151 $199,801 172 $187,394 39 $69,724 1 $537,530 23 $146,912 0 $0 APPLICATIONS APPROVED, NOT ACCEPTED 0 $0 16 $216,453 24 $175,245 6 $59,605 0 $0 2 $222,305 1 $115,190 APPLICATIONS DENIED 1 $119,220 24 $233,979 61 $181,429 16 $63,160 0 $0 10 $236,149 2 $31,810 APPLICATIONS WITHDRAWN 1 $79,660 11 $220,864 27 $197,922 2 $65,800 0 $0 1 $197,940 0 $0 FILES CLOSED FOR INCOMPLETENESS 0 $0 3 $219,877 8 $182,369 1 $57,530 0 $0 1 $122,960 0 $0
Aggregated Statistics For Year 2006(Based on 3 partial tracts) A) FHA, FSA/RHS & VA B) Conventional C) Refinancings D) Home Improvement Loans E) Loans on Dwellings For 5+ Families F) Non-occupant Loans on G) Loans On Manufactured Number Average Value Number Average Value Number Average Value Number Average Value Number Average Value Number Average Value Number Average Value
LOANS ORIGINATED 10 $220,334 200 $175,703 223 $177,391 47 $81,800 1 $898,110 40 $154,036 1 $166,800 APPLICATIONS APPROVED, NOT ACCEPTED 0 $0 21 $176,407 30 $169,137 5 $39,944 0 $0 4 $178,560 0 $0 APPLICATIONS DENIED 0 $0 28 $181,721 54 $188,384 16 $54,528 0 $0 11 $161,570 0 $0 APPLICATIONS WITHDRAWN 1 $119,220 20 $214,831 76 $181,964 4 $105,732 0 $0 4 $274,572 0 $0 FILES CLOSED FOR INCOMPLETENESS 1 $82,860 6 $188,770 14 $181,380 1 $124,490 0 $0 2 $161,040 0 $0
Aggregated Statistics For Year 2005(Based on 3 partial tracts) A) FHA, FSA/RHS & VA B) Conventional C) Refinancings D) Home Improvement Loans E) Loans on Dwellings For 5+ Families F) Non-occupant Loans on G) Loans On Manufactured Number Average Value Number Average Value Number Average Value Number Average Value Number Average Value Number Average Value Number Average Value
LOANS ORIGINATED 8 $187,681 288 $157,438 265 $167,219 37 $73,820 1 $168,940 68 $137,525 0 $0 APPLICATIONS APPROVED, NOT ACCEPTED 0 $0 19 $126,844 24 $157,035 3 $34,313 0 $0 3 $104,730 2 $35,480 APPLICATIONS DENIED 1 $98,360 35 $165,161 66 $156,738 9 $80,043 0 $0 2 $148,660 2 $67,340 APPLICATIONS WITHDRAWN 1 $122,180 39 $161,896 82 $177,635 12 $123,441 0 $0 5 $159,384 0 $0 FILES CLOSED FOR INCOMPLETENESS 0 $0 8 $178,308 15 $185,143 4 $162,235 0 $0 1 $9,090 0 $0
Aggregated Statistics For Year 2004(Based on 3 partial tracts) A) FHA, FSA/RHS & VA B) Conventional C) Refinancings D) Home Improvement Loans E) Loans on Dwellings For 5+ Families F) Non-occupant Loans on G) Loans On Manufactured Number Average Value Number Average Value Number Average Value Number Average Value Number Average Value Number Average Value Number Average Value
LOANS ORIGINATED 23 $156,955 235 $150,742 242 $149,124 27 $66,233 1 $121,890 39 $109,028 1 $4,190 APPLICATIONS APPROVED, NOT ACCEPTED 1 $75,910 11 $180,795 23 $153,977 7 $38,856 0 $0 2 $122,625 0 $0 APPLICATIONS DENIED 3 $128,663 21 $134,997 69 $150,970 11 $66,668 0 $0 6 $128,407 1 $68,340 APPLICATIONS WITHDRAWN 4 $171,660 31 $143,885 81 $147,935 3 $49,820 0 $0 4 $123,060 0 $0 FILES CLOSED FOR INCOMPLETENESS 1 $101,260 2 $185,200 12 $171,249 1 $32,730 0 $0 1 $36,350 0 $0
Aggregated Statistics For Year 2003(Based on 3 partial tracts) A) FHA, FSA/RHS & VA B) Conventional C) Refinancings D) Home Improvement Loans F) Non-occupant Loans on Number Average Value Number Average Value Number Average Value Number Average Value Number Average Value
LOANS ORIGINATED 24 $136,647 114 $137,254 585 $133,618 11 $26,836 28 $114,845 APPLICATIONS APPROVED, NOT ACCEPTED 2 $112,040 6 $130,823 57 $126,526 4 $17,805 1 $77,520 APPLICATIONS DENIED 2 $149,070 13 $108,545 78 $112,398 8 $21,451 5 $85,976 APPLICATIONS WITHDRAWN 4 $157,032 11 $183,325 98 $133,709 2 $87,965 5 $116,860 FILES CLOSED FOR INCOMPLETENESS 1 $129,370 0 $0 17 $143,049 0 $0 0 $0
Aggregated Statistics For Year 2002(Based on 3 partial tracts) A) FHA, FSA/RHS & VA B) Conventional C) Refinancings D) Home Improvement Loans E) Loans on Dwellings For 5+ Families F) Non-occupant Loans on Number Average Value Number Average Value Number Average Value Number Average Value Number Average Value Number Average Value
LOANS ORIGINATED 41 $132,065 111 $123,582 335 $125,024 14 $24,901 0 $0 20 $90,426 APPLICATIONS APPROVED, NOT ACCEPTED 1 $140,040 10 $177,719 40 $116,458 3 $46,147 1 $345,350 1 $95,060 APPLICATIONS DENIED 3 $154,440 7 $117,250 55 $102,368 7 $28,749 0 $0 2 $40,895 APPLICATIONS WITHDRAWN 1 $102,340 9 $123,396 57 $121,856 3 $22,163 0 $0 1 $122,710 FILES CLOSED FOR INCOMPLETENESS 1 $168,450 5 $171,452 19 $120,394 0 $0 0 $0 2 $87,945
Aggregated Statistics For Year 2001(Based on 3 partial tracts) A) FHA, FSA/RHS & VA B) Conventional C) Refinancings D) Home Improvement Loans E) Loans on Dwellings For 5+ Families F) Non-occupant Loans on Number Average Value Number Average Value Number Average Value Number Average Value Number Average Value Number Average Value
LOANS ORIGINATED 45 $110,610 118 $118,455 245 $121,216 20 $19,346 2 $1,233,070 27 $88,471 APPLICATIONS APPROVED, NOT ACCEPTED 2 $136,820 12 $129,498 21 $100,649 6 $28,498 0 $0 2 $105,050 APPLICATIONS DENIED 2 $158,640 13 $93,642 48 $96,397 10 $19,565 0 $0 3 $92,350 APPLICATIONS WITHDRAWN 0 $0 10 $118,489 47 $113,699 5 $23,378 0 $0 1 $79,120 FILES CLOSED FOR INCOMPLETENESS 0 $0 1 $107,390 9 $106,447 1 $10,690 0 $0 0 $0
Aggregated Statistics For Year 2000(Based on 3 partial tracts) A) FHA, FSA/RHS & VA B) Conventional C) Refinancings D) Home Improvement Loans F) Non-occupant Loans on Number Average Value Number Average Value Number Average Value Number Average Value Number Average Value
LOANS ORIGINATED 47 $111,088 125 $119,991 39 $80,481 18 $22,926 3 $93,243 APPLICATIONS APPROVED, NOT ACCEPTED 1 $143,390 10 $103,319 10 $77,423 6 $21,745 1 $101,570 APPLICATIONS DENIED 2 $64,420 15 $131,217 33 $63,769 9 $22,378 2 $91,685 APPLICATIONS WITHDRAWN 2 $108,330 17 $135,221 18 $75,729 3 $26,663 1 $96,230 FILES CLOSED FOR INCOMPLETENESS 1 $91,420 1 $240,130 4 $72,780 0 $0 0 $0
Aggregated Statistics For Year 1999(Based on 3 partial tracts) A) FHA, FSA/RHS & VA B) Conventional C) Refinancings D) Home Improvement Loans E) Loans on Dwellings For 5+ Families F) Non-occupant Loans on Number Average Value Number Average Value Number Average Value Number Average Value Number Average Value Number Average Value
LOANS ORIGINATED 53 $116,593 98 $112,693 150 $95,555 20 $33,860 1 $937,470 10 $70,805 APPLICATIONS APPROVED, NOT ACCEPTED 1 $41,310 9 $113,648 22 $92,445 7 $10,644 0 $0 3 $60,833 APPLICATIONS DENIED 2 $108,055 13 $121,198 41 $104,473 6 $17,293 0 $0 3 $99,550 APPLICATIONS WITHDRAWN 4 $94,642 12 $128,421 37 $89,892 5 $63,572 0 $0 1 $108,210 FILES CLOSED FOR INCOMPLETENESS 0 $0 1 $116,200 4 $91,885 1 $31,320 0 $0 1 $61,070
Detailed HMDA statistics for the following Tracts:
3035.00
, 3038.00 , 3039.00
Private Mortgage Insurance Companies Aggregated Statistics For Year 2009(Based on 3 partial tracts) A) Conventional B) Refinancings Number Average Value Number Average Value
LOANS ORIGINATED 10 $266,247 6 $313,837 APPLICATIONS APPROVED, NOT ACCEPTED 1 $435,350 1 $228,760 APPLICATIONS DENIED 1 $217,720 1 $337,510 APPLICATIONS WITHDRAWN 0 $0 1 $227,580 FILES CLOSED FOR INCOMPLETENESS 1 $63,080 0 $0
Aggregated Statistics For Year 2008(Based on 3 partial tracts) A) Conventional B) Refinancings C) Non-occupant Loans on Number Average Value Number Average Value Number Average Value
LOANS ORIGINATED 27 $228,854 11 $284,605 1 $153,960 APPLICATIONS APPROVED, NOT ACCEPTED 8 $229,238 4 $285,330 2 $226,670 APPLICATIONS DENIED 2 $209,530 0 $0 1 $177,490 APPLICATIONS WITHDRAWN 2 $159,015 1 $198,000 0 $0 FILES CLOSED FOR INCOMPLETENESS 0 $0 0 $0 0 $0
Aggregated Statistics For Year 2007(Based on 3 partial tracts) A) Conventional B) Refinancings C) Non-occupant Loans on Number Average Value Number Average Value Number Average Value
LOANS ORIGINATED 32 $211,104 10 $258,381 1 $87,580 APPLICATIONS APPROVED, NOT ACCEPTED 1 $347,430 1 $178,460 0 $0 APPLICATIONS DENIED 0 $0 0 $0 0 $0 APPLICATIONS WITHDRAWN 2 $258,400 2 $279,825 1 $195,130 FILES CLOSED FOR INCOMPLETENESS 0 $0 0 $0 0 $0
Aggregated Statistics For Year 2006(Based on 3 partial tracts) A) Conventional B) Refinancings C) Non-occupant Loans on Number Average Value Number Average Value Number Average Value
LOANS ORIGINATED 19 $241,088 9 $261,298 1 $338,900 APPLICATIONS APPROVED, NOT ACCEPTED 2 $218,385 2 $247,450 0 $0 APPLICATIONS DENIED 0 $0 0 $0 0 $0 APPLICATIONS WITHDRAWN 2 $122,960 0 $0 1 $57,740 FILES CLOSED FOR INCOMPLETENESS 0 $0 0 $0 0 $0
Aggregated Statistics For Year 2005(Based on 3 partial tracts) A) Conventional B) Refinancings C) Non-occupant Loans on Number Average Value Number Average Value Number Average Value
LOANS ORIGINATED 21 $194,918 11 $208,994 3 $172,140 APPLICATIONS APPROVED, NOT ACCEPTED 3 $193,510 2 $168,845 0 $0 APPLICATIONS DENIED 0 $0 0 $0 0 $0 APPLICATIONS WITHDRAWN 2 $151,025 3 $223,737 0 $0 FILES CLOSED FOR INCOMPLETENESS 1 $118,150 1 $97,300 1 $118,150
Aggregated Statistics For Year 2004(Based on 3 partial tracts) A) Conventional B) Refinancings C) Non-occupant Loans on D) Loans On Manufactured Number Average Value Number Average Value Number Average Value Number Average Value
LOANS ORIGINATED 35 $177,331 12 $180,668 4 $109,860 1 $60,940 APPLICATIONS APPROVED, NOT ACCEPTED 1 $267,850 4 $182,892 1 $125,100 0 $0 APPLICATIONS DENIED 0 $0 1 $157,710 0 $0 0 $0 APPLICATIONS WITHDRAWN 0 $0 2 $75,135 0 $0 0 $0 FILES CLOSED FOR INCOMPLETENESS 0 $0 0 $0 0 $0 0 $0
Aggregated Statistics For Year 2003(Based on 3 partial tracts) A) Conventional B) Refinancings C) Non-occupant Loans on Number Average Value Number Average Value Number Average Value
LOANS ORIGINATED 24 $145,395 39 $160,780 2 $157,000 APPLICATIONS APPROVED, NOT ACCEPTED 3 $175,143 10 $155,526 1 $55,760 APPLICATIONS DENIED 0 $0 1 $81,790 0 $0 APPLICATIONS WITHDRAWN 0 $0 6 $140,478 0 $0 FILES CLOSED FOR INCOMPLETENESS 0 $0 1 $79,120 0 $0
Aggregated Statistics For Year 2002(Based on 3 partial tracts) A) Conventional B) Refinancings C) Non-occupant Loans on Number Average Value Number Average Value Number Average Value
LOANS ORIGINATED 27 $132,119 32 $153,614 3 $89,760 APPLICATIONS APPROVED, NOT ACCEPTED 4 $126,920 8 $144,330 1 $88,610 APPLICATIONS DENIED 0 $0 0 $0 0 $0 APPLICATIONS WITHDRAWN 1 $104,780 1 $143,550 0 $0 FILES CLOSED FOR INCOMPLETENESS 0 $0 0 $0 0 $0
Aggregated Statistics For Year 2001(Based on 3 partial tracts) A) Conventional B) Refinancings C) Non-occupant Loans on Number Average Value Number Average Value Number Average Value
LOANS ORIGINATED 25 $140,672 28 $153,042 1 $123,110 APPLICATIONS APPROVED, NOT ACCEPTED 6 $157,227 3 $134,140 0 $0 APPLICATIONS DENIED 1 $48,110 1 $116,140 1 $89,280 APPLICATIONS WITHDRAWN 0 $0 2 $123,490 0 $0 FILES CLOSED FOR INCOMPLETENESS 1 $92,920 0 $0 0 $0
Aggregated Statistics For Year 2000(Based on 3 partial tracts) A) Conventional B) Refinancings C) Non-occupant Loans on Number Average Value Number Average Value Number Average Value
LOANS ORIGINATED 29 $143,470 4 $114,575 1 $45,440 APPLICATIONS APPROVED, NOT ACCEPTED 4 $172,505 3 $123,863 0 $0 APPLICATIONS DENIED 0 $0 1 $76,980 0 $0 APPLICATIONS WITHDRAWN 1 $161,440 0 $0 0 $0 FILES CLOSED FOR INCOMPLETENESS 0 $0 0 $0 0 $0
Aggregated Statistics For Year 1999(Based on 3 partial tracts) A) Conventional B) Refinancings C) Non-occupant Loans on Number Average Value Number Average Value Number Average Value
LOANS ORIGINATED 33 $150,422 20 $130,584 1 $113,030 APPLICATIONS APPROVED, NOT ACCEPTED 3 $168,487 4 $118,792 0 $0 APPLICATIONS DENIED 2 $58,370 0 $0 0 $0 APPLICATIONS WITHDRAWN 0 $0 1 $70,710 0 $0 FILES CLOSED FOR INCOMPLETENESS 1 $88,930 0 $0 0 $0
Detailed PMIC statistics for the following Tracts:
3035.00
, 3038.00 , 3039.00 Fire-safe hotels and motels in Bel Air, Maryland:
Country Inn & Suites, 1435 Handlir Dr, Bel Air, Maryland 21015 Phone: (410) 297-9444, Fax: (410) 297-8866
Extended Stay America - Baltimore - Bel Air - Aberdeen, 1361 James Way, Bel Air, Maryland 21015 Phone: (410) 273-0194
Candlewood Suites Bel Air, 4216 Philadelphia Rd, Bel Air, Maryland 21015 Phone: (410) 914-3060, Fax: (410) 914-3070
Homewood Suites By Hilton - Aberdeen/Bel Air, 4170 Philadelphia Rd, Bel Air, Maryland 21015 Phone: (410) 297-8585, Fax: (410) 297-8586
All 4 fire-safe hotels and motels in Bel Air, Maryland
Most common first names in Bel Air, MD among deceased individuals Name Count Lived (average)
John 269 75.4 years William 268 75.2 years Mary 265 80.5 years James 186 73.7 years Robert 170 71.4 years Charles 165 75.7 years Margaret 148 81.8 years Helen 139 82.3 years Joseph 138 77.8 years Dorothy 120 79.6 years
Most common last names in Bel Air, MD among deceased individuals Last name Count Lived (average)
Smith 86 78.2 years Miller 55 76.8 years Johnson 51 74.6 years Brown 40 74.3 years Jones 40 75.7 years Taylor 39 73.3 years Williams 34 76.6 years Wilson 33 78.8 years Thomas 30 73.1 years Anderson 29 79.6 years
Bel Air compared to Maryland state average:
Unemployed percentage significantly below state average. Black race population percentage significantly below state average. Median age above state average. Foreign-born population percentage below state average. Length of stay since moving in above state average.
#71 on the list of "Top 101 cities with the most local government spending on current operations of parking facilities per resident (population 10,000+)"
#23 (21014) on the list of "Top 101 zip codes with the most beauty salons in 2005"
#28 on the list of "Top 101 counties with the highest percentage of residents that drank alcohol in the past 30 days"
#65 on the list of "Top 101 counties with the highest Particulate Matter (PM2.5 ) Annual air pollution readings in 2012 (µg/m3 )"
#79 on the list of "Top 101 counties with the highest percentage of residents that visited a dentist within the past year"
#81 on the list of "Top 101 counties with the best general health status score of residents (1-5), 3 years of data"
#98 on the list of "Top 101 counties with the largest increase in the number of deaths per 1000 residents 2000-2006 to 2007-2013 (pop. 50,000+)"
Top Patent Applicants
Kenneth W. Kinzler (23)
David C. Campbell (21)
Mark E. Brunson (19)
Lee M. Brendel (17)
John M. Hoffer, Jr. (17)
Brian Lipford (14)
Earl M. Ortt (12)
Peter Chaikowsky (11)
Jason F. Busschaert (10)
Christopher W. Shook (10)
Total of 571 patent applications in 2008-2024.
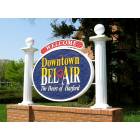
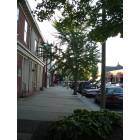
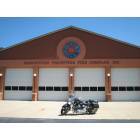
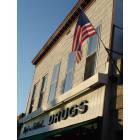


 Recent articles from our blog. Our writers, many of them Ph.D. graduates or candidates, create easy-to-read articles on a wide variety of topics.

 (17.1 miles
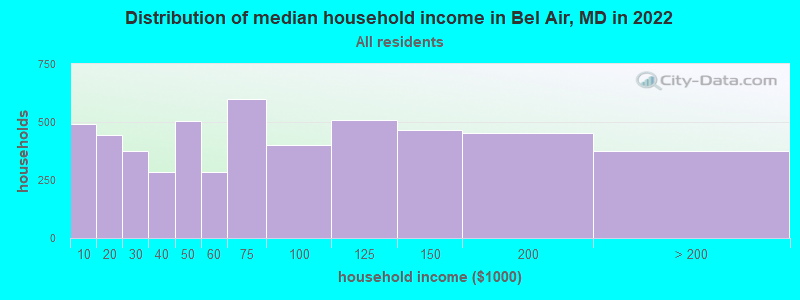
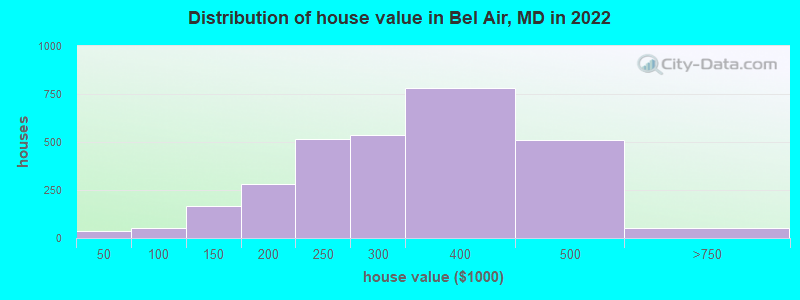

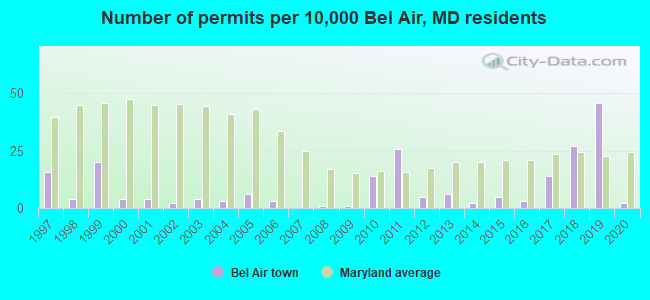
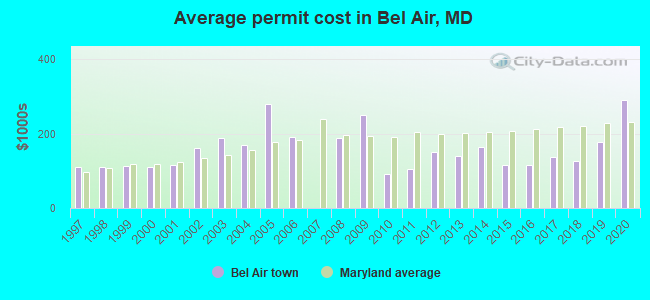
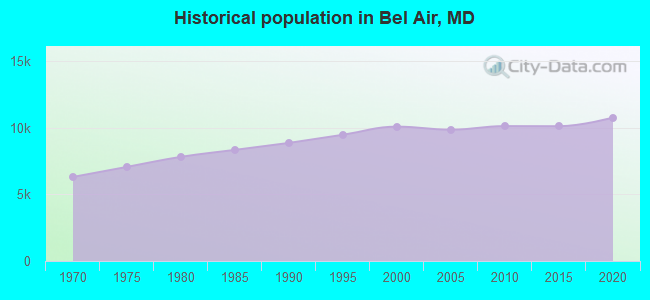
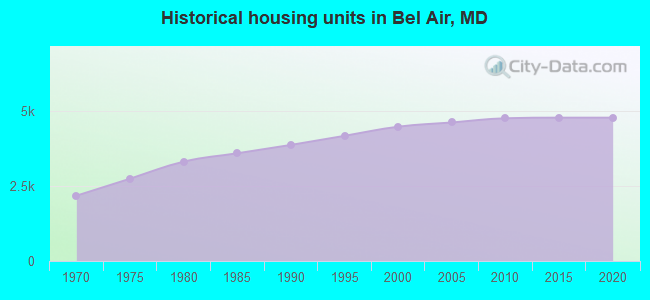
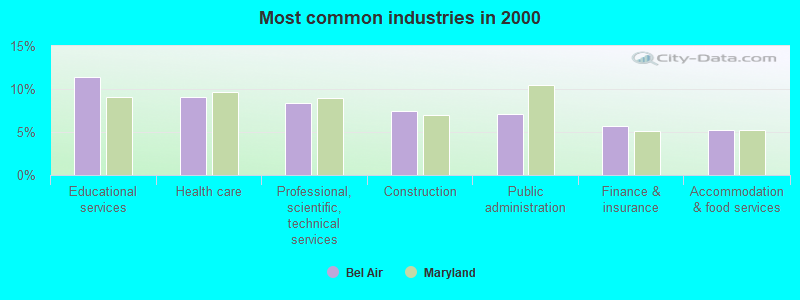
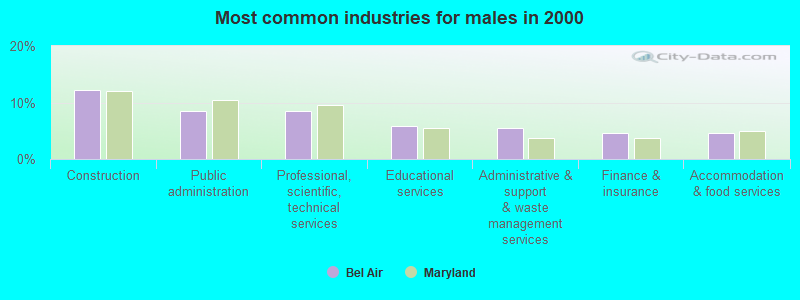


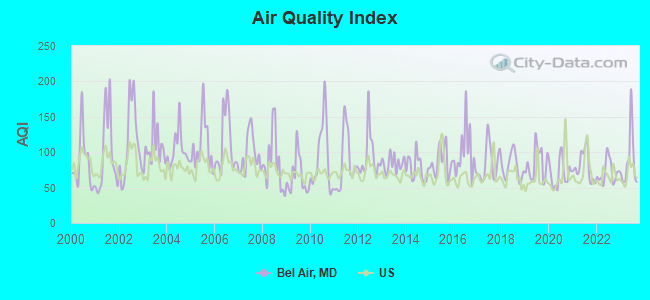
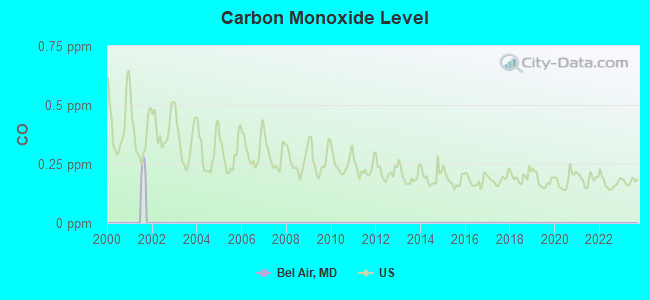
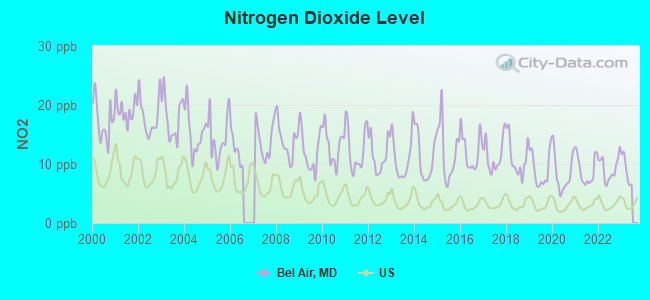
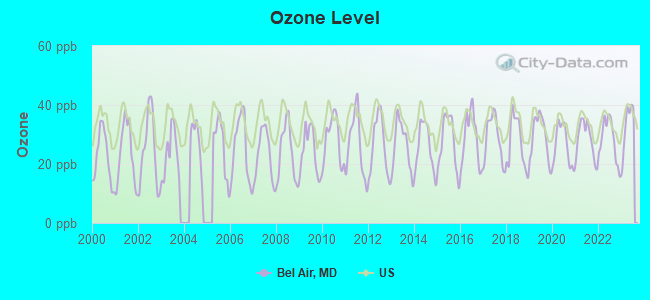
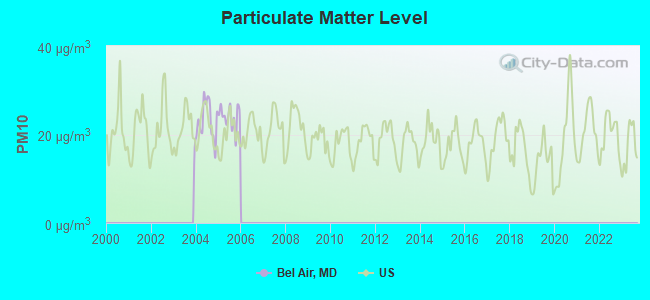
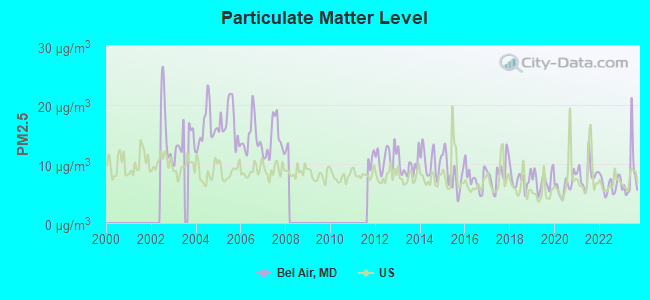

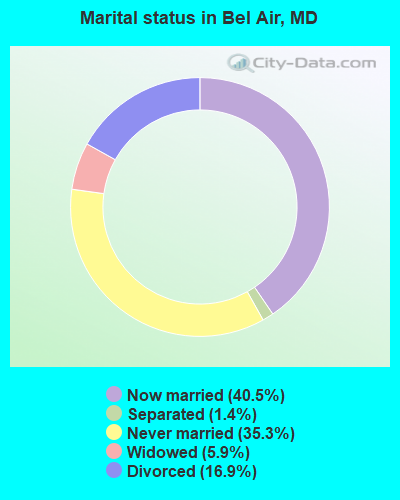
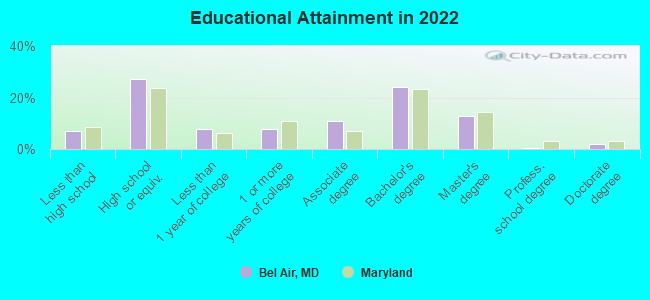
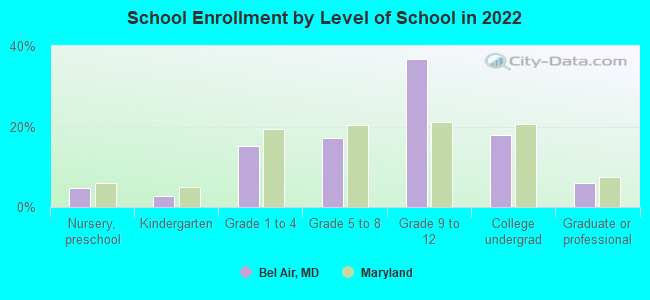
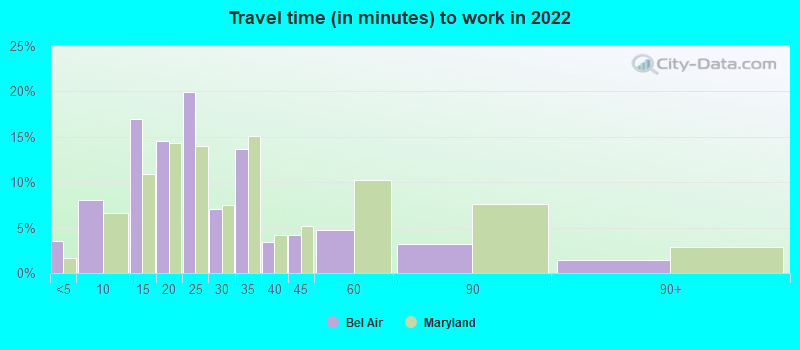
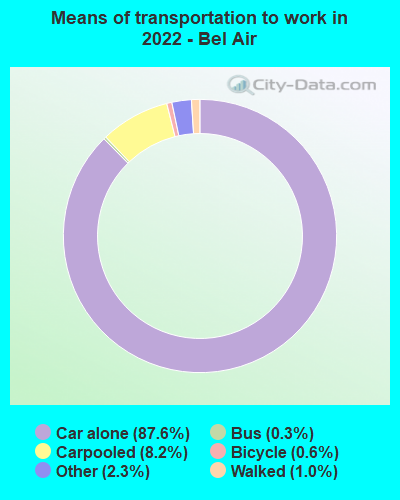
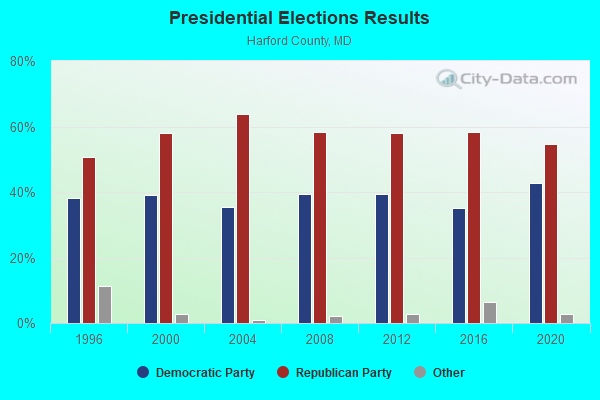
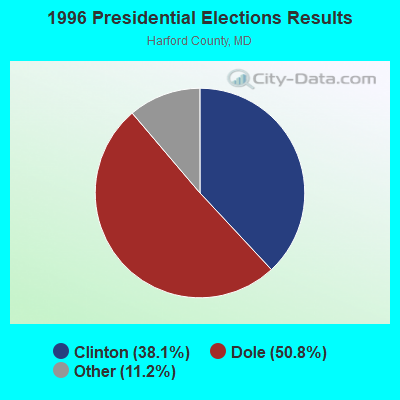

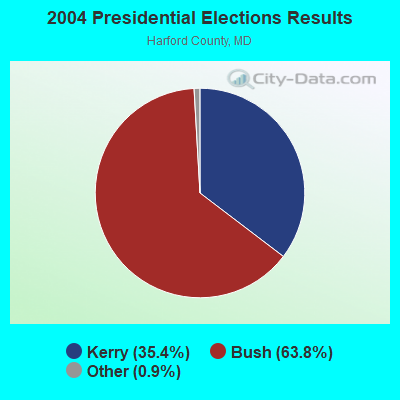
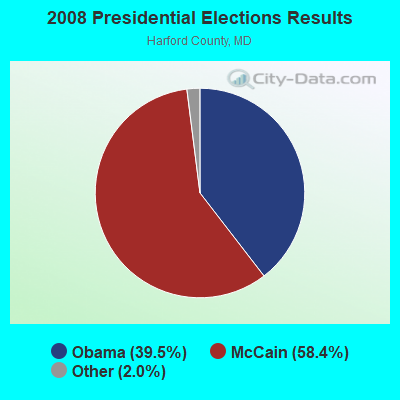
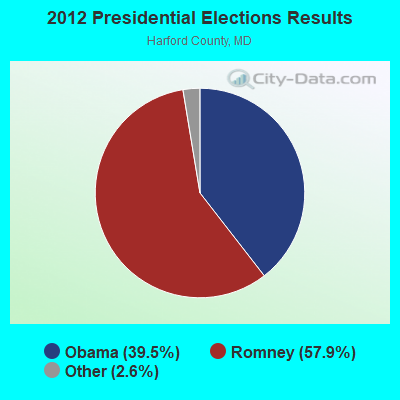
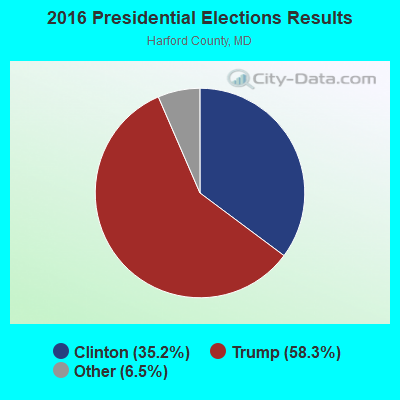
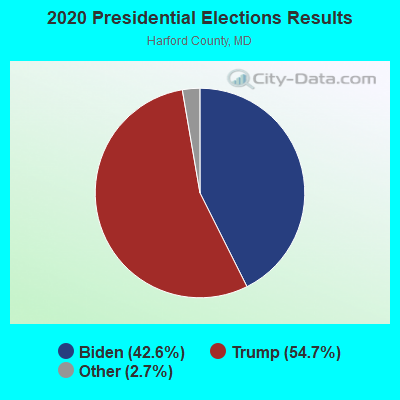
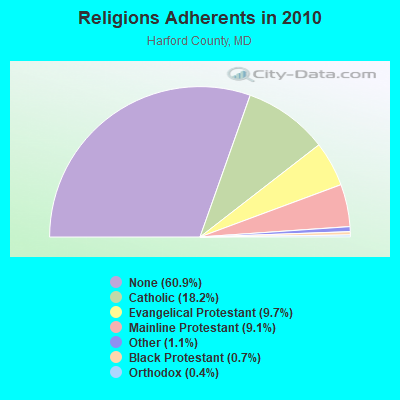
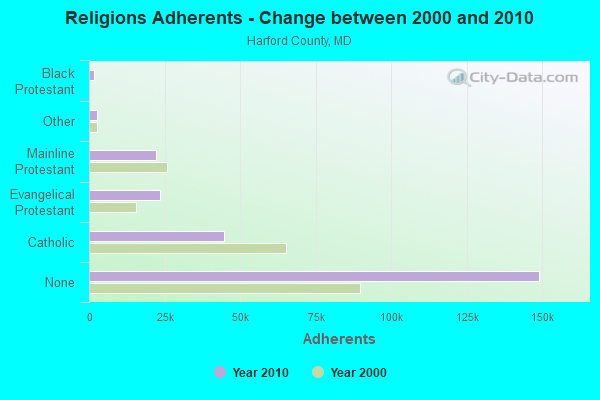
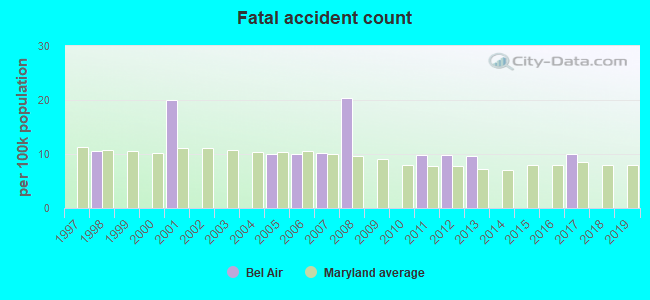
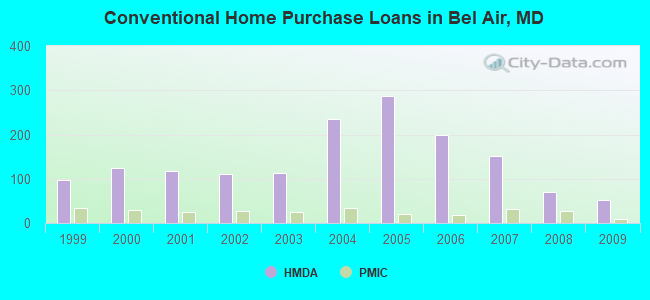
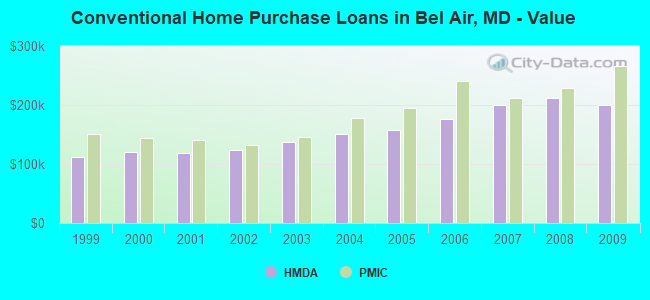
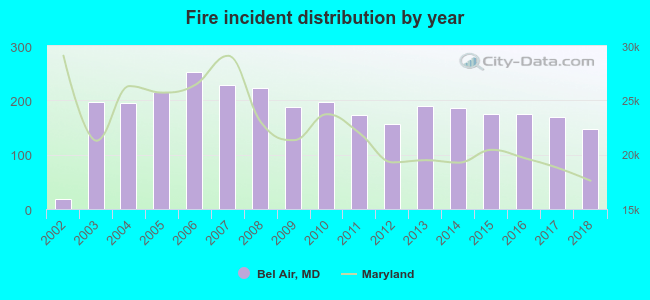 According to the data from the years 2002 - 2018 the average number of fires per year is 182. The highest number of reported fire incidents - 253 took place in 2006, and the least - 18 in 2002. The data has an increasing trend.
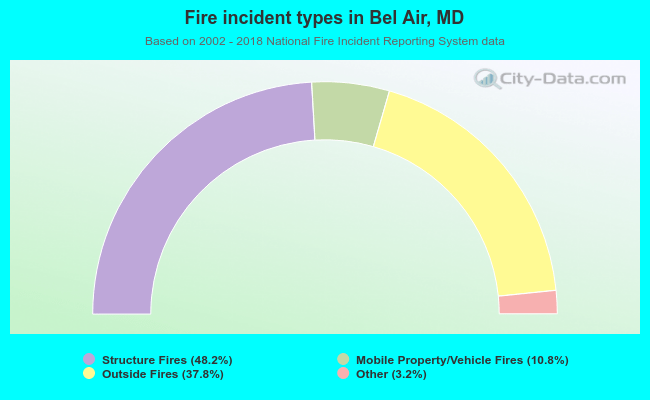 When looking into fire subcategories, the most incidents belonged to: Structure Fires (48.2%), and Outside Fires (37.8%).