Belmont, North Carolina Submit your own pictures of this city and show them to the world
OSM Map
General Map
Google Map
MSN Map
OSM Map
General Map
Google Map
MSN Map
OSM Map
General Map
Google Map
MSN Map
OSM Map
General Map
Google Map
MSN Map
Please wait while loading the map...
Population in 2022: 15,353 (99% urban, 1% rural). Population change since 2000: +76.4%Males: 6,792 Females: 8,561
March 2022 cost of living index in Belmont: 92.3 (less than average, U.S. average is 100) Percentage of residents living in poverty in 2022: 10.3%for White Non-Hispanic residents , 20.1% for Black residents , 30.6% for Hispanic or Latino residents , 100.0% for Native Hawaiian and other Pacific Islander residents , 20.6% for other race residents , 16.9% for two or more races residents )
Profiles of local businesses
Business Search - 14 Million verified businesses
Data:
Median household income ($)
Median household income (% change since 2000)
Household income diversity
Ratio of average income to average house value (%)
Ratio of average income to average rent
Median household income ($) - White
Median household income ($) - Black or African American
Median household income ($) - Asian
Median household income ($) - Hispanic or Latino
Median household income ($) - American Indian and Alaska Native
Median household income ($) - Multirace
Median household income ($) - Other Race
Median household income for houses/condos with a mortgage ($)
Median household income for apartments without a mortgage ($)
Races - White alone (%)
Races - White alone (% change since 2000)
Races - Black alone (%)
Races - Black alone (% change since 2000)
Races - American Indian alone (%)
Races - American Indian alone (% change since 2000)
Races - Asian alone (%)
Races - Asian alone (% change since 2000)
Races - Hispanic (%)
Races - Hispanic (% change since 2000)
Races - Native Hawaiian and Other Pacific Islander alone (%)
Races - Native Hawaiian and Other Pacific Islander alone (% change since 2000)
Races - Two or more races (%)
Races - Two or more races (% change since 2000)
Races - Other race alone (%)
Races - Other race alone (% change since 2000)
Racial diversity
Unemployment (%)
Unemployment (% change since 2000)
Unemployment (%) - White
Unemployment (%) - Black or African American
Unemployment (%) - Asian
Unemployment (%) - Hispanic or Latino
Unemployment (%) - American Indian and Alaska Native
Unemployment (%) - Multirace
Unemployment (%) - Other Race
Population density (people per square mile)
Population - Males (%)
Population - Females (%)
Population - Males (%) - White
Population - Males (%) - Black or African American
Population - Males (%) - Asian
Population - Males (%) - Hispanic or Latino
Population - Males (%) - American Indian and Alaska Native
Population - Males (%) - Multirace
Population - Males (%) - Other Race
Population - Females (%) - White
Population - Females (%) - Black or African American
Population - Females (%) - Asian
Population - Females (%) - Hispanic or Latino
Population - Females (%) - American Indian and Alaska Native
Population - Females (%) - Multirace
Population - Females (%) - Other Race
Coronavirus confirmed cases (Jun 16, 2024)
Deaths caused by coronavirus (Jun 16, 2024)
Coronavirus confirmed cases (per 100k population) (Jun 16, 2024)
Deaths caused by coronavirus (per 100k population) (Jun 16, 2024)
Daily increase in number of cases (Jun 16, 2024)
Weekly increase in number of cases (Jun 16, 2024)
Cases doubled (in days) (Jun 16, 2024)
Hospitalized patients (Apr 18, 2022)
Negative test results (Apr 18, 2022)
Total test results (Apr 18, 2022)
COVID Vaccine doses distributed (per 100k population) (Sep 19, 2023)
COVID Vaccine doses administered (per 100k population) (Sep 19, 2023)
COVID Vaccine doses distributed (Sep 19, 2023)
COVID Vaccine doses administered (Sep 19, 2023)
Likely homosexual households (%)
Likely homosexual households (% change since 2000)
Likely homosexual households - Lesbian couples (%)
Likely homosexual households - Lesbian couples (% change since 2000)
Likely homosexual households - Gay men (%)
Likely homosexual households - Gay men (% change since 2000)
Cost of living index
Median gross rent ($)
Median contract rent ($)
Median monthly housing costs ($)
Median house or condo value ($)
Median house or condo value ($ change since 2000)
Mean house or condo value by units in structure - 1, detached ($)
Mean house or condo value by units in structure - 1, attached ($)
Mean house or condo value by units in structure - 2 ($)
Mean house or condo value by units in structure by units in structure - 3 or 4 ($)
Mean house or condo value by units in structure - 5 or more ($)
Mean house or condo value by units in structure - Boat, RV, van, etc. ($)
Mean house or condo value by units in structure - Mobile home ($)
Median house or condo value ($) - White
Median house or condo value ($) - Black or African American
Median house or condo value ($) - Asian
Median house or condo value ($) - Hispanic or Latino
Median house or condo value ($) - American Indian and Alaska Native
Median house or condo value ($) - Multirace
Median house or condo value ($) - Other Race
Median resident age
Resident age diversity
Median resident age - Males
Median resident age - Females
Median resident age - White
Median resident age - Black or African American
Median resident age - Asian
Median resident age - Hispanic or Latino
Median resident age - American Indian and Alaska Native
Median resident age - Multirace
Median resident age - Other Race
Median resident age - Males - White
Median resident age - Males - Black or African American
Median resident age - Males - Asian
Median resident age - Males - Hispanic or Latino
Median resident age - Males - American Indian and Alaska Native
Median resident age - Males - Multirace
Median resident age - Males - Other Race
Median resident age - Females - White
Median resident age - Females - Black or African American
Median resident age - Females - Asian
Median resident age - Females - Hispanic or Latino
Median resident age - Females - American Indian and Alaska Native
Median resident age - Females - Multirace
Median resident age - Females - Other Race
Commute - mean travel time to work (minutes)
Travel time to work - Less than 5 minutes (%)
Travel time to work - Less than 5 minutes (% change since 2000)
Travel time to work - 5 to 9 minutes (%)
Travel time to work - 5 to 9 minutes (% change since 2000)
Travel time to work - 10 to 19 minutes (%)
Travel time to work - 10 to 19 minutes (% change since 2000)
Travel time to work - 20 to 29 minutes (%)
Travel time to work - 20 to 29 minutes (% change since 2000)
Travel time to work - 30 to 39 minutes (%)
Travel time to work - 30 to 39 minutes (% change since 2000)
Travel time to work - 40 to 59 minutes (%)
Travel time to work - 40 to 59 minutes (% change since 2000)
Travel time to work - 60 to 89 minutes (%)
Travel time to work - 60 to 89 minutes (% change since 2000)
Travel time to work - 90 or more minutes (%)
Travel time to work - 90 or more minutes (% change since 2000)
Marital status - Never married (%)
Marital status - Now married (%)
Marital status - Separated (%)
Marital status - Widowed (%)
Marital status - Divorced (%)
Median family income ($)
Median family income (% change since 2000)
Median non-family income ($)
Median non-family income (% change since 2000)
Median per capita income ($)
Median per capita income (% change since 2000)
Median family income ($) - White
Median family income ($) - Black or African American
Median family income ($) - Asian
Median family income ($) - Hispanic or Latino
Median family income ($) - American Indian and Alaska Native
Median family income ($) - Multirace
Median family income ($) - Other Race
Median year house/condo built
Median year apartment built
Year house built - Built 2005 or later (%)
Year house built - Built 2000 to 2004 (%)
Year house built - Built 1990 to 1999 (%)
Year house built - Built 1980 to 1989 (%)
Year house built - Built 1970 to 1979 (%)
Year house built - Built 1960 to 1969 (%)
Year house built - Built 1950 to 1959 (%)
Year house built - Built 1940 to 1949 (%)
Year house built - Built 1939 or earlier (%)
Average household size
Household density (households per square mile)
Average household size - White
Average household size - Black or African American
Average household size - Asian
Average household size - Hispanic or Latino
Average household size - American Indian and Alaska Native
Average household size - Multirace
Average household size - Other Race
Occupied housing units (%)
Vacant housing units (%)
Owner occupied housing units (%)
Renter occupied housing units (%)
Vacancy status - For rent (%)
Vacancy status - For sale only (%)
Vacancy status - Rented or sold, not occupied (%)
Vacancy status - For seasonal, recreational, or occasional use (%)
Vacancy status - For migrant workers (%)
Vacancy status - Other vacant (%)
Residents with income below the poverty level (%)
Residents with income below 50% of the poverty level (%)
Children below poverty level (%)
Poor families by family type - Married-couple family (%)
Poor families by family type - Male, no wife present (%)
Poor families by family type - Female, no husband present (%)
Poverty status for native-born residents (%)
Poverty status for foreign-born residents (%)
Poverty among high school graduates not in families (%)
Poverty among people who did not graduate high school not in families (%)
Residents with income below the poverty level (%) - White
Residents with income below the poverty level (%) - Black or African American
Residents with income below the poverty level (%) - Asian
Residents with income below the poverty level (%) - Hispanic or Latino
Residents with income below the poverty level (%) - American Indian and Alaska Native
Residents with income below the poverty level (%) - Multirace
Residents with income below the poverty level (%) - Other Race
Air pollution - Air Quality Index (AQI)
Air pollution - CO
Air pollution - NO2
Air pollution - SO2
Air pollution - Ozone
Air pollution - PM10
Air pollution - PM25
Air pollution - Pb
Crime - Murders per 100,000 population
Crime - Rapes per 100,000 population
Crime - Robberies per 100,000 population
Crime - Assaults per 100,000 population
Crime - Burglaries per 100,000 population
Crime - Thefts per 100,000 population
Crime - Auto thefts per 100,000 population
Crime - Arson per 100,000 population
Crime - City-data.com crime index
Crime - Violent crime index
Crime - Property crime index
Crime - Murders per 100,000 population (5 year average)
Crime - Rapes per 100,000 population (5 year average)
Crime - Robberies per 100,000 population (5 year average)
Crime - Assaults per 100,000 population (5 year average)
Crime - Burglaries per 100,000 population (5 year average)
Crime - Thefts per 100,000 population (5 year average)
Crime - Auto thefts per 100,000 population (5 year average)
Crime - Arson per 100,000 population (5 year average)
Crime - City-data.com crime index (5 year average)
Crime - Violent crime index (5 year average)
Crime - Property crime index (5 year average)
1996 Presidential Elections Results (%) - Democratic Party (Clinton)
1996 Presidential Elections Results (%) - Republican Party (Dole)
1996 Presidential Elections Results (%) - Other
2000 Presidential Elections Results (%) - Democratic Party (Gore)
2000 Presidential Elections Results (%) - Republican Party (Bush)
2000 Presidential Elections Results (%) - Other
2004 Presidential Elections Results (%) - Democratic Party (Kerry)
2004 Presidential Elections Results (%) - Republican Party (Bush)
2004 Presidential Elections Results (%) - Other
2008 Presidential Elections Results (%) - Democratic Party (Obama)
2008 Presidential Elections Results (%) - Republican Party (McCain)
2008 Presidential Elections Results (%) - Other
2012 Presidential Elections Results (%) - Democratic Party (Obama)
2012 Presidential Elections Results (%) - Republican Party (Romney)
2012 Presidential Elections Results (%) - Other
2016 Presidential Elections Results (%) - Democratic Party (Clinton)
2016 Presidential Elections Results (%) - Republican Party (Trump)
2016 Presidential Elections Results (%) - Other
2020 Presidential Elections Results (%) - Democratic Party (Biden)
2020 Presidential Elections Results (%) - Republican Party (Trump)
2020 Presidential Elections Results (%) - Other
Ancestries Reported - Arab (%)
Ancestries Reported - Czech (%)
Ancestries Reported - Danish (%)
Ancestries Reported - Dutch (%)
Ancestries Reported - English (%)
Ancestries Reported - French (%)
Ancestries Reported - French Canadian (%)
Ancestries Reported - German (%)
Ancestries Reported - Greek (%)
Ancestries Reported - Hungarian (%)
Ancestries Reported - Irish (%)
Ancestries Reported - Italian (%)
Ancestries Reported - Lithuanian (%)
Ancestries Reported - Norwegian (%)
Ancestries Reported - Polish (%)
Ancestries Reported - Portuguese (%)
Ancestries Reported - Russian (%)
Ancestries Reported - Scotch-Irish (%)
Ancestries Reported - Scottish (%)
Ancestries Reported - Slovak (%)
Ancestries Reported - Subsaharan African (%)
Ancestries Reported - Swedish (%)
Ancestries Reported - Swiss (%)
Ancestries Reported - Ukrainian (%)
Ancestries Reported - United States (%)
Ancestries Reported - Welsh (%)
Ancestries Reported - West Indian (%)
Ancestries Reported - Other (%)
Educational Attainment - No schooling completed (%)
Educational Attainment - Less than high school (%)
Educational Attainment - High school or equivalent (%)
Educational Attainment - Less than 1 year of college (%)
Educational Attainment - 1 or more years of college (%)
Educational Attainment - Associate degree (%)
Educational Attainment - Bachelor's degree (%)
Educational Attainment - Master's degree (%)
Educational Attainment - Professional school degree (%)
Educational Attainment - Doctorate degree (%)
School Enrollment - Nursery, preschool (%)
School Enrollment - Kindergarten (%)
School Enrollment - Grade 1 to 4 (%)
School Enrollment - Grade 5 to 8 (%)
School Enrollment - Grade 9 to 12 (%)
School Enrollment - College undergrad (%)
School Enrollment - Graduate or professional (%)
School Enrollment - Not enrolled in school (%)
School enrollment - Public schools (%)
School enrollment - Private schools (%)
School enrollment - Not enrolled (%)
Median number of rooms in houses and condos
Median number of rooms in apartments
Housing units lacking complete plumbing facilities (%)
Housing units lacking complete kitchen facilities (%)
Density of houses
Urban houses (%)
Rural houses (%)
Households with people 60 years and over (%)
Households with people 65 years and over (%)
Households with people 75 years and over (%)
Households with one or more nonrelatives (%)
Households with no nonrelatives (%)
Population in households (%)
Family households (%)
Nonfamily households (%)
Population in families (%)
Family households with own children (%)
Median number of bedrooms in owner occupied houses
Mean number of bedrooms in owner occupied houses
Median number of bedrooms in renter occupied houses
Mean number of bedrooms in renter occupied houses
Median number of vehichles in owner occupied houses
Mean number of vehichles in owner occupied houses
Median number of vehichles in renter occupied houses
Mean number of vehichles in renter occupied houses
Mortgage status - with mortgage (%)
Mortgage status - with second mortgage (%)
Mortgage status - with home equity loan (%)
Mortgage status - with both second mortgage and home equity loan (%)
Mortgage status - without a mortgage (%)
Average family size
Average family size - White
Average family size - Black or African American
Average family size - Asian
Average family size - Hispanic or Latino
Average family size - American Indian and Alaska Native
Average family size - Multirace
Average family size - Other Race
Geographical mobility - Same house 1 year ago (%)
Geographical mobility - Moved within same county (%)
Geographical mobility - Moved from different county within same state (%)
Geographical mobility - Moved from different state (%)
Geographical mobility - Moved from abroad (%)
Place of birth - Born in state of residence (%)
Place of birth - Born in other state (%)
Place of birth - Native, outside of US (%)
Place of birth - Foreign born (%)
Housing units in structures - 1, detached (%)
Housing units in structures - 1, attached (%)
Housing units in structures - 2 (%)
Housing units in structures - 3 or 4 (%)
Housing units in structures - 5 to 9 (%)
Housing units in structures - 10 to 19 (%)
Housing units in structures - 20 to 49 (%)
Housing units in structures - 50 or more (%)
Housing units in structures - Mobile home (%)
Housing units in structures - Boat, RV, van, etc. (%)
House/condo owner moved in on average (years ago)
Renter moved in on average (years ago)
Year householder moved into unit - Moved in 1999 to March 2000 (%)
Year householder moved into unit - Moved in 1995 to 1998 (%)
Year householder moved into unit - Moved in 1990 to 1994 (%)
Year householder moved into unit - Moved in 1980 to 1989 (%)
Year householder moved into unit - Moved in 1970 to 1979 (%)
Year householder moved into unit - Moved in 1969 or earlier (%)
Means of transportation to work - Drove car alone (%)
Means of transportation to work - Carpooled (%)
Means of transportation to work - Public transportation (%)
Means of transportation to work - Bus or trolley bus (%)
Means of transportation to work - Streetcar or trolley car (%)
Means of transportation to work - Subway or elevated (%)
Means of transportation to work - Railroad (%)
Means of transportation to work - Ferryboat (%)
Means of transportation to work - Taxicab (%)
Means of transportation to work - Motorcycle (%)
Means of transportation to work - Bicycle (%)
Means of transportation to work - Walked (%)
Means of transportation to work - Other means (%)
Working at home (%)
Industry diversity
Most Common Industries - Agriculture, forestry, fishing and hunting, and mining (%)
Most Common Industries - Agriculture, forestry, fishing and hunting (%)
Most Common Industries - Mining, quarrying, and oil and gas extraction (%)
Most Common Industries - Construction (%)
Most Common Industries - Manufacturing (%)
Most Common Industries - Wholesale trade (%)
Most Common Industries - Retail trade (%)
Most Common Industries - Transportation and warehousing, and utilities (%)
Most Common Industries - Transportation and warehousing (%)
Most Common Industries - Utilities (%)
Most Common Industries - Information (%)
Most Common Industries - Finance and insurance, and real estate and rental and leasing (%)
Most Common Industries - Finance and insurance (%)
Most Common Industries - Real estate and rental and leasing (%)
Most Common Industries - Professional, scientific, and management, and administrative and waste management services (%)
Most Common Industries - Professional, scientific, and technical services (%)
Most Common Industries - Management of companies and enterprises (%)
Most Common Industries - Administrative and support and waste management services (%)
Most Common Industries - Educational services, and health care and social assistance (%)
Most Common Industries - Educational services (%)
Most Common Industries - Health care and social assistance (%)
Most Common Industries - Arts, entertainment, and recreation, and accommodation and food services (%)
Most Common Industries - Arts, entertainment, and recreation (%)
Most Common Industries - Accommodation and food services (%)
Most Common Industries - Other services, except public administration (%)
Most Common Industries - Public administration (%)
Occupation diversity
Most Common Occupations - Management, business, science, and arts occupations (%)
Most Common Occupations - Management, business, and financial occupations (%)
Most Common Occupations - Management occupations (%)
Most Common Occupations - Business and financial operations occupations (%)
Most Common Occupations - Computer, engineering, and science occupations (%)
Most Common Occupations - Computer and mathematical occupations (%)
Most Common Occupations - Architecture and engineering occupations (%)
Most Common Occupations - Life, physical, and social science occupations (%)
Most Common Occupations - Education, legal, community service, arts, and media occupations (%)
Most Common Occupations - Community and social service occupations (%)
Most Common Occupations - Legal occupations (%)
Most Common Occupations - Education, training, and library occupations (%)
Most Common Occupations - Arts, design, entertainment, sports, and media occupations (%)
Most Common Occupations - Healthcare practitioners and technical occupations (%)
Most Common Occupations - Health diagnosing and treating practitioners and other technical occupations (%)
Most Common Occupations - Health technologists and technicians (%)
Most Common Occupations - Service occupations (%)
Most Common Occupations - Healthcare support occupations (%)
Most Common Occupations - Protective service occupations (%)
Most Common Occupations - Fire fighting and prevention, and other protective service workers including supervisors (%)
Most Common Occupations - Law enforcement workers including supervisors (%)
Most Common Occupations - Food preparation and serving related occupations (%)
Most Common Occupations - Building and grounds cleaning and maintenance occupations (%)
Most Common Occupations - Personal care and service occupations (%)
Most Common Occupations - Sales and office occupations (%)
Most Common Occupations - Sales and related occupations (%)
Most Common Occupations - Office and administrative support occupations (%)
Most Common Occupations - Natural resources, construction, and maintenance occupations (%)
Most Common Occupations - Farming, fishing, and forestry occupations (%)
Most Common Occupations - Construction and extraction occupations (%)
Most Common Occupations - Installation, maintenance, and repair occupations (%)
Most Common Occupations - Production, transportation, and material moving occupations (%)
Most Common Occupations - Production occupations (%)
Most Common Occupations - Transportation occupations (%)
Most Common Occupations - Material moving occupations (%)
People in Group quarters - Institutionalized population (%)
People in Group quarters - Correctional institutions (%)
People in Group quarters - Federal prisons and detention centers (%)
People in Group quarters - Halfway houses (%)
People in Group quarters - Local jails and other confinement facilities (including police lockups) (%)
People in Group quarters - Military disciplinary barracks (%)
People in Group quarters - State prisons (%)
People in Group quarters - Other types of correctional institutions (%)
People in Group quarters - Nursing homes (%)
People in Group quarters - Hospitals/wards, hospices, and schools for the handicapped (%)
People in Group quarters - Hospitals/wards and hospices for chronically ill (%)
People in Group quarters - Hospices or homes for chronically ill (%)
People in Group quarters - Military hospitals or wards for chronically ill (%)
People in Group quarters - Other hospitals or wards for chronically ill (%)
People in Group quarters - Hospitals or wards for drug/alcohol abuse (%)
People in Group quarters - Mental (Psychiatric) hospitals or wards (%)
People in Group quarters - Schools, hospitals, or wards for the mentally retarded (%)
People in Group quarters - Schools, hospitals, or wards for the physically handicapped (%)
People in Group quarters - Institutions for the deaf (%)
People in Group quarters - Institutions for the blind (%)
People in Group quarters - Orthopedic wards and institutions for the physically handicapped (%)
People in Group quarters - Wards in general hospitals for patients who have no usual home elsewhere (%)
People in Group quarters - Wards in military hospitals for patients who have no usual home elsewhere (%)
People in Group quarters - Juvenile institutions (%)
People in Group quarters - Long-term care (%)
People in Group quarters - Homes for abused, dependent, and neglected children (%)
People in Group quarters - Residential treatment centers for emotionally disturbed children (%)
People in Group quarters - Training schools for juvenile delinquents (%)
People in Group quarters - Short-term care, detention or diagnostic centers for delinquent children (%)
People in Group quarters - Type of juvenile institution unknown (%)
People in Group quarters - Noninstitutionalized population (%)
People in Group quarters - College dormitories (includes college quarters off campus) (%)
People in Group quarters - Military quarters (%)
People in Group quarters - On base (%)
People in Group quarters - Barracks, unaccompanied personnel housing (UPH), (Enlisted/Officer), ;and similar group living quarters for military personnel (%)
People in Group quarters - Transient quarters for temporary residents (%)
People in Group quarters - Military ships (%)
People in Group quarters - Group homes (%)
People in Group quarters - Homes or halfway houses for drug/alcohol abuse (%)
People in Group quarters - Homes for the mentally ill (%)
People in Group quarters - Homes for the mentally retarded (%)
People in Group quarters - Homes for the physically handicapped (%)
People in Group quarters - Other group homes (%)
People in Group quarters - Religious group quarters (%)
People in Group quarters - Dormitories (%)
People in Group quarters - Agriculture workers' dormitories on farms (%)
People in Group quarters - Job Corps and vocational training facilities (%)
People in Group quarters - Other workers' dormitories (%)
People in Group quarters - Crews of maritime vessels (%)
People in Group quarters - Other nonhousehold living situations (%)
People in Group quarters - Other noninstitutional group quarters (%)
Residents speaking English at home (%)
Residents speaking English at home - Born in the United States (%)
Residents speaking English at home - Native, born elsewhere (%)
Residents speaking English at home - Foreign born (%)
Residents speaking Spanish at home (%)
Residents speaking Spanish at home - Born in the United States (%)
Residents speaking Spanish at home - Native, born elsewhere (%)
Residents speaking Spanish at home - Foreign born (%)
Residents speaking other language at home (%)
Residents speaking other language at home - Born in the United States (%)
Residents speaking other language at home - Native, born elsewhere (%)
Residents speaking other language at home - Foreign born (%)
Class of Workers - Employee of private company (%)
Class of Workers - Self-employed in own incorporated business (%)
Class of Workers - Private not-for-profit wage and salary workers (%)
Class of Workers - Local government workers (%)
Class of Workers - State government workers (%)
Class of Workers - Federal government workers (%)
Class of Workers - Self-employed workers in own not incorporated business and Unpaid family workers (%)
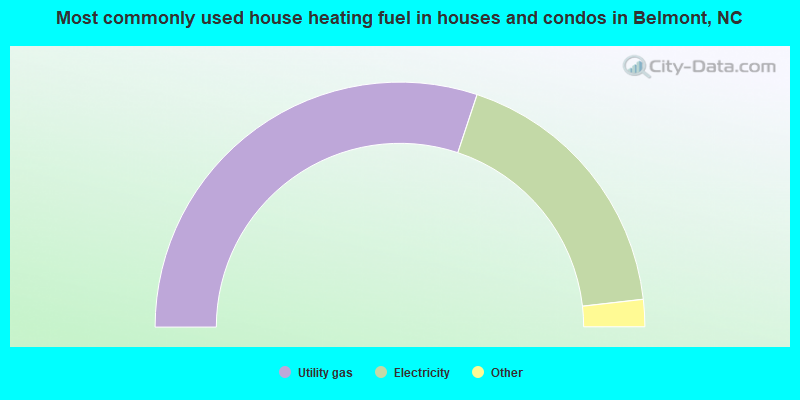
House heating fuel used in houses and condos - Utility gas (%)
House heating fuel used in houses and condos - Bottled, tank, or LP gas (%)
House heating fuel used in houses and condos - Electricity (%)
House heating fuel used in houses and condos - Fuel oil, kerosene, etc. (%)
House heating fuel used in houses and condos - Coal or coke (%)
House heating fuel used in houses and condos - Wood (%)
House heating fuel used in houses and condos - Solar energy (%)
House heating fuel used in houses and condos - Other fuel (%)
House heating fuel used in houses and condos - No fuel used (%)
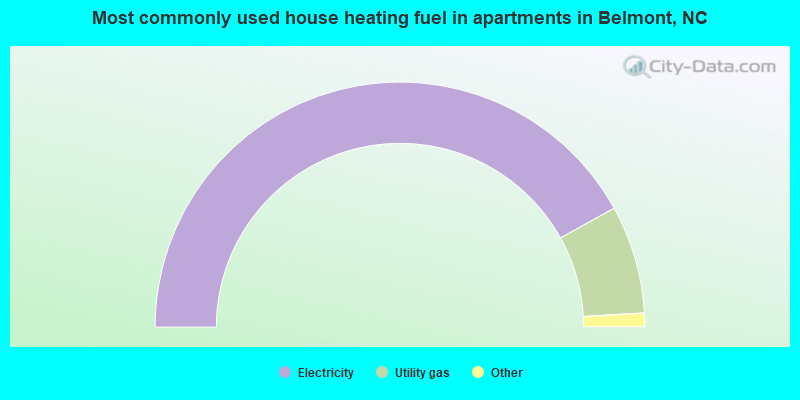
House heating fuel used in apartments - Utility gas (%)
House heating fuel used in apartments - Bottled, tank, or LP gas (%)
House heating fuel used in apartments - Electricity (%)
House heating fuel used in apartments - Fuel oil, kerosene, etc. (%)
House heating fuel used in apartments - Coal or coke (%)
House heating fuel used in apartments - Wood (%)
House heating fuel used in apartments - Solar energy (%)
House heating fuel used in apartments - Other fuel (%)
House heating fuel used in apartments - No fuel used (%)
Armed forces status - In Armed Forces (%)
Armed forces status - Civilian (%)
Armed forces status - Civilian - Veteran (%)
Armed forces status - Civilian - Nonveteran (%)
Fatal accidents locations in years 2005-2021
Fatal accidents locations in 2005
Fatal accidents locations in 2006
Fatal accidents locations in 2007
Fatal accidents locations in 2008
Fatal accidents locations in 2009
Fatal accidents locations in 2010
Fatal accidents locations in 2011
Fatal accidents locations in 2012
Fatal accidents locations in 2013
Fatal accidents locations in 2014
Fatal accidents locations in 2015
Fatal accidents locations in 2016
Fatal accidents locations in 2017
Fatal accidents locations in 2018
Fatal accidents locations in 2019
Fatal accidents locations in 2020
Fatal accidents locations in 2021
Alcohol use - People drinking some alcohol every month (%)
Alcohol use - People not drinking at all (%)
Alcohol use - Average days/month drinking alcohol
Alcohol use - Average drinks/week
Alcohol use - Average days/year people drink much
Audiometry - Average condition of hearing (%)
Audiometry - People that can hear a whisper from across a quiet room (%)
Audiometry - People that can hear normal voice from across a quiet room (%)
Audiometry - Ears ringing, roaring, buzzing (%)
Audiometry - Had a job exposure to loud noise (%)
Audiometry - Had off-work exposure to loud noise (%)
Blood Pressure & Cholesterol - Has high blood pressure (%)
Blood Pressure & Cholesterol - Checking blood pressure at home (%)
Blood Pressure & Cholesterol - Frequently checking blood cholesterol (%)
Blood Pressure & Cholesterol - Has high cholesterol level (%)
Consumer Behavior - Money monthly spent on food at supermarket/grocery store
Consumer Behavior - Money monthly spent on food at other stores
Consumer Behavior - Money monthly spent on eating out
Consumer Behavior - Money monthly spent on carryout/delivered foods
Consumer Behavior - Income spent on food at supermarket/grocery store (%)
Consumer Behavior - Income spent on food at other stores (%)
Consumer Behavior - Income spent on eating out (%)
Consumer Behavior - Income spent on carryout/delivered foods (%)
Current Health Status - General health condition (%)
Current Health Status - Blood donors (%)
Current Health Status - Has blood ever tested for HIV virus (%)
Current Health Status - Left-handed people (%)
Dermatology - People using sunscreen (%)
Diabetes - Diabetics (%)
Diabetes - Had a blood test for high blood sugar (%)
Diabetes - People taking insulin (%)
Diet Behavior & Nutrition - Diet health (%)
Diet Behavior & Nutrition - Milk product consumption (# of products/month)
Diet Behavior & Nutrition - Meals not home prepared (#/week)
Diet Behavior & Nutrition - Meals from fast food or pizza place (#/week)
Diet Behavior & Nutrition - Ready-to-eat foods (#/month)
Diet Behavior & Nutrition - Frozen meals/pizza (#/month)
Drug Use - People that ever used marijuana or hashish (%)
Drug Use - Ever used hard drugs (%)
Drug Use - Ever used any form of cocaine (%)
Drug Use - Ever used heroin (%)
Drug Use - Ever used methamphetamine (%)
Health Insurance - People covered by health insurance (%)
Kidney Conditions-Urology - Avg. # of times urinating at night
Medical Conditions - People with asthma (%)
Medical Conditions - People with anemia (%)
Medical Conditions - People with psoriasis (%)
Medical Conditions - People with overweight (%)
Medical Conditions - Elderly people having difficulties in thinking or remembering (%)
Medical Conditions - People who ever received blood transfusion (%)
Medical Conditions - People having trouble seeing even with glass/contacts (%)
Medical Conditions - People with arthritis (%)
Medical Conditions - People with gout (%)
Medical Conditions - People with congestive heart failure (%)
Medical Conditions - People with coronary heart disease (%)
Medical Conditions - People with angina pectoris (%)
Medical Conditions - People who ever had heart attack (%)
Medical Conditions - People who ever had stroke (%)
Medical Conditions - People with emphysema (%)
Medical Conditions - People with thyroid problem (%)
Medical Conditions - People with chronic bronchitis (%)
Medical Conditions - People with any liver condition (%)
Medical Conditions - People who ever had cancer or malignancy (%)
Mental Health - People who have little interest in doing things (%)
Mental Health - People feeling down, depressed, or hopeless (%)
Mental Health - People who have trouble sleeping or sleeping too much (%)
Mental Health - People feeling tired or having little energy (%)
Mental Health - People with poor appetite or overeating (%)
Mental Health - People feeling bad about themself (%)
Mental Health - People who have trouble concentrating on things (%)
Mental Health - People moving or speaking slowly or too fast (%)
Mental Health - People having thoughts they would be better off dead (%)
Oral Health - Average years since last visit a dentist
Oral Health - People embarrassed because of mouth (%)
Oral Health - People with gum disease (%)
Oral Health - General health of teeth and gums (%)
Oral Health - Average days a week using dental floss/device
Oral Health - Average days a week using mouthwash for dental problem
Oral Health - Average number of teeth
Pesticide Use - Households using pesticides to control insects (%)
Pesticide Use - Households using pesticides to kill weeds (%)
Physical Activity - People doing vigorous-intensity work activities (%)
Physical Activity - People doing moderate-intensity work activities (%)
Physical Activity - People walking or bicycling (%)
Physical Activity - People doing vigorous-intensity recreational activities (%)
Physical Activity - People doing moderate-intensity recreational activities (%)
Physical Activity - Average hours a day doing sedentary activities
Physical Activity - Average hours a day watching TV or videos
Physical Activity - Average hours a day using computer
Physical Functioning - People having limitations keeping them from working (%)
Physical Functioning - People limited in amount of work they can do (%)
Physical Functioning - People that need special equipment to walk (%)
Physical Functioning - People experiencing confusion/memory problems (%)
Physical Functioning - People requiring special healthcare equipment (%)
Prescription Medications - Average number of prescription medicines taking
Preventive Aspirin Use - Adults 40+ taking low-dose aspirin (%)
Reproductive Health - Vaginal deliveries (%)
Reproductive Health - Cesarean deliveries (%)
Reproductive Health - Deliveries resulted in a live birth (%)
Reproductive Health - Pregnancies resulted in a delivery (%)
Reproductive Health - Women breastfeeding newborns (%)
Reproductive Health - Women that had a hysterectomy (%)
Reproductive Health - Women that had both ovaries removed (%)
Reproductive Health - Women that have ever taken birth control pills (%)
Reproductive Health - Women taking birth control pills (%)
Reproductive Health - Women that have ever used Depo-Provera or injectables (%)
Reproductive Health - Women that have ever used female hormones (%)
Sexual Behavior - People 18+ that ever had sex (vaginal, anal, or oral) (%)
Sexual Behavior - Males 18+ that ever had vaginal sex with a woman (%)
Sexual Behavior - Males 18+ that ever performed oral sex on a woman (%)
Sexual Behavior - Males 18+ that ever had anal sex with a woman (%)
Sexual Behavior - Males 18+ that ever had any sex with a man (%)
Sexual Behavior - Females 18+ that ever had vaginal sex with a man (%)
Sexual Behavior - Females 18+ that ever performed oral sex on a man (%)
Sexual Behavior - Females 18+ that ever had anal sex with a man (%)
Sexual Behavior - Females 18+ that ever had any kind of sex with a woman (%)
Sexual Behavior - Average age people first had sex
Sexual Behavior - Average number of female sex partners in lifetime (males 18+)
Sexual Behavior - Average number of female vaginal sex partners in lifetime (males 18+)
Sexual Behavior - Average age people first performed oral sex on a woman (18+)
Sexual Behavior - Average number of woman performed oral sex on in lifetime (18+)
Sexual Behavior - Average number of male sex partners in lifetime (males 18+)
Sexual Behavior - Average number of male anal sex partners in lifetime (males 18+)
Sexual Behavior - Average age people first performed oral sex on a man (18+)
Sexual Behavior - Average number of male oral sex partners in lifetime (18+)
Sexual Behavior - People using protection when performing oral sex (%)
Sexual Behavior - Average number of times people have vaginal or anal sex a year
Sexual Behavior - People having sex without condom (%)
Sexual Behavior - Average number of male sex partners in lifetime (females 18+)
Sexual Behavior - Average number of male vaginal sex partners in lifetime (females 18+)
Sexual Behavior - Average number of female sex partners in lifetime (females 18+)
Sexual Behavior - Circumcised males 18+ (%)
Sleep Disorders - Average hours sleeping at night
Sleep Disorders - People that has trouble sleeping (%)
Smoking-Cigarette Use - People smoking cigarettes (%)
Taste & Smell - People 40+ having problems with smell (%)
Taste & Smell - People 40+ having problems with taste (%)
Taste & Smell - People 40+ that ever had wisdom teeth removed (%)
Taste & Smell - People 40+ that ever had tonsils teeth removed (%)
Taste & Smell - People 40+ that ever had a loss of consciousness because of a head injury (%)
Taste & Smell - People 40+ that ever had a broken nose or other serious injury to face or skull (%)
Taste & Smell - People 40+ that ever had two or more sinus infections (%)
Weight - Average height (inches)
Weight - Average weight (pounds)
Weight - Average BMI
Weight - People that are obese (%)
Weight - People that ever were obese (%)
Weight - People trying to lose weight (%)
Officers per 1,000 residents here:
3.10North Carolina average:
2.27
Latest news from Belmont, NC collected exclusively by city-data.com from local newspapers, TV, and radio stations
Ancestries: American (26.2%), German (11.8%), English (10.7%), Irish (9.6%), Scotch-Irish (2.9%), Italian (2.5%).
Current Local Time:
Land area: 8.08 square miles.
Population density: 1,900 people per square mile (low).
778 residents are foreign born (2.0% Asia , 0.9% Europe , 0.9% North America , 0.7% Africa , 0.5% Latin America ).
This city:
5.1%North Carolina:
8.3%
Median real estate property taxes paid for housing units with mortgages in 2022: $3,178 (0.7%)Median real estate property taxes paid for housing units with no mortgage in 2022: $1,872 (0.7%)
Nearest city with pop. 50,000+: Gastonia, NC
Nearest city with pop. 200,000+: Charlotte, NC
Nearest city with pop. 1,000,000+: Philadelphia, PA
Nearest cities:
Spencer Mountain, NC (2.5 miles),
Latitude: 35.24 N, Longitude: 81.04 W
Daytime population change due to commuting: -18 (-0.1%)Workers who live and work in this city: 2,883 (35.6%)
Property values in Belmont, NC
Unemployment in December 2023: Here:
3.2%North Carolina:
3.2%
Most common occupations in Belmont, NC (%)
Both Males Females
Other production occupations, including supervisors (5.5%)
Electrical equipment mechanics and other installation, maintenance, and repair workers, including supervisors (4.1%)
Preschool, kindergarten, elementary, and middle school teachers (4.0%)
Textile, apparel, and furnishings workers (3.5%)
Laborers and material movers, hand (3.4%)
Other management occupations, except farmers and farm managers (3.4%)
Other sales and related occupations, including supervisors (3.1%)
Other production occupations, including supervisors (8.0%)
Electrical equipment mechanics and other installation, maintenance, and repair workers, including supervisors (6.5%)
Laborers and material movers, hand (5.4%)
Building and grounds cleaning and maintenance occupations (4.0%)
Other sales and related occupations, including supervisors (3.7%)
Other management occupations, except farmers and farm managers (3.7%)
Assemblers and fabricators (3.6%)
Preschool, kindergarten, elementary, and middle school teachers (6.9%)
Secretaries and administrative assistants (6.0%)
Textile, apparel, and furnishings workers (5.8%)
Bookkeeping, accounting, and auditing clerks (5.0%)
Information and record clerks, except customer service representatives (4.6%)
Health technologists and technicians (4.3%)
Other office and administrative support workers, including supervisors (4.2%)
Tornado activity:
Belmont-area historical tornado activity is slightly above North Carolina state average. It is 9% greater than the overall U.S. average.
On 5/5/1989, a category F4 (max. wind speeds 207-260 mph) tornado 25.2 miles away from the Belmont city center killed one person and injured 6 people and caused between $5,000,000 and $50,000,000 in damages.
On 3/27/1994, a category F3 (max. wind speeds 158-206 mph) tornado 6.8 miles away from the city center injured 2 people and caused between $5,000,000 and $50,000,000 in damages.
Earthquake activity:
Belmont-area historical earthquake activity is significantly above North Carolina state average. It is 16% smaller than the overall U.S. average. On 8/9/2020 at 12:07:37, a magnitude 5.1 (5.1 MW, Depth: 4.7 mi, Class: Moderate, Intensity: VI - VII) earthquake occurred 85.2 miles away from the city center On 8/23/2011 at 17:51:04, a magnitude 5.8 (5.8 MW, Depth: 3.7 mi) earthquake occurred 252.2 miles away from Belmont center On 8/2/1974 at 08:52:09, a magnitude 4.9 (4.3 MB, 4.9 LG, Class: Light, Intensity: IV - V) earthquake occurred 125.9 miles away from the city center On 7/27/1980 at 18:52:21, a magnitude 5.2 (5.1 MB, 4.7 MS, 5.0 UK, 5.2 UK) earthquake occurred 260.6 miles away from Belmont center On 11/30/1973 at 07:48:41, a magnitude 4.7 (4.7 MB, 4.6 ML) earthquake occurred 169.1 miles away from the city center On 11/22/1974 at 05:25:55, a magnitude 4.7 (4.7 MB) earthquake occurred 170.0 miles away from the city center Magnitude types: regional Lg-wave magnitude (LG), body-wave magnitude (MB), local magnitude (ML), surface-wave magnitude (MS), moment magnitude (MW) Natural disasters: The number of natural disasters in Gaston County (12) is smaller than the US average (15).Major Disasters (Presidential) Declared: 6Emergencies Declared: 4Droughts: 2, Floods: 2, Hurricanes: 2, Storms: 2, Tornadoes: 2, Blizzard: 1, Freeze: 1, Ice Storm: 1, Snowfall: 1, Tropical Storm: 1, Winter Storm: 1, Other: 1 (Note: some incidents may be assigned to more than one category). Main business address for: COX TECHNOLOGIES INC MEASURING & CONTROLLING DEVICES, NEC ).
Hospitals and medical centers in Belmont: HOLY ANGELS SERVICES - FOX RUN HOMES (6600 WILKINSON BOULEVARD) BELMONT DIALYSIS CENTER (5010 MEDICAL CARE COURT)
Other hospitals and medical centers near Belmont: MOUNTAIN RIDGE GROUP HOME (Hospital, about 4 miles away; GASTONIA, NC)
MEADOWWOOD NURSING CENTER (Nursing Home, about 4 miles away; GASTONIA, NC)
AUTUMNFIELD OF LOWELL (Nursing Home, about 5 miles away; GASTONIA, NC)
STARNES GROUP HOME (Hospital, about 5 miles away; CHARLOTTE, NC)
ADVANCED HOME CARE (Home Health Center, about 6 miles away; GASTONIA, NC)
COURTLAND TERRACE (Nursing Home, about 7 miles away; GASTONIA, NC)
HOME HEALTH PROFESSIONALS (Home Health Center, about 7 miles away; GASTONIA, NC)
Amtrak stations near Belmont: 8 miles: GASTONIA (350 HANCOCK ST.) Services: enclosed waiting area, public restrooms, public payphones, free short-term parking, free long-term parking, call for taxi service.
12 miles: CHARLOTTE (1914 N. TYRON ST.) Services: ticket office, partially wheelchair accessible, enclosed waiting area, public restrooms, public payphones, vending machines, free short-term parking, free long-term parking, call for car rental service, taxi stand, public transit connection.
Operable nuclear power plants near Belmont:
15 miles: Catawba 1 and 2 in Clover, SC.19 miles: McGuire 1 in Cornelius, NC.
College/University in Belmont: Belmont Abbey College Full-time enrollment: 1,535; Location: 100 Belmont-Mt Holly Road; Private, not-for-profit; Website: www.belmontabbeycollege.edu)
Colleges/universities with over 2000 students nearest to Belmont:
Gaston College (about 10 miles; Dallas, NC ; Full-time enrollment: 4,385)
Johnson & Wales University-Charlotte (about 11 miles; Charlotte, NC ; FT enrollment: 2,518)
Central Piedmont Community College (about 12 miles; Charlotte, NC ; FT enrollment: 15,371)
Queens University of Charlotte (about 13 miles; Charlotte, NC ; FT enrollment: 2,083)
University of North Carolina at Charlotte (about 18 miles; Charlotte, NC ; FT enrollment: 22,807)
Winthrop University (about 22 miles; Rock Hill, SC ; FT enrollment: 5,575)
York Technical College (about 22 miles; Rock Hill, SC ; FT enrollment: 3,572)
Public high schools in Belmont: SOUTH POINT HIGH Location: 906 SOUTH POINT ROAD, Grades: 9-12)STUART W CRAMER HIGH Location: 101 LAKEWOOD RD, Grades: 9-12)
Public elementary/middle schools in Belmont:
See full list of schools located in Belmont Birthplace of: Doris Satterfield - Baseball player, Humpy Wheeler - Auto racing promoter, Koren Robinson - 2005 NFL player (Minnesota Vikings, born : Mar 19, 1980).
Gaston County has a predicted average indoor radon screening level between 2 and 4 pCi/L (pico curies per liter) - Moderate Potential Drinking water stations with addresses in Belmont and their reported violations in the past:
BELMONT, CITY OF (Population served: 10,076, Surface water):
Past health violations:
MCL, Average - Between OCT-2011 and DEC-2011, Contaminant: TTHM. Follow-up actions: St AO (w/o penalty) issued (DEC-15-2011), St Public Notif received (JAN-10-2012), St Public Notif requested (MAY-09-2012), St Formal NOV issued (MAY-09-2012), St Compliance achieved (JUN-30-2012)
MCL, Average - Between JUL-2011 and SEP-2011, Contaminant: TTHM. Follow-up actions: St Public Notif received (SEP-19-2011), St Public Notif requested (DEC-15-2011), St Formal NOV issued (DEC-15-2011), St AO (w/o penalty) issued (DEC-15-2011), St Compliance achieved (JUN-30-2012)
Treatment Technique (SWTR and GWR) - In MAR-2005. Follow-up actions: St Public Notif requested (APR-15-2005), St Formal NOV issued (APR-15-2005), St Public Notif received (MAY-03-2005), St Compliance achieved (MAY-31-2005)
Past monitoring violations:
Single Turbidity Exceed (Enhanced SWTR) - In JAN-2013, Contaminant: IESWTR. Follow-up actions: St Public Notif requested (JAN-30-2013), St Formal NOV issued (JAN-30-2013), St AO (w/o penalty) issued (JAN-30-2013), St Compliance achieved (FEB-01-2013), St Public Notif received (FEB-07-2013)
Address: BELMONT ABBEY COLLEGE Population served: 700, Groundwater):
Past monitoring violations:
Monitoring, Routine (IDSE) - In APR-02-2008, Contaminant: DBP STAGE 2. Follow-up actions: St Compliance achieved (MAY-04-2009)
2 regular monitoring violations
Population served: 500, Groundwater):
Past health violations:
MCL, Monthly (TCR) - Between APR-2007 and JUN-2007, Contaminant: Coliform. Follow-up actions: St Public Notif requested (APR-27-2007), St Formal NOV issued (APR-27-2007), St Public Notif received (MAY-11-2007), St Compliance achieved (AUG-30-2010)
Past monitoring violations:
Monitoring, Repeat Major (TCR) - Between OCT-2006 and DEC-2006, Contaminant: Coliform (TCR). Follow-up actions: St Public Notif requested (FEB-19-2007), St Formal NOV issued (FEB-19-2007), St Public Notif received (APR-16-2007), St Compliance achieved (AUG-30-2010)
Monitoring, Repeat Major (TCR) - In AUG-2005, Contaminant: Coliform (TCR). Follow-up actions: St Public Notif requested (SEP-26-2005), St Formal NOV issued (OCT-05-2005), St Intentional no-action (JUN-11-2010), St Compliance achieved (JUN-11-2010)
Population served: 150, Groundwater):
Past monitoring violations:
Monitoring, Repeat Major (TCR) - In MAR-2005, Contaminant: Coliform (TCR). Follow-up actions: St Formal NOV issued (MAY-05-2005), St Public Notif requested (MAY-05-2005), St Compliance achieved (JUN-11-2010), St Intentional no-action (JUN-11-2010)
One routine major monitoring violation
Population served: 115, Groundwater):
Past monitoring violations:
Monitoring, Repeat Major (TCR) - In JUN-2005, Contaminant: Coliform (TCR). Follow-up actions: St Formal NOV issued (AUG-09-2005), St Public Notif requested (AUG-09-2005), St Compliance achieved (JUN-11-2010), St Intentional no-action (JUN-11-2010)
One minor monitoring violation
Address: ATTN PASTOR SCOTT PATTERSON Population served: 98, Groundwater):
Past monitoring violations:
2 routine major monitoring violations
One regular monitoring violation
Population served: 50, Groundwater):
Past health violations:
MCL, Monthly (TCR) - In AUG-2005, Contaminant: Coliform. Follow-up actions: St Public Notif requested (AUG-23-2005), St Formal NOV issued (AUG-23-2005), St Public Notif received (AUG-31-2005), St Compliance achieved (JUN-11-2010), St Intentional no-action (JUN-11-2010)
Past monitoring violations:
One routine major monitoring violation
Serves SC, Population served: 40, Groundwater):
Past health violations:
MCL, Monthly (TCR) - In OCT-2009, Contaminant: Coliform. Follow-up actions: St Public Notif received (DEC-22-2009), St Public Notif requested (JAN-04-2010), St Violation/Reminder Notice (JAN-04-2010), St Compliance achieved (JUL-01-2010)
Drinking water stations with addresses in Belmont that have no violations reported:
SOUTH POINT BAPT CH-FAMILY MINISTRY CTR (Population served: 500, Primary Water Source Type: Groundwater)
FRIENDSHIP BAPTIST CHURCH (Population served: 100, Primary Water Source Type: Groundwater)
SOUTHPOINT UNITED METHODIST CH (Population served: 70, Primary Water Source Type: Groundwater)
GRACE WESLEYAN CHURCH (Population served: 25, Primary Water Source Type: Groundwater)
Average household size: This city:
2.5 peopleNorth Carolina:
2.5 people
Percentage of family households: This city:
66.7%Whole state:
66.7%
Percentage of households with unmarried partners: This city:
6.4%Whole state:
5.9%
Likely homosexual households (counted as self-reported same-sex unmarried-partner households)
Lesbian couples: 0.5% of all households Gay men: 0.3% of all households
People in group quarters in Belmont in 2010:
569 people in college/university student housing
41 people in other noninstitutional facilities
24 people in emergency and transitional shelters (with sleeping facilities) for people experiencing homelessness
13 people in residential treatment centers for juveniles (non-correctional)
6 people in group homes intended for adults
3 people in in-patient hospice facilities
People in group quarters in Belmont in 2000:
437 people in college dormitories (includes college quarters off campus)
117 people in nursing homes
55 people in schools, hospitals, or wards for the intellectually disabled
20 people in religious group quarters
15 people in other noninstitutional group quarters
10 people in agriculture workers' dormitories on farms
5 people in homes for the mentally retarded
Banks with branches in Belmont (2011 data):
Wells Fargo Bank, National Association: Belmont Main Branch at 32 North Main Street, branch established on 1907/01/01; Abbey Plaza at 635 Park Street, branch established on 1972/12/04. Info updated 2011/04/05: Bank assets: $1,161,490.0 mil, Deposits: $905,653.0 mil, headquarters in Sioux Falls, SD, positive income , 6395 total offices , Holding Company: Wells Fargo & Company
SunTrust Bank: Belmont Branch 281 at 118 North Main Street, branch established on 1968/12/04. Info updated 2010/05/27: Bank assets: $171,291.7 mil, Deposits: $129,833.2 mil, headquarters in Atlanta, GA, positive income , Commercial Lending Specialization, 1716 total offices , Holding Company: Suntrust Banks, Inc.
Bank of America, National Association: Belmont Branch at 645 Park Avenue, branch established on 1986/04/18. Info updated 2009/11/18: Bank assets: $1,451,969.3 mil, Deposits: $1,077,176.8 mil, headquarters in Charlotte, NC, positive income , 5782 total offices , Holding Company: Bank Of America Corporation
Communityone Bank, National Association: Belmont Branch at 6440 Wilkinson Boulevard, branch established on 1995/09/05. Info updated 2007/12/11: Bank assets: $1,666.0 mil, Deposits: $1,443.4 mil, headquarters in Asheboro, NC, negative income in the last year , 46 total offices , Holding Company: Fnb United Corp.
Branch Banking and Trust Company: Belmont Branch at 601 Hawley Avenue, branch established on 2007/12/17. Info updated 2010/03/29: Bank assets: $168,867.6 mil, Deposits: $127,549.5 mil, headquarters in Winston Salem, NC, positive income , Commercial Lending Specialization, 1793 total offices , Holding Company: Bb&T Corporation
Belmont Federal Savings and Loan Association: Belmont Federal Savings And Loan Ass at 42 Catawba Street, branch established on 1915/01/01. Info updated 2011/08/29: Bank assets: $103.6 mil, Deposits: $87.6 mil, local headquarters , positive income , Mortgage Lending Specialization, 1 total offices
Woodforest National Bank: Belmont Wal-Mart Branch at 701 Hawley Avenue, branch established on 2006/07/19. Info updated 2011/05/10: Bank assets: $3,488.9 mil, Deposits: $3,097.6 mil, headquarters in Houston, TX, positive income , Commercial Lending Specialization, 766 total offices , Holding Company: Woodforest Financial Group Employee Stock Ownership Plan (With 401(K) Provisions)
Citizens South Bank: Belmont Branch at 192 East Woodrow Avenue, branch established on 2005/11/15. Info updated 2011/07/21: Bank assets: $1,078.7 mil, Deposits: $878.1 mil, headquarters in Gastonia, NC, positive income , Commercial Lending Specialization, 21 total offices
For population 15 years and over in Belmont:
Never married: 32.4%Now married: 48.0%Separated: 2.8%Widowed: 4.1%Divorced: 12.7% For population 25 years and over in Belmont:
High school or higher: 92.4%Bachelor's degree or higher: 45.7%Graduate or professional degree: 15.6%Unemployed: 13.2%Mean travel time to work (commute): 20.7 minutes
Education Gini index (Inequality in education) Here:
9.7North Carolina average:
11.7
Religion statistics for Belmont, NC (based on Gaston County data)
Religion Adherents Congregations Evangelical Protestant 85,092 293 Mainline Protestant 20,666 62 Black Protestant 6,056 28 Catholic 5,914 3 Other 1,741 7 None 88,372 -
Source: Clifford Grammich, Kirk Hadaway, Richard Houseal, Dale E.Jones, Alexei Krindatch, Richie Stanley and Richard H.Taylor. 2012. 2010 U.S.Religion Census: Religious Congregations & Membership Study. Association of Statisticians of American Religious Bodies. Jones, Dale E., et al. 2002. Congregations and Membership in the United States 2000. Nashville, TN: Glenmary Research Center. Graphs represent county-level data
Food Environment Statistics: Number of grocery stores : 37Gaston County :
1.83 / 10,000 pop.State :
2.05 / 10,000 pop.
Number of supercenters and club stores : 2This county :
0.10 / 10,000 pop.North Carolina :
0.14 / 10,000 pop.
Number of convenience stores (no gas) : 21Gaston County :
1.04 / 10,000 pop.North Carolina :
0.92 / 10,000 pop.
Number of convenience stores (with gas) : 97Here :
4.80 / 10,000 pop.North Carolina :
4.75 / 10,000 pop.
Number of full-service restaurants : 108Here :
5.34 / 10,000 pop.North Carolina :
7.57 / 10,000 pop.
Adult diabetes rate : Gaston County :
10.6%State :
9.8%
Adult obesity rate : Gaston County :
28.6%North Carolina :
28.3%
Low-income preschool obesity rate : Here :
13.6%North Carolina :
15.6%
Health and Nutrition: Healthy diet rate : Belmont:
54.4%North Carolina:
48.9%
Average overall health of teeth and gums : Belmont:
54.7%North Carolina:
46.1%
Average BMI : Belmont:
28.0North Carolina:
28.8
People feeling badly about themselves : This city:
19.1%North Carolina:
20.7%
People not drinking alcohol at all : Belmont:
9.1%North Carolina:
10.7%
Average hours sleeping at night : Belmont:
7.0North Carolina:
6.8
Overweight people : Belmont:
31.8%North Carolina:
33.7%
General health condition : Belmont:
62.0%North Carolina:
55.8%
Average condition of hearing : Here:
81.8%North Carolina:
79.7%
More about Health and Nutrition of Belmont, NC Residents
Local government employment and payroll (March 2022)
Function
Full-time employees
Monthly full-time payroll
Average yearly full-time wage
Part-time employees
Monthly part-time payroll
Police Protection - Officers
39 $200,707 $61,756 6 $14,871 Water Supply
28 $132,193 $56,654 0 $0 Sewerage
22 $105,212 $57,388 0 $0 Firefighters
21 $92,790 $53,023 6 $3,481 Parks and Recreation
18 $66,460 $44,307 3 $1,938 Other Government Administration
16 $75,625 $56,719 0 $0 Police - Other
6 $23,474 $46,948 3 $2,287 Financial Administration
5 $24,632 $59,117 0 $0 Other and Unallocable
3 $11,344 $45,376 1 $1,209 Fire - Other
0 $0 1 $1,187
Totals for Government
158 $732,436 $55,628 20 $24,973
Belmont government finances - Expenditure in 2021 (per resident):
Current Operations - Liquor Stores: $2,950,000 ($192.14)
Health - Other: $18,000 ($1.17)Police Protection: $13,000 ($0.85)General - Interest on Debt: $454,000 ($29.57)
Intergovernmental to Local - Other - Health - Other: $11,000 ($0.72)
Total Salaries and Wages: $702,000 ($45.72)
Belmont government finances - Revenue in 2021 (per resident):
Revenue - Liquor Stores: $3,344,000 ($217.81)
Tax - Alcoholic Beverage Sales: $121,000 ($7.88)
Belmont government finances - Debt in 2021 (per resident):
Long Term Debt - Beginning Outstanding - Unspecified Public Purpose: $11,353,000 ($739.46)
Retired Unspecified Public Purpose: $5,981,000 ($389.57)Outstanding Unspecified Public Purpose: $5,372,000 ($349.90)
Businesses in Belmont, NC
Name Count Name Count
ALDI 1 KFC 1 Advance Auto Parts 1 Lowe's 1 Arby's 1 McDonald's 1 AutoZone 1 Pizza Hut 1 CVS 1 RadioShack 1 Chick-Fil-A 1 Rite Aid 1 Cricket Wireless 1 Subway 1 Dairy Queen 1 T-Mobile 2 Dunkin Donuts 1 Taco Bell 1 FedEx 3 U-Haul 1 Firestone Complete Auto Care 1 UPS 3 Ford 1 Waffle House 1 H&R Block 1 Walgreens 1 Hardee's 1 Walmart 1 Hilton 1 Wendy's 1 Holiday Inn 1 YMCA 1 Jones New York 1
Strongest AM radio stations in Belmont:
WCGC (1270 AM; 10 kW; BELMONT, NC; Owner: WHVN, INC.)
WBT (1110 AM; 50 kW; CHARLOTTE, NC; Owner: JEFFERSON-PILOT COMMUNICATNS CO. OF NORTH CAROLINA)
WLTC (1370 AM; 20 kW; GASTONIA, NC)
WFNZ (610 AM; 5 kW; CHARLOTTE, NC; Owner: INFINITY RADIO SUBSIDIARY OPERATIONS INC.)
WYFQ (930 AM; 5 kW; CHARLOTTE, NC; Owner: BIBLE BROADCASTING NETWORK, INC.)
WGFY (1480 AM; 10 kW; CHARLOTTE, NC; Owner: ABC, INC.)
WAGL (1560 AM; daytime; 50 kW; LANCASTER, SC; Owner: PALMETTO BROADCASTING SYSTEM, INC.)
WHKY (1290 AM; 50 kW; HICKORY, NC; Owner: LONG COMMUNICATIONS, LLC.)
WOGR (1540 AM; daytime; 2 kW; CHARLOTTE, NC; Owner: VICTORY CHRISTIAN CENTER)
WZRH (960 AM; 1 kW; DALLAS, NC; Owner: ZYBEK MEDIA GROUP, LLC)
WNOW (1030 AM; daytime; 9 kW; MINT HILL, NC; Owner: CHARLOTTE METRO RADIO, INC.)
WBCU (1460 AM; 50 kW; UNION, SC)
WCEO (840 AM; daytime; 50 kW; COLUMBIA, SC; Owner: EASTERN BROADCASTING GROUP, INC.)
Strongest FM radio stations in Belmont:
WLNK (107.9 FM; CHARLOTTE, NC; Owner: JEFFERSON-PILOT COMMUNICATIONS COMPANY OF NORTH CAROLINA)
WWMG (96.1 FM; SHELBY, NC; Owner: CLEAR CHANNEL BROADCASTING LICENSES, INC.)
WKKT (96.9 FM; STATESVILLE, NC; Owner: CAPSTAR TX LIMITED PARTNERSHIP)
WA2XKB (98.7 FM; CHARLOTTE, NC; Owner: COLUMBINE INVESTMENTS, INC.)
WPEG (97.9 FM; CONCORD, NC; Owner: INFINITY RADIO SUBSIDIARY OPERATIONS INC.)
WNKS (95.1 FM; CHARLOTTE, NC; Owner: INFINITY RADIO SUBSIDIARY OPERATIONS INC.)
WRFX-FM (99.7 FM; KANNAPOLIS, NC; Owner: CAPSTAR TX LIMITED PARTNERSHIP)
WLYT (102.9 FM; HICKORY, NC; Owner: CAPSTAR TX LIMITED PARTNERSHIP)
WBAV-FM (101.9 FM; GASTONIA, NC; Owner: INFINITY RADIO SUBSIDIARY OPERATIONS INC.)
WSGE (91.7 FM; DALLAS, NC; Owner: GASTON COLLEGE)
WSOC-FM (103.7 FM; CHARLOTTE, NC; Owner: INFINITY RADIO SUBSIDIARY OPERATIONS INC.)
WXRC (95.7 FM; HICKORY, NC; Owner: PACIFIC BROADCASTING GROUP, INC.)
W201CU (88.1 FM; BELMONT, NC; Owner: POSITIVE ALTERNATIVE RADIO, INC.)
WSSS (104.7 FM; CHARLOTTE, NC; Owner: INFINITY RADIO SUBSIDIARY OPERATIONS INC.)
WDAV (89.9 FM; DAVIDSON, NC; Owner: THE TRUSTEES OF DAVIDSON COLLEGE)
WFAE (90.7 FM; CHARLOTTE, NC; Owner: UNIVERSITY RADIO FOUNDATION, INC.)
WTHZ (94.1 FM; LEXINGTON, NC; Owner: DAVIDSON COUNTY BROADCASTING CO, INC)
W230AJ (93.9 FM; CHARLOTTE, NC; Owner: BIBLE BROADCASTING NETWORK, INC.)
WAGI-FM (105.3 FM; GAFFNEY, SC; Owner: GAFFNEY BROADCASTING, INC.)
WFMX (105.7 FM; STATESVILLE, NC; Owner: MERCURY BROADCASTING COMPANY, INC.)
TV broadcast stations around Belmont:
WBTV (Channel 3; CHARLOTTE, NC; Owner: JEFFERSON-PILOT COMMUNICATIONS/WBTV, INC.)
WCNC-TV (Channel 36; CHARLOTTE, NC; Owner: WCNC-TV, INC.)
WJZY (Channel 46; BELMONT, NC; Owner: WJZY-TV, INC.)
WWWB (Channel 55; ROCK HILL, SC; Owner: WWWB-TV, INC.)
WAFF (Channel 48; HUNTSVILLE, AL; Owner: RAYCOM AMERICA, INC.)
WSOC-TV (Channel 9; CHARLOTTE, NC; Owner: WSOC-TV HOLDINGS, INC.)
WCCB (Channel 18; CHARLOTTE, NC; Owner: NORTH CAROLINA BROADCASTING PARTNERS)
WGTB-LP (Channel 28; CHARLOTTE, NC; Owner: VICTORY CHRISTIAN CENTER, INC.)
WTVI (Channel 42; CHARLOTTE, NC; Owner: CHARLOTTE-MECKLENBURG PUBLIC BROADCASTING AUTHORITY)
W38CN (Channel 38; CHARLOTTE, NC; Owner: NATIONAL MINORITY T.V., INC.)
WUNG-TV (Channel 58; CONCORD, NC; Owner: UNIVERSITY OF NORTH CAROLINA)
W34BN (Channel 34; CHARLOTTE, NC; Owner: THREE ANGELS BROADCASTING NETWORK)
W25BR (Channel 25; CHARLOTTE, NC; Owner: WORD OF GOD FELLOWSHIP, INC.)
WAXN (Channel 64; KANNAPOLIS, NC; Owner: WSOC-TV HOLDINGS, INC.)
W52CW (Channel 52; CHARLOTTE, NC; Owner: TRINITY BROADCASTING NETWORK)
WNSC-TV (Channel 30; ROCK HILL, SC; Owner: SOUTH CAROLINA EDUCATIONAL TV COMMISSION)
National Bridge Inventory (NBI) Statistics 18 Number of bridges417ft / 127m Total length672,700 Total average daily traffic107,572 Total average daily truck traffic
New bridges - historical statistics
1 1930-1939 3 1950-1959 8 1960-1969 4 1980-1989 2 1990-1999
See full National Bridge Inventory statistics for Belmont, NC
FCC Registered Antenna Towers: 44 (
See the full list of FCC Registered Antenna Towers in Belmont )
FCC Registered Commercial Land Mobile Towers: 2 (
See the full list of FCC Registered Commercial Land Mobile Towers in Belmont, NC )
FCC Registered Broadcast Land Mobile Towers: 7 (
See the full list of FCC Registered Broadcast Land Mobile Towers )
FCC Registered Microwave Towers: 6
074 045C, 670 Park St (Lat: 35.253750 Lon: -81.025889), Overall height: 61 m, Call Sign: WPNB353, Assigned Frequencies: 10835.0 MHz, Grant Date: 07/22/1996, Expiration Date: 02/01/2001, Cancellation Date: 10/02/1996, Phone: (202) 783-4141 SOUTH POINT, 2300 Southpoint Road (Lat: 35.186556 Lon: -81.022028), Type: Gtower, Structure height: 118.8 m, Call Sign: WQEV312, Assigned Frequencies: 6286.19 MHz, 6555.00 MHz, 6315.84 MHz, 6625.00 MHz, Grant Date: 02/26/2016, Expiration Date: 04/24/2026, Certifier: Paul D Wilkerson, Registrant: Prs Tower Management Services, LLC, 4495 Motorsports Drive Sw, Suite 10, Concord, NC 28027, Phone: (704) 784-4449, Email:
Catawba, 314 Mcadenville Road (Lat: 35.257583 Lon: -81.057833), Type: Tower, Structure height: 56.4 m, Overall height: 57.6 m, Call Sign: WQIS889, Assigned Frequencies: 11365.0 MHz, Grant Date: 05/06/2008, Expiration Date: 05/06/2018, Cancellation Date: 11/06/2009, Certifier: William Chastain, Registrant: Radio Dynamics Corporation, Silver Spring, MD 20914, Phone: (301) 493-5171, Fax: (301) 576-4553, Email:
NC-CLT259A, 670 Park Street (Lat: 35.253694 Lon: -81.026028), Type: Pole, Structure height: 56.4 m, Call Sign: WQKY723, Assigned Frequencies: 10775.0 MHz, 10815.0 MHz, Grant Date: 12/27/2019, Expiration Date: 10/28/2029, Cancellation Date: 09/08/2021, Certifier: Nadja S Sodos-Wallace, Registrant: T-Mobile Usa, Inc., 12920 Se 38th Street, Bellevue, WA 98006, Phone: (425) 383-8401, Fax: (425) 383-4840, Email:
Mcadenville, 85 Mcadenville Rd (Lat: 35.255167 Lon: -81.046444), Type: Tower, Structure height: 56.4 m, Call Sign: WQLX767, Assigned Frequencies: 10955.0 MHz, Grant Date: 07/07/2020, Expiration Date: 05/20/2030, Cancellation Date: 10/25/2023, Certifier: Chris Harris, Registrant: Conterra Ultra Broadband, LLC, 5301 77 Center Drive, Charlotte, NC 28217, Phone: (704) 936-1777, Fax: (704) 936-1801, Email:
SOUTH POINT, 2300 Southpoint Road (Lat: 35.186556 Lon: -81.022028), Type: Ltower, Structure height: 118.8 m, Call Sign: WREW723, Assigned Frequencies: 6226.89 MHz, 6197.24 MHz, Grant Date: 12/18/2019, Expiration Date: 12/18/2029, Certifier: Scott Smith, Registrant: North Carolina State Highway Patrol, 4231 Mail Service Center, Raleigh, NC 26799-4231, Phone: (919) 662-4440, Email:
FCC Registered Amateur Radio Licenses: 108 (
See the full list of FCC Registered Amateur Radio Licenses in Belmont )
FAA Registered Aircraft: 11 (
See the full list of FAA Registered Aircraft in Belmont )
Home Mortgage Disclosure Act Aggregated Statistics For Year 2009(Based on 5 partial tracts) A) FHA, FSA/RHS & VA B) Conventional C) Refinancings D) Home Improvement Loans F) Non-occupant Loans on G) Loans On Manufactured Number Average Value Number Average Value Number Average Value Number Average Value Number Average Value Number Average Value
LOANS ORIGINATED 41 $155,039 44 $147,932 152 $180,077 4 $116,842 14 $112,930 1 $104,830 APPLICATIONS APPROVED, NOT ACCEPTED 0 $0 1 $209,230 14 $172,117 0 $0 1 $63,200 0 $0 APPLICATIONS DENIED 5 $150,020 5 $186,200 50 $189,208 3 $63,080 2 $169,940 1 $28,920 APPLICATIONS WITHDRAWN 4 $158,815 6 $196,433 34 $194,310 1 $27,480 2 $88,970 1 $47,810 FILES CLOSED FOR INCOMPLETENESS 1 $138,190 2 $81,300 11 $181,674 1 $23,900 2 $91,750 0 $0
Aggregated Statistics For Year 2008(Based on 5 partial tracts) A) FHA, FSA/RHS & VA B) Conventional C) Refinancings D) Home Improvement Loans F) Non-occupant Loans on G) Loans On Manufactured Number Average Value Number Average Value Number Average Value Number Average Value Number Average Value Number Average Value
LOANS ORIGINATED 26 $159,684 75 $172,086 94 $157,735 9 $60,437 22 $118,213 2 $60,545 APPLICATIONS APPROVED, NOT ACCEPTED 3 $132,100 7 $179,053 16 $118,699 2 $58,710 3 $114,210 1 $62,000 APPLICATIONS DENIED 5 $136,430 11 $184,903 60 $139,022 14 $55,404 4 $121,255 2 $42,415 APPLICATIONS WITHDRAWN 5 $145,346 11 $193,254 26 $176,953 2 $44,700 4 $127,802 1 $73,330 FILES CLOSED FOR INCOMPLETENESS 1 $115,380 2 $215,020 8 $187,384 1 $9,860 1 $59,760 0 $0
Aggregated Statistics For Year 2007(Based on 5 partial tracts) A) FHA, FSA/RHS & VA B) Conventional C) Refinancings D) Home Improvement Loans E) Loans on Dwellings For 5+ Families F) Non-occupant Loans on G) Loans On Manufactured Number Average Value Number Average Value Number Average Value Number Average Value Number Average Value Number Average Value Number Average Value
LOANS ORIGINATED 9 $152,402 151 $155,135 110 $144,112 14 $49,321 2 $566,855 34 $112,088 3 $43,970 APPLICATIONS APPROVED, NOT ACCEPTED 1 $89,380 21 $151,892 32 $113,034 3 $39,733 0 $0 1 $87,340 3 $34,707 APPLICATIONS DENIED 2 $77,530 24 $164,654 75 $118,390 14 $41,439 0 $0 10 $67,374 3 $32,507 APPLICATIONS WITHDRAWN 1 $166,360 14 $145,940 38 $136,153 4 $122,088 0 $0 3 $127,567 0 $0 FILES CLOSED FOR INCOMPLETENESS 0 $0 3 $191,640 11 $164,372 1 $95,190 0 $0 1 $342,440 0 $0
Aggregated Statistics For Year 2006(Based on 5 partial tracts) A) FHA, FSA/RHS & VA B) Conventional C) Refinancings D) Home Improvement Loans F) Non-occupant Loans on G) Loans On Manufactured Number Average Value Number Average Value Number Average Value Number Average Value Number Average Value Number Average Value
LOANS ORIGINATED 8 $121,489 177 $137,198 118 $113,250 13 $43,778 39 $119,767 4 $62,742 APPLICATIONS APPROVED, NOT ACCEPTED 0 $0 21 $120,806 20 $104,262 6 $78,567 4 $94,008 1 $67,620 APPLICATIONS DENIED 0 $0 23 $145,888 82 $102,111 12 $56,477 7 $166,866 6 $37,885 APPLICATIONS WITHDRAWN 0 $0 24 $128,173 32 $121,930 2 $111,790 2 $134,125 0 $0 FILES CLOSED FOR INCOMPLETENESS 0 $0 2 $113,065 13 $140,152 0 $0 0 $0 0 $0
Aggregated Statistics For Year 2005(Based on 5 partial tracts) A) FHA, FSA/RHS & VA B) Conventional C) Refinancings D) Home Improvement Loans F) Non-occupant Loans on G) Loans On Manufactured Number Average Value Number Average Value Number Average Value Number Average Value Number Average Value Number Average Value
LOANS ORIGINATED 7 $122,613 148 $133,698 123 $109,133 11 $47,953 30 $98,840 2 $34,130 APPLICATIONS APPROVED, NOT ACCEPTED 0 $0 12 $135,756 26 $113,485 3 $40,893 1 $81,120 2 $20,075 APPLICATIONS DENIED 2 $168,765 27 $84,836 72 $105,547 13 $43,495 5 $65,308 9 $60,991 APPLICATIONS WITHDRAWN 1 $155,750 18 $106,001 41 $121,052 6 $153,225 4 $98,962 1 $95,880 FILES CLOSED FOR INCOMPLETENESS 0 $0 6 $133,873 14 $139,224 0 $0 3 $81,550 0 $0
Aggregated Statistics For Year 2004(Based on 5 partial tracts) A) FHA, FSA/RHS & VA B) Conventional C) Refinancings D) Home Improvement Loans E) Loans on Dwellings For 5+ Families F) Non-occupant Loans on G) Loans On Manufactured Number Average Value Number Average Value Number Average Value Number Average Value Number Average Value Number Average Value Number Average Value
LOANS ORIGINATED 10 $105,769 108 $131,257 152 $112,260 13 $38,493 1 $718,610 33 $77,302 2 $63,190 APPLICATIONS APPROVED, NOT ACCEPTED 0 $0 10 $90,370 21 $93,354 4 $39,882 0 $0 3 $76,267 3 $38,200 APPLICATIONS DENIED 2 $90,700 18 $108,583 76 $95,631 16 $33,026 0 $0 4 $109,152 6 $70,123 APPLICATIONS WITHDRAWN 2 $140,030 12 $148,049 37 $112,293 4 $33,268 0 $0 2 $109,880 0 $0 FILES CLOSED FOR INCOMPLETENESS 0 $0 4 $188,228 19 $111,547 1 $71,580 0 $0 0 $0 1 $65,750
Aggregated Statistics For Year 2003(Based on 5 partial tracts) A) FHA, FSA/RHS & VA B) Conventional C) Refinancings D) Home Improvement Loans F) Non-occupant Loans on Number Average Value Number Average Value Number Average Value Number Average Value Number Average Value
LOANS ORIGINATED 12 $115,177 87 $134,310 284 $117,316 9 $24,350 29 $79,030 APPLICATIONS APPROVED, NOT ACCEPTED 0 $0 7 $124,001 34 $102,974 3 $21,803 2 $61,740 APPLICATIONS DENIED 0 $0 14 $122,681 87 $99,423 14 $26,264 6 $119,368 APPLICATIONS WITHDRAWN 1 $127,280 12 $106,415 46 $105,167 1 $29,560 5 $53,778 FILES CLOSED FOR INCOMPLETENESS 0 $0 2 $175,960 12 $113,011 0 $0 0 $0
Aggregated Statistics For Year 2002(Based on 5 partial tracts) A) FHA, FSA/RHS & VA B) Conventional C) Refinancings D) Home Improvement Loans F) Non-occupant Loans on Number Average Value Number Average Value Number Average Value Number Average Value Number Average Value
LOANS ORIGINATED 23 $111,720 93 $119,466 186 $111,427 10 $27,063 22 $69,842 APPLICATIONS APPROVED, NOT ACCEPTED 0 $0 11 $107,209 29 $103,431 3 $17,517 2 $53,110 APPLICATIONS DENIED 1 $57,460 23 $65,176 69 $84,290 13 $29,569 6 $56,552 APPLICATIONS WITHDRAWN 5 $116,468 13 $116,795 31 $104,504 2 $28,085 1 $115,320 FILES CLOSED FOR INCOMPLETENESS 1 $96,470 4 $123,105 12 $109,939 0 $0 0 $0
Aggregated Statistics For Year 2001(Based on 5 partial tracts) A) FHA, FSA/RHS & VA B) Conventional C) Refinancings D) Home Improvement Loans E) Loans on Dwellings For 5+ Families F) Non-occupant Loans on Number Average Value Number Average Value Number Average Value Number Average Value Number Average Value Number Average Value
LOANS ORIGINATED 31 $100,928 81 $109,031 155 $112,975 12 $28,867 0 $0 16 $77,539 APPLICATIONS APPROVED, NOT ACCEPTED 4 $96,530 20 $54,278 20 $107,016 4 $37,408 0 $0 1 $68,450 APPLICATIONS DENIED 1 $96,870 61 $41,571 65 $76,665 14 $14,721 1 $408,600 5 $46,678 APPLICATIONS WITHDRAWN 1 $126,160 9 $172,890 28 $92,824 2 $6,530 0 $0 1 $58,510 FILES CLOSED FOR INCOMPLETENESS 2 $77,915 1 $68,100 9 $77,277 1 $27,940 0 $0 0 $0
Aggregated Statistics For Year 2000(Based on 5 partial tracts) A) FHA, FSA/RHS & VA B) Conventional C) Refinancings D) Home Improvement Loans F) Non-occupant Loans on Number Average Value Number Average Value Number Average Value Number Average Value Number Average Value
LOANS ORIGINATED 31 $95,333 98 $100,874 63 $77,821 15 $23,876 10 $56,440 APPLICATIONS APPROVED, NOT ACCEPTED 2 $47,710 24 $57,044 22 $73,140 6 $18,448 2 $25,330 APPLICATIONS DENIED 4 $75,370 61 $45,271 50 $66,441 16 $16,404 5 $67,842 APPLICATIONS WITHDRAWN 2 $48,630 6 $114,238 30 $66,600 2 $31,310 1 $32,160 FILES CLOSED FOR INCOMPLETENESS 0 $0 3 $109,413 5 $68,536 0 $0 0 $0
Aggregated Statistics For Year 1999(Based on 5 partial tracts) A) FHA, FSA/RHS & VA B) Conventional C) Refinancings D) Home Improvement Loans E) Loans on Dwellings For 5+ Families F) Non-occupant Loans on Number Average Value Number Average Value Number Average Value Number Average Value Number Average Value Number Average Value
LOANS ORIGINATED 21 $88,230 96 $89,654 120 $92,317 13 $15,116 1 $94,030 16 $47,528 APPLICATIONS APPROVED, NOT ACCEPTED 0 $0 28 $59,392 32 $78,398 4 $17,898 0 $0 7 $73,264 APPLICATIONS DENIED 2 $76,600 70 $56,527 63 $64,126 14 $19,179 0 $0 10 $47,750 APPLICATIONS WITHDRAWN 2 $111,090 8 $71,150 40 $71,035 4 $61,290 0 $0 1 $75,510 FILES CLOSED FOR INCOMPLETENESS 0 $0 3 $76,397 12 $78,690 0 $0 0 $0 1 $133,890
Detailed HMDA statistics for the following Tracts:
0312.00
, 0323.01 , 0323.02 , 0324.00
Private Mortgage Insurance Companies Aggregated Statistics For Year 2009(Based on 5 partial tracts) A) Conventional B) Refinancings Number Average Value Number Average Value
LOANS ORIGINATED 6 $175,913 6 $226,120 APPLICATIONS APPROVED, NOT ACCEPTED 1 $279,170 2 $143,195 APPLICATIONS DENIED 2 $233,050 1 $285,560 APPLICATIONS WITHDRAWN 0 $0 0 $0 FILES CLOSED FOR INCOMPLETENESS 0 $0 0 $0
Aggregated Statistics For Year 2008(Based on 5 partial tracts) A) Conventional B) Refinancings C) Non-occupant Loans on Number Average Value Number Average Value Number Average Value
LOANS ORIGINATED 33 $181,755 7 $179,693 3 $147,347 APPLICATIONS APPROVED, NOT ACCEPTED 11 $234,063 2 $159,485 0 $0 APPLICATIONS DENIED 1 $191,060 1 $125,310 1 $94,900 APPLICATIONS WITHDRAWN 2 $212,210 1 $242,970 0 $0 FILES CLOSED FOR INCOMPLETENESS 1 $183,120 0 $0 0 $0
Aggregated Statistics For Year 2007(Based on 5 partial tracts) A) Conventional B) Refinancings C) Non-occupant Loans on Number Average Value Number Average Value Number Average Value
LOANS ORIGINATED 46 $158,178 12 $152,401 8 $98,209 APPLICATIONS APPROVED, NOT ACCEPTED 6 $163,967 2 $171,945 1 $77,600 APPLICATIONS DENIED 0 $0 0 $0 0 $0 APPLICATIONS WITHDRAWN 1 $149,220 1 $115,090 0 $0 FILES CLOSED FOR INCOMPLETENESS 0 $0 0 $0 0 $0
Aggregated Statistics For Year 2006(Based on 5 partial tracts) A) Conventional B) Refinancings C) Non-occupant Loans on Number Average Value Number Average Value Number Average Value
LOANS ORIGINATED 26 $159,423 7 $181,127 2 $132,770 APPLICATIONS APPROVED, NOT ACCEPTED 4 $86,665 1 $212,560 1 $69,120 APPLICATIONS DENIED 0 $0 0 $0 0 $0 APPLICATIONS WITHDRAWN 3 $192,600 1 $257,700 0 $0 FILES CLOSED FOR INCOMPLETENESS 0 $0 0 $0 0 $0
Aggregated Statistics For Year 2005(Based on 5 partial tracts) A) Conventional B) Refinancings C) Non-occupant Loans on Number Average Value Number Average Value Number Average Value
LOANS ORIGINATED 28 $144,004 11 $128,266 3 $84,277 APPLICATIONS APPROVED, NOT ACCEPTED 2 $159,785 2 $296,150 0 $0 APPLICATIONS DENIED 0 $0 1 $102,290 0 $0 APPLICATIONS WITHDRAWN 1 $37,280 1 $103,380 1 $37,280 FILES CLOSED FOR INCOMPLETENESS 0 $0 0 $0 0 $0
Aggregated Statistics For Year 2004(Based on 5 partial tracts) A) Conventional B) Refinancings C) Non-occupant Loans on D) Loans On Manufactured Number Average Value Number Average Value Number Average Value Number Average Value
LOANS ORIGINATED 20 $115,424 13 $124,937 3 $56,807 1 $97,750 APPLICATIONS APPROVED, NOT ACCEPTED 2 $277,905 4 $144,490 0 $0 0 $0 APPLICATIONS DENIED 0 $0 0 $0 1 $45,560 0 $0 APPLICATIONS WITHDRAWN 1 $161,800 1 $58,040 0 $0 0 $0 FILES CLOSED FOR INCOMPLETENESS 0 $0 0 $0 0 $0 0 $0
Aggregated Statistics For Year 2003(Based on 5 partial tracts) A) Conventional B) Refinancings C) Non-occupant Loans on Number Average Value Number Average Value Number Average Value
LOANS ORIGINATED 22 $125,263 41 $123,391 2 $90,900 APPLICATIONS APPROVED, NOT ACCEPTED 5 $174,168 8 $142,074 0 $0 APPLICATIONS DENIED 0 $0 0 $0 0 $0 APPLICATIONS WITHDRAWN 0 $0 1 $137,130 0 $0 FILES CLOSED FOR INCOMPLETENESS 0 $0 0 $0 0 $0
Aggregated Statistics For Year 2002(Based on 5 partial tracts) A) Conventional B) Refinancings C) Non-occupant Loans on Number Average Value Number Average Value Number Average Value
LOANS ORIGINATED 38 $125,481 30 $123,193 2 $95,930 APPLICATIONS APPROVED, NOT ACCEPTED 4 $124,702 6 $133,357 1 $77,360 APPLICATIONS DENIED 1 $75,710 0 $0 0 $0 APPLICATIONS WITHDRAWN 1 $123,260 2 $177,610 0 $0 FILES CLOSED FOR INCOMPLETENESS 0 $0 0 $0 0 $0
Aggregated Statistics For Year 2001(Based on 5 partial tracts) A) Conventional B) Refinancings C) Non-occupant Loans on Number Average Value Number Average Value Number Average Value
LOANS ORIGINATED 33 $118,826 27 $132,482 1 $102,460 APPLICATIONS APPROVED, NOT ACCEPTED 5 $125,238 3 $101,027 0 $0 APPLICATIONS DENIED 1 $130,100 1 $104,370 0 $0 APPLICATIONS WITHDRAWN 0 $0 1 $244,180 0 $0 FILES CLOSED FOR INCOMPLETENESS 0 $0 0 $0 0 $0
Aggregated Statistics For Year 2000(Based on 5 partial tracts) A) Conventional B) Refinancings C) Non-occupant Loans on Number Average Value Number Average Value Number Average Value
LOANS ORIGINATED 38 $124,319 6 $88,263 1 $123,800 APPLICATIONS APPROVED, NOT ACCEPTED 2 $122,945 2 $58,605 0 $0 APPLICATIONS DENIED 1 $117,190 1 $210,250 0 $0 APPLICATIONS WITHDRAWN 0 $0 1 $87,640 0 $0 FILES CLOSED FOR INCOMPLETENESS 0 $0 0 $0 0 $0
Aggregated Statistics For Year 1999(Based on 5 partial tracts) A) Conventional B) Refinancings C) Non-occupant Loans on Number Average Value Number Average Value Number Average Value
LOANS ORIGINATED 26 $112,832 8 $108,605 1 $44,530 APPLICATIONS APPROVED, NOT ACCEPTED 1 $182,980 1 $162,010 0 $0 APPLICATIONS DENIED 0 $0 0 $0 0 $0 APPLICATIONS WITHDRAWN 0 $0 0 $0 0 $0 FILES CLOSED FOR INCOMPLETENESS 0 $0 0 $0 0 $0
Detailed PMIC statistics for the following Tracts:
0312.00
, 0323.01 , 0323.02 , 0324.00 Fire-safe hotels and motels in Belmont, North Carolina:
American Motel, 6834 E Wilkinson Blvd, Belmont, North Carolina 28012 Phone: (704) 825-3753
Holiday Inn Express Hotel & Suites Belmont-Mt. Hol, 250 Beatty Dr, Belmont, North Carolina 28012 Phone: (704) 812-2000, Fax: (704) 812-2001
Hampton Inn Belmont @ Montcross, 820 Cecilia Alexander Dr, Belmont, North Carolina 28012 Phone: (704) 825-6100, Fax: (704) 825-6108
All 3 fire-safe hotels and motels in Belmont, North Carolina
Most common first names in Belmont, NC among deceased individuals Name Count Lived (average)
Mary 171 78.5 years James 168 70.8 years John 142 72.4 years William 130 72.6 years Robert 113 73.1 years Charles 57 64.5 years George 51 73.0 years Margaret 48 79.8 years Ruth 40 78.7 years Thomas 40 69.5 years
Most common last names in Belmont, NC among deceased individuals Last name Count Lived (average)
Smith 83 73.7 years Wilson 50 76.5 years Brown 49 74.9 years Johnson 40 71.6 years Stowe 38 73.2 years Davis 38 73.6 years Armstrong 37 77.1 years Williams 37 67.2 years Helms 31 73.6 years Miller 29 73.2 years
Belmont compared to North Carolina state average:
Black race population percentage below state average. Hispanic race population percentage below state average. Median age significantly below state average. Percentage of population with a bachelor's degree or higher above state average.
#85 on the list of "Top 101 cities with the largest percentage of people in schools, hospitals, or wards for the mentally retarded (population 1,000+)"
#55 (28012) on the list of "Top 101 zip codes with the largest percentage of Scotch-Irish first ancestries (pop 5,000+)"
#14 on the list of "Top 101 counties with the worst general health status score of residents (1-5), 3 years of data"
#24 on the list of "Top 101 counties with the lowest percentage of residents that drank alcohol in the past 30 days"
#33 on the list of "Top 101 counties with the lowest percentage of residents relocating from foreign countries between 2010 and 2011"
#42 on the list of "Top 101 counties with the highest percentage of residents that keep firearms around their homes"
#46 on the list of "Top 101 counties with the lowest percentage of residents that visited a dentist within the past year"
Top Patent Applicants
Yangxing Li (8)
Marc Evan Richelsoph (4)
Glenn A. Rupp (4)
Douglas Johnson (4)
Maria Curran (4)
Timothy Alan Mincey (3)
Marc E. Richelsoph (3)
Susan Packer Nelson (3)
James Bowen (2)
Ellis J. Smith (2)
Total of 98 patent applications in 2008-2024.

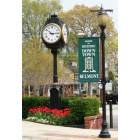

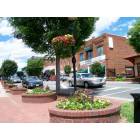

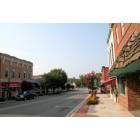
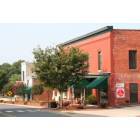
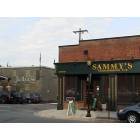

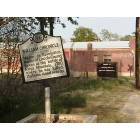

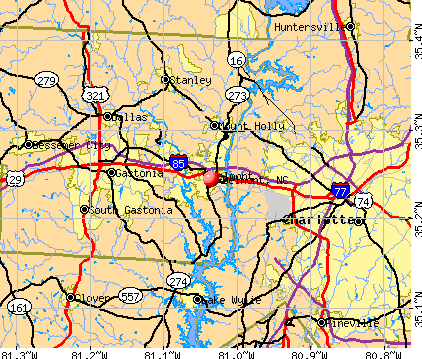


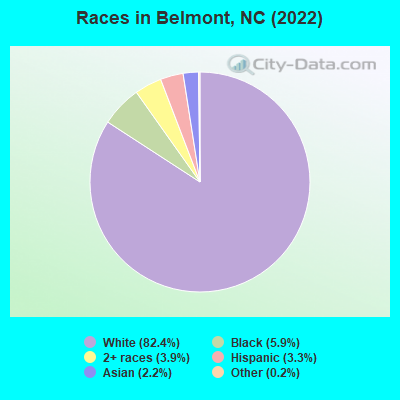
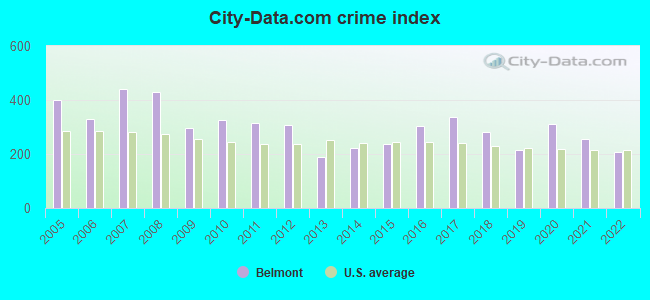
 Recent articles from our blog. Our writers, many of them Ph.D. graduates or candidates, create easy-to-read articles on a wide variety of topics.

 (8.2 miles
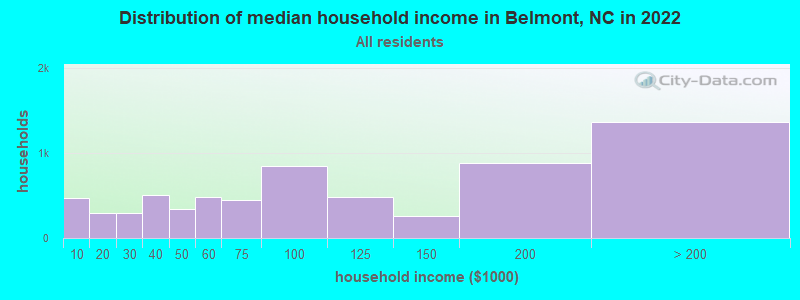
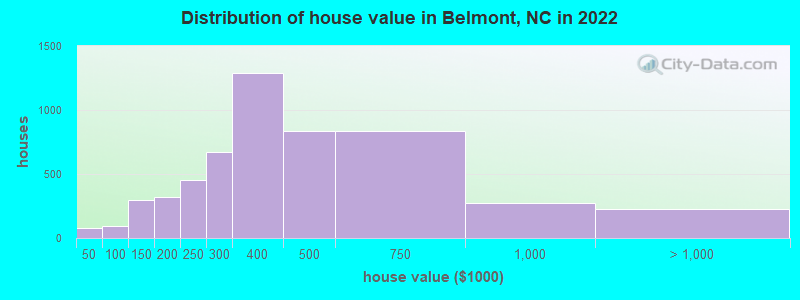

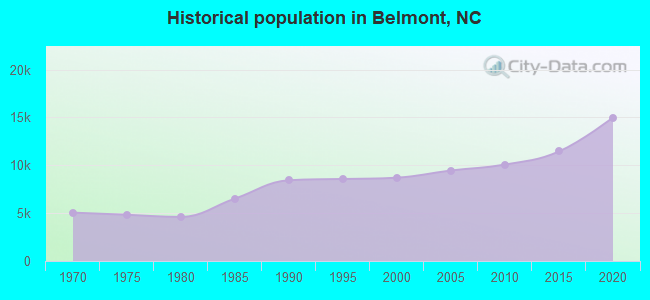
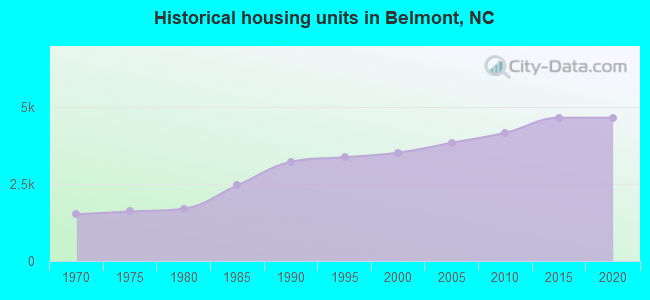
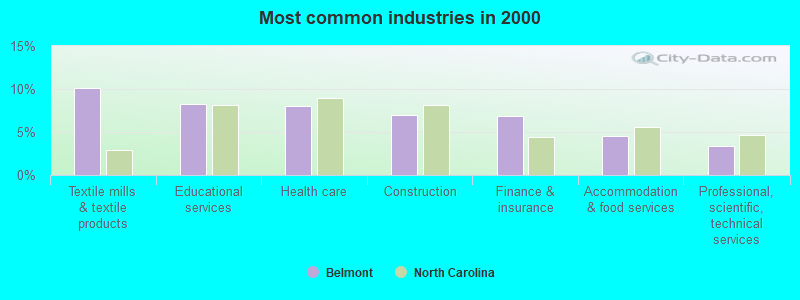
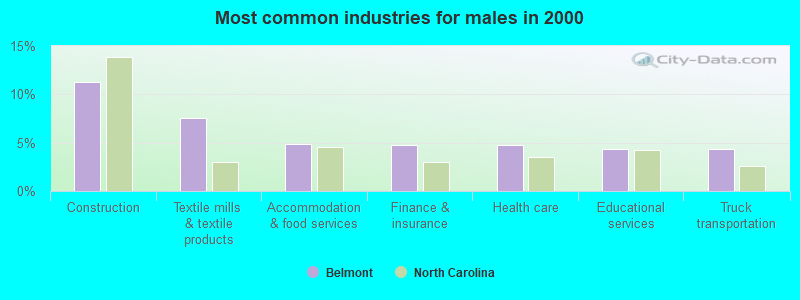
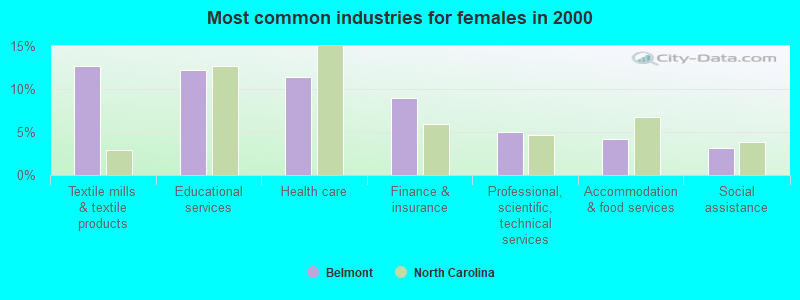
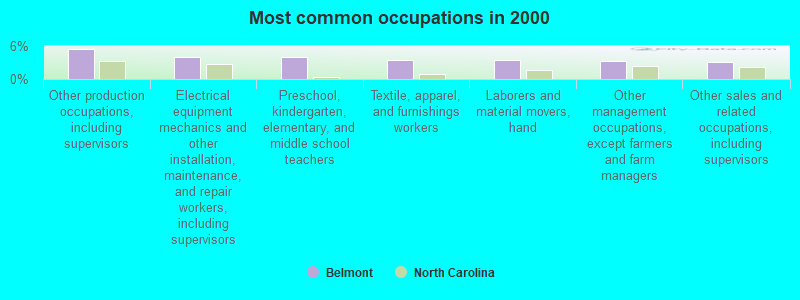
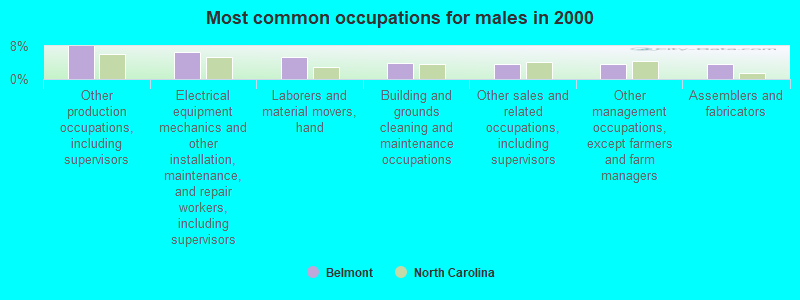
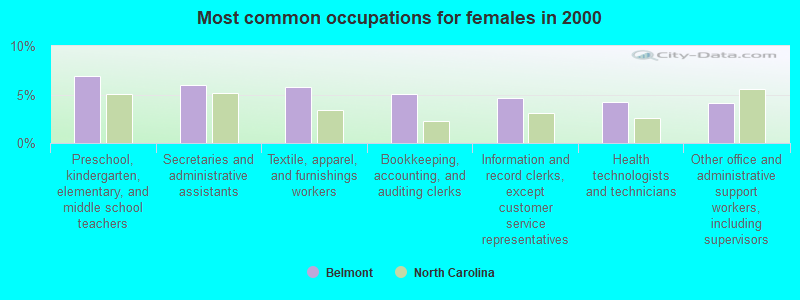


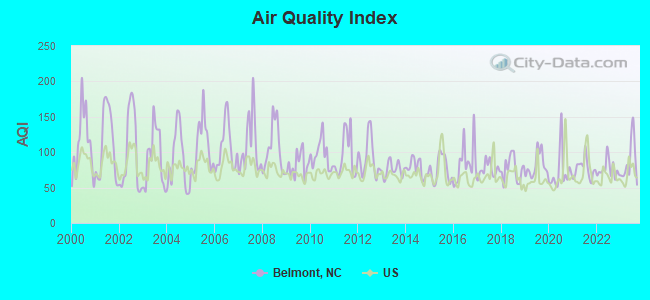
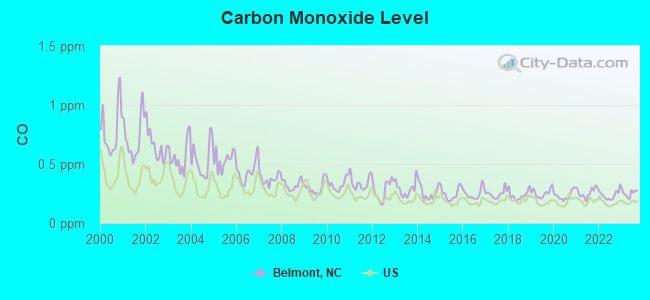
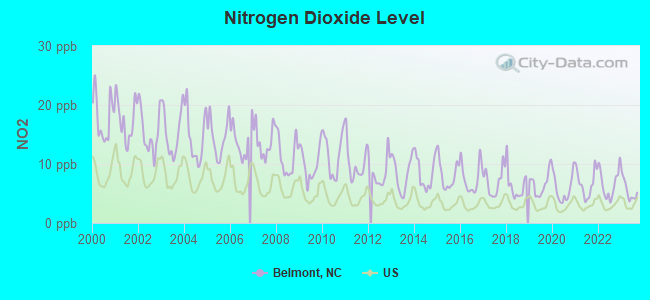
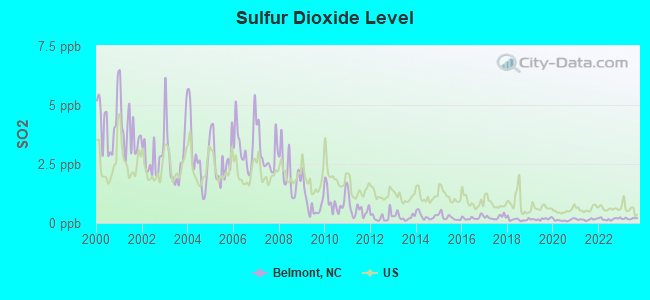
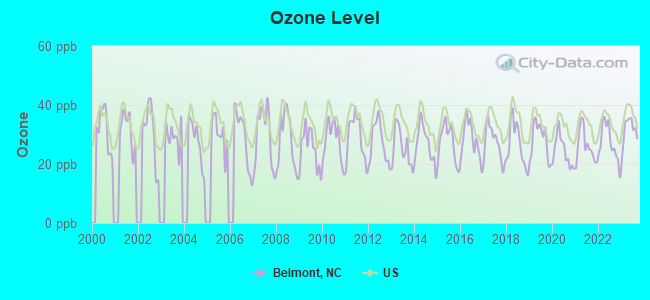
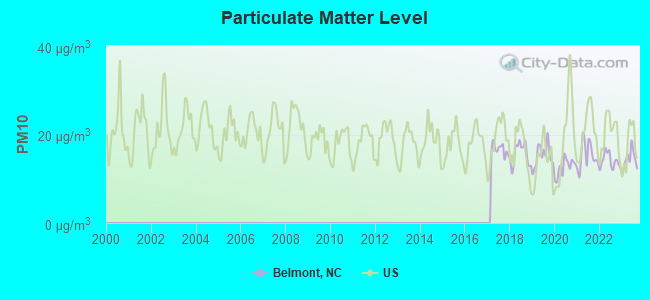
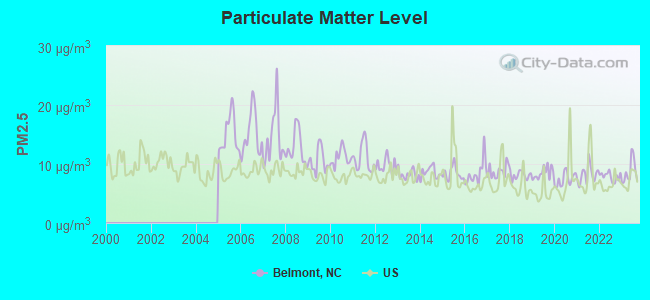
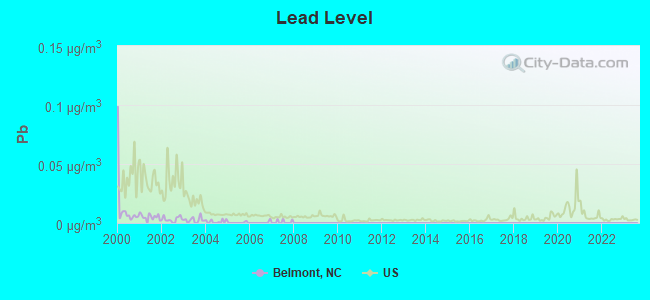

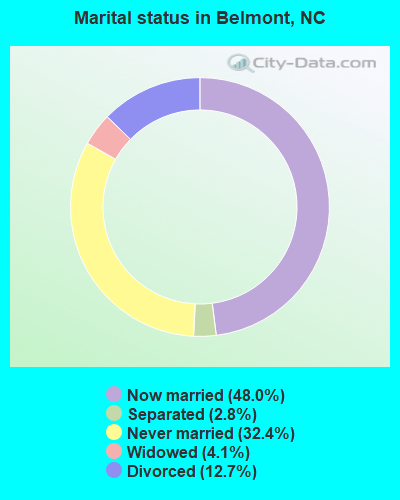
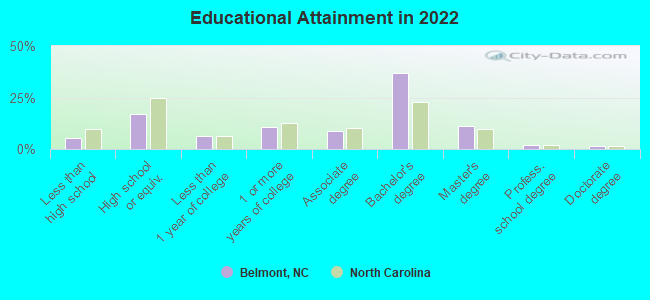
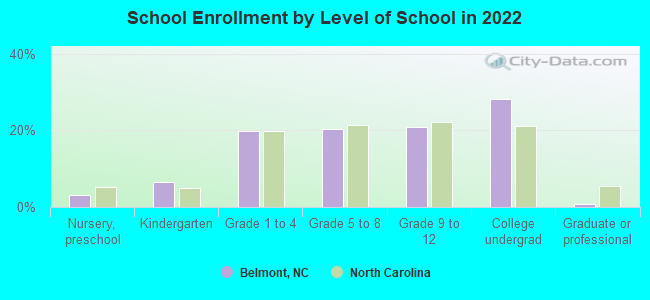
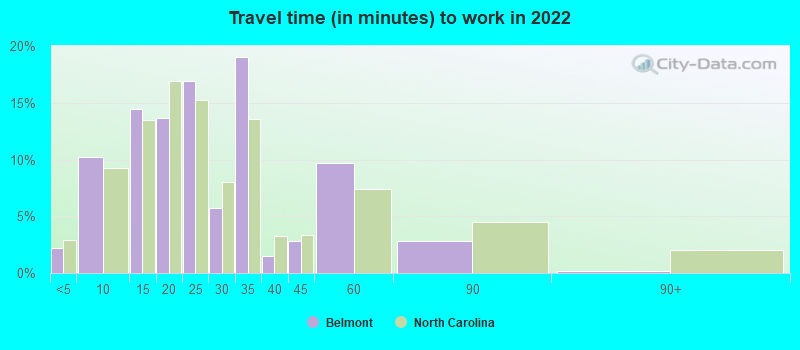
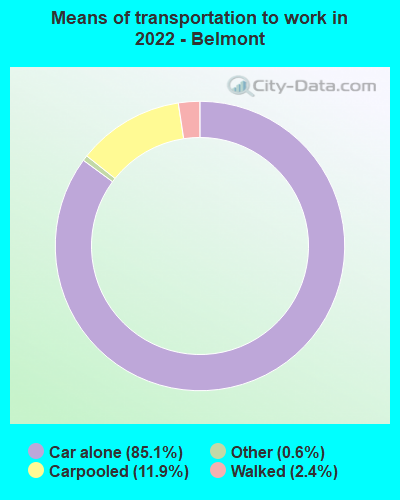
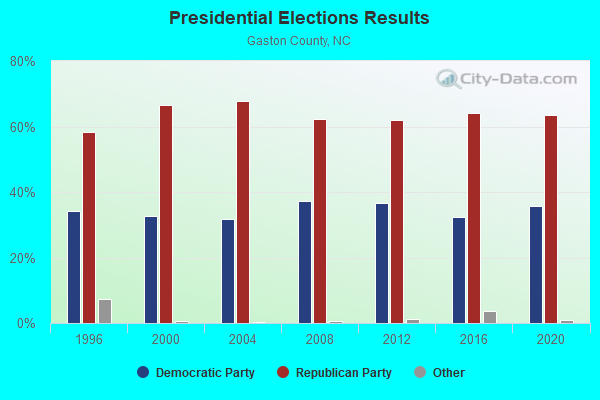
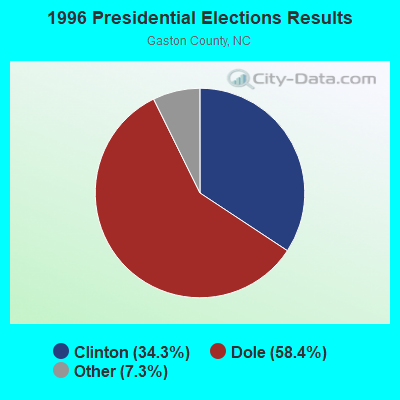
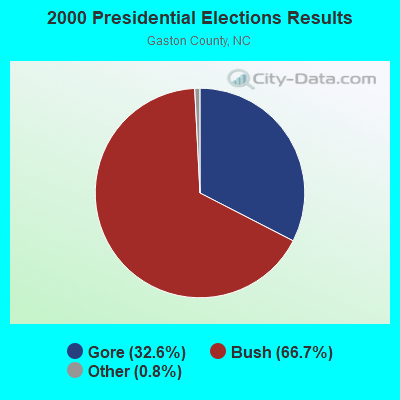

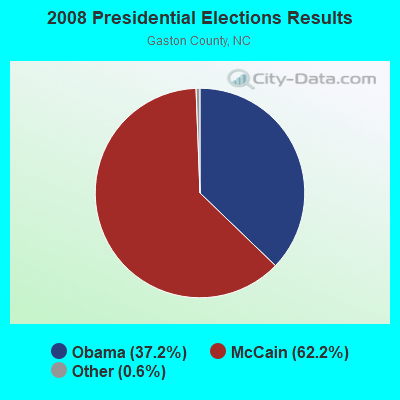
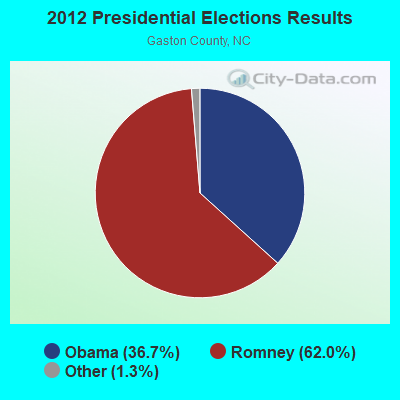
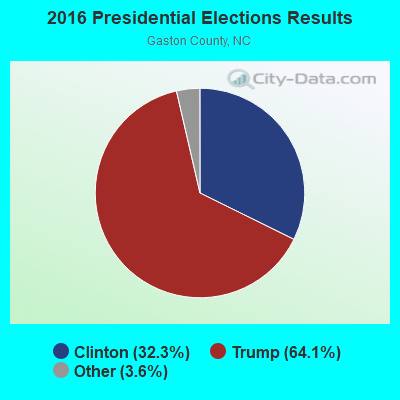
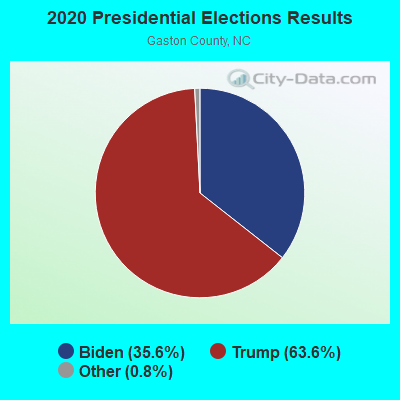
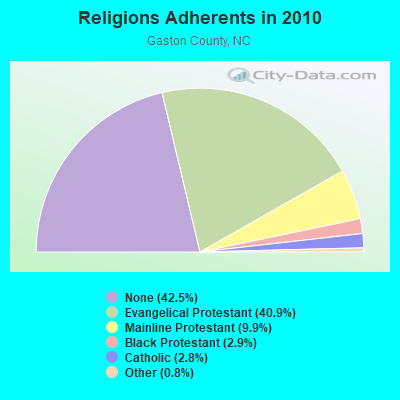
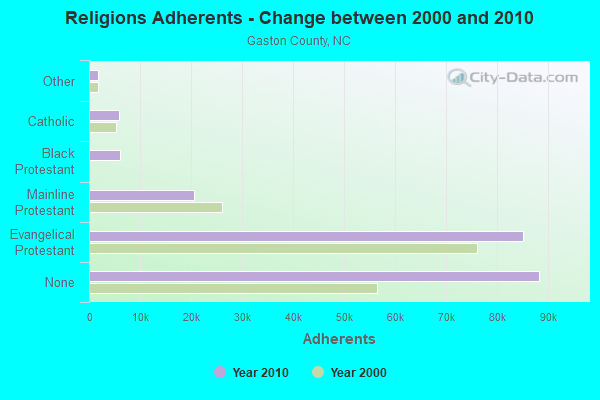
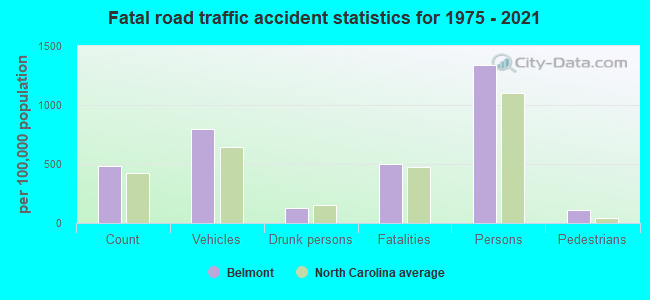
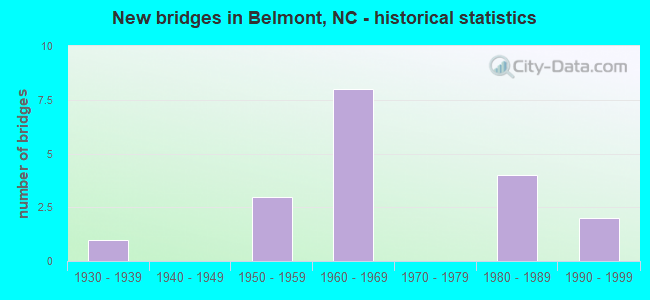
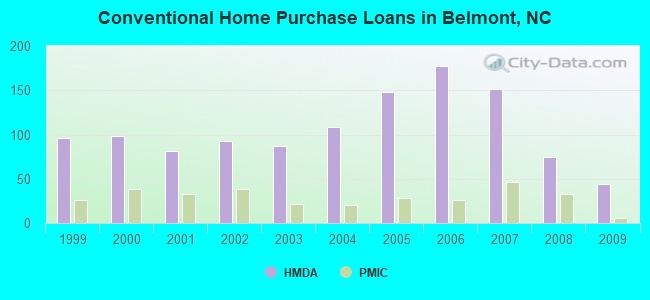
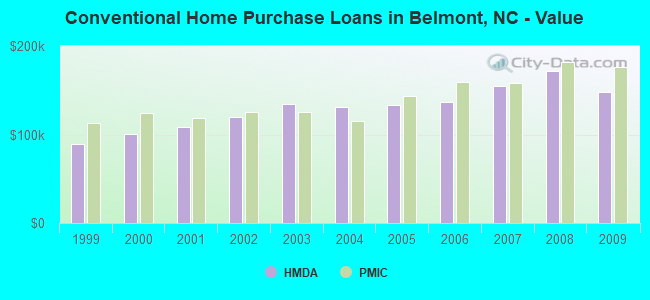
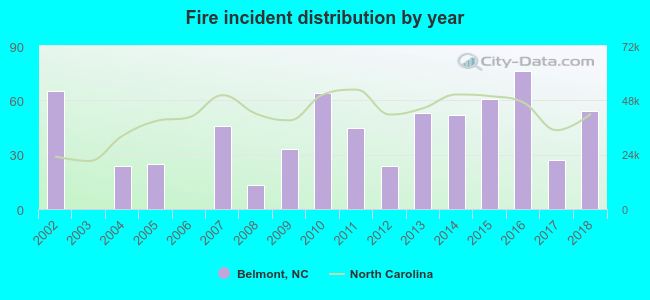 Based on the data from the years 2002 - 2018 the average number of fire incidents per year is 39. The highest number of reported fires - 76 took place in 2016, and the least - 0 in 2003. The data has a decreasing trend.
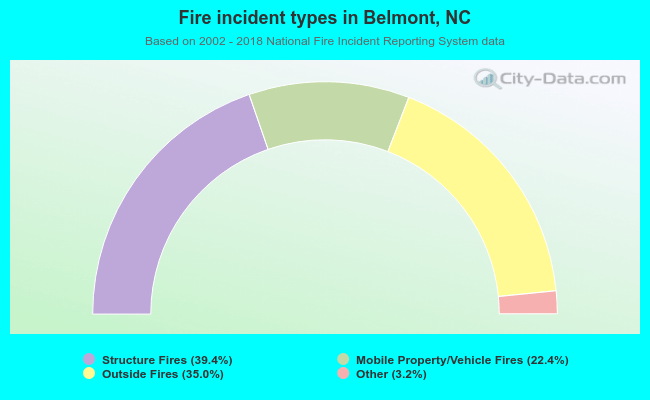 When looking into fire subcategories, the most incidents belonged to: Structure Fires (39.4%), and Outside Fires (35.0%).