Bennington, New Hampshire
Submit your own pictures of this town and show them to the world
- OSM Map
- General Map
- Google Map
- MSN Map
Population change since 2000: +5.4%
 |
| Males: 764 | |
| Females: 712 |
| Median resident age: | 38.3 years |
| New Hampshire median age: | 43.9 years |
Zip codes: 03442.
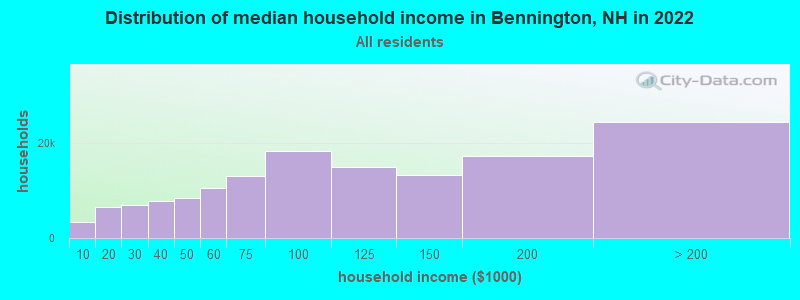
| Bennington: | $83,787 |
| NH: | $89,992 |
Estimated per capita income in 2022: $39,238 (it was $19,675 in 2000)
Bennington town income, earnings, and wages data
Estimated median house or condo value in 2022: $294,122 (it was $97,800 in 2000)
| Bennington: | $294,122 |
| NH: | $384,700 |
Mean prices in 2022: all housing units: $411,252; detached houses: $441,251; townhouses or other attached units: $283,002; in 2-unit structures: $347,377; in 3-to-4-unit structures: $666,663; in 5-or-more-unit structures: $275,798; mobile homes: $132,093
Detailed information about poverty and poor residents in Bennington, NH
Compare current foreclosures near Bennington, NH:
| Photo | Address | Area | Beds / Baths | Price | Details |
|---|---|---|---|---|---|

|
#1
Francestown Rd
Bennington, NH 03442
|
- sq. feet
|
1 baths 2 beds |
show details | |

|
#2
School St Ste 211
Bennington, NH 03442
|
- sq. feet
|
- baths - beds |
show details | |

|
#3
Etta Ln
Weare, NH 03281
|
1,428 sq. feet
|
2 baths 2 beds |
show details | |

|
#4
Forest St
Bradford, NH 03221
|
1,009 sq. feet
|
1 baths 2 beds |
show details | |

|
#5
Weston Hill Rd
Mont Vernon, NH 03057
|
960 sq. feet
|
1 baths 2 beds |
show details | |

|
#6
Church St
Hillsboro, NH 03244
|
2,098 sq. feet
|
1 baths 4 beds |
show details | |

|
#7
Old New Ipswich Rd
Rindge, NH 03461
|
1,184 sq. feet
|
2 baths 3 beds |
show details | |

|
#8
South Rd
Sullivan, NH 03445
|
- sq. feet
|
1 baths 3 beds |
show details | |

|
#9
Forest St
Bradford, NH 03221
|
1,152 sq. feet
|
1 baths 3 beds |
show details | |

|
#10
Church St
Goffstown, NH 03045
|
2,444 sq. feet
|
2 baths 4 beds |
show details |
| Photo | Address | Area | Beds / Baths | Price | Details |
|---|---|---|---|---|---|

|
#11
Cypress Rd
Milford, NH 03055
|
1,929 sq. feet
|
1 baths 3 beds |
show details | |

|
#12
Whitney Rd
Hillsboro, NH 03244
|
- sq. feet
|
2 baths 3 beds |
show details | |

|
#13
Lakeview Dr
Weare, NH 03281
|
- sq. feet
|
2 baths 3 beds |
show details | |

|
#14
Melody Ln
Hillsboro, NH 03244
|
- sq. feet
|
1 baths 2 beds |
show details | |

|
#15
Holly Hill Farm Rd
Weare, NH 03281
|
- sq. feet
|
2 baths 3 beds |
show details | |

|
#16
Hemlock St
Hillsboro, NH 03244
|
- sq. feet
|
2 baths 4 beds |
show details | |

|
#17
Blake Rd # A
Weare, NH 03281
|
- sq. feet
|
1 baths 3 beds |
show details | |

|
#18
Mill St
New Boston, NH 03070
|
- sq. feet
|
3 baths 4 beds |
show details | |

|
#19
Curtis Farm Rd
Wilton, NH 03086
|
- sq. feet
|
1 baths 3 beds |
show details | |

|
#20
Deering Center Rd
Hillsboro, NH 03244
|
- sq. feet
|
- baths - beds |
show details |
| Photo | Address | Area | Beds / Baths | Price | Details |
|---|---|---|---|---|---|

|
#21
Childs Way
Hillsboro, NH 03244
|
- sq. feet
|
- baths - beds |
show details | |

|
#22
Chestnut Hill Rd Apt 5
New Boston, NH 03070
|
- sq. feet
|
- baths - beds |
show details | |

|
#23
Hubbard Rd
Sullivan, NH 03445
|
- sq. feet
|
- baths - beds |
show details | |

|
#24
County Rd
Bradford, NH 03221
|
- sq. feet
|
- baths - beds |
show details | |

|
#25
Weston Hill Rd
Mont Vernon, NH 03057
|
- sq. feet
|
- baths - beds |
show details | |

|
#26
Depot St Apt 3
Hillsboro, NH 03244
|
- sq. feet
|
- baths - beds |
show details | |

|
#27
Tigola Trl
Stoddard, NH 03464
|
- sq. feet
|
- baths - beds |
show details | |

|
#28
Ski Tow Rd
Weare, NH 03281
|
- sq. feet
|
- baths - beds |
show details | |

|
#29
N Main St
Mont Vernon, NH 03057
|
- sq. feet
|
- baths - beds |
show details | |

|
#30
Twin Bridge Rd
Weare, NH 03281
|
- sq. feet
|
- baths - beds |
show details |
| Photo | Address | Area | Beds / Baths | Price | Details |
|---|---|---|---|---|---|

|
#31
Seminole Rd
Hillsboro, NH 03244
|
- sq. feet
|
- baths - beds |
show details | |

|
#32
Longview Rd
Hancock, NH 03449
|
- sq. feet
|
- baths - beds |
show details | |

|
#33
Jaffrey Rd
Marlborough, NH 03455
|
- sq. feet
|
- baths - beds |
show details | |

|
#34
W Ridge Cir
Contoocook, NH 03229
|
- sq. feet
|
- baths - beds |
show details | |

|
#35
Masquanipi Dr
Antrim, NH 03440
|
- sq. feet
|
- baths - beds |
show details | |

|
#36
Pierce Lake Rd
Antrim, NH 03440
|
- sq. feet
|
- baths - beds |
show details | |

|
#37
Main St
Marlborough, NH 03455
|
- sq. feet
|
- baths - beds |
show details | |

|
#38
Old Sharon Rd
Peterborough, NH 03458
|
- sq. feet
|
- baths - beds |
show details | |

|
#39
Granite Lake Rd
Nelson, NH 03457
|
- sq. feet
|
- baths - beds |
show details | |

|
#40
Spring Hill Rd
Mont Vernon, NH 03057
|
- sq. feet
|
- baths - beds |
show details |
| Photo | Address | Area | Beds / Baths | Price | Details |
|---|---|---|---|---|---|

|
#41
Old Amherst Rd
Mont Vernon, NH 03057
|
- sq. feet
|
- baths - beds |
show details | |

|
#42
Murdough Hill Rd
Nelson, NH 03457
|
- sq. feet
|
- baths - beds |
show details | |

|
#43
Church St
Hillsboro, NH 03244
|
- sq. feet
|
- baths - beds |
show details | |

|
#44
Kullgren Rd
Temple, NH 03084
|
- sq. feet
|
- baths - beds |
show details | |

|
#45
Ayers Pond Rd
Washington, NH 03280
|
- sq. feet
|
- baths - beds |
show details | |

|
Check over 1 million property listings on Foreclosure.com!
|
browse all offers | |||


- 1,42896.7%White alone
- 161.1%Two or more races
- 130.9%Hispanic
- 90.6%Asian alone
- 50.3%Black alone
- 40.3%Other race alone
- 10.07%American Indian alone
Races in Bennington detailed stats: ancestries, foreign born residents, place of birth
Type |
2009 |
2010 |
2011 |
2012 |
2013 |
2014 |
2015 |
2016 |
2017 |
2018 |
2019 |
2020 |
2021 |
2022 |
|---|---|---|---|---|---|---|---|---|---|---|---|---|---|---|
| Murders (per 100,000) | 0 (0.0) | 0 (0.0) | 0 (0.0) | 0 (0.0) | 0 (0.0) | 0 (0.0) | 0 (0.0) | 0 (0.0) | 0 (0.0) | 0 (0.0) | 0 (0.0) | 0 (0.0) | 0 (0.0) | 0 (0.0) |
| Rapes (per 100,000) | 1 (68.0) | 0 (0.0) | 1 (67.7) | 0 (0.0) | 1 (68.2) | 6 (408.4) | 0 (0.0) | 1 (68.0) | 2 (134.7) | 3 (202.3) | 1 (66.1) | 1 (65.9) | 1 (65.8) | 1 (66.4) |
| Robberies (per 100,000) | 0 (0.0) | 0 (0.0) | 0 (0.0) | 0 (0.0) | 0 (0.0) | 4 (272.3) | 0 (0.0) | 0 (0.0) | 0 (0.0) | 2 (134.9) | 0 (0.0) | 0 (0.0) | 0 (0.0) | 0 (0.0) |
| Assaults (per 100,000) | 1 (68.0) | 2 (135.5) | 0 (0.0) | 1 (67.5) | 1 (68.2) | 1 (68.1) | 4 (271.2) | 1 (68.0) | 3 (202.0) | 2 (134.9) | 0 (0.0) | 0 (0.0) | 2 (131.6) | 1 (66.4) |
| Burglaries (per 100,000) | 2 (136.1) | 0 (0.0) | 5 (338.3) | 19 (1,282) | 7 (477.5) | 10 (680.7) | 5 (339.0) | 1 (68.0) | 1 (67.3) | 2 (134.9) | 0 (0.0) | 0 (0.0) | 1 (65.8) | 2 (132.8) |
| Thefts (per 100,000) | 31 (2,109) | 35 (2,371) | 63 (4,263) | 44 (2,969) | 35 (2,387) | 24 (1,634) | 16 (1,085) | 13 (883.8) | 8 (538.7) | 9 (606.9) | 4 (264.6) | 2 (131.8) | 3 (197.4) | 7 (464.8) |
| Auto thefts (per 100,000) | 3 (204.1) | 2 (135.5) | 2 (135.3) | 3 (202.4) | 8 (545.7) | 0 (0.0) | 3 (203.4) | 1 (68.0) | 1 (67.3) | 1 (67.4) | 1 (66.1) | 2 (131.8) | 0 (0.0) | 1 (66.4) |
| Arson (per 100,000) | 0 (0.0) | 0 (0.0) | 0 (0.0) | 5 (337.4) | 0 (0.0) | 1 (68.1) | 0 (0.0) | 0 (0.0) | 0 (0.0) | 0 (0.0) | 1 (66.1) | 0 (0.0) | 0 (0.0) | 0 (0.0) |
| City-Data.com crime index | 178.2 | 132.8 | 259.1 | 238.2 | 240.8 | 535.1 | 137.6 | 113.5 | 179.8 | 268.4 | 68.8 | 68.5 | 91.4 | 99.6 |
The City-Data.com crime index weighs serious crimes and violent crimes more heavily. Higher means more crime, U.S. average is 246.1. It adjusts for the number of visitors and daily workers commuting into cities.
Crime rate in Bennington detailed stats: murders, rapes, robberies, assaults, burglaries, thefts, arson
Full-time law enforcement employees in 2021, including police officers: 2 (2 officers - 2 male; 0 female).
| Officers per 1,000 residents here: | 1.32 |
| New Hampshire average: | 2.14 |
 Recent articles from our blog. Our writers, many of them Ph.D. graduates or candidates, create easy-to-read articles on a wide variety of topics.

 | Driving through New Hampshire (6 replies) |
| Vehicle noise in New Hampshire out of control (47 replies) |
| Good spots in NH for summer vacation. (21 replies) |
| Looking at Southern NH...Where would you recommend searching? (15 replies) |
| Looking for info on Bennington (6 replies) |
| BBQ review Barrington NH (14 replies) |
Latest news from Bennington, NH collected exclusively by city-data.com from local newspapers, TV, and radio stations
Ancestries: Irish (18.8%), English (16.6%), French (13.4%), French Canadian (10.5%), Italian (7.7%), United States (7.4%).
Current Local Time: EST time zone
Incorporated in 1842
Elevation: 686 feet
Land area: 11.1 square miles.
Population density: 133 people per square mile (very low).
22 residents are foreign born
| This town: | 1.6% |
| New Hampshire: | 4.4% |
| Bennington town: | 2.8% ($2,726) |
| New Hampshire: | 2.3% ($2,946) |
Nearest city with pop. 50,000+: Manchester, NH  (23.6 miles , pop. 107,006).
Nearest city with pop. 200,000+: Boston, MA (63.3 miles , pop. 589,141).
Nearest city with pop. 1,000,000+: Bronx, NY (180.1 miles , pop. 1,332,650).
Nearest cities:
), ), Latitude: 43.01 N, Longitude: 71.92 W
Area code commonly used in this area: 603

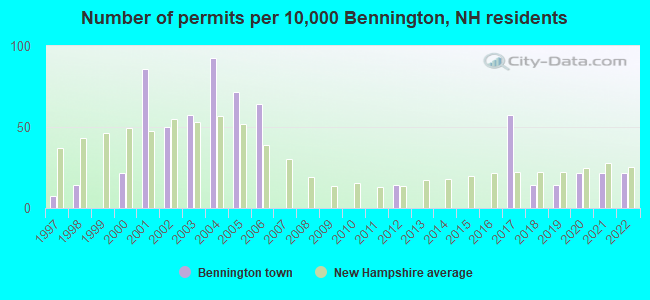
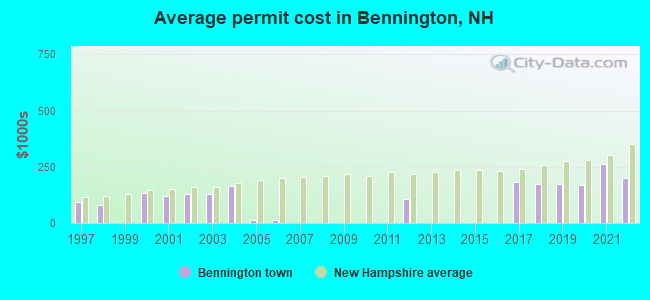
Single-family new house construction building permits:
- 2022: 3 buildings, average cost: $200,000
- 2021: 3 buildings, average cost: $262,500
- 2020: 3 buildings, average cost: $170,000
- 2019: 2 buildings, average cost: $175,000
- 2018: 2 buildings, average cost: $175,000
- 2017: 8 buildings, average cost: $181,300
- 2012: 2 buildings, average cost: $105,000
- 2006: 9 buildings, average cost: $12,000
- 2005: 10 buildings, average cost: $12,000
- 2004: 13 buildings, average cost: $163,600
- 2003: 8 buildings, average cost: $130,700
- 2002: 7 buildings, average cost: $130,700
- 2001: 12 buildings, average cost: $120,800
- 2000: 3 buildings, average cost: $133,300
- 1998: 2 buildings, average cost: $80,000
- 1997: 1 building, cost: $91,700
| Here: | 2.1% |
| New Hampshire: | 2.5% |
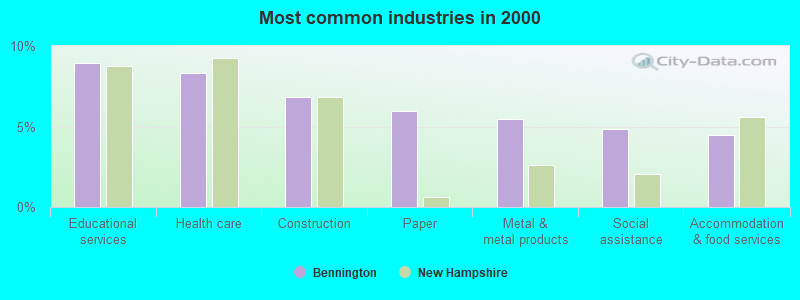
- Educational services (9.0%)
- Health care (8.3%)
- Construction (6.8%)
- Paper (6.0%)
- Metal & metal products (5.5%)
- Social assistance (4.9%)
- Accommodation & food services (4.5%)
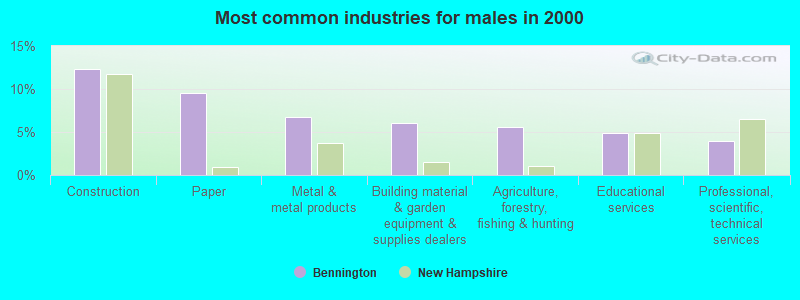
- Construction (12.3%)
- Paper (9.5%)
- Metal & metal products (6.7%)
- Building material & garden equipment & supplies dealers (6.0%)
- Agriculture, forestry, fishing & hunting (5.6%)
- Educational services (4.9%)
- Professional, scientific, technical services (3.9%)
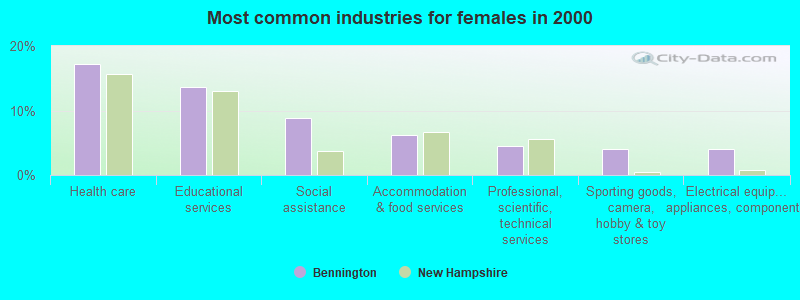
- Health care (17.2%)
- Educational services (13.7%)
- Social assistance (8.9%)
- Accommodation & food services (6.2%)
- Professional, scientific, technical services (4.6%)
- Sporting goods, camera, hobby & toy stores (4.0%)
- Electrical equipment, appliances, components (4.0%)
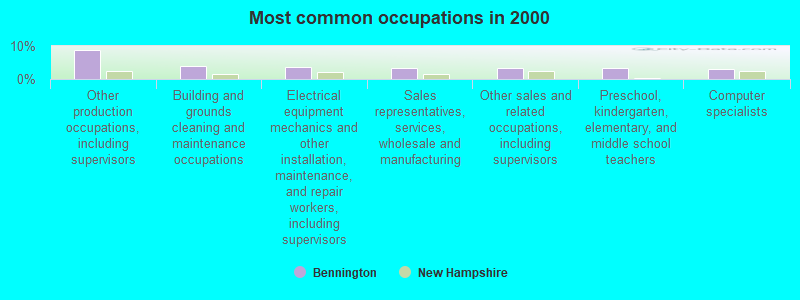
- Other production occupations, including supervisors (8.7%)
- Building and grounds cleaning and maintenance occupations (4.0%)
- Electrical equipment mechanics and other installation, maintenance, and repair workers, including supervisors (3.7%)
- Sales representatives, services, wholesale and manufacturing (3.5%)
- Other sales and related occupations, including supervisors (3.5%)
- Preschool, kindergarten, elementary, and middle school teachers (3.4%)
- Computer specialists (3.0%)
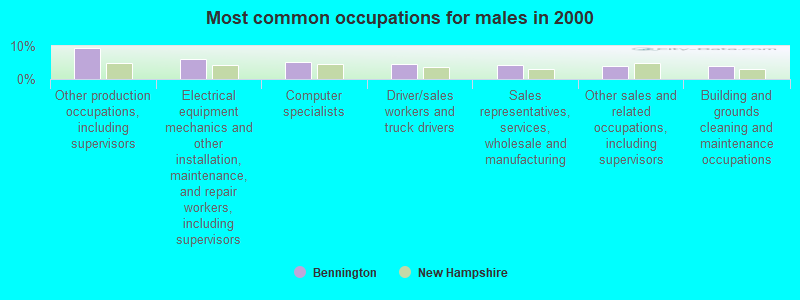
- Other production occupations, including supervisors (9.5%)
- Electrical equipment mechanics and other installation, maintenance, and repair workers, including supervisors (6.0%)
- Computer specialists (5.1%)
- Driver/sales workers and truck drivers (4.4%)
- Sales representatives, services, wholesale and manufacturing (4.2%)
- Other sales and related occupations, including supervisors (3.9%)
- Building and grounds cleaning and maintenance occupations (3.9%)
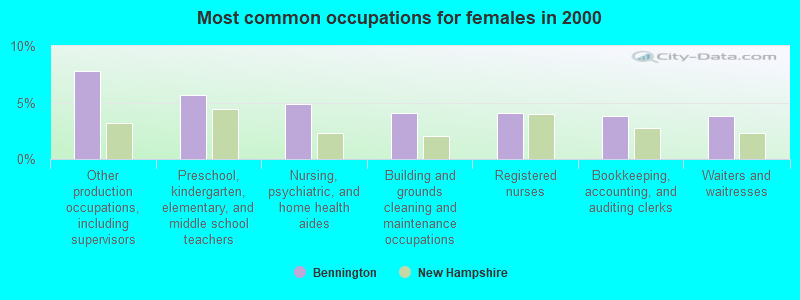
- Other production occupations, including supervisors (7.8%)
- Preschool, kindergarten, elementary, and middle school teachers (5.6%)
- Nursing, psychiatric, and home health aides (4.8%)
- Building and grounds cleaning and maintenance occupations (4.0%)
- Registered nurses (4.0%)
- Bookkeeping, accounting, and auditing clerks (3.8%)
- Waiters and waitresses (3.8%)
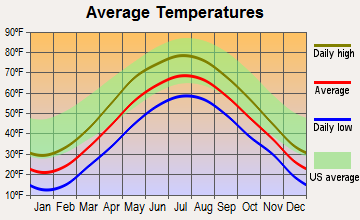
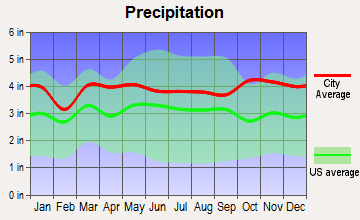
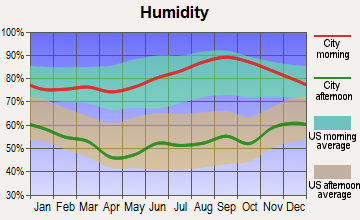
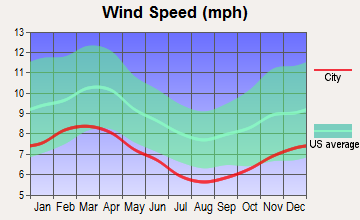
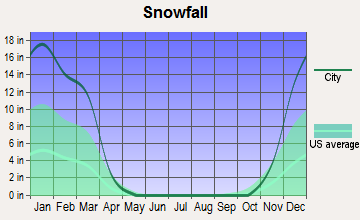
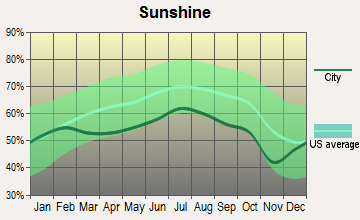
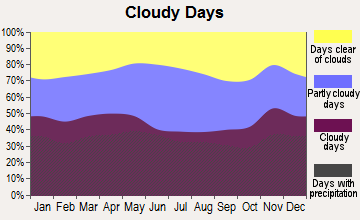
Average climate in Bennington, New Hampshire
Based on data reported by over 4,000 weather stations
(lower is better)
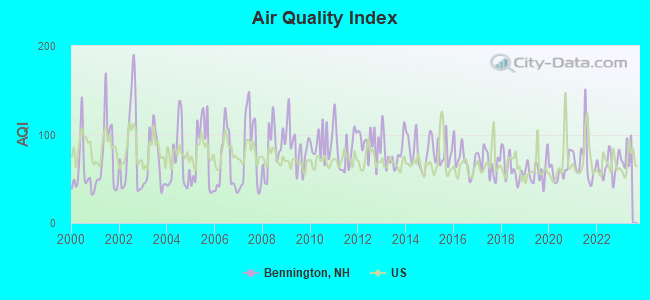
Air Quality Index (AQI) level in 2022 was 64.4. This is about average.
| City: | 64.4 |
| U.S.: | 72.6 |
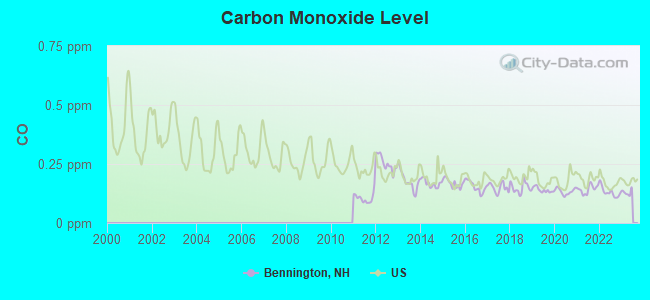
Carbon Monoxide (CO) [ppm] level in 2022 was 0.131. This is significantly better than average. Closest monitor was 7.4 miles away from the city center.
| City: | 0.131 |
| U.S.: | 0.251 |
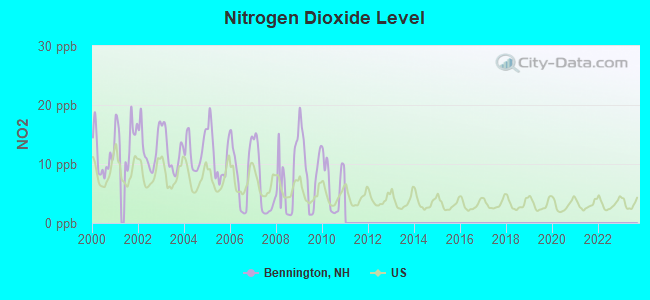
Nitrogen Dioxide (NO2) [ppb] level in 2010 was 6.49. This is worse than average. Closest monitor was 10.1 miles away from the city center.
| City: | 6.49 |
| U.S.: | 5.11 |
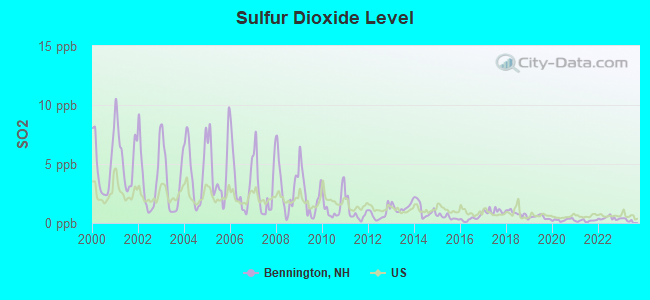
Sulfur Dioxide (SO2) [ppb] level in 2022 was 0.411. This is significantly better than average. Closest monitor was 7.4 miles away from the city center.
| City: | 0.411 |
| U.S.: | 1.515 |
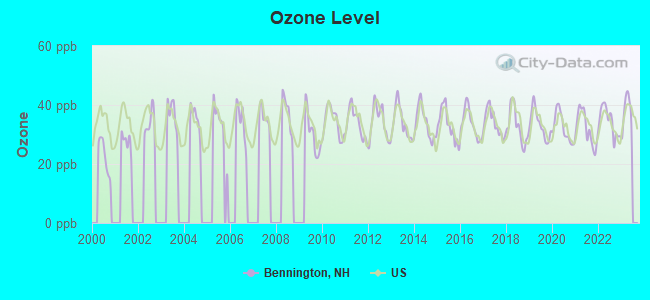
Ozone [ppb] level in 2022 was 34.4. This is about average. Closest monitor was 10.1 miles away from the city center.
| City: | 34.4 |
| U.S.: | 33.3 |
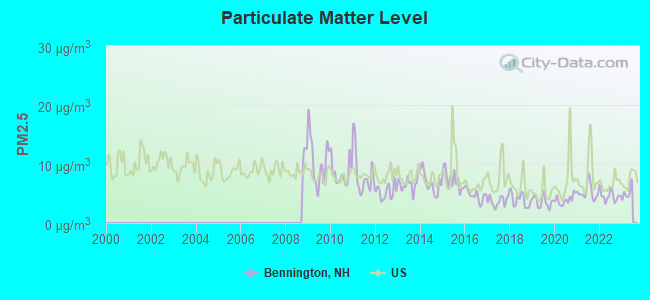
Particulate Matter (PM2.5) [µg/m3] level in 2022 was 4.59. This is significantly better than average. Closest monitor was 10.1 miles away from the city center.
| City: | 4.59 |
| U.S.: | 8.11 |
Tornado activity:
Bennington-area historical tornado activity is above New Hampshire state average. It is 31% smaller than the overall U.S. average.
On 6/9/1953, a category F4 (max. wind speeds 207-260 mph) tornado 39.2 miles away from the Bennington town center killed 90 people and injured 1228 people and caused between $50,000,000 and $500,000,000 in damages.
On 6/22/1981, a category F3 (max. wind speeds 158-206 mph) tornado 31.5 miles away from the town center injured 3 people and caused between $5000 and $50,000 in damages.
Earthquake activity:
Bennington-area historical earthquake activity is significantly above New Hampshire state average. It is 71% smaller than the overall U.S. average.On 4/20/2002 at 10:50:47, a magnitude 5.3 (5.3 ML, Depth: 3.0 mi, Class: Moderate, Intensity: VI - VII) earthquake occurred 137.0 miles away from the city center
On 10/7/1983 at 10:18:46, a magnitude 5.3 (5.1 MB, 5.3 LG, 5.1 ML) earthquake occurred 138.3 miles away from Bennington center
On 4/20/2002 at 10:50:47, a magnitude 5.2 (5.2 MB, 4.2 MS, 5.2 MW, 5.0 MW) earthquake occurred 136.4 miles away from the city center
On 1/19/1982 at 00:14:42, a magnitude 4.7 (4.5 MB, 4.7 MD, 4.5 LG, Class: Light, Intensity: IV - V) earthquake occurred 37.7 miles away from the city center
On 10/16/2012 at 23:12:25, a magnitude 4.7 (4.7 ML, Depth: 10.0 mi) earthquake occurred 75.5 miles away from Bennington center
On 10/2/1994 at 11:27:22, a magnitude 3.7 (3.5 LG, 3.7 LG, Depth: 6.2 mi, Class: Light, Intensity: II - III) earthquake occurred 49.1 miles away from the city center
Magnitude types: regional Lg-wave magnitude (LG), body-wave magnitude (MB), duration magnitude (MD), local magnitude (ML), surface-wave magnitude (MS), moment magnitude (MW)
Natural disasters:
The number of natural disasters in Hillsborough County (27) is a lot greater than the US average (15).Major Disasters (Presidential) Declared: 17
Emergencies Declared: 10
Causes of natural disasters: Storms: 13, Floods: 11, Winter Storms: 5, Snowstorms: 4, Hurricanes: 3, Snows: 3, Blizzard: 1, Ice Storm: 1, Snowfall: 1, Wind: 1 (Note: some incidents may be assigned to more than one category).
Hospitals and medical centers near Bennington:
Colleges/universities with over 2000 students nearest to Bennington:
- Franklin Pierce University (about 18 miles; Rindge, NH; Full-time enrollment: 2,139)
- Keene State College (about 20 miles; Keene, NH; FT enrollment: 5,098)
- Saint Anselm College (about 21 miles; Manchester, NH; FT enrollment: 2,059)
- Mount Washington College (about 23 miles; Manchester, NH; FT enrollment: 2,187)
- Southern New Hampshire University (about 24 miles; Manchester, NH; FT enrollment: 16,552)
- NHTI-Concord's Community College (about 25 miles; Concord, NH; FT enrollment: 2,865)
- Mount Wachusett Community College (about 29 miles; Gardner, MA; FT enrollment: 3,143)
Public elementary/middle school in Bennington:
- PIERCE ELEMENTARY SCHOOL (Students: 91, Location: 19 MAIN ST., Grades: KG-4)
Points of interest:
Notable location: Bennington Fire and Rescue (A). Display/hide its location on the map
Church in Bennington: Bennington Congregational Church (A). Display/hide its location on the map
Cemetery: Mount Calvary Cemetery (1). Display/hide its location on the map
Reservoir: Contoocook River Reservoir (A). Display/hide its location on the map
Hotel: Econo Lodge (634 Francistown Road).
Drinking water stations with addresses in Bennington and their reported violations in the past:
MOUNTAINSIDE AT CROTCHED MTN (Population served: 165, Groundwater):Past health violations:BIRCHES OF BENNINGTON (Population served: 52, Groundwater):Past monitoring violations:
- MCL, Average - Between APR-2014 and JUN-2014, Contaminant: Arsenic. Follow-up actions: St Public Notif requested (JUN-16-2014), St Violation/Reminder Notice (JUN-16-2014), St Public Notif received (JUN-27-2014)
- MCL, Average - Between JAN-2014 and MAR-2014, Contaminant: Arsenic. Follow-up actions: St Public Notif requested (MAR-03-2014), St Violation/Reminder Notice (MAR-03-2014), St Public Notif received (MAR-12-2014)
- MCL, Average - Between OCT-2013 and DEC-2013, Contaminant: Arsenic. Follow-up actions: St Public Notif requested (JAN-09-2014), St Violation/Reminder Notice (JAN-09-2014), St Public Notif received (MAR-12-2014)
- MCL, Average - Between JUL-2013 and SEP-2013, Contaminant: Arsenic. Follow-up actions: St Public Notif requested (AUG-05-2013), St Violation/Reminder Notice (AUG-05-2013), St Public Notif received (AUG-14-2013)
- MCL, Average - Between APR-2013 and JUN-2013, Contaminant: Arsenic. Follow-up actions: St Public Notif requested (MAY-17-2013), St Violation/Reminder Notice (MAY-17-2013), St Formal NOV issued (JUN-20-2013), St Public Notif received (AUG-14-2013)
- MCL, Average - Between JAN-2013 and MAR-2013, Contaminant: Arsenic. Follow-up actions: St Public Notif requested (FEB-08-2013), St Violation/Reminder Notice (FEB-08-2013), St Public Notif received (MAR-29-2013), St Formal NOV issued (JUN-20-2013)
- Failure To Address Deficiency - In MAR-14-2013, Contaminant: GROUNDWATER RULE. Follow-up actions: St Public Notif requested (JUN-07-2013), St Violation/Reminder Notice (JUN-07-2013), St Compliance achieved (JUN-11-2013), St Public Notif received (JUN-17-2013)
- Follow-up Or Routine LCR Tap M/R - In OCT-01-2010, Contaminant: Lead and Copper Rule. Follow-up actions: St Public Notif requested (NOV-10-2010), St Violation/Reminder Notice (NOV-10-2010), St Compliance achieved (JAN-18-2011), St Formal NOV issued (JAN-21-2011), St Public Notif received (APR-15-2011)
- Follow-up Or Routine LCR Tap M/R - In JAN-01-2007, Contaminant: Lead and Copper Rule. Follow-up actions: St Violation/Reminder Notice (DEC-05-2007), St Compliance achieved (APR-17-2008)
- One routine major monitoring violation
Past monitoring violations:
- Monitoring, Source Water (GWR) - Between AUG-29-2012 and SEP-29-2012, Contaminant: E. COLI. Follow-up actions: St Public Notif requested (OCT-08-2012), St Violation/Reminder Notice (OCT-08-2012), St Formal NOV issued (JAN-23-2013), St Compliance achieved (FEB-12-2013), St Public Notif received (FEB-19-2013)
- Monitoring, Repeat Major (TCR) - In AUG-2012, Contaminant: Coliform (TCR). Follow-up actions: St Public Notif requested (OCT-08-2012), St Violation/Reminder Notice (OCT-08-2012), St Formal NOV issued (JAN-23-2013), St Compliance achieved (FEB-12-2013), St Public Notif received (FEB-19-2013)
- Failure To Address Deficiency - In MAY-11-2012, Contaminant: GROUNDWATER RULE. Follow-up actions: St Public Notif requested (AUG-09-2012), St Violation/Reminder Notice (AUG-09-2012), St Formal NOV issued (SEP-25-2012), St Compliance achieved (NOV-16-2012), St Public Notif received (JAN-01-2013)
- One routine major monitoring violation
| This town: | 2.6 people |
| New Hampshire: | 2.5 people |
| This town: | 68.4% |
| Whole state: | 66.3% |
| This town: | 9.4% |
| Whole state: | 8.3% |
Likely homosexual households (counted as self-reported same-sex unmarried-partner households)
- Lesbian couples: 0.7% of all households
- Gay men: 0.7% of all households
| This town: | 7.9% |
| Whole state: | 6.5% |
| This town: | 3.3% |
| Whole state: | 2.8% |
For population 15 years and over in Bennington:
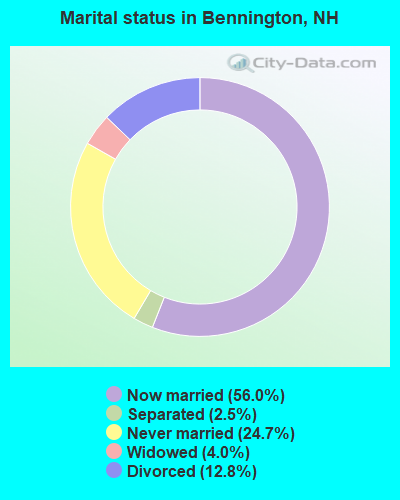
- Never married: 24.7%
- Now married: 56.0%
- Separated: 2.5%
- Widowed: 4.0%
- Divorced: 12.8%
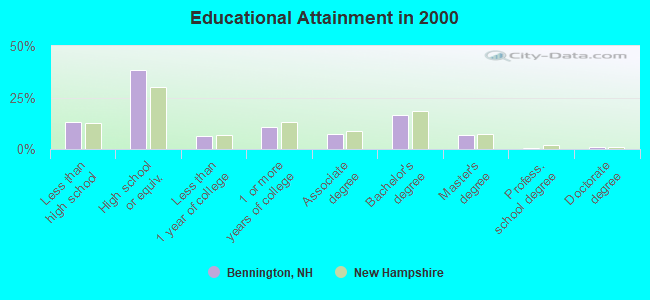
For population 25 years and over in Bennington:
- High school or higher: 87.1%
- Bachelor's degree or higher: 24.8%
- Graduate or professional degree: 8.3%
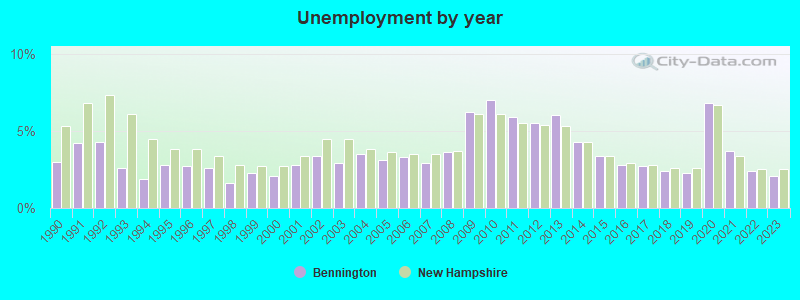
- Unemployed: 3.4%
- Mean travel time to work (commute): 23.7 minutes
| Here: | 10.0 |
| New Hampshire average: | 10.9 |
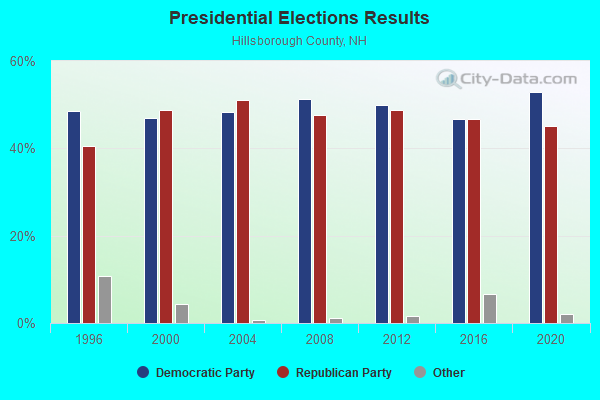
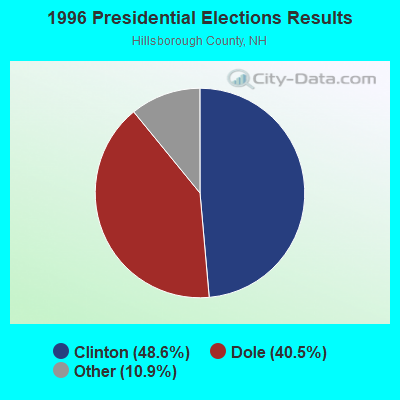
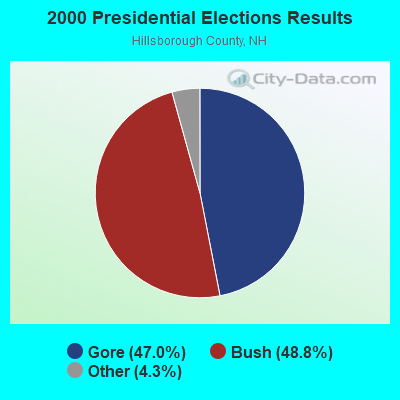
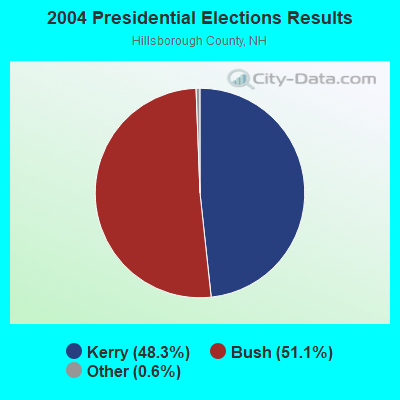
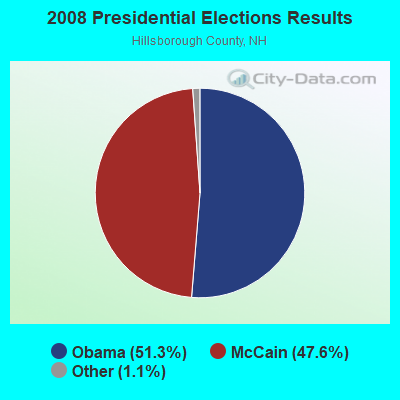
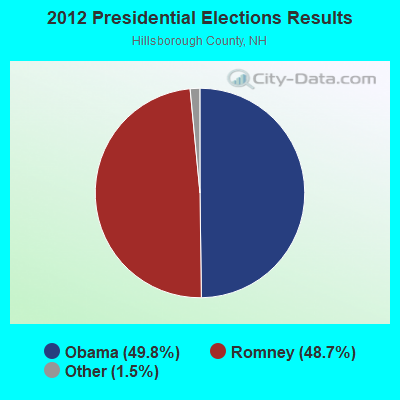
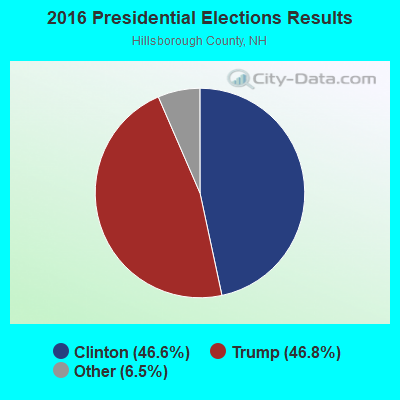
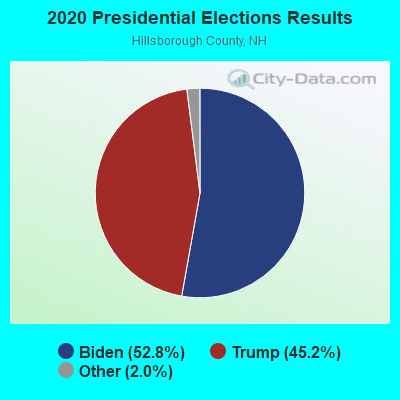
Graphs represent county-level data. Detailed 2008 Election Results
Religion statistics for Bennington, NH (based on Hillsborough County data)
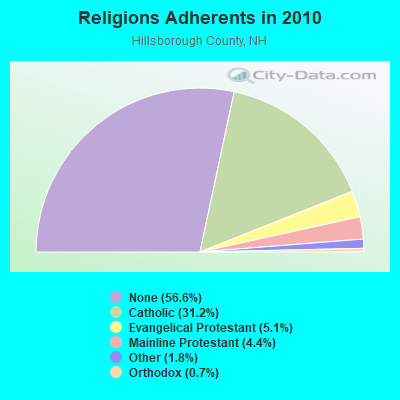
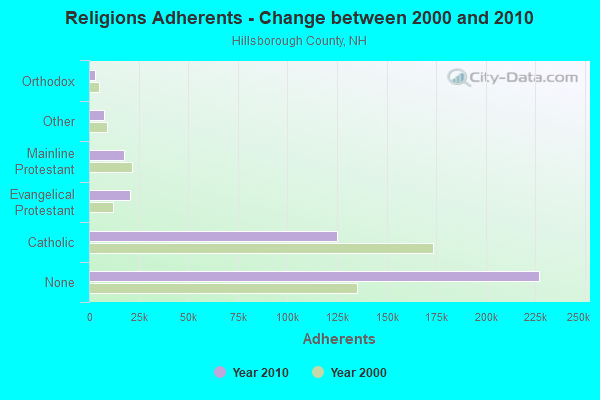
| Religion | Adherents | Congregations |
|---|---|---|
| Catholic | 124,993 | 40 |
| Evangelical Protestant | 20,588 | 103 |
| Mainline Protestant | 17,794 | 60 |
| Other | 7,365 | 35 |
| Orthodox | 2,990 | 7 |
| Black Protestant | - | 1 |
| None | 226,991 | - |
Food Environment Statistics:
| Hillsborough County: | 1.82 / 10,000 pop. |
| New Hampshire: | 2.14 / 10,000 pop. |
| This county: | 0.12 / 10,000 pop. |
| State: | 0.15 / 10,000 pop. |
| Hillsborough County: | 1.65 / 10,000 pop. |
| New Hampshire: | 1.78 / 10,000 pop. |
| Hillsborough County: | 2.67 / 10,000 pop. |
| State: | 4.02 / 10,000 pop. |
| Here: | 8.23 / 10,000 pop. |
| State: | 9.70 / 10,000 pop. |
| This county: | 6.9% |
| New Hampshire: | 7.6% |
| Hillsborough County: | 24.5% |
| New Hampshire: | 24.4% |
| This county: | 15.1% |
| State: | 15.9% |
6.73% of this county's 2021 resident taxpayers lived in other counties in 2020 ($92,767 average adjusted gross income)
| Here: | 6.73% |
| New Hampshire average: | 7.66% |
0.01% of residents moved from foreign countries ($183 average AGI)
Hillsborough County: 0.01% New Hampshire average: 0.01%
Top counties from which taxpayers relocated into this county between 2020 and 2021:
| from Middlesex County, MA | |
| from Rockingham County, NH | |
| from Merrimack County, NH |
6.49% of this county's 2020 resident taxpayers moved to other counties in 2021 ($81,100 average adjusted gross income)
| Here: | 6.49% |
| New Hampshire average: | 6.80% |
0.02% of residents moved to foreign countries ($105 average AGI)
Hillsborough County: 0.02% New Hampshire average: 0.01%
Top counties to which taxpayers relocated from this county between 2020 and 2021:
| to Rockingham County, NH | |
| to Merrimack County, NH | |
| to Middlesex County, MA |
Strongest AM radio stations in Bennington:
- WRKO (680 AM; 50 kW; BOSTON, MA; Owner: ENTERCOM BOSTON LICENSE, LLC)
- WCRN (830 AM; 50 kW; WORCESTER, MA; Owner: CARTER BROADCASTING CORPORATION)
- WEEI (850 AM; 50 kW; BOSTON, MA; Owner: ENTERCOM BOSTON LICENSE, LLC)
- WGIR (610 AM; 5 kW; MANCHESTER, NH; Owner: CAPSTAR TX LIMITED PARTNERSHIP)
- WNNZ (640 AM; 50 kW; WESTFIELD, MA; Owner: CLEAR CHANNEL BROADCASTING LICENSES, INC.)
- WKOX (1200 AM; 50 kW; FRAMINGHAM, MA; Owner: CAPSTAR TX LIMITED PARTNERSHIP)
- WNTK (1020 AM; 10 kW; NEWPORT, NH; Owner: KOOR COMMUNICATIONS, INC.)
- WBIX (1060 AM; 40 kW; NATICK, MA; Owner: LANGER BROADCASTING CORPORATION)
- WVNE (760 AM; daytime; 25 kW; LEICESTER, MA; Owner: BLOUNT MASSCOM, INC.)
- WWZN (1510 AM; 50 kW; BOSTON, MA; Owner: ROSE CITY RADIO CORPORATION)
- WKBK (1290 AM; 5 kW; KEENE, NH; Owner: SAGA COMMUNICATIONS OF NEW ENGLAND, LLC)
- WKBR (1250 AM; 5 kW; MANCHESTER, NH; Owner: DEVON BROADCASTING COMPANY, INC.)
- WBZ (1030 AM; 50 kW; BOSTON, MA; Owner: INFINITY BROADCASTING OPERATIONS, INC.)
Strongest FM radio stations in Bennington:
- WFEX (92.1 FM; PETERBOROUGH, NH; Owner: FNX BROADCASTING OF NEW HAMPSHIRE LLC)
- WTPL (107.7 FM; HILLSBORO, NH; Owner: CONCORD BROADCASTING, L.L.C.)
- WGIR-FM (101.1 FM; MANCHESTER, NH; Owner: CAPSTAR TX LIMITED PARTNERSHIP)
- WNNH (99.1 FM; HENNIKER, NH; Owner: TELE-MEDIA COMPANY OF NEW HAMPSHIRE, L.L.C.)
- WQLL (96.5 FM; BEDFORD, NH; Owner: SAGA COMMUNICATIONS OF NEW ENGLAND, LLC)
- WLMW (90.7 FM; MANCHESTER, NH; Owner: KNOWLEDGE FOR LIFE)
- WZID (95.7 FM; MANCHESTER, NH; Owner: SAGA COMMUNICATIONS OF NEW ENGLAND, LLC)
- WHDQ (106.1 FM; CLAREMONT, NH; Owner: GREAT NORTHERN RADIO, L.L.C.)
- WVPR (89.5 FM; WINDSOR, VT; Owner: VERMONT PUBLIC RADIO)
- WKNE (103.7 FM; KEENE, NH; Owner: SAGA COMMUNICATIONS OF NEW ENGLAND, LLC)
- WEVN (90.7 FM; KEENE, NH; Owner: NEW HAMPSHIRE PUBLIC RADIO, INC.)
- WJJR (98.1 FM; RUTLAND, VT; Owner: 6 JOHNSON ROAD LICENSES, INC.)
- WZRT (97.1 FM; RUTLAND, VT; Owner: CAPSTAR TX LIMITED PARTNERSHIP)
- WVRR (101.7 FM; NEWPORT, NH; Owner: CAPSTAR TX LIMITED PARTNERSHIP)
- WEQX (102.7 FM; MANCHESTER, VT; Owner: NORTHSHIRE COMMUNICATIONS, INC.)
- WEBK (105.3 FM; KILLINGTON, VT; Owner: 6 JOHNSON ROAD LICENSES, INC.)
- WJAN (95.1 FM; SUNDERLAND, VT; Owner: 6 JOHNSON ROAD LICENSES, INC.)
- WNHI (93.3 FM; BELMONT, NH; Owner: CONCORD BROADCASTING, L.L.C.)
- W293AB (106.5 FM; KEENE, NH; Owner: GREAT NORTHERN RADIO, L.L.C.)
- WGLV (91.7 FM; WOODSTOCK, VT; Owner: CHRISTIAN MINISTRIES INC)
TV broadcast stations around Bennington:
- WUNI (Channel 27; WORCESTER, MA; Owner: ENTRAVISION HOLDINGS, LLC)
- WEKW-TV (Channel 52; KEENE, NH; Owner: UNIVERSITY OF NEW HAMPSHIRE)
- WUTF (Channel 66; MARLBOROUGH, MA; Owner: TELEFUTURA BOSTON LLC)
- WMUR-TV (Channel 9; MANCHESTER, NH; Owner: HEARST-ARGYLE PROPERTIES, INC.)
Bennington fatal accident list:
Sep 8, 1994 06:50 PM, Route 47, Vehicles: 1, Persons: 1, Fatalities: 1
- National Bridge Inventory (NBI) Statistics
- 4Number of bridges
- 33ft / 9.5mTotal length
- $12,568,000Total costs
- 7,594Total average daily traffic
- 301Total average daily truck traffic
- 11,237Total future (year 2042) average daily traffic
FCC Registered Broadcast Land Mobile Towers:
3- Crotched Mt Ski Area, 615 Francestown Road (Lat: 43.003028 Lon: -71.879056), Type: Ltower, Structure height: 3 m, Overall height: 6 m, Call Sign: KIL506,
Assigned Frequencies: 457.375 MHz, 154.430 MHz, Grant Date: 12/01/2011, Expiration Date: 02/22/2022, Cancellation Date: 04/30/2022, Certifier: John S Marechal, Registrant: Southwestern Nh District Fire Mutual Aid, 32 Vernon Street, Keene, NH 03431, Phone: (603) 352-8635, Fax: (603) 352-1985, Email:
- Lat: 43.011917 Lon: -71.878833, Call Sign: WQYY446,
Assigned Frequencies: 463.475 MHz, 464.050 MHz, 464.100 MHz, 469.012 MHz, 469.100 MHz, Grant Date: 03/01/2017, Expiration Date: 03/01/2027, Certifier: Pat Terry, Registrant: Beltronics, Inc, 240 Main Duntsable Rd, Nashua, NH 03062, Phone: (603) 402-4144, Email:
- Crotched Mt Ski Area, 615 Francestown Road (Lat: 43.003028 Lon: -71.879028), Type: Ltower, Structure height: 3 m, Overall height: 6 m, Call Sign: WRUH213,
Assigned Frequencies: 465.150 MHz, 154.430 MHz, Grant Date: 08/25/2022, Expiration Date: 08/25/2032, Certifier: Kassandra Lunderville, Registrant: Southwestern Nh District Fire Mutual Aid, 32 Vernon Street, Keene, NH 03431, Phone: (603) 352-8635, Fax: (603) 352-1985, Email:
FCC Registered Amateur Radio Licenses:
7- Call Sign: N1SWT, Grant Date: 08/10/1994, Expiration Date: 08/10/2004, Cancellation Date: 08/11/2006, Registrant: Linda M Magoon, 81 Old Greenfield Rd, Bennington, NH 03442
- Call Sign: N1XDV, Grant Date: 04/25/1996, Expiration Date: 04/25/2006, Cancellation Date: 04/26/2008, Registrant: Nathan W Schroeder, 329 N Bennington Rd, Bennington, NH 03442
- Call Sign: N1XJO, Grant Date: 05/28/1996, Expiration Date: 05/28/2006, Cancellation Date: 05/29/2008, Registrant: Daniel S Schroeder, 329 N Bennington Rd, Bennington, NH 03442
- Call Sign: KB1TOW, Licensee ID: L01542633, Grant Date: 10/25/2019, Expiration Date: 01/21/2030, Certifier: James E Bronson, Registrant: James E Bronson, 76 N Bennington Rd, Bennington, NH 03442
- Call Sign: KB1TOX, Licensee ID: L01542634, Grant Date: 10/25/2019, Expiration Date: 01/21/2030, Certifier: Elizabeth H Bronson, Registrant: Elizabeth H Bronson, 76 N Bennington Rd, Bennington, NH 03442
- Call Sign: KC1ELC, Licensee ID: L01972138, Grant Date: 09/24/2015, Expiration Date: 09/24/2025, Certifier: Anthony A Cuddemi, Registrant: Anthony A Cuddemi, Bennington, NH 03442
- Call Sign: N1CMD, Previous Call Sign: KB1RTQ, Licensee ID: L01463276, Grant Date: 08/23/2016, Expiration Date: 08/23/2026, Certifier: Curtis M Dude, Registrant: Curtis M Dude, 181 Onset Rd, Bennington, NH 03442
FAA Registered Aircraft:
1- Aircraft: ECLIPSE AVIATION CORP EA500 (Category: Land, Engines: 2, Seats: 6, Weight: Up to 12,499 Pounds), Engine: P&W CANADA PW610F-A (950 Pounds of Thrust) (Turbo-fan)
N-Number: 63AD, N63AD, N-63AD, Serial Number: 000163, Year manufactured: 2008, Airworthiness Date: 04/01/2008, Certificate Issue Date: 10/05/2015
Registrant (LLC): Lwm2 LLC, 388 Greenfield Rd, Bennington, NH 03442
2003 - 2018 National Fire Incident Reporting System (NFIRS) incidents
- Fire incident types reported to NFIRS in Bennington, NH
- 7952.7%Structure Fires
- 3523.3%Outside Fires
- 1812.0%Mobile Property/Vehicle Fires
- 1812.0%Other
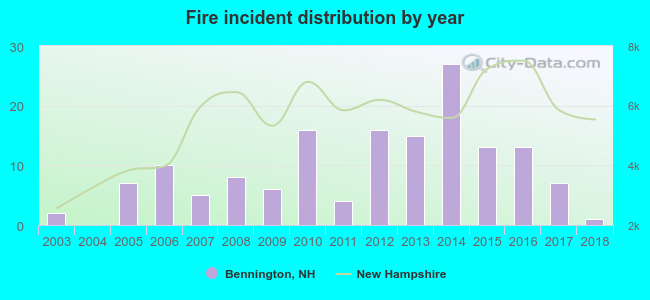 According to the data from the years 2003 - 2018 the average number of fires per year is 9. The highest number of reported fire incidents - 27 took place in 2014, and the least - 0 in 2004. The data has a dropping trend.
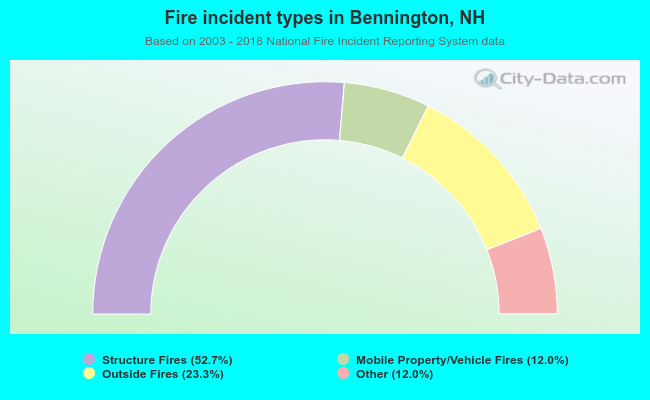 When looking into fire subcategories, the most reports belonged to: Structure Fires (52.7%), and Outside Fires (23.3%).
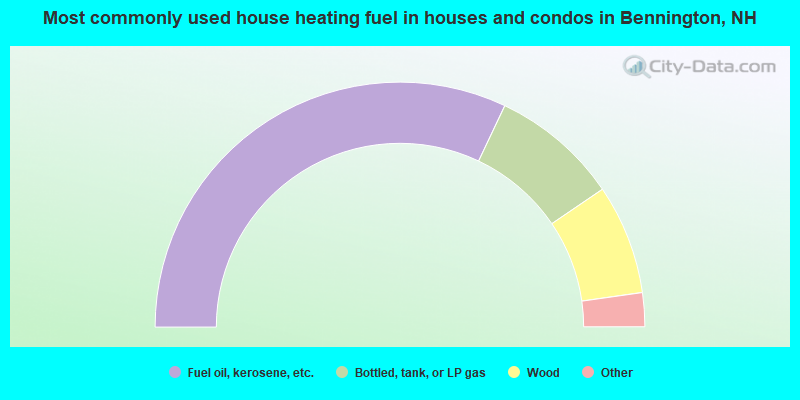
- 64.1%Fuel oil, kerosene, etc.
- 16.9%Bottled, tank, or LP gas
- 14.5%Wood
- 2.4%Utility gas
- 2.1%Electricity
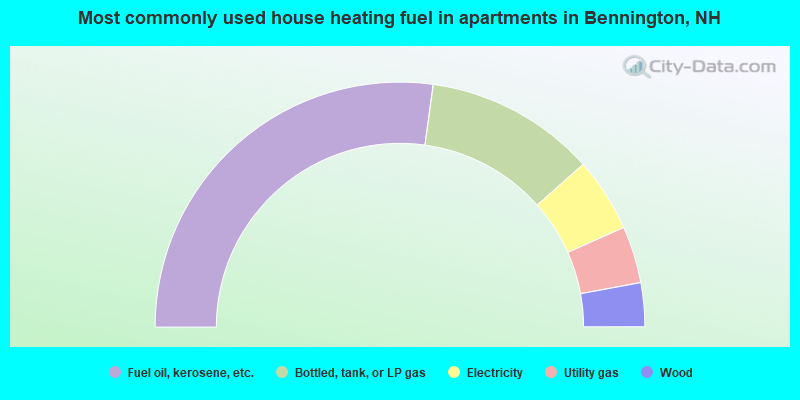
- 54.3%Fuel oil, kerosene, etc.
- 22.5%Bottled, tank, or LP gas
- 9.8%Electricity
- 7.5%Utility gas
- 5.8%Wood
Bennington compared to New Hampshire state average:
- Unemployed percentage significantly below state average.
- Black race population percentage significantly below state average.
- Hispanic race population percentage significantly below state average.
- Median age below state average.
- Foreign-born population percentage significantly below state average.
- Length of stay since moving in significantly above state average.
- Number of rooms per house significantly below state average.
- House age significantly below state average.

|
Total of 2 patent applications in 2008-2024.