Binghamton, New York
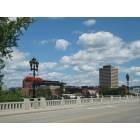
Binghamton: Summer

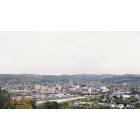
Binghamton: Binghamton from a nearby hill

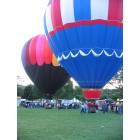
Binghamton: above from hot air ballon
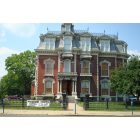
Binghamton: city of binghamton

Binghamton: Ross Park Zoo Carousel
Binghamton: Spiedie Fest

Binghamton: Confluence Park

Binghamton: Sunset on the South Mountain (southside Binghamton)
Binghamton: Phelps Muesum
Binghamton: Roberson Museum in Binghamton, NY
Binghamton: Ridley School of Business, Binghamton NY

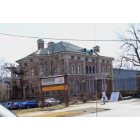
Binghamton: The old Carnegie Library in Binghamton, NY
- add
your
Submit your own pictures of this city and show them to the world
- OSM Map
- General Map
- Google Map
- MSN Map
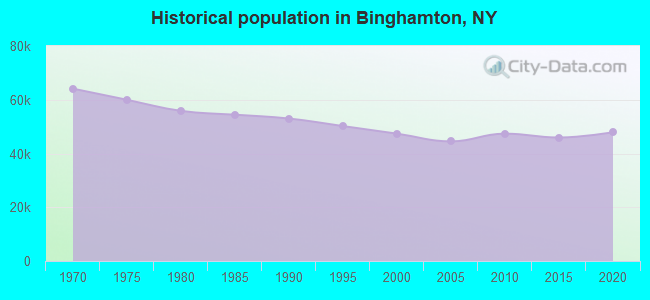
Population change since 2000: -0.6%
 |
| Males: 22,579 | |
| Females: 24,536 |
| Median resident age: | 35.3 years |
| New York median age: | 40.0 years |
Zip codes: 13901, 13903, 13904, 13905.
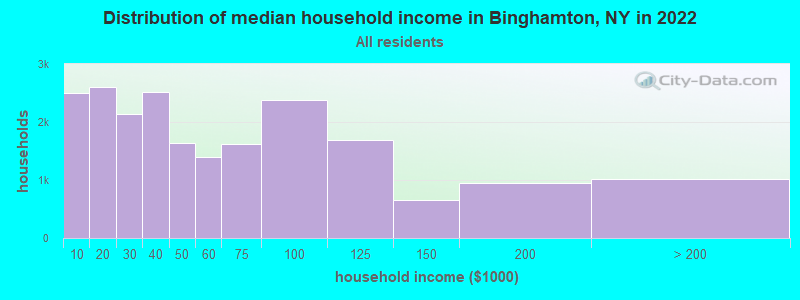
Binghamton Zip Code Map| Binghamton: | $43,688 |
| NY: | $79,557 |
Estimated per capita income in 2022: $29,688 (it was $17,067 in 2000)
Binghamton city income, earnings, and wages data
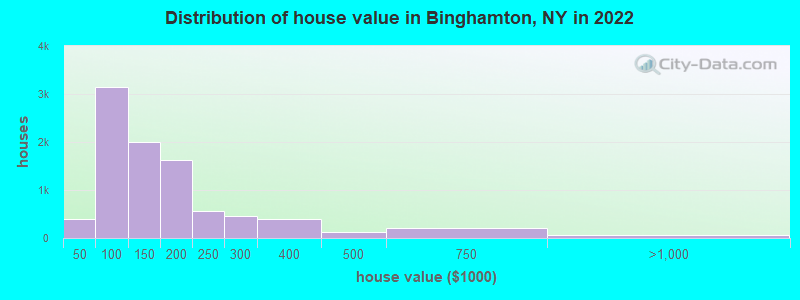
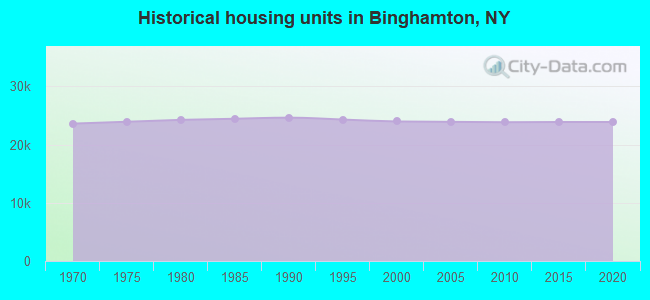
Estimated median house or condo value in 2022: $123,219 (it was $66,100 in 2000)
| Binghamton: | $123,219 |
| NY: | $400,400 |
Mean prices in 2022: all housing units: $156,992; detached houses: $160,059; townhouses or other attached units: $303,205; in 2-unit structures: $157,905; in 3-to-4-unit structures: $129,765; in 5-or-more-unit structures: $102,560; mobile homes: $54,146
Median gross rent in 2022: $838.
(25.5% for White Non-Hispanic residents, 42.8% for Black residents, 45.4% for Hispanic or Latino residents, 61.1% for American Indian residents, 52.6% for other race residents, 28.1% for two or more races residents)
Detailed information about poverty and poor residents in Binghamton, NY


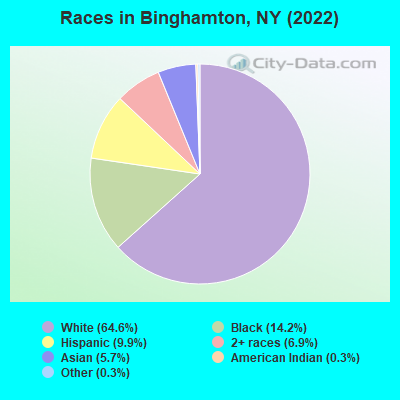
- 30,54664.6%White alone
- 6,73014.2%Black alone
- 4,6879.9%Hispanic
- 3,2716.9%Two or more races
- 2,7195.7%Asian alone
- 1650.3%American Indian alone
- 1230.3%Other race alone
- 280.06%Native Hawaiian and Other
Pacific Islander alone
Races in Binghamton detailed stats: ancestries, foreign born residents, place of birth
According to our research of New York and other state lists, there were 221 registered sex offenders living in Binghamton, New York as of June 17, 2024.
The ratio of all residents to sex offenders in Binghamton is 207 to 1.
Type |
2009 |
2010 |
2011 |
2012 |
2013 |
2014 |
2015 |
2016 |
2017 |
2018 |
2019 |
2020 |
2021 |
2022 |
|---|---|---|---|---|---|---|---|---|---|---|---|---|---|---|
| Murders (per 100,000) | 15 (33.7) | 4 (8.4) | 0 (0.0) | 3 (6.3) | 3 (6.5) | 1 (2.2) | 4 (8.7) | 4 (8.7) | 4 (8.8) | 3 (6.7) | 2 (4.5) | 1 (2.3) | 3 (6.8) | 0 (0.0) |
| Rapes (per 100,000) | 11 (24.7) | 18 (38.0) | 17 (35.7) | 15 (31.7) | 19 (41.0) | 49 (106.0) | 37 (80.4) | 41 (89.6) | 42 (92.5) | 40 (89.1) | 42 (94.4) | 31 (70.3) | 32 (73.0) | 21 (44.4) |
| Robberies (per 100,000) | 56 (126.0) | 70 (147.8) | 76 (159.7) | 81 (171.4) | 101 (218.1) | 83 (179.5) | 89 (193.3) | 93 (203.1) | 90 (198.2) | 75 (167.1) | 66 (148.4) | 50 (113.4) | 52 (118.6) | 49 (103.7) |
| Assaults (per 100,000) | 134 (301.4) | 174 (367.3) | 175 (367.7) | 216 (457.1) | 161 (347.7) | 174 (376.4) | 180 (390.9) | 215 (469.6) | 226 (497.8) | 208 (463.5) | 245 (550.9) | 296 (671.5) | 265 (604.6) | 248 (524.8) |
| Burglaries (per 100,000) | 286 (643.3) | 423 (892.9) | 415 (872.1) | 558 (1,181) | 525 (1,134) | 343 (742.0) | 342 (742.7) | 435 (950.2) | 370 (815.0) | 427 (951.5) | 417 (937.6) | 297 (673.7) | 322 (734.7) | 294 (622.1) |
| Thefts (per 100,000) | 1,744 (3,923) | 1,644 (3,470) | 1,796 (3,774) | 1,732 (3,666) | 1,767 (3,816) | 1,653 (3,576) | 1,707 (3,707) | 1,304 (2,848) | 1,557 (3,430) | 1,407 (3,135) | 1,429 (3,213) | 1,417 (3,214) | 1,077 (2,457) | 1,343 (2,842) |
| Auto thefts (per 100,000) | 44 (99.0) | 18 (38.0) | 73 (153.4) | 46 (97.4) | 57 (123.1) | 52 (112.5) | 43 (93.4) | 102 (222.8) | 56 (123.4) | 59 (131.5) | 61 (137.2) | 104 (235.9) | 109 (248.7) | 109 (230.6) |
| Arson (per 100,000) | 4 (9.0) | 2 (4.2) | 2 (4.2) | 14 (29.6) | 3 (6.5) | 5 (10.8) | 4 (8.7) | 5 (10.9) | 11 (24.2) | 9 (20.1) | 16 (36.0) | 15 (34.0) | 26 (59.3) | 21 (44.4) |
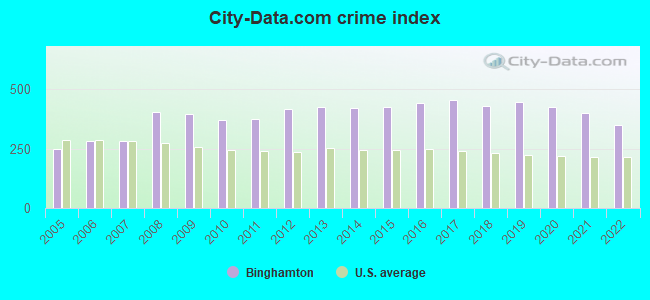
| City-Data.com crime index | 395.2 | 369.4 | 374.3 | 418.0 | 422.6 | 422.2 | 425.6 | 442.3 | 454.8 | 430.1 | 444.4 | 423.7 | 398.2 | 347.3 |
The City-Data.com crime index weighs serious crimes and violent crimes more heavily. Higher means more crime, U.S. average is 246.1. It adjusts for the number of visitors and daily workers commuting into cities.
Crime rate in Binghamton detailed stats: murders, rapes, robberies, assaults, burglaries, thefts, arson
Full-time law enforcement employees in 2021, including police officers: 145 (133 officers - 120 male; 13 female).
| Officers per 1,000 residents here: | 3.03 |
| New York average: | 3.28 |
 Recent articles from our blog. Our writers, many of them Ph.D. graduates or candidates, create easy-to-read articles on a wide variety of topics.

 | Elderly Binghamton homeowner needs to get rid of squatter (4 replies) |
| Native American culture in NY State (1109 replies) |
| smaller Upstate NY cities and towns/African American communities (6035 replies) |
| Veteran friendly....... (490 replies) |
| Central to Albany Buffalo Pittsburgh with great restaurants (64 replies) |
| Nice Areas to Buy between Binghamton and Syracuse? (15 replies) |
Latest news from Binghamton, NY collected exclusively by city-data.com from local newspapers, TV, and radio stations
Ancestries: Irish (9.2%), Italian (9.1%), English (8.2%), German (6.0%), American (5.4%), Haitian (4.3%).
Current Local Time: EST time zone
Incorporated in 1834
Land area: 10.4 square miles.
Population density: 4,514 people per square mile (average).
5,492 residents are foreign born (5.0% Asia, 3.5% Latin America, 1.9% Europe).
| This city: | 11.6% |
| New York: | 22.6% |
Median real estate property taxes paid for housing units with mortgages in 2022: $3,720 (2.9%)
Median real estate property taxes paid for housing units with no mortgage in 2022: $3,177 (2.6%)
Nearest city with pop. 50,000+: Union, NY (5.7 miles  , pop. 56,298).
Nearest city with pop. 200,000+: Rochester, NY (113.5 miles , pop. 219,773).
Nearest city with pop. 1,000,000+: Manhattan, NY (136.4 miles , pop. 1,537,195).
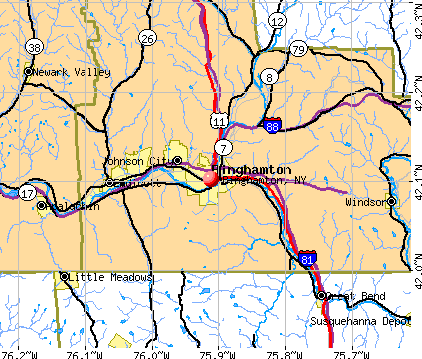
Nearest cities:
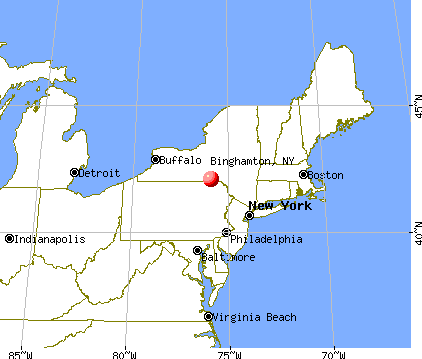
), ), ), ), )Latitude: 42.10 N, Longitude: 75.91 W
Daytime population change due to commuting: +4,930 (+10.4%)
Workers who live and work in this city: 9,569 (45.8%)
Area code: 607

Binghamton tourist attractions:
Binghamton, New York accommodation & food services, waste management - Economy and Business Data
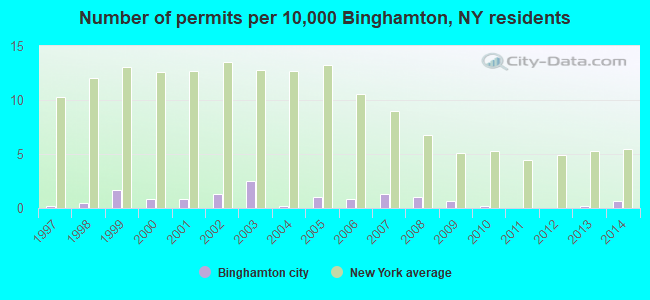
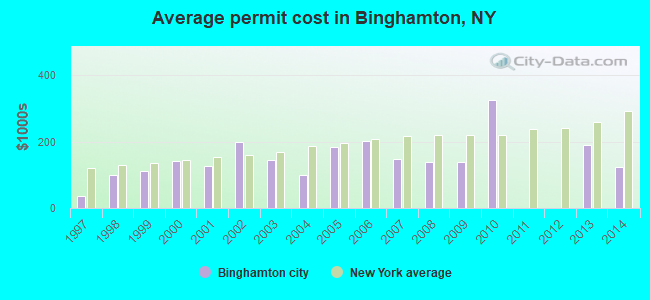
Single-family new house construction building permits:
- 2014: 3 buildings, average cost: $123,300
- 2013: 1 building, cost: $190,000
- 2010: 1 building, cost: $326,000
- 2009: 3 buildings, average cost: $140,100
- 2008: 5 buildings, average cost: $140,100
- 2007: 6 buildings, average cost: $149,200
- 2006: 4 buildings, average cost: $201,800
- 2005: 5 buildings, average cost: $183,400
- 2004: 1 building, cost: $100,000
- 2003: 12 buildings, average cost: $144,500
- 2002: 6 buildings, average cost: $198,800
- 2001: 4 buildings, average cost: $127,300
- 2000: 4 buildings, average cost: $143,100
- 1999: 8 buildings, average cost: $112,600
- 1998: 2 buildings, average cost: $100,000
- 1997: 1 building, cost: $35,000
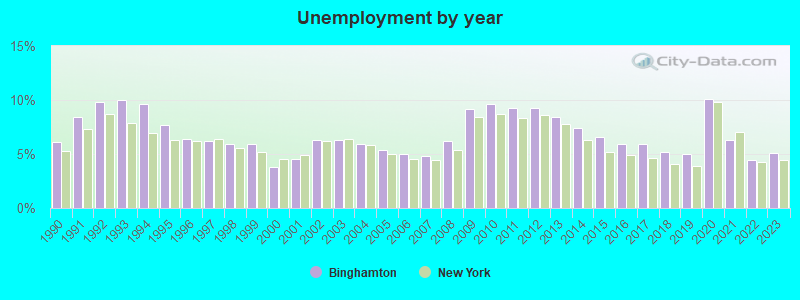
| Here: | 5.1% |
| New York: | 4.4% |
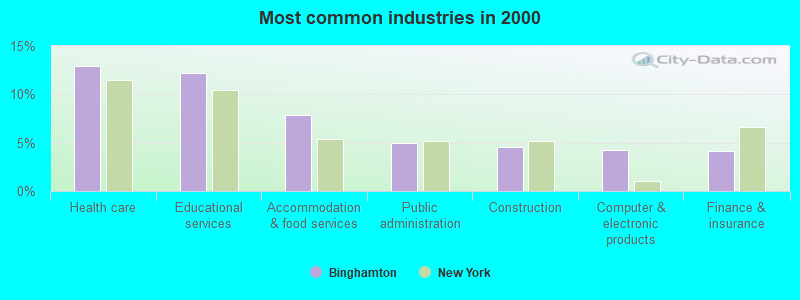
- Health care (12.9%)
- Educational services (12.2%)
- Accommodation & food services (7.9%)
- Public administration (5.0%)
- Construction (4.5%)
- Computer & electronic products (4.2%)
- Finance & insurance (4.1%)
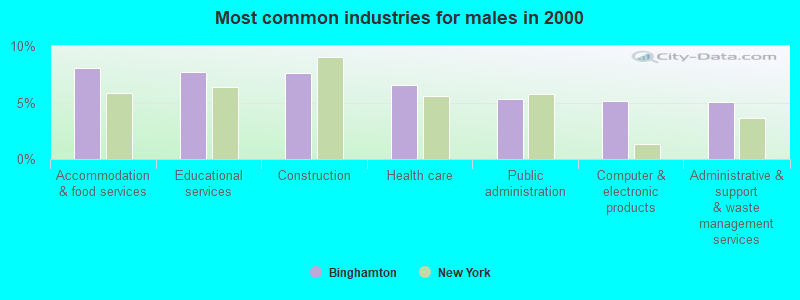
- Accommodation & food services (8.0%)
- Educational services (7.7%)
- Construction (7.6%)
- Health care (6.6%)
- Public administration (5.3%)
- Computer & electronic products (5.1%)
- Administrative & support & waste management services (5.0%)
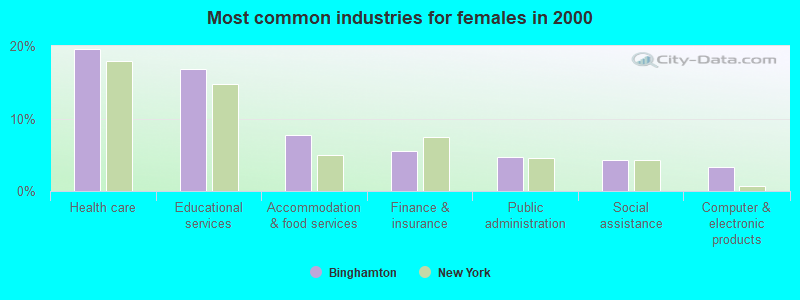
- Health care (19.5%)
- Educational services (16.9%)
- Accommodation & food services (7.8%)
- Finance & insurance (5.5%)
- Public administration (4.7%)
- Social assistance (4.2%)
- Computer & electronic products (3.2%)
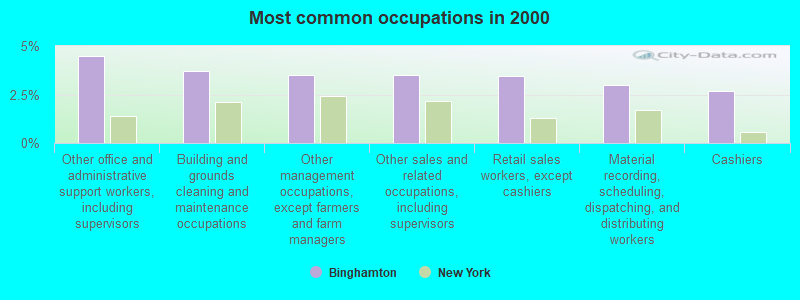
- Other office and administrative support workers, including supervisors (4.5%)
- Building and grounds cleaning and maintenance occupations (3.7%)
- Other management occupations, except farmers and farm managers (3.5%)
- Other sales and related occupations, including supervisors (3.5%)
- Retail sales workers, except cashiers (3.4%)
- Material recording, scheduling, dispatching, and distributing workers (3.0%)
- Cashiers (2.7%)
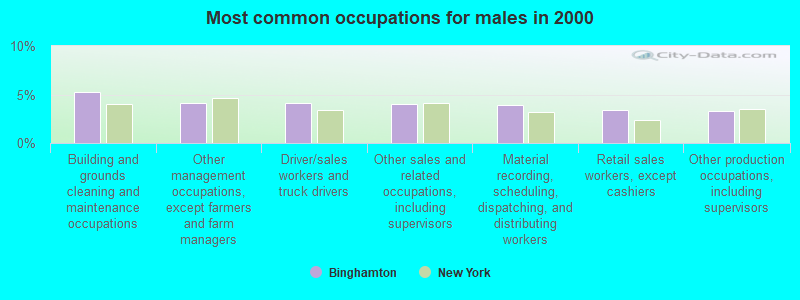
- Building and grounds cleaning and maintenance occupations (5.3%)
- Other management occupations, except farmers and farm managers (4.1%)
- Driver/sales workers and truck drivers (4.1%)
- Other sales and related occupations, including supervisors (4.0%)
- Material recording, scheduling, dispatching, and distributing workers (3.9%)
- Retail sales workers, except cashiers (3.4%)
- Other production occupations, including supervisors (3.3%)
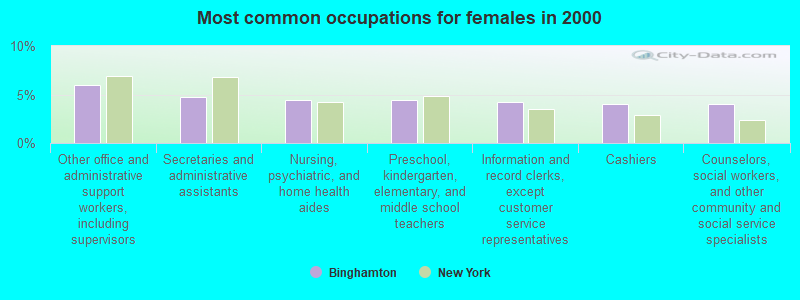
- Other office and administrative support workers, including supervisors (5.9%)
- Secretaries and administrative assistants (4.8%)
- Nursing, psychiatric, and home health aides (4.5%)
- Preschool, kindergarten, elementary, and middle school teachers (4.4%)
- Information and record clerks, except customer service representatives (4.3%)
- Cashiers (4.0%)
- Counselors, social workers, and other community and social service specialists (4.0%)
Average climate in Binghamton, New York
Based on data reported by over 4,000 weather stations


|
|


Tornado activity:
Binghamton-area historical tornado activity is near New York state average. It is 60% smaller than the overall U.S. average.
On 5/31/1998, a category F3 (max. wind speeds 158-206 mph) tornado 12.4 miles away from the Binghamton city center injured 12 people and caused $3 million in damages.
On 5/2/1983, a category F3 tornado 24.3 miles away from the city center injured 6 people and caused between $500,000 and $5,000,000 in damages.
Earthquake activity:
Binghamton-area historical earthquake activity is significantly above New York state average. It is 66% smaller than the overall U.S. average.On 10/7/1983 at 10:18:46, a magnitude 5.3 (5.1 MB, 5.3 LG, 5.1 ML, Class: Moderate, Intensity: VI - VII) earthquake occurred 150.6 miles away from the city center
On 4/20/2002 at 10:50:47, a magnitude 5.3 (5.3 ML, Depth: 3.0 mi) earthquake occurred 200.5 miles away from the city center
On 8/23/2011 at 17:51:04, a magnitude 5.8 (5.8 MW, Depth: 3.7 mi) earthquake occurred 309.2 miles away from the city center
On 4/20/2002 at 10:50:47, a magnitude 5.2 (5.2 MB, 4.2 MS, 5.2 MW, 5.0 MW) earthquake occurred 198.5 miles away from the city center
On 9/25/1998 at 19:52:52, a magnitude 5.2 (4.8 MB, 4.3 MS, 5.2 LG, 4.5 MW, Depth: 3.1 mi) earthquake occurred 235.0 miles away from Binghamton center
On 1/16/1994 at 01:49:16, a magnitude 4.6 (4.6 MB, 4.6 LG, Depth: 3.1 mi, Class: Light, Intensity: IV - V) earthquake occurred 122.8 miles away from Binghamton center
Magnitude types: regional Lg-wave magnitude (LG), body-wave magnitude (MB), local magnitude (ML), surface-wave magnitude (MS), moment magnitude (MW)
Natural disasters:
The number of natural disasters in Broome County (25) is a lot greater than the US average (15).Major Disasters (Presidential) Declared: 15
Emergencies Declared: 8
Causes of natural disasters: Floods: 11, Storms: 11, Snowstorms: 3, Tropical Storms: 3, Heavy Rains: 2, Hurricanes: 2, Tornadoes: 2, Blizzard: 1, Landslide: 1, Power Outage: 1, Tropical Depression: 1, Wind: 1, Winter Storm: 1, Other: 2 (Note: some incidents may be assigned to more than one category).

Main business address for: BSB BANCORP INC (STATE COMMERCIAL BANKS), NEW YORK STATE ELECTRIC & GAS CORP (ELECTRIC & OTHER SERVICES COMBINED).
Hospitals in Binghamton:
- BINGHAMTON PSYCH CENTER (provides emergency services, 425 ROBINSON ST)
- BROOME DDSO (241 GLENWOOD RD)
- BROOME DEVELOPMENTAL CENTER (249 GLENWOOD RD)
- OUR LADY OF LOURDES MEMORIAL HOSPITAL, INC (Voluntary non-profit - Private, 169 RIVERSIDE DRIVE)
Nursing Homes in Binghamton:
- BRIDGEWATER CENTER FOR REHAB AND NURSING L L C (159 163 FRONT STREET - BOX 765)
- ELIZABETH CHURCH MANOR NURSING (863 FRONT STREET)
- GOOD SHEPHERD FAIRVIEW HOME (80 FAIRVIEW AVENUE)
- UNITED HEALTH SVS HOSP BINGHAMTON GEN T C U (10-42 MITCHELL AVENUE)
Dialysis Facilities in Binghamton:
Home Health Centers in Binghamton:
Airports located in Binghamton:
- Greater Binghamton/Edwin A Link Field Airport (BGM) (Runways: 2, Commercial Ops: 26, Air Taxi Ops: 5,842, Itinerant Ops: 6,370, Local Ops: 3,328, Military Ops: 578)
- Chenango Bridge Airport (1NK8) (Runways: 2, Itinerant Ops: 1,380, Local Ops: 1,870)
- Luke Airport (3NY5) (Runways: 1)
Colleges/Universities in Binghamton:
- SUNY Broome Community College (Full-time enrollment: 4,969; Location: 907 Upper Front St; Public; Website: WWW.SUNYBROOME.EDU)
- Ridley-Lowell Business & Technical Institute-Binghamton (Full-time enrollment: 182; Location: 116 Front St; Private, for-profit; Website: www.ridley.edu)
- Broome Delaware Tioga BOCES-Practical Nursing Program (Full-time enrollment: 57; Location: 435 Glenwood Rd; Public; Website: www.btboces.org/)
- Ann Marie's World of Beauty School (Full-time enrollment: 9; Location: 389 State St; Private, for-profit; Website: AWBS.EDU)
Other colleges/universities with over 2000 students near Binghamton:
- SUNY at Binghamton (about 4 miles; Vestal, NY; Full-time enrollment: 15,096)
- Tompkins Cortland Community College (about 34 miles; Dryden, NY; FT enrollment: 3,884)
- SUNY College at Cortland (about 37 miles; Cortland, NY; FT enrollment: 6,838)
- Ithaca College (about 38 miles; Ithaca, NY; FT enrollment: 6,781)
- Cornell University (about 38 miles; Ithaca, NY; FT enrollment: 20,360)
- Marywood University (about 49 miles; Scranton, PA; FT enrollment: 2,959)
- University of Scranton (about 50 miles; Scranton, PA; FT enrollment: 5,488)
Public high schools in Binghamton:
- BINGHAMTON HIGH SCHOOL (Students: 1,657, Location: 31 MAIN ST, Grades: PK-12)
- CHENANGO VALLEY HIGH SCHOOL (Students: 601, Location: 221 CHENANGO BRIDGE RD, Grades: 9-12)
- CHENANGO FORKS HIGH SCHOOL (Students: 532, Location: 1 GORDON DR, Grades: 9-12)
- GREATER BINGHAMTON HEALTH CENTER (Location: 425 ROBINSON ST, Grades: 1-11)
- BROOME-DELAWARE-TIOGA BOCES (Location: 435 GLENWOOD RD, Grades: KG-12)
Private high schools in Binghamton:
- SETON CATHOLIC-CENTRAL HIGH SCHOOL (Students: 384, Location: 70 SEMINARY AVE, Grades: 7-12)
- CENTRAL BAPTIST CHRISTIAN ACADEMY (Students: 152, Location: 1606 STATE ROUTE 12, Grades: KG-12)
- CHILDREN'S HOME OF WYOMING CONFERENCE (Students: 88, Location: 1182 CHENANGO ST, Grades: KG-12)
Biggest public elementary/middle schools in Binghamton:
- WEST MIDDLE SCHOOL (Students: 694, Location: W MIDDLE AVE, Grades: PK-8)
- PORT DICKINSON ELEMENTARY SCHOOL (Students: 638, Location: 221 CHENANGO BRIDGE RD, Grades: PK-3)
- EAST MIDDLE SCHOOL (Students: 585, Location: 167 E FREDERICK ST, Grades: 6-8)
- MACARTHUR SCHOOL (Students: 535, Location: 1051 CHENANGO ST, Grades: PK-5)
- BENJAMIN FRANKLIN ELEMENTARY SCHOOL (Students: 494, Location: 262 CONKLIN AVE, Grades: PK-5)
- WOODROW WILSON SCHOOL (Students: 442, Location: 287 PROSPECT ST, Grades: KG-5)
- CHENANGO BRIDGE ELEMENTARY SCHOOL (Students: 420, Location: 741 RIVER ROAD, Grades: 4-6)
- BROOKSIDE ELEMENTARY SCHOOL (Students: 408, Location: 3849 SADDLEMIRE RD, Grades: KG-5)
- THEODORE ROOSEVELT SCHOOL (Students: 403, Location: 9 OGDEN ST, Grades: PK-5)
- CALVIN COOLIDGE SCHOOL (Students: 379, Location: 261 ROBINSON ST, Grades: PK-5)
Private elementary/middle schools in Binghamton:
Libraries in Binghamton:
- BROOME COUNTY PUBLIC LIBRARY (Operating income: $2,459,997; Location: 185 COURT STREET; 174,645 books; 416 e-books; 11,952 audio materials; 10,426 video materials; 9 local licensed databases; 14 state licensed databases; 10 other licensed databases; 192 print serial subscriptions)
- FENTON FREE LIBRARY (Operating income: $85,628; Location: 1062 CHENANGO STREET; 28,895 books; 268 audio materials; 383 video materials; 14 state licensed databases; 10 other licensed databases; 33 print serial subscriptions)
User-submitted facts and corrections:
- Binghamton is the carousel capital of the country. The city has the most carousels of any city.
- Birthplace of Rod Serling (creator of the Twilight Zone) added by Jones
- Hospital in Binghamton, NY: Binghamton General Hospital (United Health Services)
- There are two hospitals in Binghamton, however the Binghamton Psych Center is just that - a psych center. Binghamton General Hospital is a traditional hospital in Binghamton. Additionally, Binghamton High School is IN Binghamton, as is Seton Catholic Central High School. Binghamton is also the birthplace of Rod Serling, creator of the Twilight Zone, renowned artist Anthony Brunelli and many, many others.
Points of interest:
Notable locations in Binghamton: Binghamton City Incinerator (A), Binghamton Water Works (B), Southern Tier Zoological Society (C), Ely Park Municipal Golf Course (D), Binghamton Fire Station Number 7 (E), Saint Michael's Recreation Center (F), Holy Spirit Parish Hall (G), Saint Joseph's Parish Hall (H), Binghamton Club (I), Lincoln Hall (J), River Mede Manor Rest Home (K), Binghamton West Side Fire Station (L), Crest Theatre (M), Woodlawn Nurses Home (N), Wagner Hall (O), Susquehanna Valley Home (P), Binghamton Fire Department Station 1 (Q), Binghamton Fire Department Station 2 (R), Saint John's Parish Hall (S), House of the Good Shepherd Home for Aged Women (T). Display/hide their locations on the map
Shopping Center: Binghamton Plaza Shopping Center (1). Display/hide its location on the map
Main business address in Binghamton include: BSB BANCORP INC (A), NEW YORK STATE ELECTRIC & GAS CORP (B). Display/hide their locations on the map
Churches in Binghamton include: Johnson City First Presbyterian Church (A), Church of God and Saints (B), Salvation Temple Church (C), Iglesia de Dios Monte Sinai (D), Oak Street Methodist Church (E), Italian Christian Apostolic Church (F), Trinity African Methodist Episcopal Zion Church (G), Saint Cyril and Methodius Roman Catholic Church (H), Sacred Heart Ukrainian Catholic Church (I). Display/hide their locations on the map
Cemetery: Spring Forest Cemetery (1). Display/hide its location on the map
Reservoir: South Mountain Reservoir (A). Display/hide its location on the map
Rivers and creeks: Park Creek (A), Bayless Creek (B), Brandywine Creek (C), Chenango River (D), Chamberlain Creek (E). Display/hide their locations on the map
Parks in Binghamton include: South Mountain Park (1), Ross Park (2), Ely Park (3), Johnson-McArthur Field (4), Southside Park (5), Veterans Memorial Park (6). Display/hide their locations on the map
Tourist attractions: Bundy Museum Galleries & Showroom (129 Main Street), Broome County Historical Society (Museums; 30 Front Street), Discovery Center of the Southern Tier (Cultural Attractions- Events- & Facilities; 60 Morgan Road), Catholic Schools of Broome County - Secondary Schools- Seton Catholic Central Lib (Cultural Attractions- Events- & Facilities; 70 Seminary Avenue).
Hotels: Best Western Binghamton Regen (One Sarbro Square), Clinton Hotel (20 Clinton Street), Del Motel (609 Upper Court St), Days Inn Binghamton (1000 Front Street), Econo Lodge Inn & Suites (690 Front Street), Dry Brook Inn (700 Castle Creek Road), Dorschel Gary (700 Front Street).
Courts: Broome County - Courts- County Court- Supreme & County (Court Clerks), New York State - Appellate Division Of Supreme Court Third Department (20 Hawley Street), New York State - Mental Hygiene Legal Service Third Judicial Departm (44 Hawley Street).
Birthplace of: Bridget Moynahan - Actress, Jack Sharkey - Boxer, Richard L. Thompson - Writer, Douglas H. Wheelock - Astronaut, Charlie Ahearn (director) - Film director, John C. Robinson - Army Medal of Honor recipient, Alec Dufty - Soccer player, Joseph J. Bartlett - Union Army general, John Mica - Politician, Jerry D'Amigo - Ice hockey player.
Drinking water stations with addresses in Binghamton and their reported violations in the past:
BINGHAMTON, CITY OF (Address: 38 Hawley Street , Population served: 47,600, Surface water):Past monitoring violations:CHENANGO CONSOLIDATED WD #1 (Population served: 9,200, Groundwater):
- Single Turbidity Exceed (Enhanced SWTR) - In SEP-2011, Contaminant: IESWTR. Follow-up actions: St Boil Water Order (SEP-08-2011), St Compliance achieved (SEP-12-2011)
- Follow-up Or Routine LCR Tap M/R - In JAN-01-2009, Contaminant: Lead and Copper Rule. Follow-up actions: St Violation/Reminder Notice (JAN-01-2012), St Compliance achieved (AUG-28-2012)
- 2 regular monitoring violations
Past health violations:BINGHAMTON (T) CONSOLIDATED WD (Address: 279 Park Ave , Population served: 2,600, Purch surface water):Past monitoring violations:
- MCL, Monthly (TCR) - In OCT-2012, Contaminant: Coliform. Follow-up actions: St Public Notif requested (NOV-07-2012), St Compliance achieved (NOV-28-2012), St Public Notif received (NOV-28-2012)
- MCL, Monthly (TCR) - In OCT-2011, Contaminant: Coliform. Follow-up actions: St Public Notif requested (OCT-28-2011), St Formal NOV issued (OCT-28-2011), St Public Notif received (DEC-01-2011), St Compliance achieved (DEC-02-2011)
- Follow-up Or Routine LCR Tap M/R - In OCT-01-2008, Contaminant: Lead and Copper Rule. Follow-up actions: St Compliance achieved (OCT-06-2008), St Public Notif requested (FEB-03-2009)
Past monitoring violations:GERMANIA MAENNERCHOR (Address: 218 Loughlin Road , Population served: 250, Groundwater):
- Follow-up Or Routine LCR Tap M/R - In OCT-01-1995, Contaminant: Lead and Copper Rule
Past monitoring violations:CASTLE CREEK ESTATES (Population served: 235, Groundwater):
- 3 routine major monitoring violations
Past monitoring violations:DORCHESTER PARK (Population served: 200, Groundwater):
- Follow-up Or Routine LCR Tap M/R - In JAN-01-2003, Contaminant: Lead and Copper Rule. Follow-up actions: St Public Notif requested (MAR-27-2006), St Formal NOV issued (MAR-27-2006), St Compliance achieved (AUG-28-2007)
Past monitoring violations:BLUE RIDGE PARK (Population served: 175, Groundwater):
- One routine major monitoring violation
Past monitoring violations:CREEKWOOD APARTMENTS (Population served: 110, Groundwater):
- Monitoring and Reporting (DBP) - Between JAN-2008 and DEC-2010, Contaminant: TTHM. Follow-up actions: St Violation/Reminder Notice (FEB-03-2011), St Compliance achieved (AUG-07-2011)
- Monitoring and Reporting (DBP) - Between JAN-2008 and DEC-2010, Contaminant: Total Haloacetic Acids (HAA5). Follow-up actions: St Violation/Reminder Notice (FEB-03-2011), St Compliance achieved (AUG-07-2011)
- 2 routine major monitoring violations
Past monitoring violations:
- One routine major monitoring violation
Drinking water stations with addresses in Binghamton that have no violations reported:
- GREENWOOD PARK CAMPGROUND (Population served: 500, Primary Water Source Type: Groundwater)
- MOUNTAIN TOP GROVE (Population served: 350, Primary Water Source Type: Groundwater)
- HIDDEN HOLLOW CAMPGROUND (Population served: 160, Primary Water Source Type: Groundwater)
- NATHANIEL COLE PARK (Population served: 150, Primary Water Source Type: Groundwater)
- QUICKWAY #51 OWEGO (Population served: 100, Primary Water Source Type: Groundwater)
- JACKSON PARK (Address: 279 Park Ave , Population served: 100, Primary Water Source Type: Groundwater)
- ROUND TOP PARK (Population served: 80, Primary Water Source Type: Groundwater)
- MANLEYS MIGHTY MART #24 - BINGHAMTON (T) (Population served: 50, Primary Water Source Type: Groundwater)
- ROSSIS PIZZA (Population served: 49, Primary Water Source Type: Groundwater)
- ROUTE 12 DINER (Population served: 30, Primary Water Source Type: Groundwater)
| This city: | 2.2 people |
| New York: | 2.6 people |
| This city: | 47.2% |
| Whole state: | 63.5% |
| This city: | 9.3% |
| Whole state: | 6.8% |
Likely homosexual households (counted as self-reported same-sex unmarried-partner households)
- Lesbian couples: 0.5% of all households
- Gay men: 0.4% of all households
People in group quarters in Binghamton in 2010:
- 458 people in nursing facilities/skilled-nursing facilities
- 175 people in mental (psychiatric) hospitals and psychiatric units in other hospitals
- 141 people in group homes intended for adults
- 128 people in hospitals with patients who have no usual home elsewhere
- 128 people in emergency and transitional shelters (with sleeping facilities) for people experiencing homelessness
- 75 people in other noninstitutional facilities
- 71 people in residential treatment centers for adults
- 63 people in group homes for juveniles (non-correctional)
- 21 people in correctional residential facilities
People in group quarters in Binghamton in 2000:
- 632 people in nursing homes
- 188 people in mental (psychiatric) hospitals or wards
- 172 people in other noninstitutional group quarters
- 73 people in other types of correctional institutions
- 68 people in homes for the mentally retarded
- 31 people in homes or halfway houses for drug/alcohol abuse
- 23 people in religious group quarters
- 19 people in other group homes
- 18 people in unknown juvenile institutions
- 15 people in homes for the mentally ill
- 5 people in other nonhousehold living situations
Banks with branches in Binghamton (2011 data):
- Manufacturers and Traders Trust Company: 7 branches. Info updated 2011/08/08: Bank assets: $76,887.1 mil, Deposits: $60,064.2 mil, headquarters in Buffalo, NY, positive income, Commercial Lending Specialization, 808 total offices, Holding Company: M&T Bank Corporation
- NBT Bank, National Association: Binghamton Downtown Branch, Binghamton East Side, Binghamton Branch. Info updated 2012/02/02: Bank assets: $5,558.5 mil, Deposits: $4,381.4 mil, headquarters in Norwich, NY, positive income, Commercial Lending Specialization, 133 total offices, Holding Company: Nbt Bancorp Inc.
- RBS Citizens, National Association: Binghamton West Branch at 247 Main Street, branch established on 1968/06/29; Binghamton Main Branch at 84 Court Street, branch established on 1981/01/30. Info updated 2007/09/19: Bank assets: $106,940.6 mil, Deposits: $75,690.2 mil, headquarters in Providence, RI, positive income, 1135 total offices, Holding Company: Uk Financial Investments Limited
- Tioga State Bank: Conklin Avenue Office Branch at 191 Conklin Ave, branch established on 2004/12/01; Upper Front Street Office Branch at 1430 Upper Front Street, branch established on 2004/04/20. Info updated 2006/11/03: Bank assets: $385.3 mil, Deposits: $303.8 mil, headquarters in Spencer, NY, positive income, Commercial Lending Specialization, 11 total offices, Holding Company: Tsb Services, Inc.
- HSBC Bank USA, National Association: Binghamton Downtown Branch at 65 Court Street, branch established on 1972/09/11; Binghamton West Side Branch at 282 Main Street, branch established on 1946/12/30. Info updated 2010/11/30: Bank assets: $206,009.7 mil, Deposits: $149,026.8 mil, headquarters in Mc Lean, VA, positive income, 474 total offices, Holding Company: Hsbc Holdings Plc
- Peoples Neighborhood Bank: Front Street Branch at 1229 Front Street, branch established on 2005/06/06. Info updated 2011/01/20: Bank assets: $620.8 mil, Deposits: $494.3 mil, headquarters in Hallstead, PA, positive income, Commercial Lending Specialization, 12 total offices, Holding Company: Peoples Financial Services Corp.
- Chemung Canal Trust Company: Binghamton Branch at 127 Court Street, branch established on 2007/09/13. Info updated 2011/06/07: Bank assets: $1,213.6 mil, Deposits: $1,000.4 mil, headquarters in Elmira, NY, positive income, Commercial Lending Specialization, 28 total offices, Holding Company: Chemung Financial Corporation
- JPMorgan Chase Bank, National Association: Binghamton Middle Market Branch at 2 Court Street, 2nd Floor, branch established on 1999/09/27. Info updated 2011/11/10: Bank assets: $1,811,678.0 mil, Deposits: $1,190,738.0 mil, headquarters in Columbus, OH, positive income, International Specialization, 5577 total offices, Holding Company: Jpmorgan Chase & Co.
For population 15 years and over in Binghamton:
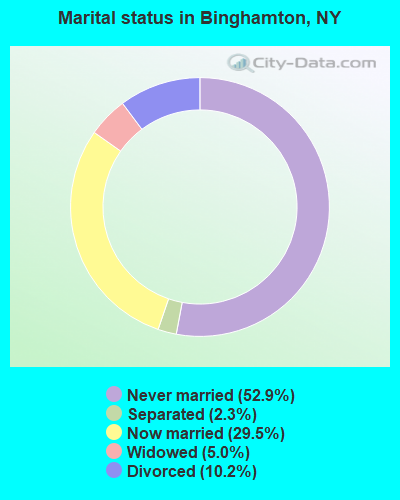
- Never married: 52.9%
- Now married: 29.5%
- Separated: 2.3%
- Widowed: 5.0%
- Divorced: 10.2%
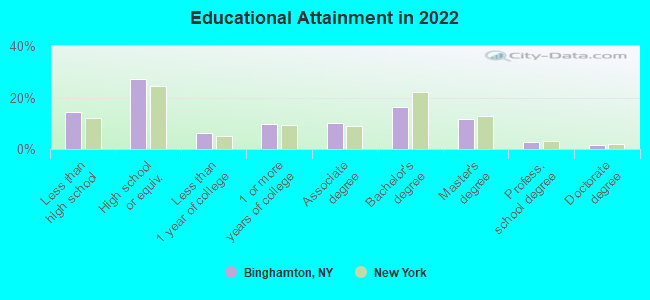
For population 25 years and over in Binghamton:
- High school or higher: 86.0%
- Bachelor's degree or higher: 30.7%
- Graduate or professional degree: 15.1%
- Unemployed: 6.7%
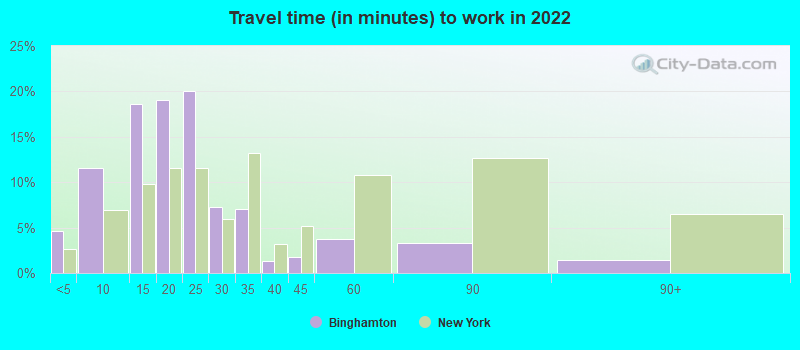
- Mean travel time to work (commute): 17.7 minutes
| Here: | 12.9 |
| New York average: | 13.9 |
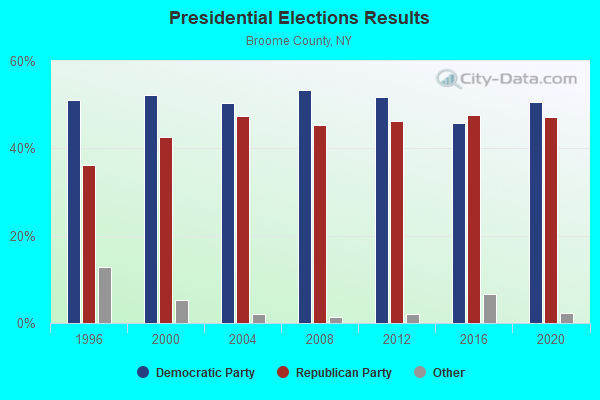
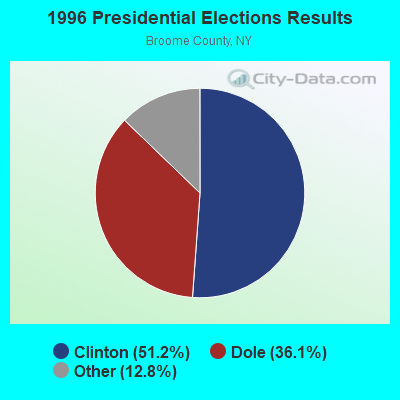
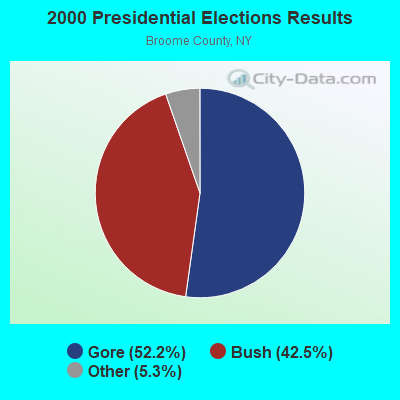
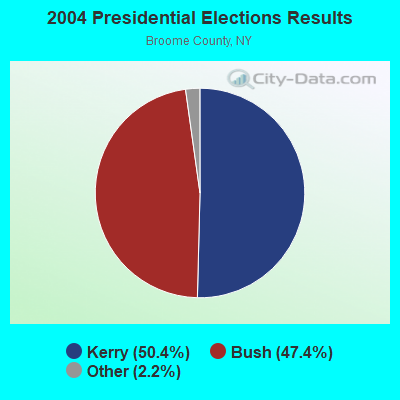
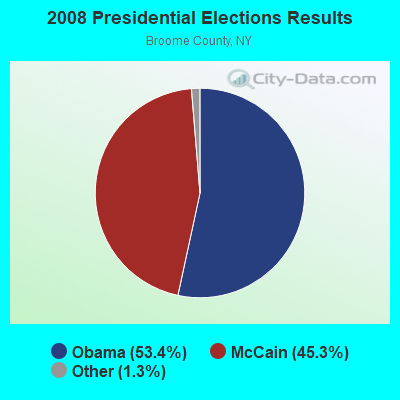

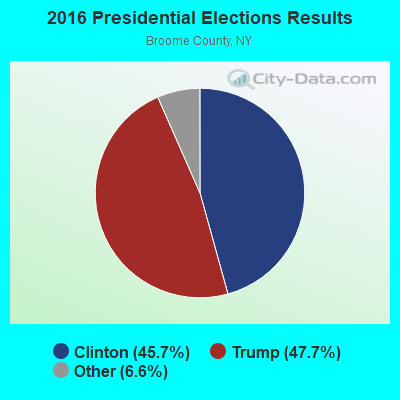
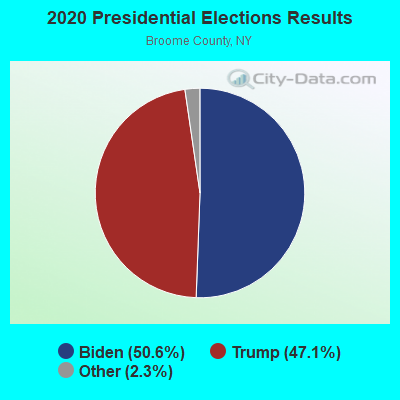
Graphs represent county-level data. Detailed 2008 Election Results
Religion statistics for Binghamton, NY (based on Broome County data)
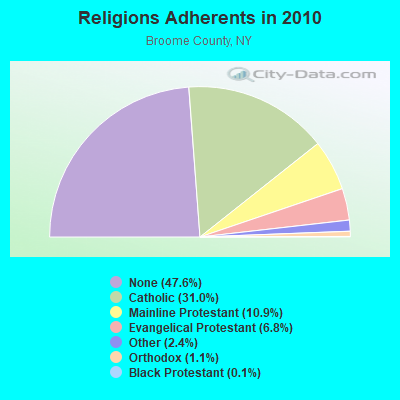
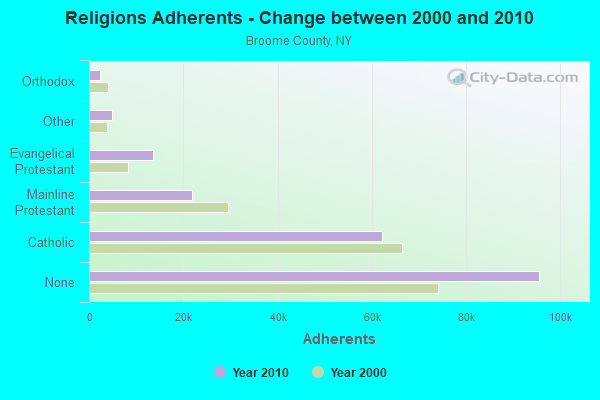
| Religion | Adherents | Congregations |
|---|---|---|
| Catholic | 62,220 | 34 |
| Mainline Protestant | 21,823 | 82 |
| Evangelical Protestant | 13,541 | 84 |
| Other | 4,900 | 18 |
| Orthodox | 2,285 | 9 |
| Black Protestant | 295 | 2 |
| None | 95,536 | - |
Food Environment Statistics:
| Broome County: | 1.64 / 10,000 pop. |
| State: | 4.13 / 10,000 pop. |
| This county: | 0.10 / 10,000 pop. |
| New York: | 0.06 / 10,000 pop. |
| This county: | 0.67 / 10,000 pop. |
| New York: | 0.92 / 10,000 pop. |
| This county: | 4.14 / 10,000 pop. |
| State: | 1.68 / 10,000 pop. |
| This county: | 8.13 / 10,000 pop. |
| New York: | 8.82 / 10,000 pop. |
| Broome County: | 8.6% |
| New York: | 8.2% |
| This county: | 27.0% |
| State: | 23.8% |
| Broome County: | 14.7% |
| State: | 15.6% |
Health and Nutrition:
| Binghamton: | 50.7% |
| New York: | 50.1% |
| This city: | 48.1% |
| State: | 48.1% |
| Binghamton: | 28.3 |
| State: | 28.5 |
| Binghamton: | 20.6% |
| New York: | 20.3% |
| Binghamton: | 11.2% |
| State: | 11.1% |
| Binghamton: | 6.9 |
| State: | 6.8 |
| Binghamton: | 32.8% |
| State: | 33.4% |
| Binghamton: | 56.7% |
| New York: | 56.5% |
| This city: | 78.6% |
| New York: | 80.2% |
More about Health and Nutrition of Binghamton, NY Residents
| Local government employment and payroll (March 2022) | |||||
| Function | Full-time employees | Monthly full-time payroll | Average yearly full-time wage | Part-time employees | Monthly part-time payroll |
|---|---|---|---|---|---|
| Police Protection - Officers | 142 | $1,145,282 | $96,784 | 0 | $0 |
| Firefighters | 110 | $869,008 | $94,801 | 0 | $0 |
| Housing and Community Development (Local) | 43 | $177,509 | $49,537 | 1 | $1,691 |
| Other and Unallocable | 38 | $169,200 | $53,432 | 0 | $0 |
| Streets and Highways | 37 | $169,694 | $55,036 | 0 | $0 |
| Water Supply | 32 | $144,712 | $54,267 | 0 | $0 |
| Parks and Recreation | 29 | $121,531 | $50,289 | 6 | $4,338 |
| Solid Waste Management | 26 | $108,389 | $50,026 | 0 | $0 |
| Financial Administration | 23 | $99,822 | $52,081 | 0 | $0 |
| Other Government Administration | 19 | $86,302 | $54,507 | 12 | $7,352 |
| Sewerage | 12 | $49,485 | $49,485 | 0 | $0 |
| Police - Other | 10 | $37,822 | $45,386 | 36 | $29,158 |
| Judicial and Legal | 5 | $28,443 | $68,263 | 0 | $0 |
| Fire - Other | 2 | $9,229 | $55,374 | 0 | $0 |
| Health | 2 | $6,353 | $38,118 | 0 | $0 |
| Totals for Government | 530 | $3,222,781 | $72,969 | 55 | $42,539 |
Binghamton government finances - Expenditure in 2021 (per resident):
- Construction - General - Other: $9,881,000 ($209.72)
Regular Highways: $6,528,000 ($138.55)
Sewerage: $2,749,000 ($58.35)
General Public Buildings: $2,529,000 ($53.68)
Water Utilities: $1,858,000 ($39.44)
Parks and Recreation: $1,560,000 ($33.11)
Local Fire Protection: $1,156,000 ($24.54)
Police Protection: $438,000 ($9.30)
Solid Waste Management: $270,000 ($5.73)
Electric Utilities: $163,000 ($3.46)
- Current Operations - Sewerage: $29,627,000 ($628.82)
General - Other: $24,056,000 ($510.58)
Police Protection: $12,206,000 ($259.07)
Local Fire Protection: $10,351,000 ($219.70)
Water Utilities: $4,083,000 ($86.66)
Solid Waste Management: $3,576,000 ($75.90)
Housing and Community Development: $2,096,000 ($44.49)
Regular Highways: $2,057,000 ($43.66)
Parks and Recreation: $1,869,000 ($39.67)
Financial Administration: $1,036,000 ($21.99)
Libraries: $750,000 ($15.92)
Protective Inspection and Regulation - Other: $748,000 ($15.88)
Central Staff Services: $734,000 ($15.58)
General Public Buildings: $665,000 ($14.11)
Parking Facilities: $562,000 ($11.93)
Judicial and Legal Services: $267,000 ($5.67)
Health - Other: $156,000 ($3.31)
Electric Utilities: $19,000 ($0.40)
- General - Interest on Debt: $11,575,000 ($245.68)
- Other Capital Outlay - Sewerage: $13,680,000 ($290.35)
General - Other: $700,000 ($14.86)
Police Protection: $84,000 ($1.78)
Local Fire Protection: $32,000 ($0.68)
Parks and Recreation: $10,000 ($0.21)
Water Utilities: $5,000 ($0.11)
Solid Waste Management: $4,000 ($0.08)
Financial Administration: $1,000 ($0.02)
General Public Building: $1,000 ($0.02)
Parking Facilities: $1,000 ($0.02)
- Total Salaries and Wages: $35,258,000 ($748.34)
- Water Utilities - Interest on Debt: $337,000 ($7.15)
Binghamton government finances - Revenue in 2021 (per resident):
- Charges - Sewerage: $11,025,000 ($234.00)
Other: $1,370,000 ($29.08)
Parking Facilities: $1,175,000 ($24.94)
Solid Waste Management: $1,117,000 ($23.71)
Parks and Recreation: $8,000 ($0.17)
- Federal Intergovernmental - Housing and Community Development: $2,764,000 ($58.66)
Other: $1,881,000 ($39.92)
Health and Hospitals: $12,000 ($0.25)
- Local Intergovernmental - Other: $29,588,000 ($628.00)
General Local Government Support: $12,295,000 ($260.96)
- Miscellaneous - General Revenue - Other: $2,166,000 ($45.97)
Donations From Private Sources: $405,000 ($8.60)
Fines and Forfeits: $374,000 ($7.94)
Interest Earnings: $148,000 ($3.14)
Sale of Property: $56,000 ($1.19)
Rents: $25,000 ($0.53)
- Revenue - Water Utilities: $6,521,000 ($138.41)
- State Intergovernmental - Other: $11,060,000 ($234.74)
General Local Government Support: $9,249,000 ($196.31)
Highways: $1,682,000 ($35.70)
Education: $160,000 ($3.40)
- Tax - Property: $34,058,000 ($722.87)
Public Utilities Sales: $925,000 ($19.63)
Other License: $613,000 ($13.01)
Occupation and Business License - Other: $34,000 ($0.72)
Other: $14,000 ($0.30)
Amusements License: $1,000 ($0.02)
Binghamton government finances - Debt in 2021 (per resident):
- Long Term Debt - Beginning Outstanding - Unspecified Public Purpose: $182,233,000 ($3867.83)
Outstanding Unspecified Public Purpose: $172,946,000 ($3670.72)
Retired Unspecified Public Purpose: $17,412,000 ($369.56)
Issue, Unspecified Public Purpose: $8,125,000 ($172.45)
- Short Term Debt Outstanding - End of Fiscal Year: $65,403,000 ($1388.16)
Beginning: $57,977,000 ($1230.54)
Binghamton government finances - Cash and Securities in 2021 (per resident):
- Bond Funds - Cash and Securities: $21,828,000 ($463.29)
- Other Funds - Cash and Securities: $25,250,000 ($535.92)
| Businesses in Binghamton, NY | ||||
| Name | Count | Name | Count | |
|---|---|---|---|---|
| AT&T | 1 | Lane Furniture | 2 | |
| Advance Auto Parts | 3 | Little Caesars Pizza | 1 | |
| Applebee's | 1 | Lowe's | 1 | |
| Arby's | 2 | Marriott | 1 | |
| AutoZone | 2 | MasterBrand Cabinets | 6 | |
| Burger King | 3 | McDonald's | 4 | |
| CVS | 7 | Motel 6 | 1 | |
| Chevrolet | 1 | Motherhood Maternity | 1 | |
| Cold Stone Creamery | 1 | Nike | 1 | |
| Comfort Inn | 1 | Payless | 1 | |
| Cracker Barrel | 1 | Penske | 1 | |
| Curves | 1 | Pizza Hut | 2 | |
| DHL | 1 | RadioShack | 2 | |
| Days Inn | 1 | Rite Aid | 3 | |
| Dennys | 1 | Ryder Rental & Truck Leasing | 1 | |
| Domino's Pizza | 1 | Staples | 1 | |
| Dunkin Donuts | 5 | Starbucks | 1 | |
| Econo Lodge | 1 | Subway | 9 | |
| Fashion Bug | 1 | Super 8 | 1 | |
| FedEx | 8 | T-Mobile | 2 | |
| Firestone Complete Auto Care | 1 | Taco Bell | 1 | |
| GNC | 1 | True Value | 1 | |
| H&R Block | 4 | U-Haul | 5 | |
| Holiday Inn | 1 | UPS | 13 | |
| KFC | 2 | Walgreens | 1 | |
| Kmart | 1 | Wendy's | 3 | |
| La-Z-Boy | 1 | YMCA | 2 | |
Strongest AM radio stations in Binghamton:
- WINR (680 AM; 5 kW; BINGHAMTON, NY; Owner: CLEVELAND RADIO LICENSES, LLC)
- WYOS (1360 AM; 5 kW; BINGHAMTON, NY; Owner: CITADEL BROADCASTING COMPANY)
- WNBF (1290 AM; 9 kW; BINGHAMTON, NY; Owner: CITADEL BROADCASTING COMPANY)
- WENE (1430 AM; 5 kW; ENDICOTT, NY; Owner: CLEAR CHANNEL BROADCASTING LICENSES, INC.)
- WEBO (1330 AM; 5 kW; OWEGO, NY; Owner: TIOGA MEDIA, INC.)
- WATS (960 AM; 5 kW; SAYRE, PA; Owner: WATS BROADCASTING, INC.)
- WGY (810 AM; 50 kW; SCHENECTADY, NY; Owner: CLEAR CHANNEL BROADCASTING LICENSES, INC.)
- WWJZ (640 AM; 50 kW; MOUNT HOLLY, NJ; Owner: ABC, INC.)
- WHCU (870 AM; 5 kW; ITHACA, NY; Owner: EAGLE BROADCASTING COMPANY, INC.)
- WMCA (570 AM; 50 kW; NEW YORK, NY; Owner: SALEM MEDIA OF NEW YORK, LLC)
- WARM (590 AM; 5 kW; SCRANTON, PA; Owner: CITADEL BROADCASTING COMPANY)
- WOR (710 AM; 50 kW; NEW YORK, NY; Owner: BUCKLEY BROADCASTING CORPORATION)
- WABC (770 AM; 50 kW; NEW YORK, NY; Owner: WABC-AM RADIO, INC.)
Strongest FM radio stations in Binghamton:
- WSQX-FM (91.5 FM; BINGHAMTON, NY; Owner: WSKG PUBLIC TELECOMMUNICATIONS CNCL.)
- WHWK (98.1 FM; BINGHAMTON, NY; Owner: CITADEL BROADCASTING COMPANY)
- WSKG-FM (89.3 FM; BINGHAMTON, NY; Owner: WSKG PUB.TELECOMMUNICATIONS COUNCIL)
- WAAL (99.1 FM; BINGHAMTON, NY; Owner: CITADEL BROADCASTING COMPANY)
- WMXW (103.3 FM; VESTAL, NY; Owner: CLEAR CHANNEL BROADCASTING LICENSES, INC.)
- WKGB-FM (92.5 FM; CONKLIN, NY; Owner: CLEAR CHANNEL BROADCASTING LICENSES, INC.)
- WWYL (104.1 FM; CHENANGO BRIDGE, NY; Owner: CITADEL BROADCASTING COMPANY)
- W273AB (102.5 FM; OWEGO, NY; Owner: WEBO RADIO, INC.)
- W285DI (104.9 FM; BINGHAMTON, NY; Owner: CSN INTERNATIONAL)
- W293AC (106.5 FM; BINGHAMTON, NY; Owner: MONTROSE BROADCASTING CORPORATION)
- WMRV-FM (105.7 FM; ENDICOTT, NY; Owner: CLEAR CHANNEL BROADCASTING LICENSES, INC.)
- WBBI (107.5 FM; ENDWELL, NY; Owner: CLEAR CHANNEL BROADCASTING LICENSES, INC.)
- WCDW (100.5 FM; CONKLIN, NY; Owner: EQUINOX BROADCASTING CORPORATION)
- WLTB (101.7 FM; JOHNSON CITY, NY; Owner: GM BROADCASTING, INC.)
- WIFF (90.1 FM; BINGHAMTON, NY; Owner: CSN INTERNATIONAL)
- W221AX (92.1 FM; ENDWELL, NY; Owner: CLEAR CHANNEL BROADCASTING LICENSES, INC.)
- WCII (88.5 FM; SPENCER, NY; Owner: FAMILY LIFE MINISTRIES, INC.)
- WPEL-FM (96.5 FM; MONTROSE, PA; Owner: MONTROSE BROADCASTING CORP.)
- WIYN (94.7 FM; DEPOSIT, NY; Owner: BANJO COMMUNICATIONS GROUP, INC.)
- WBKT (95.3 FM; NORWICH, NY; Owner: BANJO COMMUNICATIONS GROUP, INC)
TV broadcast stations around Binghamton:
- WSKG-TV (Channel 46; BINGHAMTON, NY; Owner: WSKG PUBLIC TELECOMMUNICATIONS COUNCIL)
- WICZ-TV (Channel 40; BINGHAMTON, NY; Owner: STAINLESS BROADCASTING, L.P.)
- WBNG-TV (Channel 12; BINGHAMTON, NY; Owner: TELEVISION STATION GROUP LICENSE SUBSIDIARY, LLC)
- WIVT (Channel 34; BINGHAMTON, NY; Owner: CENTRAL NY NEWS, INC.)
- W26BS (Channel 14; BINGHAMTON, NY; Owner: TRINITY BROADCASTING NETWORK)
- WBPN-LP (Channel 10; BINGHAMTON, NY; Owner: STAINLESS BROADCASTING, L.P.)
- WBGH-CA (Channel 20; BINGHAMTON, NY; Owner: CENTRAL NY NEWS, INC.)
Medal of Honor Recipients
Medal of Honor Recipients born in Binghamton: John C. Robinson, Lester R., Jr. Stone.
- National Bridge Inventory (NBI) Statistics
- 107Number of bridges
- 1,627ft / 496mTotal length
- $323,937,000Total costs
- 980,829Total average daily traffic
- 69,340Total average daily truck traffic
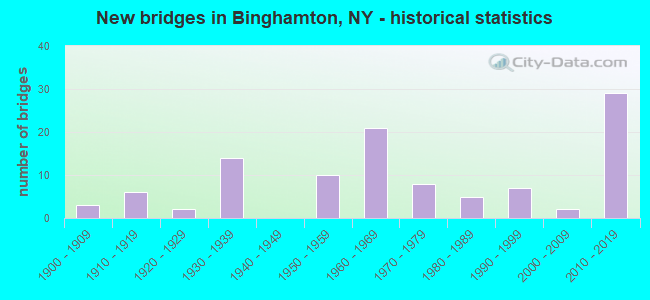
- New bridges - historical statistics
- 31900-1909
- 61910-1919
- 21920-1929
- 141930-1939
- 101950-1959
- 211960-1969
- 81970-1979
- 51980-1989
- 71990-1999
- 22000-2009
- 292010-2019
FCC Registered Antenna Towers: 174 (See the full list of FCC Registered Antenna Towers)
FCC Registered Commercial Land Mobile Towers: 7 (See the full list of FCC Registered Commercial Land Mobile Towers in Binghamton, NY)
FCC Registered Private Land Mobile Towers: 11 (See the full list of FCC Registered Private Land Mobile Towers)
FCC Registered Broadcast Land Mobile Towers: 96 (See the full list of FCC Registered Broadcast Land Mobile Towers)
FCC Registered Microwave Towers: 95 (See the full list of FCC Registered Microwave Towers in this town)
FCC Registered Paging Towers: 16 (See the full list of FCC Registered Paging Towers)
FCC Registered Maritime Coast & Aviation Ground Towers: 18 (See the full list of FCC Registered Maritime Coast & Aviation Ground Towers)
FCC Registered Amateur Radio Licenses: 360 (See the full list of FCC Registered Amateur Radio Licenses in Binghamton)
FAA Registered Aircraft Manufacturers and Dealers: 2 (See the full list of FAA Registered Manufacturers and Dealers in Binghamton)
FAA Registered Aircraft: 41 (See the full list of FAA Registered Aircraft)
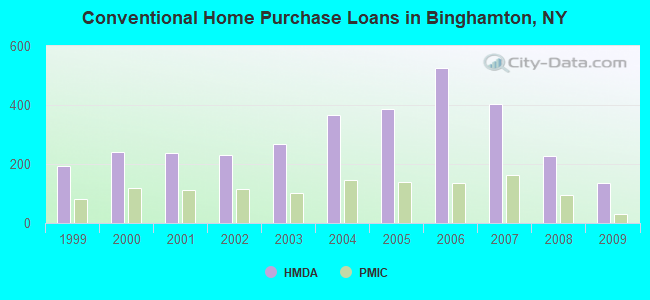
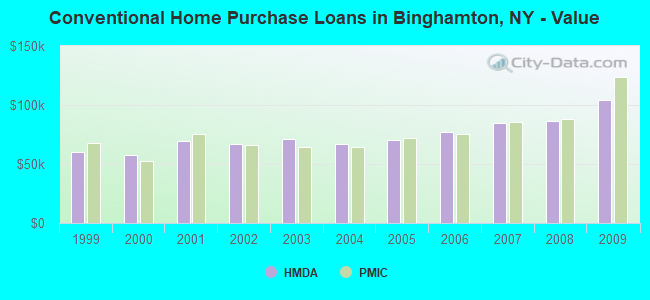
| Home Mortgage Disclosure Act Aggregated Statistics For Year 2009 (Based on 16 full tracts) | ||||||||||||||
| A) FHA, FSA/RHS & VA Home Purchase Loans | B) Conventional Home Purchase Loans | C) Refinancings | D) Home Improvement Loans | E) Loans on Dwellings For 5+ Families | F) Non-occupant Loans on < 5 Family Dwellings (A B C & D) | G) Loans On Manufactured Home Dwelling (A B C & D) | ||||||||
|---|---|---|---|---|---|---|---|---|---|---|---|---|---|---|
| Number | Average Value | Number | Average Value | Number | Average Value | Number | Average Value | Number | Average Value | Number | Average Value | Number | Average Value | |
| LOANS ORIGINATED | 139 | $93,935 | 137 | $103,825 | 246 | $95,378 | 65 | $27,892 | 11 | $248,364 | 41 | $88,366 | 1 | $143,000 |
| APPLICATIONS APPROVED, NOT ACCEPTED | 7 | $112,714 | 12 | $100,833 | 27 | $99,259 | 9 | $7,556 | 6 | $179,667 | 6 | $56,667 | 0 | $0 |
| APPLICATIONS DENIED | 13 | $95,308 | 30 | $124,567 | 140 | $81,450 | 87 | $17,828 | 11 | $211,727 | 27 | $86,481 | 2 | $86,000 |
| APPLICATIONS WITHDRAWN | 13 | $101,769 | 25 | $92,280 | 95 | $87,453 | 21 | $25,190 | 0 | $0 | 7 | $65,429 | 1 | $1,000 |
| FILES CLOSED FOR INCOMPLETENESS | 3 | $87,333 | 4 | $150,500 | 14 | $122,857 | 3 | $14,000 | 0 | $0 | 1 | $60,000 | 0 | $0 |
Detailed mortgage data for all 16 tracts in Binghamton, NY
| Private Mortgage Insurance Companies Aggregated Statistics For Year 2009 (Based on 13 full tracts) | ||||||
| A) Conventional Home Purchase Loans | B) Refinancings | C) Non-occupant Loans on < 5 Family Dwellings (A & B) | ||||
|---|---|---|---|---|---|---|
| Number | Average Value | Number | Average Value | Number | Average Value | |
| LOANS ORIGINATED | 31 | $124,097 | 16 | $124,312 | 0 | $0 |
| APPLICATIONS APPROVED, NOT ACCEPTED | 14 | $101,571 | 5 | $161,400 | 1 | $34,000 |
| APPLICATIONS DENIED | 8 | $113,000 | 0 | $0 | 0 | $0 |
| APPLICATIONS WITHDRAWN | 1 | $87,000 | 1 | $75,000 | 0 | $0 |
| FILES CLOSED FOR INCOMPLETENESS | 0 | $0 | 0 | $0 | 0 | $0 |
2002 - 2018 National Fire Incident Reporting System (NFIRS) incidents
- Fire incident types reported to NFIRS in Binghamton, NY
- 1,85549.2%Structure Fires
- 1,03227.3%Outside Fires
- 58915.6%Mobile Property/Vehicle Fires
- 2987.9%Other
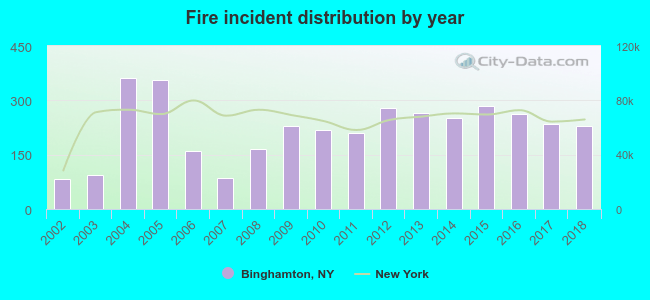 According to the data from the years 2002 - 2018 the average number of fire incidents per year is 222. The highest number of reported fire incidents - 362 took place in 2004, and the least - 83 in 2002. The data has an increasing trend.
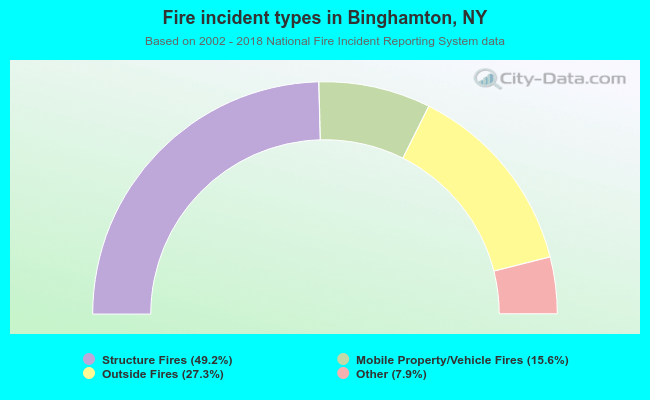 When looking into fire subcategories, the most reports belonged to: Structure Fires (49.2%), and Outside Fires (27.3%).
Fire-safe hotels and motels in Binghamton, New York:
- Doubletree By Hilton Binghamton, 225 Water St, Binghamton, New York 13901 , Phone: (607) 722-7575
- Super 8 Motel, 650 Old Front St, Binghamton, New York 13905 , Phone: (607) 773-8111, Fax: (607) 773-8111
- Comfort Inn, 1000 Uppr Front St, Binghamton, New York 13905 , Phone: (607) 724-3297, Fax: (607) 771-0206
- Days Inn, 65 Front St, Binghamton, New York 13905 , Phone: (607) 724-2412, Fax: (607) 722-4000
- Thru Way Motel, 399 CT St, Binghamton, New York 13904 , Phone: (607) 724-2401
- Broome County Ymca, 61 Susquehanna St, Binghamton, New York 13901 , Phone: (607) 772-0560, Fax: (607) 772-0563
- Howard Johnson, 1156 Uppr Front St, Binghamton, New York 13905 , Phone: (607) 722-5353, Fax: (607) 722-1823
- Econo Lodge Inn & Suites, 690 Front St, Binghamton, New York 13905 , Phone: (607) 724-1341, Fax: (607) 773-8287
- 2 other hotels and motels
| Most common first names in Binghamton, NY among deceased individuals | ||
| Name | Count | Lived (average) |
|---|---|---|
| Mary | 1,263 | 81.1 years |
| John | 1,238 | 74.4 years |
| William | 747 | 74.5 years |
| Helen | 675 | 79.8 years |
| Joseph | 650 | 75.2 years |
| Anna | 611 | 83.4 years |
| Robert | 580 | 71.7 years |
| George | 562 | 75.5 years |
| James | 524 | 72.1 years |
| Charles | 492 | 75.2 years |
| Most common last names in Binghamton, NY among deceased individuals | ||
| Last name | Count | Lived (average) |
|---|---|---|
| Smith | 335 | 77.8 years |
| Brown | 175 | 75.9 years |
| Miller | 144 | 74.9 years |
| Williams | 132 | 76.7 years |
| Johnson | 123 | 78.1 years |
| Jones | 121 | 76.3 years |
| Davis | 104 | 74.0 years |
| Clark | 98 | 77.8 years |
| Lewis | 96 | 78.0 years |
| Sullivan | 88 | 77.0 years |
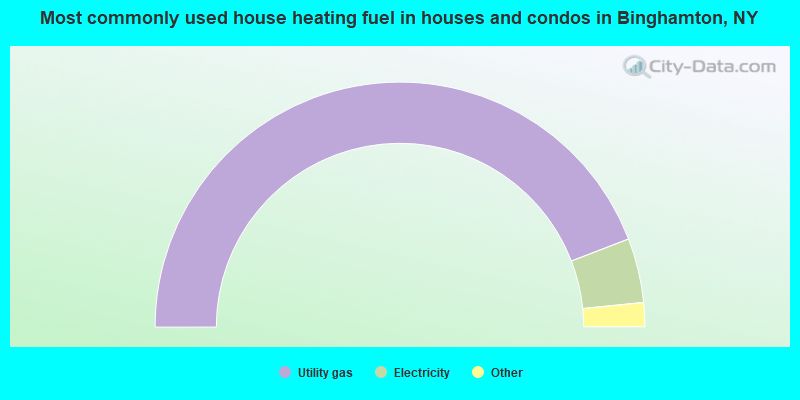
- 88.4%Utility gas
- 8.5%Electricity
- 1.4%Bottled, tank, or LP gas
- 0.7%Fuel oil, kerosene, etc.
- 0.6%No fuel used
- 0.3%Other fuel
- 0.2%Wood
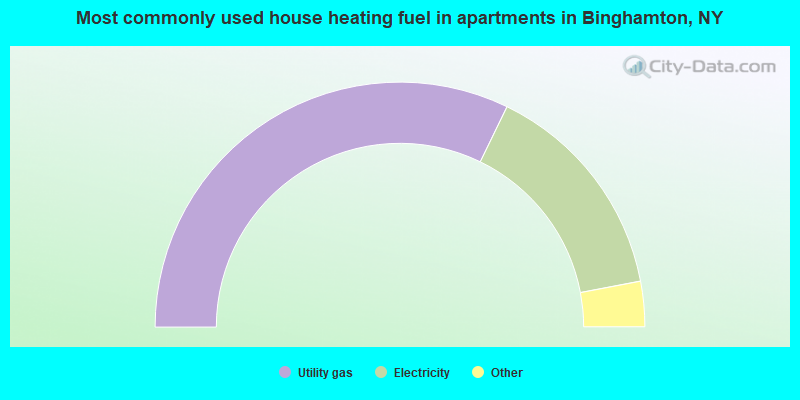
- 64.4%Utility gas
- 29.6%Electricity
- 1.9%Bottled, tank, or LP gas
- 1.6%No fuel used
- 1.4%Fuel oil, kerosene, etc.
- 0.7%Other fuel
- 0.4%Solar energy
Binghamton compared to New York state average:
- Median household income below state average.
- Median house value significantly below state average.
- Unemployed percentage below state average.
- Hispanic race population percentage below state average.
- Median age below state average.
- Foreign-born population percentage below state average.
- Length of stay since moving in significantly above state average.
- Number of college students above state average.
Binghamton on our top lists:
- #74 on the list of "Top 101 cities with the most residents born in Iraq (population 500+)"
- #74 on the list of "Top 101 cities where the highest percentage of males (15+ years) which never married (with at least 10,000 males in this group)"
- #80 on the list of "Top 101 cities with largest percentage of males in industries: broadcasting, internet publishing, and telecommunications services (population 5,000+)"
- #80 on the list of "Top 101 cities with largest percentage of females in industries: broadcasting, internet publishing, and telecommunications services (population 5,000+)"
- #80 on the list of "Top 101 cities with largest percentage of males in industries: wholesale electronic markets and agents and brokers (population 5,000+)"
- #80 on the list of "Top 101 cities with largest percentage of females in industries: wholesale electronic markets and agents and brokers (population 5,000+)"
- #82 on the list of "Top 101 cities with largest percentage of females in occupations: extraction workers (population 5,000+)"
- #89 on the list of "Top 101 cities with largest percentage of females in industries: farm product raw materials merchant wholesalers (population 5,000+)"
- #91 on the list of "Top 101 cities with largest percentage of females in occupations: fishing and hunting, and forest and logging workers (population 5,000+)"
- #4 on the list of "Top 101 counties with the largest number of people moving out compared to moving in (pop. 50,000+)"
- #52 on the list of "Top 101 counties with the lowest percentage of residents relocating from other counties between 2010 and 2011"
- #68 on the list of "Top 101 counties with the lowest number of births per 1000 residents 2007-2013"
- #74 on the list of "Top 101 counties with highest percentage of residents voting for 3rd party candidates in the 2012 Presidential Election (pop. 50,000+)"
- #75 on the list of "Top 101 counties with the most Orthodox congregations (pop. 50,000+)"

|
|
Total of 388 patent applications in 2008-2024.