Blue Eye, Missouri Submit your own pictures of this town and show them to the world
OSM Map
General Map
Google Map
MSN Map
OSM Map
General Map
Google Map
MSN Map
OSM Map
General Map
Google Map
MSN Map
OSM Map
General Map
Google Map
MSN Map
Please wait while loading the map...
Population in 2022: 297 (0% urban, 100% rural). Population change since 2000: +130.2%Males: 121 Females: 176
March 2022 cost of living index in Blue Eye: 77.4 (low, U.S. average is 100) Percentage of residents living in poverty in 2022: 8.7%for White Non-Hispanic residents , 100.0% for Hispanic or Latino residents , 100.0% for other race residents , 37.4% for two or more races residents )
Profiles of local businesses
Business Search - 14 Million verified businesses
Data:
Median household income ($)
Median household income (% change since 2000)
Household income diversity
Ratio of average income to average house value (%)
Ratio of average income to average rent
Median household income ($) - White
Median household income ($) - Black or African American
Median household income ($) - Asian
Median household income ($) - Hispanic or Latino
Median household income ($) - American Indian and Alaska Native
Median household income ($) - Multirace
Median household income ($) - Other Race
Median household income for houses/condos with a mortgage ($)
Median household income for apartments without a mortgage ($)
Races - White alone (%)
Races - White alone (% change since 2000)
Races - Black alone (%)
Races - Black alone (% change since 2000)
Races - American Indian alone (%)
Races - American Indian alone (% change since 2000)
Races - Asian alone (%)
Races - Asian alone (% change since 2000)
Races - Hispanic (%)
Races - Hispanic (% change since 2000)
Races - Native Hawaiian and Other Pacific Islander alone (%)
Races - Native Hawaiian and Other Pacific Islander alone (% change since 2000)
Races - Two or more races (%)
Races - Two or more races (% change since 2000)
Races - Other race alone (%)
Races - Other race alone (% change since 2000)
Racial diversity
Unemployment (%)
Unemployment (% change since 2000)
Unemployment (%) - White
Unemployment (%) - Black or African American
Unemployment (%) - Asian
Unemployment (%) - Hispanic or Latino
Unemployment (%) - American Indian and Alaska Native
Unemployment (%) - Multirace
Unemployment (%) - Other Race
Population density (people per square mile)
Population - Males (%)
Population - Females (%)
Population - Males (%) - White
Population - Males (%) - Black or African American
Population - Males (%) - Asian
Population - Males (%) - Hispanic or Latino
Population - Males (%) - American Indian and Alaska Native
Population - Males (%) - Multirace
Population - Males (%) - Other Race
Population - Females (%) - White
Population - Females (%) - Black or African American
Population - Females (%) - Asian
Population - Females (%) - Hispanic or Latino
Population - Females (%) - American Indian and Alaska Native
Population - Females (%) - Multirace
Population - Females (%) - Other Race
Coronavirus confirmed cases (Jun 15, 2024)
Deaths caused by coronavirus (Jun 15, 2024)
Coronavirus confirmed cases (per 100k population) (Jun 15, 2024)
Deaths caused by coronavirus (per 100k population) (Jun 15, 2024)
Daily increase in number of cases (Jun 15, 2024)
Weekly increase in number of cases (Jun 15, 2024)
Cases doubled (in days) (Jun 15, 2024)
Hospitalized patients (Apr 18, 2022)
Negative test results (Apr 18, 2022)
Total test results (Apr 18, 2022)
COVID Vaccine doses distributed (per 100k population) (Sep 19, 2023)
COVID Vaccine doses administered (per 100k population) (Sep 19, 2023)
COVID Vaccine doses distributed (Sep 19, 2023)
COVID Vaccine doses administered (Sep 19, 2023)
Likely homosexual households (%)
Likely homosexual households (% change since 2000)
Likely homosexual households - Lesbian couples (%)
Likely homosexual households - Lesbian couples (% change since 2000)
Likely homosexual households - Gay men (%)
Likely homosexual households - Gay men (% change since 2000)
Cost of living index
Median gross rent ($)
Median contract rent ($)
Median monthly housing costs ($)
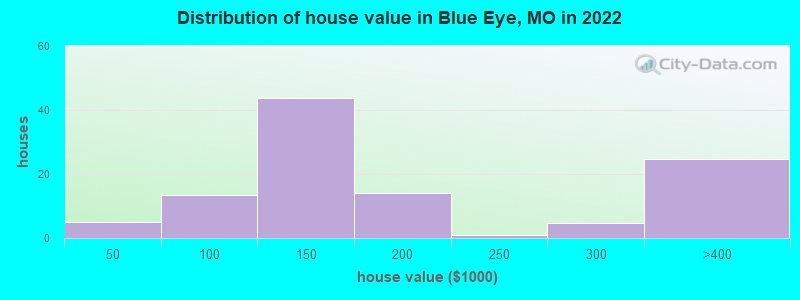
Median house or condo value ($)
Median house or condo value ($ change since 2000)
Mean house or condo value by units in structure - 1, detached ($)
Mean house or condo value by units in structure - 1, attached ($)
Mean house or condo value by units in structure - 2 ($)
Mean house or condo value by units in structure by units in structure - 3 or 4 ($)
Mean house or condo value by units in structure - 5 or more ($)
Mean house or condo value by units in structure - Boat, RV, van, etc. ($)
Mean house or condo value by units in structure - Mobile home ($)
Median house or condo value ($) - White
Median house or condo value ($) - Black or African American
Median house or condo value ($) - Asian
Median house or condo value ($) - Hispanic or Latino
Median house or condo value ($) - American Indian and Alaska Native
Median house or condo value ($) - Multirace
Median house or condo value ($) - Other Race
Median resident age
Resident age diversity
Median resident age - Males
Median resident age - Females
Median resident age - White
Median resident age - Black or African American
Median resident age - Asian
Median resident age - Hispanic or Latino
Median resident age - American Indian and Alaska Native
Median resident age - Multirace
Median resident age - Other Race
Median resident age - Males - White
Median resident age - Males - Black or African American
Median resident age - Males - Asian
Median resident age - Males - Hispanic or Latino
Median resident age - Males - American Indian and Alaska Native
Median resident age - Males - Multirace
Median resident age - Males - Other Race
Median resident age - Females - White
Median resident age - Females - Black or African American
Median resident age - Females - Asian
Median resident age - Females - Hispanic or Latino
Median resident age - Females - American Indian and Alaska Native
Median resident age - Females - Multirace
Median resident age - Females - Other Race
Commute - mean travel time to work (minutes)
Travel time to work - Less than 5 minutes (%)
Travel time to work - Less than 5 minutes (% change since 2000)
Travel time to work - 5 to 9 minutes (%)
Travel time to work - 5 to 9 minutes (% change since 2000)
Travel time to work - 10 to 19 minutes (%)
Travel time to work - 10 to 19 minutes (% change since 2000)
Travel time to work - 20 to 29 minutes (%)
Travel time to work - 20 to 29 minutes (% change since 2000)
Travel time to work - 30 to 39 minutes (%)
Travel time to work - 30 to 39 minutes (% change since 2000)
Travel time to work - 40 to 59 minutes (%)
Travel time to work - 40 to 59 minutes (% change since 2000)
Travel time to work - 60 to 89 minutes (%)
Travel time to work - 60 to 89 minutes (% change since 2000)
Travel time to work - 90 or more minutes (%)
Travel time to work - 90 or more minutes (% change since 2000)
Marital status - Never married (%)
Marital status - Now married (%)
Marital status - Separated (%)
Marital status - Widowed (%)
Marital status - Divorced (%)
Median family income ($)
Median family income (% change since 2000)
Median non-family income ($)
Median non-family income (% change since 2000)
Median per capita income ($)
Median per capita income (% change since 2000)
Median family income ($) - White
Median family income ($) - Black or African American
Median family income ($) - Asian
Median family income ($) - Hispanic or Latino
Median family income ($) - American Indian and Alaska Native
Median family income ($) - Multirace
Median family income ($) - Other Race
Median year house/condo built
Median year apartment built
Year house built - Built 2005 or later (%)
Year house built - Built 2000 to 2004 (%)
Year house built - Built 1990 to 1999 (%)
Year house built - Built 1980 to 1989 (%)
Year house built - Built 1970 to 1979 (%)
Year house built - Built 1960 to 1969 (%)
Year house built - Built 1950 to 1959 (%)
Year house built - Built 1940 to 1949 (%)
Year house built - Built 1939 or earlier (%)
Average household size
Household density (households per square mile)
Average household size - White
Average household size - Black or African American
Average household size - Asian
Average household size - Hispanic or Latino
Average household size - American Indian and Alaska Native
Average household size - Multirace
Average household size - Other Race
Occupied housing units (%)
Vacant housing units (%)
Owner occupied housing units (%)
Renter occupied housing units (%)
Vacancy status - For rent (%)
Vacancy status - For sale only (%)
Vacancy status - Rented or sold, not occupied (%)
Vacancy status - For seasonal, recreational, or occasional use (%)
Vacancy status - For migrant workers (%)
Vacancy status - Other vacant (%)
Residents with income below the poverty level (%)
Residents with income below 50% of the poverty level (%)
Children below poverty level (%)
Poor families by family type - Married-couple family (%)
Poor families by family type - Male, no wife present (%)
Poor families by family type - Female, no husband present (%)
Poverty status for native-born residents (%)
Poverty status for foreign-born residents (%)
Poverty among high school graduates not in families (%)
Poverty among people who did not graduate high school not in families (%)
Residents with income below the poverty level (%) - White
Residents with income below the poverty level (%) - Black or African American
Residents with income below the poverty level (%) - Asian
Residents with income below the poverty level (%) - Hispanic or Latino
Residents with income below the poverty level (%) - American Indian and Alaska Native
Residents with income below the poverty level (%) - Multirace
Residents with income below the poverty level (%) - Other Race
Air pollution - Air Quality Index (AQI)
Air pollution - CO
Air pollution - NO2
Air pollution - SO2
Air pollution - Ozone
Air pollution - PM10
Air pollution - PM25
Air pollution - Pb
Crime - Murders per 100,000 population
Crime - Rapes per 100,000 population
Crime - Robberies per 100,000 population
Crime - Assaults per 100,000 population
Crime - Burglaries per 100,000 population
Crime - Thefts per 100,000 population
Crime - Auto thefts per 100,000 population
Crime - Arson per 100,000 population
Crime - City-data.com crime index
Crime - Violent crime index
Crime - Property crime index
Crime - Murders per 100,000 population (5 year average)
Crime - Rapes per 100,000 population (5 year average)
Crime - Robberies per 100,000 population (5 year average)
Crime - Assaults per 100,000 population (5 year average)
Crime - Burglaries per 100,000 population (5 year average)
Crime - Thefts per 100,000 population (5 year average)
Crime - Auto thefts per 100,000 population (5 year average)
Crime - Arson per 100,000 population (5 year average)
Crime - City-data.com crime index (5 year average)
Crime - Violent crime index (5 year average)
Crime - Property crime index (5 year average)
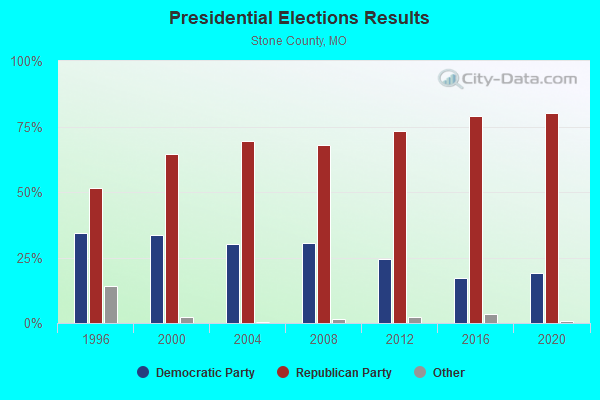
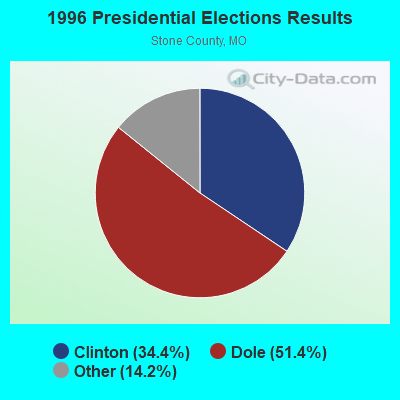
1996 Presidential Elections Results (%) - Democratic Party (Clinton)
1996 Presidential Elections Results (%) - Republican Party (Dole)
1996 Presidential Elections Results (%) - Other
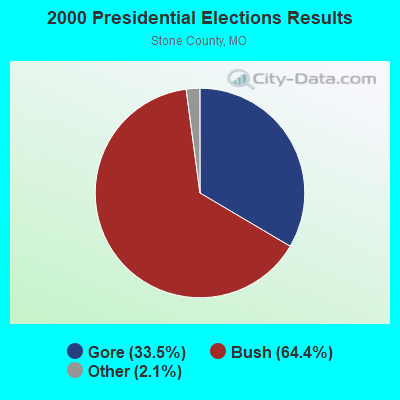
2000 Presidential Elections Results (%) - Democratic Party (Gore)
2000 Presidential Elections Results (%) - Republican Party (Bush)
2000 Presidential Elections Results (%) - Other
2004 Presidential Elections Results (%) - Democratic Party (Kerry)
2004 Presidential Elections Results (%) - Republican Party (Bush)
2004 Presidential Elections Results (%) - Other
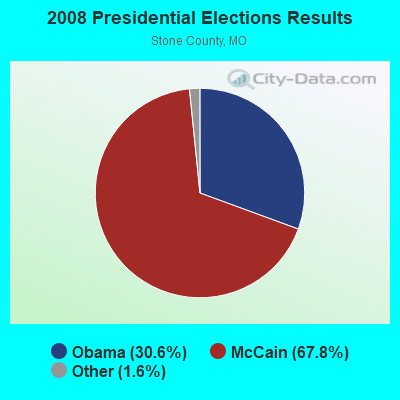
2008 Presidential Elections Results (%) - Democratic Party (Obama)
2008 Presidential Elections Results (%) - Republican Party (McCain)
2008 Presidential Elections Results (%) - Other
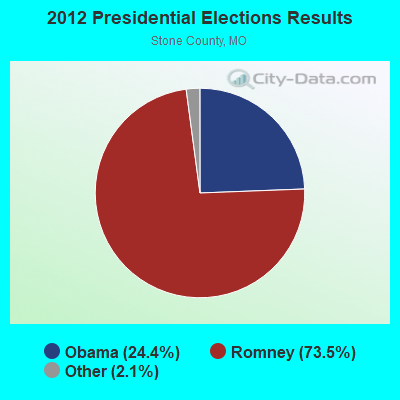
2012 Presidential Elections Results (%) - Democratic Party (Obama)
2012 Presidential Elections Results (%) - Republican Party (Romney)
2012 Presidential Elections Results (%) - Other
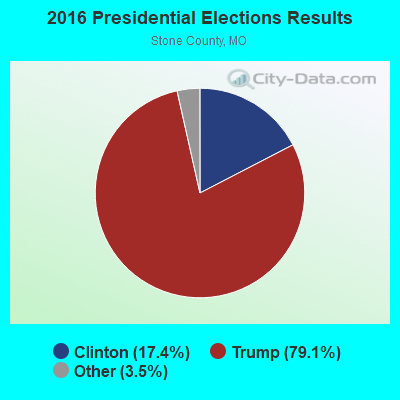
2016 Presidential Elections Results (%) - Democratic Party (Clinton)
2016 Presidential Elections Results (%) - Republican Party (Trump)
2016 Presidential Elections Results (%) - Other
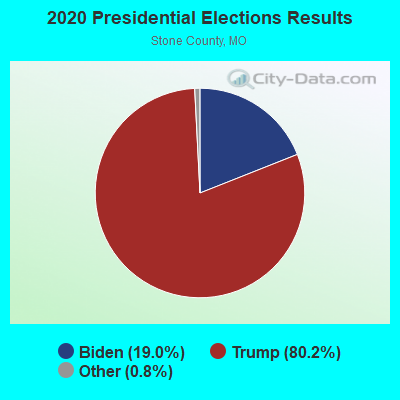
2020 Presidential Elections Results (%) - Democratic Party (Biden)
2020 Presidential Elections Results (%) - Republican Party (Trump)
2020 Presidential Elections Results (%) - Other
Ancestries Reported - Arab (%)
Ancestries Reported - Czech (%)
Ancestries Reported - Danish (%)
Ancestries Reported - Dutch (%)
Ancestries Reported - English (%)
Ancestries Reported - French (%)
Ancestries Reported - French Canadian (%)
Ancestries Reported - German (%)
Ancestries Reported - Greek (%)
Ancestries Reported - Hungarian (%)
Ancestries Reported - Irish (%)
Ancestries Reported - Italian (%)
Ancestries Reported - Lithuanian (%)
Ancestries Reported - Norwegian (%)
Ancestries Reported - Polish (%)
Ancestries Reported - Portuguese (%)
Ancestries Reported - Russian (%)
Ancestries Reported - Scotch-Irish (%)
Ancestries Reported - Scottish (%)
Ancestries Reported - Slovak (%)
Ancestries Reported - Subsaharan African (%)
Ancestries Reported - Swedish (%)
Ancestries Reported - Swiss (%)
Ancestries Reported - Ukrainian (%)
Ancestries Reported - United States (%)
Ancestries Reported - Welsh (%)
Ancestries Reported - West Indian (%)
Ancestries Reported - Other (%)
Educational Attainment - No schooling completed (%)
Educational Attainment - Less than high school (%)
Educational Attainment - High school or equivalent (%)
Educational Attainment - Less than 1 year of college (%)
Educational Attainment - 1 or more years of college (%)
Educational Attainment - Associate degree (%)
Educational Attainment - Bachelor's degree (%)
Educational Attainment - Master's degree (%)
Educational Attainment - Professional school degree (%)
Educational Attainment - Doctorate degree (%)
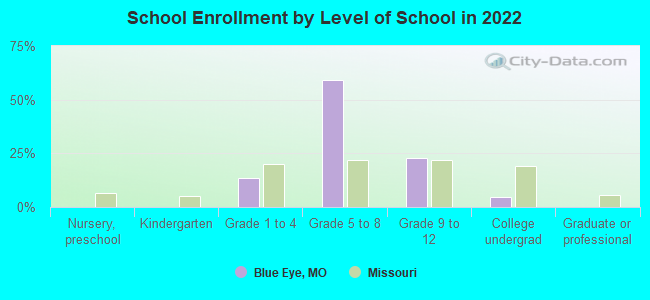
School Enrollment - Nursery, preschool (%)
School Enrollment - Kindergarten (%)
School Enrollment - Grade 1 to 4 (%)
School Enrollment - Grade 5 to 8 (%)
School Enrollment - Grade 9 to 12 (%)
School Enrollment - College undergrad (%)
School Enrollment - Graduate or professional (%)
School Enrollment - Not enrolled in school (%)
School enrollment - Public schools (%)
School enrollment - Private schools (%)
School enrollment - Not enrolled (%)
Median number of rooms in houses and condos
Median number of rooms in apartments
Housing units lacking complete plumbing facilities (%)
Housing units lacking complete kitchen facilities (%)
Density of houses
Urban houses (%)
Rural houses (%)
Households with people 60 years and over (%)
Households with people 65 years and over (%)
Households with people 75 years and over (%)
Households with one or more nonrelatives (%)
Households with no nonrelatives (%)
Population in households (%)
Family households (%)
Nonfamily households (%)
Population in families (%)
Family households with own children (%)
Median number of bedrooms in owner occupied houses
Mean number of bedrooms in owner occupied houses
Median number of bedrooms in renter occupied houses
Mean number of bedrooms in renter occupied houses
Median number of vehichles in owner occupied houses
Mean number of vehichles in owner occupied houses
Median number of vehichles in renter occupied houses
Mean number of vehichles in renter occupied houses
Mortgage status - with mortgage (%)
Mortgage status - with second mortgage (%)
Mortgage status - with home equity loan (%)
Mortgage status - with both second mortgage and home equity loan (%)
Mortgage status - without a mortgage (%)
Average family size
Average family size - White
Average family size - Black or African American
Average family size - Asian
Average family size - Hispanic or Latino
Average family size - American Indian and Alaska Native
Average family size - Multirace
Average family size - Other Race
Geographical mobility - Same house 1 year ago (%)
Geographical mobility - Moved within same county (%)
Geographical mobility - Moved from different county within same state (%)
Geographical mobility - Moved from different state (%)
Geographical mobility - Moved from abroad (%)
Place of birth - Born in state of residence (%)
Place of birth - Born in other state (%)
Place of birth - Native, outside of US (%)
Place of birth - Foreign born (%)
Housing units in structures - 1, detached (%)
Housing units in structures - 1, attached (%)
Housing units in structures - 2 (%)
Housing units in structures - 3 or 4 (%)
Housing units in structures - 5 to 9 (%)
Housing units in structures - 10 to 19 (%)
Housing units in structures - 20 to 49 (%)
Housing units in structures - 50 or more (%)
Housing units in structures - Mobile home (%)
Housing units in structures - Boat, RV, van, etc. (%)
House/condo owner moved in on average (years ago)
Renter moved in on average (years ago)
Year householder moved into unit - Moved in 1999 to March 2000 (%)
Year householder moved into unit - Moved in 1995 to 1998 (%)
Year householder moved into unit - Moved in 1990 to 1994 (%)
Year householder moved into unit - Moved in 1980 to 1989 (%)
Year householder moved into unit - Moved in 1970 to 1979 (%)
Year householder moved into unit - Moved in 1969 or earlier (%)
Means of transportation to work - Drove car alone (%)
Means of transportation to work - Carpooled (%)
Means of transportation to work - Public transportation (%)
Means of transportation to work - Bus or trolley bus (%)
Means of transportation to work - Streetcar or trolley car (%)
Means of transportation to work - Subway or elevated (%)
Means of transportation to work - Railroad (%)
Means of transportation to work - Ferryboat (%)
Means of transportation to work - Taxicab (%)
Means of transportation to work - Motorcycle (%)
Means of transportation to work - Bicycle (%)
Means of transportation to work - Walked (%)
Means of transportation to work - Other means (%)
Working at home (%)
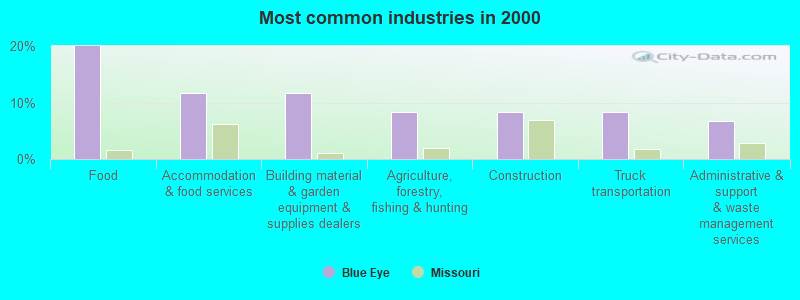
Industry diversity
Most Common Industries - Agriculture, forestry, fishing and hunting, and mining (%)
Most Common Industries - Agriculture, forestry, fishing and hunting (%)
Most Common Industries - Mining, quarrying, and oil and gas extraction (%)
Most Common Industries - Construction (%)
Most Common Industries - Manufacturing (%)
Most Common Industries - Wholesale trade (%)
Most Common Industries - Retail trade (%)
Most Common Industries - Transportation and warehousing, and utilities (%)
Most Common Industries - Transportation and warehousing (%)
Most Common Industries - Utilities (%)
Most Common Industries - Information (%)
Most Common Industries - Finance and insurance, and real estate and rental and leasing (%)
Most Common Industries - Finance and insurance (%)
Most Common Industries - Real estate and rental and leasing (%)
Most Common Industries - Professional, scientific, and management, and administrative and waste management services (%)
Most Common Industries - Professional, scientific, and technical services (%)
Most Common Industries - Management of companies and enterprises (%)
Most Common Industries - Administrative and support and waste management services (%)
Most Common Industries - Educational services, and health care and social assistance (%)
Most Common Industries - Educational services (%)
Most Common Industries - Health care and social assistance (%)
Most Common Industries - Arts, entertainment, and recreation, and accommodation and food services (%)
Most Common Industries - Arts, entertainment, and recreation (%)
Most Common Industries - Accommodation and food services (%)
Most Common Industries - Other services, except public administration (%)
Most Common Industries - Public administration (%)
Occupation diversity
Most Common Occupations - Management, business, science, and arts occupations (%)
Most Common Occupations - Management, business, and financial occupations (%)
Most Common Occupations - Management occupations (%)
Most Common Occupations - Business and financial operations occupations (%)
Most Common Occupations - Computer, engineering, and science occupations (%)
Most Common Occupations - Computer and mathematical occupations (%)
Most Common Occupations - Architecture and engineering occupations (%)
Most Common Occupations - Life, physical, and social science occupations (%)
Most Common Occupations - Education, legal, community service, arts, and media occupations (%)
Most Common Occupations - Community and social service occupations (%)
Most Common Occupations - Legal occupations (%)
Most Common Occupations - Education, training, and library occupations (%)
Most Common Occupations - Arts, design, entertainment, sports, and media occupations (%)
Most Common Occupations - Healthcare practitioners and technical occupations (%)
Most Common Occupations - Health diagnosing and treating practitioners and other technical occupations (%)
Most Common Occupations - Health technologists and technicians (%)
Most Common Occupations - Service occupations (%)
Most Common Occupations - Healthcare support occupations (%)
Most Common Occupations - Protective service occupations (%)
Most Common Occupations - Fire fighting and prevention, and other protective service workers including supervisors (%)
Most Common Occupations - Law enforcement workers including supervisors (%)
Most Common Occupations - Food preparation and serving related occupations (%)
Most Common Occupations - Building and grounds cleaning and maintenance occupations (%)
Most Common Occupations - Personal care and service occupations (%)
Most Common Occupations - Sales and office occupations (%)
Most Common Occupations - Sales and related occupations (%)
Most Common Occupations - Office and administrative support occupations (%)
Most Common Occupations - Natural resources, construction, and maintenance occupations (%)
Most Common Occupations - Farming, fishing, and forestry occupations (%)
Most Common Occupations - Construction and extraction occupations (%)
Most Common Occupations - Installation, maintenance, and repair occupations (%)
Most Common Occupations - Production, transportation, and material moving occupations (%)
Most Common Occupations - Production occupations (%)
Most Common Occupations - Transportation occupations (%)
Most Common Occupations - Material moving occupations (%)
People in Group quarters - Institutionalized population (%)
People in Group quarters - Correctional institutions (%)
People in Group quarters - Federal prisons and detention centers (%)
People in Group quarters - Halfway houses (%)
People in Group quarters - Local jails and other confinement facilities (including police lockups) (%)
People in Group quarters - Military disciplinary barracks (%)
People in Group quarters - State prisons (%)
People in Group quarters - Other types of correctional institutions (%)
People in Group quarters - Nursing homes (%)
People in Group quarters - Hospitals/wards, hospices, and schools for the handicapped (%)
People in Group quarters - Hospitals/wards and hospices for chronically ill (%)
People in Group quarters - Hospices or homes for chronically ill (%)
People in Group quarters - Military hospitals or wards for chronically ill (%)
People in Group quarters - Other hospitals or wards for chronically ill (%)
People in Group quarters - Hospitals or wards for drug/alcohol abuse (%)
People in Group quarters - Mental (Psychiatric) hospitals or wards (%)
People in Group quarters - Schools, hospitals, or wards for the mentally retarded (%)
People in Group quarters - Schools, hospitals, or wards for the physically handicapped (%)
People in Group quarters - Institutions for the deaf (%)
People in Group quarters - Institutions for the blind (%)
People in Group quarters - Orthopedic wards and institutions for the physically handicapped (%)
People in Group quarters - Wards in general hospitals for patients who have no usual home elsewhere (%)
People in Group quarters - Wards in military hospitals for patients who have no usual home elsewhere (%)
People in Group quarters - Juvenile institutions (%)
People in Group quarters - Long-term care (%)
People in Group quarters - Homes for abused, dependent, and neglected children (%)
People in Group quarters - Residential treatment centers for emotionally disturbed children (%)
People in Group quarters - Training schools for juvenile delinquents (%)
People in Group quarters - Short-term care, detention or diagnostic centers for delinquent children (%)
People in Group quarters - Type of juvenile institution unknown (%)
People in Group quarters - Noninstitutionalized population (%)
People in Group quarters - College dormitories (includes college quarters off campus) (%)
People in Group quarters - Military quarters (%)
People in Group quarters - On base (%)
People in Group quarters - Barracks, unaccompanied personnel housing (UPH), (Enlisted/Officer), ;and similar group living quarters for military personnel (%)
People in Group quarters - Transient quarters for temporary residents (%)
People in Group quarters - Military ships (%)
People in Group quarters - Group homes (%)
People in Group quarters - Homes or halfway houses for drug/alcohol abuse (%)
People in Group quarters - Homes for the mentally ill (%)
People in Group quarters - Homes for the mentally retarded (%)
People in Group quarters - Homes for the physically handicapped (%)
People in Group quarters - Other group homes (%)
People in Group quarters - Religious group quarters (%)
People in Group quarters - Dormitories (%)
People in Group quarters - Agriculture workers' dormitories on farms (%)
People in Group quarters - Job Corps and vocational training facilities (%)
People in Group quarters - Other workers' dormitories (%)
People in Group quarters - Crews of maritime vessels (%)
People in Group quarters - Other nonhousehold living situations (%)
People in Group quarters - Other noninstitutional group quarters (%)
Residents speaking English at home (%)
Residents speaking English at home - Born in the United States (%)
Residents speaking English at home - Native, born elsewhere (%)
Residents speaking English at home - Foreign born (%)
Residents speaking Spanish at home (%)
Residents speaking Spanish at home - Born in the United States (%)
Residents speaking Spanish at home - Native, born elsewhere (%)
Residents speaking Spanish at home - Foreign born (%)
Residents speaking other language at home (%)
Residents speaking other language at home - Born in the United States (%)
Residents speaking other language at home - Native, born elsewhere (%)
Residents speaking other language at home - Foreign born (%)
Class of Workers - Employee of private company (%)
Class of Workers - Self-employed in own incorporated business (%)
Class of Workers - Private not-for-profit wage and salary workers (%)
Class of Workers - Local government workers (%)
Class of Workers - State government workers (%)
Class of Workers - Federal government workers (%)
Class of Workers - Self-employed workers in own not incorporated business and Unpaid family workers (%)
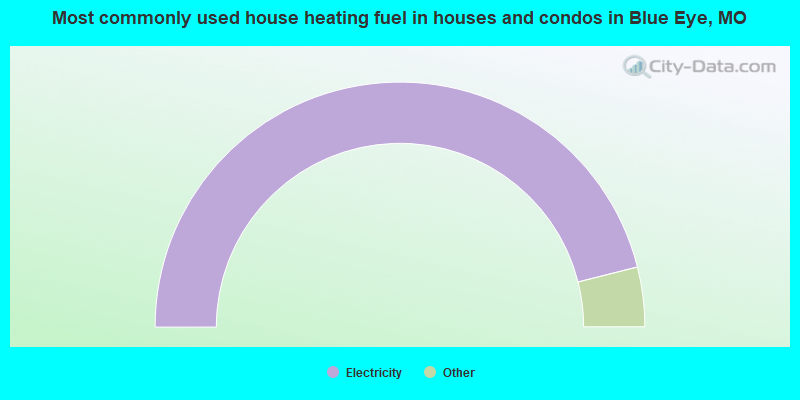
House heating fuel used in houses and condos - Utility gas (%)
House heating fuel used in houses and condos - Bottled, tank, or LP gas (%)
House heating fuel used in houses and condos - Electricity (%)
House heating fuel used in houses and condos - Fuel oil, kerosene, etc. (%)
House heating fuel used in houses and condos - Coal or coke (%)
House heating fuel used in houses and condos - Wood (%)
House heating fuel used in houses and condos - Solar energy (%)
House heating fuel used in houses and condos - Other fuel (%)
House heating fuel used in houses and condos - No fuel used (%)
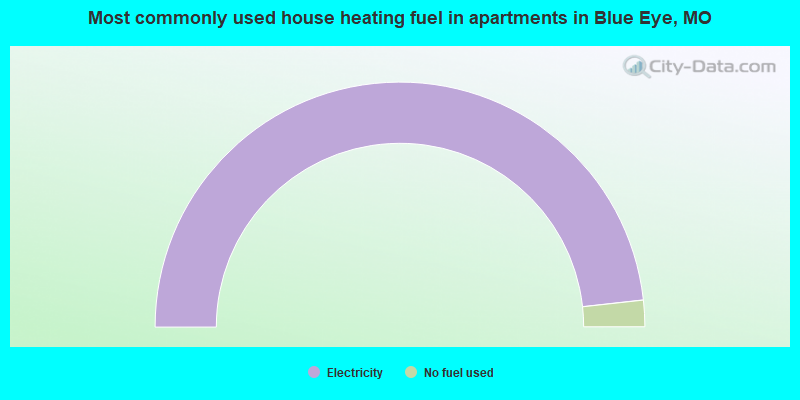
House heating fuel used in apartments - Utility gas (%)
House heating fuel used in apartments - Bottled, tank, or LP gas (%)
House heating fuel used in apartments - Electricity (%)
House heating fuel used in apartments - Fuel oil, kerosene, etc. (%)
House heating fuel used in apartments - Coal or coke (%)
House heating fuel used in apartments - Wood (%)
House heating fuel used in apartments - Solar energy (%)
House heating fuel used in apartments - Other fuel (%)
House heating fuel used in apartments - No fuel used (%)
Armed forces status - In Armed Forces (%)
Armed forces status - Civilian (%)
Armed forces status - Civilian - Veteran (%)
Armed forces status - Civilian - Nonveteran (%)
Fatal accidents locations in years 2005-2021
Fatal accidents locations in 2005
Fatal accidents locations in 2006
Fatal accidents locations in 2007
Fatal accidents locations in 2008
Fatal accidents locations in 2009
Fatal accidents locations in 2010
Fatal accidents locations in 2011
Fatal accidents locations in 2012
Fatal accidents locations in 2013
Fatal accidents locations in 2014
Fatal accidents locations in 2015
Fatal accidents locations in 2016
Fatal accidents locations in 2017
Fatal accidents locations in 2018
Fatal accidents locations in 2019
Fatal accidents locations in 2020
Fatal accidents locations in 2021
Alcohol use - People drinking some alcohol every month (%)
Alcohol use - People not drinking at all (%)
Alcohol use - Average days/month drinking alcohol
Alcohol use - Average drinks/week
Alcohol use - Average days/year people drink much
Audiometry - Average condition of hearing (%)
Audiometry - People that can hear a whisper from across a quiet room (%)
Audiometry - People that can hear normal voice from across a quiet room (%)
Audiometry - Ears ringing, roaring, buzzing (%)
Audiometry - Had a job exposure to loud noise (%)
Audiometry - Had off-work exposure to loud noise (%)
Blood Pressure & Cholesterol - Has high blood pressure (%)
Blood Pressure & Cholesterol - Checking blood pressure at home (%)
Blood Pressure & Cholesterol - Frequently checking blood cholesterol (%)
Blood Pressure & Cholesterol - Has high cholesterol level (%)
Consumer Behavior - Money monthly spent on food at supermarket/grocery store
Consumer Behavior - Money monthly spent on food at other stores
Consumer Behavior - Money monthly spent on eating out
Consumer Behavior - Money monthly spent on carryout/delivered foods
Consumer Behavior - Income spent on food at supermarket/grocery store (%)
Consumer Behavior - Income spent on food at other stores (%)
Consumer Behavior - Income spent on eating out (%)
Consumer Behavior - Income spent on carryout/delivered foods (%)
Current Health Status - General health condition (%)
Current Health Status - Blood donors (%)
Current Health Status - Has blood ever tested for HIV virus (%)
Current Health Status - Left-handed people (%)
Dermatology - People using sunscreen (%)
Diabetes - Diabetics (%)
Diabetes - Had a blood test for high blood sugar (%)
Diabetes - People taking insulin (%)
Diet Behavior & Nutrition - Diet health (%)
Diet Behavior & Nutrition - Milk product consumption (# of products/month)
Diet Behavior & Nutrition - Meals not home prepared (#/week)
Diet Behavior & Nutrition - Meals from fast food or pizza place (#/week)
Diet Behavior & Nutrition - Ready-to-eat foods (#/month)
Diet Behavior & Nutrition - Frozen meals/pizza (#/month)
Drug Use - People that ever used marijuana or hashish (%)
Drug Use - Ever used hard drugs (%)
Drug Use - Ever used any form of cocaine (%)
Drug Use - Ever used heroin (%)
Drug Use - Ever used methamphetamine (%)
Health Insurance - People covered by health insurance (%)
Kidney Conditions-Urology - Avg. # of times urinating at night
Medical Conditions - People with asthma (%)
Medical Conditions - People with anemia (%)
Medical Conditions - People with psoriasis (%)
Medical Conditions - People with overweight (%)
Medical Conditions - Elderly people having difficulties in thinking or remembering (%)
Medical Conditions - People who ever received blood transfusion (%)
Medical Conditions - People having trouble seeing even with glass/contacts (%)
Medical Conditions - People with arthritis (%)
Medical Conditions - People with gout (%)
Medical Conditions - People with congestive heart failure (%)
Medical Conditions - People with coronary heart disease (%)
Medical Conditions - People with angina pectoris (%)
Medical Conditions - People who ever had heart attack (%)
Medical Conditions - People who ever had stroke (%)
Medical Conditions - People with emphysema (%)
Medical Conditions - People with thyroid problem (%)
Medical Conditions - People with chronic bronchitis (%)
Medical Conditions - People with any liver condition (%)
Medical Conditions - People who ever had cancer or malignancy (%)
Mental Health - People who have little interest in doing things (%)
Mental Health - People feeling down, depressed, or hopeless (%)
Mental Health - People who have trouble sleeping or sleeping too much (%)
Mental Health - People feeling tired or having little energy (%)
Mental Health - People with poor appetite or overeating (%)
Mental Health - People feeling bad about themself (%)
Mental Health - People who have trouble concentrating on things (%)
Mental Health - People moving or speaking slowly or too fast (%)
Mental Health - People having thoughts they would be better off dead (%)
Oral Health - Average years since last visit a dentist
Oral Health - People embarrassed because of mouth (%)
Oral Health - People with gum disease (%)
Oral Health - General health of teeth and gums (%)
Oral Health - Average days a week using dental floss/device
Oral Health - Average days a week using mouthwash for dental problem
Oral Health - Average number of teeth
Pesticide Use - Households using pesticides to control insects (%)
Pesticide Use - Households using pesticides to kill weeds (%)
Physical Activity - People doing vigorous-intensity work activities (%)
Physical Activity - People doing moderate-intensity work activities (%)
Physical Activity - People walking or bicycling (%)
Physical Activity - People doing vigorous-intensity recreational activities (%)
Physical Activity - People doing moderate-intensity recreational activities (%)
Physical Activity - Average hours a day doing sedentary activities
Physical Activity - Average hours a day watching TV or videos
Physical Activity - Average hours a day using computer
Physical Functioning - People having limitations keeping them from working (%)
Physical Functioning - People limited in amount of work they can do (%)
Physical Functioning - People that need special equipment to walk (%)
Physical Functioning - People experiencing confusion/memory problems (%)
Physical Functioning - People requiring special healthcare equipment (%)
Prescription Medications - Average number of prescription medicines taking
Preventive Aspirin Use - Adults 40+ taking low-dose aspirin (%)
Reproductive Health - Vaginal deliveries (%)
Reproductive Health - Cesarean deliveries (%)
Reproductive Health - Deliveries resulted in a live birth (%)
Reproductive Health - Pregnancies resulted in a delivery (%)
Reproductive Health - Women breastfeeding newborns (%)
Reproductive Health - Women that had a hysterectomy (%)
Reproductive Health - Women that had both ovaries removed (%)
Reproductive Health - Women that have ever taken birth control pills (%)
Reproductive Health - Women taking birth control pills (%)
Reproductive Health - Women that have ever used Depo-Provera or injectables (%)
Reproductive Health - Women that have ever used female hormones (%)
Sexual Behavior - People 18+ that ever had sex (vaginal, anal, or oral) (%)
Sexual Behavior - Males 18+ that ever had vaginal sex with a woman (%)
Sexual Behavior - Males 18+ that ever performed oral sex on a woman (%)
Sexual Behavior - Males 18+ that ever had anal sex with a woman (%)
Sexual Behavior - Males 18+ that ever had any sex with a man (%)
Sexual Behavior - Females 18+ that ever had vaginal sex with a man (%)
Sexual Behavior - Females 18+ that ever performed oral sex on a man (%)
Sexual Behavior - Females 18+ that ever had anal sex with a man (%)
Sexual Behavior - Females 18+ that ever had any kind of sex with a woman (%)
Sexual Behavior - Average age people first had sex
Sexual Behavior - Average number of female sex partners in lifetime (males 18+)
Sexual Behavior - Average number of female vaginal sex partners in lifetime (males 18+)
Sexual Behavior - Average age people first performed oral sex on a woman (18+)
Sexual Behavior - Average number of woman performed oral sex on in lifetime (18+)
Sexual Behavior - Average number of male sex partners in lifetime (males 18+)
Sexual Behavior - Average number of male anal sex partners in lifetime (males 18+)
Sexual Behavior - Average age people first performed oral sex on a man (18+)
Sexual Behavior - Average number of male oral sex partners in lifetime (18+)
Sexual Behavior - People using protection when performing oral sex (%)
Sexual Behavior - Average number of times people have vaginal or anal sex a year
Sexual Behavior - People having sex without condom (%)
Sexual Behavior - Average number of male sex partners in lifetime (females 18+)
Sexual Behavior - Average number of male vaginal sex partners in lifetime (females 18+)
Sexual Behavior - Average number of female sex partners in lifetime (females 18+)
Sexual Behavior - Circumcised males 18+ (%)
Sleep Disorders - Average hours sleeping at night
Sleep Disorders - People that has trouble sleeping (%)
Smoking-Cigarette Use - People smoking cigarettes (%)
Taste & Smell - People 40+ having problems with smell (%)
Taste & Smell - People 40+ having problems with taste (%)
Taste & Smell - People 40+ that ever had wisdom teeth removed (%)
Taste & Smell - People 40+ that ever had tonsils teeth removed (%)
Taste & Smell - People 40+ that ever had a loss of consciousness because of a head injury (%)
Taste & Smell - People 40+ that ever had a broken nose or other serious injury to face or skull (%)
Taste & Smell - People 40+ that ever had two or more sinus infections (%)
Weight - Average height (inches)
Weight - Average weight (pounds)
Weight - Average BMI
Weight - People that are obese (%)
Weight - People that ever were obese (%)
Weight - People trying to lose weight (%)
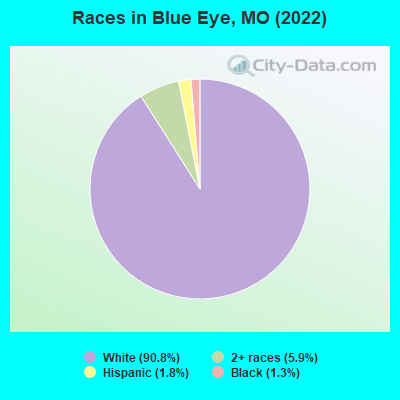
354 90.8% White alone 23 5.9% Two or more races 7 1.8% Hispanic 5 1.3% Black alone
Latest news from Blue Eye, MO collected exclusively by city-data.com from local newspapers, TV, and radio stations
Blue Eye, MO City Guides: Ancestries: American (22.2%), German (9.9%), Irish (8.2%), European (7.0%), English (5.3%), Scotch-Irish (2.9%).
Current Local Time:
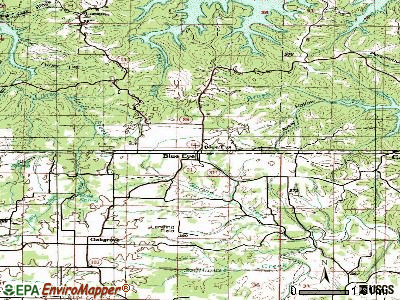
Land area: 0.54 square miles.
Population density: 554 people per square mile (low).
8 residents are foreign born (2.1% Latin America , 0.3% Europe ).
This town:
2.1%Missouri:
4.2%
Median real estate property taxes paid for housing units with mortgages in 2022: $912 (0.5%)Median real estate property taxes paid for housing units with no mortgage in 2022: $693 (0.6%)
Nearest city with pop. 50,000+: Springfield, MO
Nearest city with pop. 200,000+: Tulsa, OK
Nearest city with pop. 1,000,000+: Dallas, TX
Nearest cities:
Blue Eye, AR (0.5 miles),
Coney Island, MO (2.5 miles),
Omaha, AR (3.5 miles)
Latitude: 36.50 N, Longitude: 93.40 W
Unemployment in December 2023:
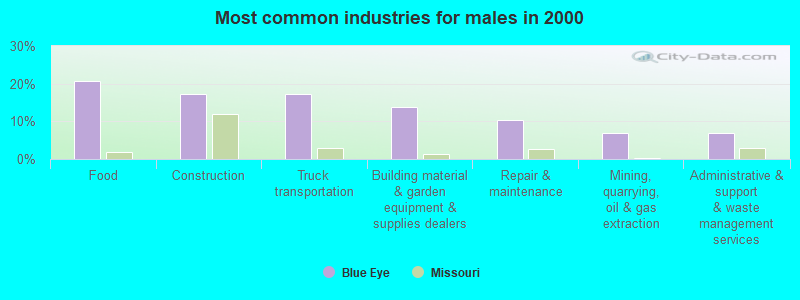
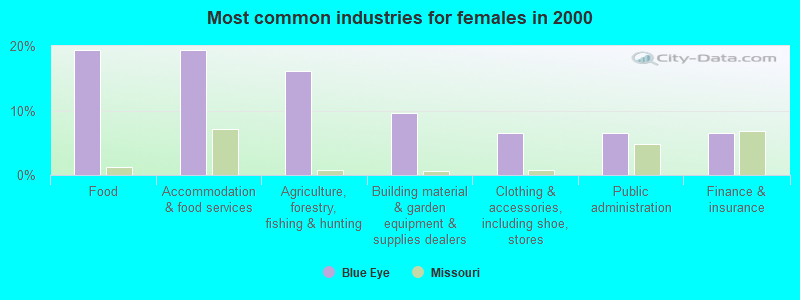
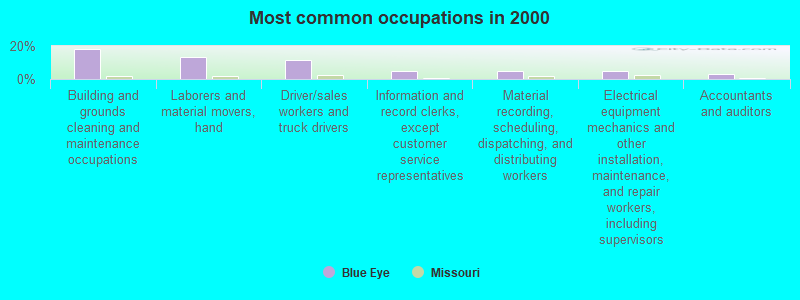
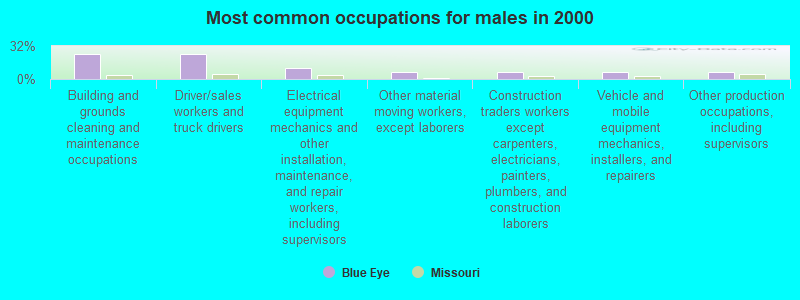
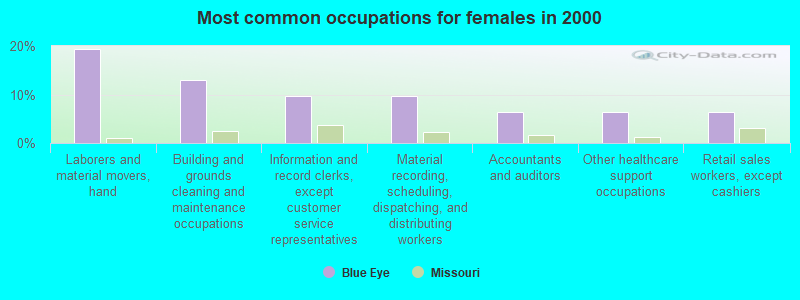
Most common occupations in Blue Eye, MO (%)
Both Males Females
Building and grounds cleaning and maintenance occupations (18.3%)
Laborers and material movers, hand (13.3%)
Driver/sales workers and truck drivers (11.7%)
Information and record clerks, except customer service representatives (5.0%)
Material recording, scheduling, dispatching, and distributing workers (5.0%)
Electrical equipment mechanics and other installation, maintenance, and repair workers, including supervisors (5.0%)
Accountants and auditors (3.3%)
Building and grounds cleaning and maintenance occupations (24.1%)
Driver/sales workers and truck drivers (24.1%)
Electrical equipment mechanics and other installation, maintenance, and repair workers, including supervisors (10.3%)
Other material moving workers, except laborers (6.9%)
Construction traders workers except carpenters, electricians, painters, plumbers, and construction laborers (6.9%)
Vehicle and mobile equipment mechanics, installers, and repairers (6.9%)
Other production occupations, including supervisors (6.9%)
Laborers and material movers, hand (19.4%)
Building and grounds cleaning and maintenance occupations (12.9%)
Information and record clerks, except customer service representatives (9.7%)
Material recording, scheduling, dispatching, and distributing workers (9.7%)
Accountants and auditors (6.5%)
Other healthcare support occupations (6.5%)
Retail sales workers, except cashiers (6.5%)
Tornado activity:
Blue Eye-area historical tornado activity is near Missouri state average. It is 48% greater than the overall U.S. average.
On 3/24/1954, a category F3 (max. wind speeds 158-206 mph) tornado 21.5 miles away from the Blue Eye town center injured 2 people and caused between $5000 and $50,000 in damages.
On 11/29/1991, a category F4 (max. wind speeds 207-260 mph) tornado 41.8 miles away from the town center killed 2 people and injured 64 people and caused between $5,000,000 and $50,000,000 in damages.
Earthquake activity:
Blue Eye-area historical earthquake activity is significantly above Missouri state average. It is 585% greater than the overall U.S. average. On 9/3/2016 at 12:02:44, a magnitude 5.8 (5.8 MW, Depth: 3.5 mi, Class: Moderate, Intensity: VI - VII) earthquake occurred 196.6 miles away from the city center On 11/6/2011 at 03:53:10, a magnitude 5.7 (5.7 MW, Depth: 3.2 mi) earthquake occurred 200.0 miles away from the city center On 2/28/2011 at 05:00:50, a magnitude 4.7 (4.7 MW, Depth: 2.0 mi, Class: Light, Intensity: IV - V) earthquake occurred 103.3 miles away from Blue Eye center On 5/4/2001 at 06:42:12, a magnitude 4.7 (4.2 MB, 4.7 LG, 4.5 LG) earthquake occurred 112.1 miles away from Blue Eye center On 1/21/1982 at 00:33:54, a magnitude 4.7 (4.5 MB, 4.7 LG, 4.5 LG) earthquake occurred 113.6 miles away from Blue Eye center On 3/25/1976 at 00:41:20, a magnitude 5.0 (4.9 MB, 5.0 LG) earthquake occurred 181.7 miles away from Blue Eye center Magnitude types: regional Lg-wave magnitude (LG), body-wave magnitude (MB), moment magnitude (MW) Natural disasters: The number of natural disasters in Stone County (23) is greater than the US average (15).Major Disasters (Presidential) Declared: 15Emergencies Declared: 6Floods: 15, Storms: 14, Tornadoes: 12, Winter Storms: 5, Winds: 4, Drought: 1, Heavy Rain: 1, Hurricane: 1, Other: 1 (Note: some incidents may be assigned to more than one category). Hospitals and medical centers near Blue Eye: TABLEROCK HEALTHCARE (Nursing Home, about 11 miles away; KIMBERLING CITY, MO)
HEALING HANDS HEALTH CARE, LLC (Home Health Center, about 12 miles away; BRANSON, MO)
MERCY HOSPITAL BERRYVILLE (about 14 miles away; BERRYVILLE, AR)
ST JOHNS HOME HEALTH (Home Health Center, about 14 miles away; BERRYVILLE, AR)
CARROLL COUNTY HEALTH UNIT (Home Health Center, about 14 miles away; BERRYVILLE, AR)
BRANSON DIALYSIS, LLC (Dialysis Facility, about 15 miles away; BRANSON, MO)
GOLDEN LIVINGCENTER-BRANSON (Nursing Home, about 15 miles away; BRANSON, MO)
Heliports located in Blue Eye: Amtrak station near Blue Eye: 14 miles: BRANSON (BOB EVANS REST., HWY. 76 & 65) - Bus Station Colleges/universities with over 2000 students nearest to Blue Eye:
NorthWest Arkansas Community College (about 45 miles; Bentonville, AR ; Full-time enrollment: 5,634)
Missouri State University-Springfield (about 49 miles; Springfield, MO ; FT enrollment: 16,660)
Ozarks Technical Community College (about 50 miles; Springfield, MO ; FT enrollment: 10,356)
Drury University (about 51 miles; Springfield, MO ; FT enrollment: 3,902)
Evangel University (about 51 miles; Springfield, MO ; FT enrollment: 2,036)
University of Arkansas (about 54 miles; Fayetteville, AR ; FT enrollment: 22,163)
Crowder College (about 58 miles; Neosho, MO ; FT enrollment: 3,675)
Public high schools in Blue Eye:
Public elementary/middle schools in Blue Eye: BLUE EYE ELEM. Students: 255, Location: 512 STATE HWY 13, Grades: PK-4)BLUE EYE MIDDLE Students: 207, Location: 512 STATE HWY 13, Grades: 5-8)See full list of schools located in Blue Eye
Hotel:
Stone County has a predicted average indoor radon screening level between 2 and 4 pCi/L (pico curies per liter) - Moderate Potential Drinking water stations with addresses in Blue Eye and their reported violations in the past:
JJ JUNCTION (Population served: 196, Groundwater):
Past health violations:
MCL, Monthly (TCR) - In OCT-2007, Contaminant: Coliform. Follow-up actions: St Public Notif requested (OCT-26-2007), St Violation/Reminder Notice (OCT-26-2007), St BCA signed (OCT-30-2007), St Compliance achieved (JUN-10-2011)
MCL, Acute (TCR) - In MAY-2007, Contaminant: Coliform. Follow-up actions: St Boil Water Order (JUN-02-2007), St Formal NOV issued (JUN-04-2007), St Public Notif requested (JUN-04-2007), St Public Notif issued (JUN-04-2007), St Compliance achieved (JUN-11-2007), St Public Notif received (JUN-18-2007), St BCA signed (OCT-30-2007), St Compliance achieved (JUN-10-2011)
MCL, Monthly (TCR) - In MAY-2007, Contaminant: Coliform. Follow-up actions: St Boil Water Order (JUN-02-2007), St Violation/Reminder Notice (JUN-04-2007), St Public Notif requested (JUN-04-2007), St Public Notif issued (JUN-04-2007), St Compliance achieved (JUN-11-2007), St Public Notif received (JUN-18-2007), St BCA signed (OCT-30-2007), St Compliance achieved (JUN-10-2011)
Past monitoring violations:
10 routine major monitoring violations
4 minor monitoring violations
One regular monitoring violation
Population served: 50, Groundwater):
Past health violations:
MCL, Monthly (TCR) - In SEP-2009, Contaminant: Coliform. Follow-up actions: St Violation/Reminder Notice (OCT-06-2009), St Public Notif requested (OCT-06-2009), St Public Notif received (NOV-02-2009), St Compliance achieved (JAN-22-2014)
Past monitoring violations:
2 routine major monitoring violations
Population served: 45, Groundwater):
Past monitoring violations:
Lead Consumer Notice - In JAN-01-2012, Contaminant: Lead and Copper Rule
Population served: 29, Groundwater):
Past health violations:
MCL, Monthly (TCR) - In OCT-2010, Contaminant: Coliform. Follow-up actions: St Public Notif requested (NOV-26-2010), St Violation/Reminder Notice (NOV-26-2010), St Public Notif received (DEC-12-2010), St Compliance achieved (AUG-05-2011)
Past monitoring violations:
One routine major monitoring violation
Population served: 27, Groundwater):
Past health violations:
MCL, Monthly (TCR) - In SEP-2013, Contaminant: Coliform. Follow-up actions: St Formal NOV issued (SEP-25-2013), St Public Notif requested (SEP-25-2013), St Public Notif received (OCT-02-2013), St Violation/Reminder Notice (NOV-20-2013), St Compliance achieved (JAN-16-2014)
MCL, Monthly (TCR) - In JUL-2013, Contaminant: Coliform. Follow-up actions: St Formal NOV issued (JUL-25-2013), St Public Notif requested (JUL-25-2013), St Violation/Reminder Notice (NOV-20-2013), St Compliance achieved (JAN-16-2014), St Public Notif received (FEB-13-2014)
MCL, Monthly (TCR) - In JUN-2013, Contaminant: Coliform. Follow-up actions: St Formal NOV issued (JUL-09-2013), St Public Notif requested (JUL-09-2013), St Public Notif received (JUL-23-2013), St Violation/Reminder Notice (NOV-20-2013), St Compliance achieved (JAN-16-2014)
Past monitoring violations:
Monitoring, Source Water (GWR) - In JUL-01-2013, Contaminant: E. COLI. Follow-up actions: St Violation/Reminder Notice (JUL-19-2013), St Public Notif requested (JUL-19-2013), St Violation/Reminder Notice (NOV-20-2013), St Compliance achieved (JAN-16-2014), St Public Notif received (FEB-13-2014)
Drinking water stations with addresses in Blue Eye that have no violations reported:
PANORAMA POINT SUBDIVISION (Population served: 25, Primary Water Source Type: Groundwater)
Average household size: This town:
2.2 peopleMissouri:
2.5 people
Percentage of family households: This town:
64.0%Whole state:
65.3%
Percentage of households with unmarried partners: This town:
1.3%Whole state:
6.7%
No gay or lesbian households reported
Banks with branches in Blue Eye (2011 data):
Metropolitan National Bank: Blue Eye Branch at 1012 State Highway 13, branch established on 1985/10/10. Info updated 2009/06/09: Bank assets: $472.7 mil, Deposits: $388.8 mil, headquarters in Springfield, MO, negative income in the last year , Commercial Lending Specialization, 12 total offices , Holding Company: Marshfield Investment Company Employee Stock Ownership Plan And Trust
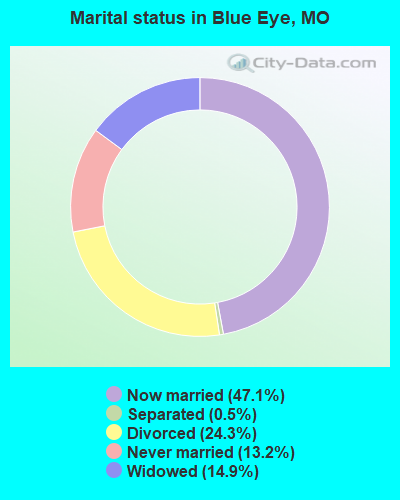
For population 15 years and over in Blue Eye:
Never married: 13.2%Now married: 47.1%Separated: 0.5%Widowed: 14.9%Divorced: 24.3% For population 25 years and over in Blue Eye:
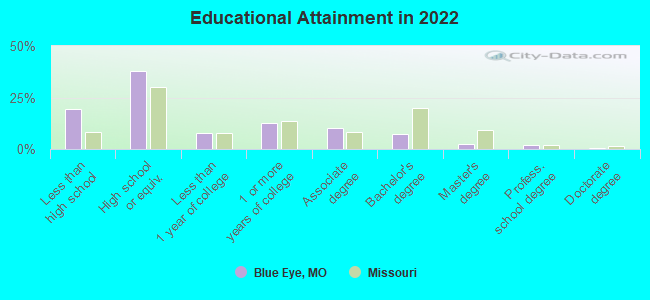
High school or higher: 79.7%Bachelor's degree or higher: 11.6%Graduate or professional degree: 4.6%Unemployed: 6.3%Mean travel time to work (commute): 30.1 minutes
Education Gini index (Inequality in education) Here:
8.2Missouri average:
11.1
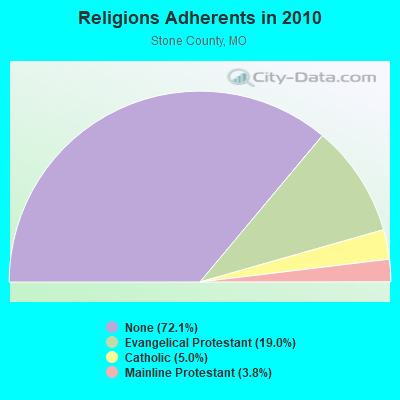
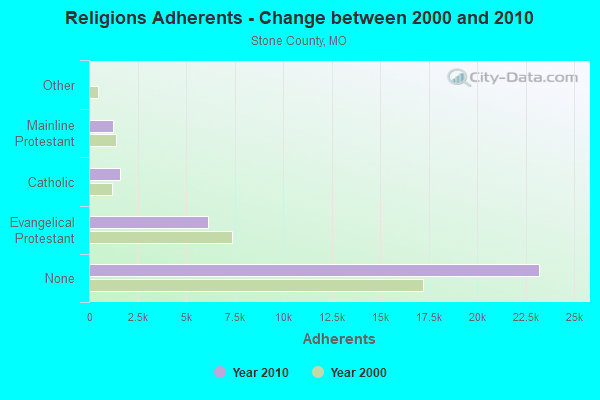
Religion statistics for Blue Eye, MO (based on Stone County data)
Religion Adherents Congregations Evangelical Protestant 6,134 41 Catholic 1,620 1 Mainline Protestant 1,234 5 Other 6 1 None 23,208 -
Source: Clifford Grammich, Kirk Hadaway, Richard Houseal, Dale E.Jones, Alexei Krindatch, Richie Stanley and Richard H.Taylor. 2012. 2010 U.S.Religion Census: Religious Congregations & Membership Study. Association of Statisticians of American Religious Bodies. Jones, Dale E., et al. 2002. Congregations and Membership in the United States 2000. Nashville, TN: Glenmary Research Center. Graphs represent county-level data
Food Environment Statistics: Number of grocery stores : 9Stone County :
2.86 / 10,000 pop.Missouri :
1.88 / 10,000 pop.
Number of supercenters and club stores : 1Stone County :
0.32 / 10,000 pop.State :
0.18 / 10,000 pop.
Number of convenience stores (no gas) : 3Here :
0.95 / 10,000 pop.Missouri :
0.60 / 10,000 pop.
Number of convenience stores (with gas) : 20This county :
6.35 / 10,000 pop.Missouri :
4.34 / 10,000 pop.
Number of full-service restaurants : 33Stone County :
10.48 / 10,000 pop.State :
7.37 / 10,000 pop.
Adult obesity rate : Stone County :
29.0%Missouri :
29.6%
Low-income preschool obesity rate : Stone County :
10.8%Missouri :
13.5%
Health and Nutrition: Healthy diet rate : This city:
58.8%Missouri:
50.9%
Average overall health of teeth and gums : This city:
59.0%State:
48.6%
Average BMI : This city:
27.6Missouri:
28.7
People feeling badly about themselves : Blue Eye:
20.2%State:
20.6%
People not drinking alcohol at all : Blue Eye:
12.1%Missouri:
10.1%
Average hours sleeping at night : Overweight people : Blue Eye:
36.8%Missouri:
34.3%
General health condition : Blue Eye:
63.1%State:
57.5%
Average condition of hearing : Blue Eye:
82.7%Missouri:
79.3%
More about Health and Nutrition of Blue Eye, MO Residents
Local government employment and payroll (March 2022)
Function
Full-time employees
Monthly full-time payroll
Average yearly full-time wage
Part-time employees
Monthly part-time payroll
Financial Administration
0 $0 1 $100 Other Government Administration
0 $0 5 $401
Totals for Government
0 $0 6 $501
Strongest AM radio stations in Blue Eye:
KTHS (1480 AM; 5 kW; BERRYVILLE, AR; Owner: KTHS/KSCC, INC.)
KWTO (560 AM; 5 kW; SPRINGFIELD, MO; Owner: KWTO, INC.)
KNWA (1600 AM; 5 kW; BELLEFONTE, AR; Owner: HARRISON RADIO STATIONS, INC.)
KOMC (1220 AM; 1 kW; BRANSON, MO; Owner: TURTLE BROADCASTING CO. OF BRANSON, L.P.)
KFAY (1030 AM; 10 kW; FARMINGTON, AR; Owner: CUMULUS LICENSING CORP)
KURM (790 AM; 5 kW; ROGERS, AR; Owner: KERM, INC)
KGHT (880 AM; 50 kW; SHERIDAN, AR; Owner: METROPOLITAN RADIO GROUP, INC.)
KRMG (740 AM; 50 kW; TULSA, OK; Owner: CXR HOLDINGS, INC.)
KFAQ (1170 AM; 50 kW; TULSA, OK; Owner: JOURNAL BROADCAST CORPORATION)
KBTN (1420 AM; 10 kW; NEOSHO, MO; Owner: PETRACOM OF JOPLIN, L.L.C.)
KAAY (1090 AM; 50 kW; LITTLE ROCK, AR; Owner: CITADEL BROADCASTING COMPANY)
KHOZ (900 AM; 1 kW; HARRISON, AR; Owner: HARRISON BROADCASTING CORPORATION)
KCGS (960 AM; 5 kW; MARSHALL, AR; Owner: SOUTHLAND BROADCASTING CORPORATION)
Strongest FM radio stations in Blue Eye:
KOMC-FM (100.1 FM; KIMBERLING CITY, MO; Owner: TURTLE BROADCASTING COMPANY, L.P.)
KHOZ-FM (102.9 FM; HARRISON, AR; Owner: HARRISON BROADCASTING CORPORATION)
KSMS-FM (90.5 FM; POINT LOOKOUT, MO; Owner: SOUTHWEST MISSOURI STATE UINIVERSITY)
KTHS-FM (107.1 FM; BERRYVILLE, AR; Owner: KTHS/KSCC, INC.)
K204CN (88.7 FM; BRANSON, MO; Owner: CALVARY CHAPEL OF TWIN FALLS, INC.)
KOZO (89.7 FM; BRANSON, MO; Owner: CREATIVE EDUCATIONAL MEDIA CORP, INC)
KLFC (88.1 FM; BRANSON, MO; Owner: MOUNTAINTOP BROADCASTING, INC.)
KCWD (96.1 FM; HARRISON, AR; Owner: HARRISON RADIO STATIONS, INC.)
KRZK (106.3 FM; BRANSON, MO; Owner: TURTLE BROADCASTING CO. OF BRANSON)
KTCN (100.9 FM; EUREKA SPRINGS, AR; Owner: NEW LIFE EVANGELISTIC CENTER, INC.)
KQMO (97.7 FM; SHELL KNOB, MO; Owner: MAGIC CIRCLE RADIO, INC.)
KAMO-FM (94.3 FM; ROGERS, AR; Owner: CUMULUS LICENSING CORP.)
KTXR (101.3 FM; SPRINGFIELD, MO; Owner: STEREO BROADCASTING, INC.)
KCOZ (91.7 FM; POINT LOOKOUT, MO; Owner: COLLEGE OF THE OZARKS)
KMXF (101.9 FM; LOWELL, AR; Owner: CAPSTAR TX LIMITED PARTNERSHIP)
KBPB (91.9 FM; HARRISON, MO; Owner: NEW LIFE EVANGELISTIC CENTER, INC.)
KIGL (93.3 FM; SELIGMAN, MO; Owner: CAPSTAR TX LIMITED PARTNERSHIP)
TV broadcast stations around Blue Eye:
KWBM (Channel 31; HARRISON, AR; Owner: R.S. COMMUNICATIONS LTD. PARTNERSHIP)
K17DL (Channel 17; BRANSON, MO; Owner: KY3, INC.)
KYTV (Channel 3; SPRINGFIELD, MO; Owner: KY3, INC.)
K54FH (Channel 54; GREEN FOREST, AR; Owner: NEW LIFE EVANGELISTIC CENTER, INC)
KOZK (Channel 21; SPRINGFIELD, MO; Owner: BD. OF GOVERNORS OF SW MISSOURI STATE UNIVERSITY)
KSPR (Channel 33; SPRINGFIELD, MO; Owner: PIEDMONT TELEVISION OF SPRINGFIELD LICENSE LLC)
K05JQ (Channel 5; BRANSON, MO; Owner: MILLER FAMILY BROADCASTING, L.L.C.)
KOLR (Channel 10; SPRINGFIELD, MO; Owner: VHR SPRINGFIELD LICENSE, INC.)
KDEB-TV (Channel 27; SPRINGFIELD, MO; Owner: QUORUM OF MISSOURI LICENSE, LLC)
KBNS-CA (Channel 38; BRANSON, MO; Owner: THE VACATION CHANNEL, INC.)
K25BD (Channel 25; BRANSON, MO; Owner: CHRISTIANS INCORPORATED FOR CHRIST)
KNJE-LP (Channel 68; EUREKA SPRINGS, AR; Owner: TV-34, INC., AN ARKANSAS CORPORATION)
KNJD-LP (Channel 59; BRANSON, MO; Owner: NEW LIFE EVANGELISTIC CENTER, INC.)
FCC Registered Antenna Towers: 21 (
See the full list of FCC Registered Antenna Towers in Blue Eye )
FCC Registered Broadcast Land Mobile Towers: 2
CHURCH COMPLEX, Lat: 36.518917 Lon: -93.380333, Call Sign: WQUX687, Assigned Frequencies: 452.512 MHz, 457.512 MHz, Grant Date: 11/10/2014, Expiration Date: 11/10/2024, Certifier: Maricela Woodall, Registrant: Radio Communications Specialists (Rcs), 3107f E. Chestnut Expressway, Springfield, MO 65802, Phone: (417) 866-2622, Fax: (417) 866-7005, Email:
Lat: 36.503028 Lon: -93.385917, Call Sign: WREE671, Assigned Frequencies: 467.212 MHz, Grant Date: 10/02/2019, Expiration Date: 10/02/2029, Certifier: Doug Arnold Dr., Registrant: Innovation Wireless, 5306 Beethoven St, Los Angeles, CA 90066, Phone: (888) 559-5565, Fax: (310) 482-3480, Email:
FCC Registered Microwave Towers: 5
Morning Side Church, Near 255 Falling Waters Dr (Lat: 36.512583 Lon: -93.383806), Type: Tank, Structure height: 35 m, Overall height: 36 m, Call Sign: WRKB431, Assigned Frequencies: 11485.0 MHz, 11485.0 MHz, 11485.0 MHz, 11485.0 MHz, 11485.0 MHz, 11485.0 MHz, 11485.0 MHz, 11485.0 MHz, 11485.0 MHz, 11485.0 MHz... (+4 more), Grant Date: 12/04/2020, Expiration Date: 12/04/2030, Certifier: Derek J Foerster, Registrant: Intelpath, Hinsdale, IL 60522, Phone: (312) 841-9188, Email:
3153 Blue Eye Mornin, No Exact Street Adress (Lat: 36.512556 Lon: -93.383806), Type: Tank, Structure height: 45.7 m, Call Sign: WRKX732, Assigned Frequencies: 11325.0 MHz, 11325.0 MHz, 11325.0 MHz, 11325.0 MHz, 11325.0 MHz, 11325.0 MHz, 11325.0 MHz, 11325.0 MHz, 11325.0 MHz, Grant Date: 03/01/2021, Expiration Date: 03/01/2031, Certifier: Travis Allen, Registrant: Intelpath, Hinsdale, IL 60522, Phone: (312) 841-9188 HWY 86, Cambridge Drive (Lat: 36.554444 Lon: -93.329389), Type: Ltower, Structure height: 59.4 m, Overall height: 60.7 m, Call Sign: WRND375, Assigned Frequencies: 10835.0 MHz, Grant Date: 07/19/2021, Expiration Date: 07/19/2031, Certifier: Douglas Chambers, Registrant: Wilkinson Barker Knauer, LLP, 1800 M Street Nw, Suite 800n, Washington, DC 20036, Phone: (202) 383-3420, Fax: (202) 783-5851, Email:
A5S0128A, 292 Sagebrush Road (Blue Eye Site) (Lat: 36.511250 Lon: -93.381806), Type: Gtower, Structure height: 91.4 m, Overall height: 93.8 m, Call Sign: WRWC855, Assigned Frequencies: 11245.0 MHz, 11245.0 MHz, 11245.0 MHz, 11245.0 MHz, 11245.0 MHz, 11245.0 MHz, 11245.0 MHz, 11245.0 MHz, 11245.0 MHz, 11245.0 MHz... (+5 more), Grant Date: 02/07/2023, Expiration Date: 02/07/2033, Certifier: Jenny Knopf, Registrant: T-Mobile Usa, Inc., 12920 Se 38th Street, Bellevue, WA 98006, Phone: (425) 383-8401, Fax: (425) 383-4040, Email:
BLUE EYE, On Hwy. 21, 1 Mile S Of Int. (Lat: 36.509778 Lon: -93.396278), Overall height: 45.4 m, Call Sign: KPP77, Assigned Frequencies: 2112.00 MHz, 2124.80 MHz, Grant Date: 01/03/2001, Expiration Date: 02/01/2011, Cancellation Date: 04/20/2001, Registrant: Verizon Services Group, 1850 M Street, Nw Suite 1200, Washington, DC 20036-5801, Phone: (202) 463-5295, Email:
FCC Registered Amateur Radio Licenses: 18 (
See the full list of FCC Registered Amateur Radio Licenses in Blue Eye )
FAA Registered Aircraft: 4
Aircraft: PIPER PA-22 (Category: Land, Seats: 4, Weight: Up to 12,499 Pounds, Speed: 94 mph), Engine: LYCOMING 0-290 SERIES (140 HP) (Reciprocating)N-Number: 1707A, N1707A, N-1707A, Serial Number: 22-459, Year manufactured: 1952, Airworthiness Date: 04/05/1956, Certificate Issue Date: 04/26/2006Registrant (Co-Owned): Mark C Parent, 277 Ponderosa Pine Dr, Blue Eye, MO 65611, Other Owners: Mary H ParentAircraft: ARBC INC DBA LINDSTRAND 69A (Category: Land, Weight: Up to 12,499 Pounds), Engine: NoneN-Number: 30091, N30091, N-30091, Serial Number: 5450, Certificate Issue Date: 02/18/2010Registrant (Co-Owned): Robert N Richey, 2323 State Highway Jj, Blue Eye, MO 65611, Other Owners: Kristen RicheyDeregistered: Cancel Date: 03/10/2006, Exported to: CanadaAircraft: EAGLE AIRCRAFT EAGLE 150B (Category: Land, Seats: 2, Weight: Up to 12,499 Pounds), Engine: CONT MOTOR IO-240 SER (128 HP) (Reciprocating)N-Number: 4500T, N4500T, N-4500T, Serial Number: 034, Year manufactured: 2000, Airworthiness Date: 03/26/2001, Certificate Issue Date: 09/12/2007Registrant (Individual): Max J Rosencrans, 195 Cinnamon Ln, Blue Eye, MO 65611Aircraft: CESSNA 182C (Category: Land, Seats: 4, Weight: Up to 12,499 Pounds, Speed: 119 mph), Engine: CONT MOTOR O-470 SERIES (230 HP) (Reciprocating)N-Number: 8483T, N8483T, N-8483T, Serial Number: 52383, Airworthiness Date: 12/16/1959, Certificate Issue Date: 01/31/2019Registrant (Corporation): Flowers Production Co Inc, 120 Bluff Cv, Blue Eye, MO 65611 Blue Eye compared to Missouri state average:
Median household income below state average. Median house value below state average. Unemployed percentage below state average. Black race population percentage below state average. Median age significantly above state average. Renting percentage above state average. Length of stay since moving in above state average. Number of rooms per house significantly below state average. House age significantly below state average. Number of college students below state average. Percentage of population with a bachelor's degree or higher below state average.
Top Patent Applicants
Total of 1 patent application in 2008-2024.


 Recent articles from our blog. Our writers, many of them Ph.D. graduates or candidates, create easy-to-read articles on a wide variety of topics.


 (48.5 miles
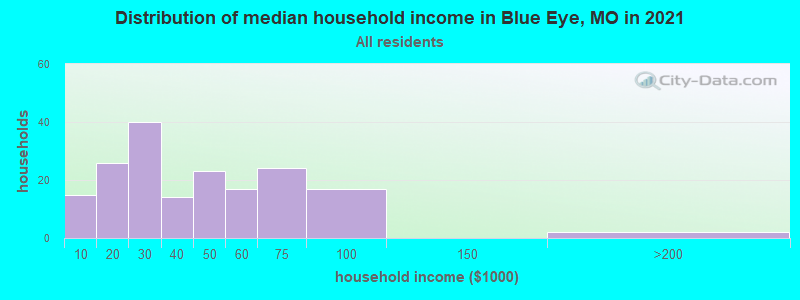


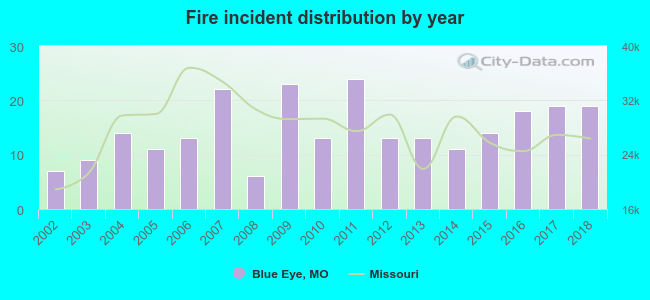 According to the data from the years 2002 - 2018 the average number of fire incidents per year is 15. The highest number of fires - 24 took place in 2011, and the least - 6 in 2008. The data has an increasing trend.
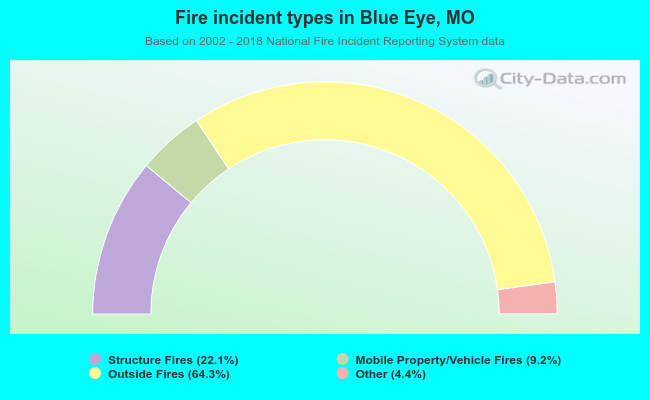 When looking into fire subcategories, the most reports belonged to: Outside Fires (64.3%), and Structure Fires (22.1%).