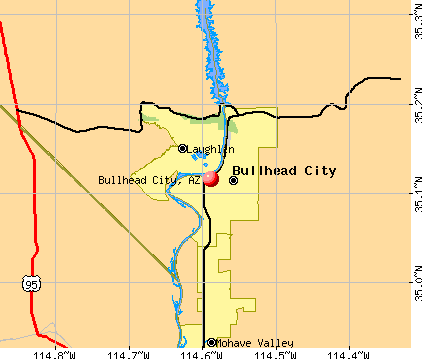
Bullhead City, Arizona
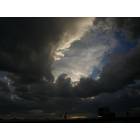
Bullhead City: Stormy skies in Bullhead City
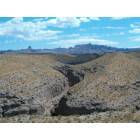
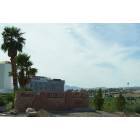
Bullhead City: Mountains in Bullhead City
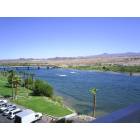
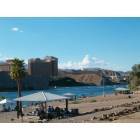
Bullhead City: Our view of Bullhead City from the Riverside
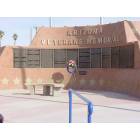
Bullhead City: Bullhead City has a beautiful Veterans Memorial Park, it is a joy to see it.
Bullhead City: Colorado River at Bullhead Park
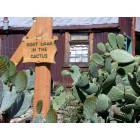
Bullhead City: Warning sign in Oatman, AZ.
Bullhead City: Welcome Sign on Highway 95 & 68 at Bullhead Parkway in Bullhead City
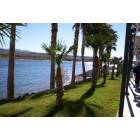
Bullhead City: along the river walk
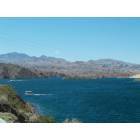
Bullhead City: Lake Mohave
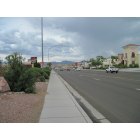
Bullhead City: Highway 95
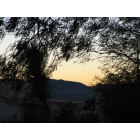
Bullhead City: Bullhead City Sunset
- see
23
more - add
your
Submit your own pictures of this city and show them to the world
- OSM Map
- General Map
- Google Map
- MSN Map
Population change since 2000: +27.1%
 |
| Males: 22,386 | |
| Females: 20,534 |
| Median resident age: | 52.3 years |
| Arizona median age: | 38.8 years |
Zip codes: 86426, 86429, 86442.
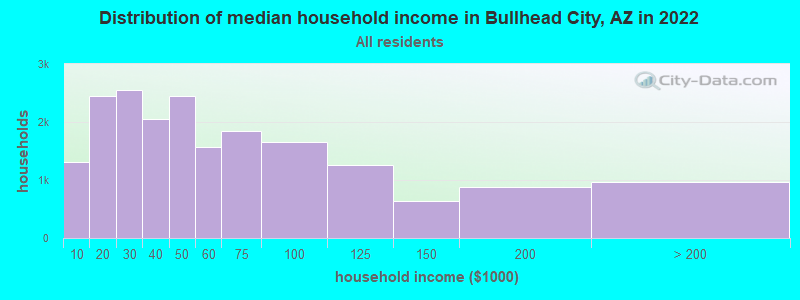
Bullhead City Zip Code Map| Bullhead City: | $48,179 |
| AZ: | $74,568 |
Estimated per capita income in 2022: $36,834 (it was $16,250 in 2000)
Bullhead City city income, earnings, and wages data
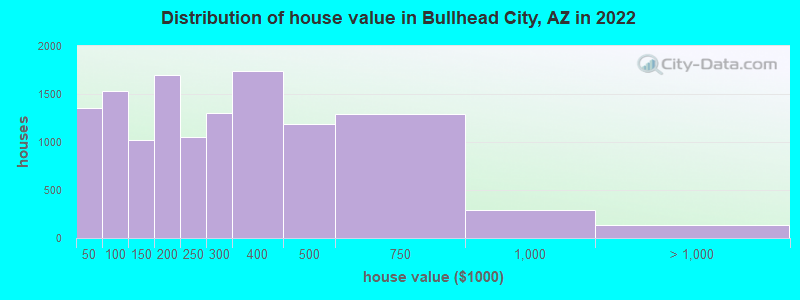
Estimated median house or condo value in 2022: $232,814 (it was $68,400 in 2000)
| Bullhead City: | $232,814 |
| AZ: | $402,800 |
Mean prices in 2022: all housing units: $298,953; detached houses: $382,448; townhouses or other attached units: $247,756; in 3-to-4-unit structures: $289,065; in 5-or-more-unit structures: $422,301; mobile homes: $127,356; occupied boats, rvs, vans, etc.: $57,372
Median gross rent in 2022: $1,033.
(16.7% for White Non-Hispanic residents, 15.0% for Black residents, 23.9% for Hispanic or Latino residents, 36.4% for American Indian residents, 25.4% for other race residents, 23.4% for two or more races residents)
Detailed information about poverty and poor residents in Bullhead City, AZ


Compare current foreclosures in Bullhead City, AZ:
| Photo | Address | Area | Beds / Baths | Price | Details |
|---|---|---|---|---|---|

|
#1
Havasupai Dr
Bullhead City, AZ 86442
|
1,436 sq. feet
|
2 baths 3 beds |
show details | |

|
#2
Baseline Rd
Bullhead City, AZ 86442
|
1,179 sq. feet
|
2 baths 3 beds |
show details | |

|
#3
Quartz Ave
Bullhead City, AZ 86442
|
1,184 sq. feet
|
2 baths 3 beds |
show details | |

|
#4
Del Rey Dr
Bullhead City, AZ 86442
|
960 sq. feet
|
2 baths 2 beds |
show details | |

|
#5
Juneberry Cir
Bullhead City, AZ 86442
|
1,558 sq. feet
|
2 baths - beds |
show details | |

|
#6
Riviera Blvd
Bullhead City, AZ 86442
|
1,183 sq. feet
|
1 baths - beds |
show details | |

|
#7
Ridge Run Ave
Bullhead City, AZ 86429
|
1,458 sq. feet
|
2 baths - beds |
show details | |

|
#8
Riverside Dr
Bullhead City, AZ 86442
|
2,771 sq. feet
|
3 baths - beds |
show details | |

|
#9
Via Arroyo
Bullhead City, AZ 86442
|
1,536 sq. feet
|
- baths - beds |
show details | |

|
#10
Cimarron Dr
Bullhead City, AZ 86442
|
1,487 sq. feet
|
- baths - beds |
show details |
| Photo | Address | Area | Beds / Baths | Price | Details |
|---|---|---|---|---|---|

|
#11
Stahlman Dr
Bullhead City, AZ 86442
|
1,389 sq. feet
|
- baths - beds |
show details | |

|
#12
Slide Mountain Loop
Bullhead City, AZ 86442
|
- sq. feet
|
- baths - beds |
show details | |

|
#13
Desert Bloom Cir
Bullhead City, AZ 86429
|
2,040 sq. feet
|
- baths - beds |
show details | |

|
#14
El Paso Rd
Bullhead City, AZ 86429
|
1,161 sq. feet
|
- baths - beds |
show details | |

|
#15
Paseo Del Rio
Bullhead City, AZ 86442
|
- sq. feet
|
- baths - beds |
show details | |

|
#16
Karen Way
Bullhead City, AZ 86442
|
- sq. feet
|
- baths - beds |
show details | |

|
#17
Mccormick Blvd
Bullhead City, AZ 86429
|
1,704 sq. feet
|
- baths - beds |
show details | |

|
#18
Via Arroyo
Bullhead City, AZ 86442
|
- sq. feet
|
- baths - beds |
show details | |

|
#19
E Katherine Dr
Bullhead City, AZ 86429
|
804 sq. feet
|
- baths - beds |
show details | |

|
#20
Normando Dr
Bullhead City, AZ 86442
|
1,260 sq. feet
|
- baths - beds |
show details |
| Photo | Address | Area | Beds / Baths | Price | Details |
|---|---|---|---|---|---|

|
#21
San Jose Rd
Bullhead City, AZ 86429
|
- sq. feet
|
- baths - beds |
show details | |

|
#22
Seafair Dr
Bullhead City, AZ 86442
|
- sq. feet
|
- baths - beds |
show details | |

|
#23
Avalon Dr
Bullhead City, AZ 86442
|
835 sq. feet
|
- baths - beds |
show details | |

|
#24
Ridge View Ave
Bullhead City, AZ 86429
|
- sq. feet
|
- baths - beds |
show details | |

|
#25
Lynn Dr
Bullhead City, AZ 86442
|
1,354 sq. feet
|
- baths - beds |
show details | |

|
#26
Riverwalk Dr
Bullhead City, AZ 86442
|
- sq. feet
|
- baths - beds |
show details | |

|
#27
Merced Dr
Bullhead City, AZ 86442
|
784 sq. feet
|
- baths - beds |
show details | |

|
#28
Paseo Grande Apt 3045
Bullhead City, AZ 86442
|
- sq. feet
|
- baths - beds |
show details | |

|
#29
Summit Ln
Bullhead City, AZ 86442
|
- sq. feet
|
- baths - beds |
show details | |

|
#30
Bluebird Ln
Bullhead City, AZ 86442
|
1,553 sq. feet
|
- baths - beds |
show details |
| Photo | Address | Area | Beds / Baths | Price | Details |
|---|---|---|---|---|---|

|
#31
Rancho Colorado Blvd # 217
Bullhead City, AZ 86442
|
- sq. feet
|
- baths - beds |
show details | |

|
#32
Sidewheel Dr
Bullhead City, AZ 86429
|
- sq. feet
|
- baths - beds |
show details | |

|
#33
Mccormick Blvd Apt 106
Bullhead City, AZ 86429
|
- sq. feet
|
- baths - beds |
show details | |

|
#34
Acoma Pl
Bullhead City, AZ 86442
|
- sq. feet
|
- baths - beds |
show details | |

|
#35
Tonto Dr # 2
Bullhead City, AZ 86442
|
- sq. feet
|
- baths - beds |
show details | |

|
#36
Church St
Bullhead City, AZ 86442
|
- sq. feet
|
- baths - beds |
show details | |

|
#37
Navajo Dr Apt 1
Bullhead City, AZ 86442
|
- sq. feet
|
- baths - beds |
show details | |

|
#38
Harbor Dr
Bullhead City, AZ 86442
|
- sq. feet
|
- baths - beds |
show details | |

|
#39
Cherry Blossom Ln
Bullhead City, AZ 86442
|
1,120 sq. feet
|
- baths - beds |
show details | |

|
#40
Paseo Grande Apt 3017
Bullhead City, AZ 86442
|
- sq. feet
|
- baths - beds |
show details |
| Photo | Address | Area | Beds / Baths | Price | Details |
|---|---|---|---|---|---|

|
#41
Merrill Ave # 5
Bullhead City, AZ 86442
|
- sq. feet
|
- baths - beds |
show details | |

|
#42
Riverfront Dr # 13
Bullhead City, AZ 86442
|
- sq. feet
|
- baths - beds |
show details | |

|
#43
Colorado Blvd
Bullhead City, AZ 86442
|
818 sq. feet
|
- baths - beds |
show details | |

|
#44
Clubhouse F60
Bullhead City, AZ 86442
|
1,067 sq. feet
|
- baths - beds |
show details | |

|
#45
White Sands Dr
Bullhead City, AZ 86442
|
649 sq. feet
|
- baths - beds |
show details | |

|
#46
Highland Rd
Bullhead City, AZ 86442
|
1,438 sq. feet
|
- baths - beds |
show details | |

|
#47
Roadrunner Dr
Bullhead City, AZ 86442
|
- sq. feet
|
- baths - beds |
show details | |

|
#48
Gem St
Bullhead City, AZ 86442
|
1,007 sq. feet
|
- baths - beds |
show details | |

|
#49
Church St Apt 1
Bullhead City, AZ 86442
|
- sq. feet
|
- baths - beds |
show details | |

|
Check over 1 million property listings on Foreclosure.com!
|
browse all offers | |||


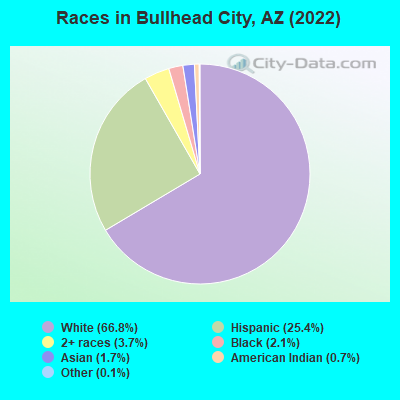
- 28,64066.8%White alone
- 10,90425.4%Hispanic
- 1,5683.7%Two or more races
- 8942.1%Black alone
- 7471.7%Asian alone
- 2870.7%American Indian alone
- 530.1%Other race alone
- 160.04%Native Hawaiian and Other
Pacific Islander alone
According to our research of Arizona and other state lists, there were 90 registered sex offenders living in Bullhead City, Arizona as of June 16, 2024.
The ratio of all residents to sex offenders in Bullhead City is 444 to 1.
Type |
2009 |
2010 |
2011 |
2012 |
2013 |
2014 |
2015 |
2016 |
2017 |
2018 |
2019 |
2020 |
2022 |
|---|---|---|---|---|---|---|---|---|---|---|---|---|---|
| Murders (per 100,000) | 1 (2.4) | 3 (7.6) | 3 (7.5) | 5 (12.4) | 0 (0.0) | 2 (5.1) | 1 (2.5) | 0 (0.0) | 2 (5.0) | 1 (2.5) | 2 (4.9) | 1 (2.4) | 1 (2.3) |
| Rapes (per 100,000) | 1 (2.4) | 0 (0.0) | 0 (0.0) | 0 (0.0) | 0 (0.0) | 1 (2.5) | 1 (2.5) | 10 (25.4) | 5 (12.5) | 20 (49.6) | 23 (56.7) | 4 (9.7) | 5 (11.6) |
| Robberies (per 100,000) | 27 (64.7) | 17 (43.0) | 25 (62.3) | 26 (64.6) | 25 (63.2) | 12 (30.5) | 18 (45.8) | 16 (40.6) | 30 (74.9) | 34 (84.3) | 25 (61.7) | 20 (48.7) | 6 (14.0) |
| Assaults (per 100,000) | 36 (86.3) | 39 (98.6) | 29 (72.3) | 55 (136.6) | 51 (128.9) | 66 (167.8) | 69 (175.5) | 73 (185.2) | 225 (562.0) | 94 (232.9) | 79 (194.9) | 83 (202.3) | 64 (149.0) |
| Burglaries (per 100,000) | 324 (776.6) | 336 (849.8) | 351 (875.3) | 330 (819.3) | 363 (917.2) | 391 (994.0) | 253 (643.5) | 308 (781.2) | 338 (844.2) | 362 (897.1) | 235 (579.8) | 193 (470.3) | 74 (172.3) |
| Thefts (per 100,000) | 1,166 (2,795) | 1,107 (2,800) | 1,068 (2,663) | 1,195 (2,967) | 1,252 (3,163) | 1,098 (2,791) | 963 (2,449) | 999 (2,534) | 994 (2,483) | 945 (2,342) | 981 (2,420) | 819 (1,996) | 326 (759.0) |
| Auto thefts (per 100,000) | 87 (208.5) | 97 (245.3) | 72 (179.6) | 101 (250.8) | 101 (255.2) | 114 (289.8) | 90 (228.9) | 98 (248.6) | 139 (347.2) | 137 (339.5) | 136 (335.5) | 98 (238.8) | 65 (151.3) |
| Arson (per 100,000) | 10 (24.0) | 6 (15.2) | 4 (10.0) | 2 (5.0) | 11 (27.8) | 5 (12.7) | 3 (7.6) | 2 (5.1) | 3 (7.5) | 4 (9.9) | 9 (22.2) | 16 (39.0) | 6 (14.0) |
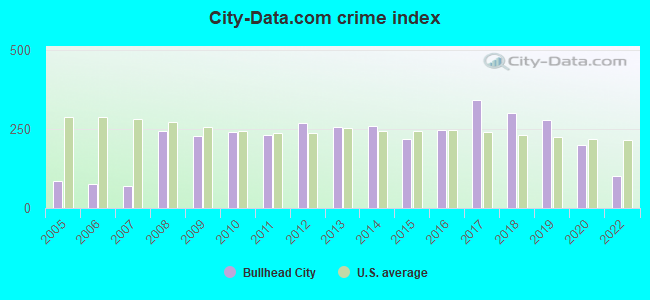
| City-Data.com crime index | 226.2 | 238.9 | 230.3 | 267.6 | 255.9 | 259.3 | 217.3 | 245.4 | 341.0 | 300.1 | 277.0 | 199.6 | 102.5 |
The City-Data.com crime index weighs serious crimes and violent crimes more heavily. Higher means more crime, U.S. average is 246.1. It adjusts for the number of visitors and daily workers commuting into cities.
Crime rate in Bullhead City detailed stats: murders, rapes, robberies, assaults, burglaries, thefts, arson
Full-time law enforcement employees in 2021, including police officers: 111 (70 officers - 64 male; 6 female).
| Officers per 1,000 residents here: | 1.67 |
| Arizona average: | 1.75 |
 Recent articles from our blog. Our writers, many of them Ph.D. graduates or candidates, create easy-to-read articles on a wide variety of topics.

 | Bullhead City area (62 replies) |
| Kingman winters vs Fort Mohave summers (27 replies) |
| Fort Mohave vs Bullhead City for Outdoor Family (0 replies) |
| What would be best for us in Northwest Arizona? (26 replies) |
| Kingman area (32 replies) |
| Is Bullhead City a Dying Town and how do we save it? (99 replies) |
Latest news from Bullhead City, AZ collected exclusively by city-data.com from local newspapers, TV, and radio stations
Ancestries: German (13.0%), American (9.5%), Irish (6.8%), English (5.9%), Italian (3.0%), Norwegian (2.6%).
Current Local Time: MST (no DST) time zone
Incorporated in 1984
Elevation: 566 feet
Land area: 45.2 square miles.
Population density: 949 people per square mile (low).
4,042 residents are foreign born (6.5% Latin America, 1.5% Asia).
| This city: | 9.4% |
| Arizona: | 13.0% |
Median real estate property taxes paid for housing units with mortgages in 2022: $1,330 (0.5%)
Median real estate property taxes paid for housing units with no mortgage in 2022: $784 (0.4%)
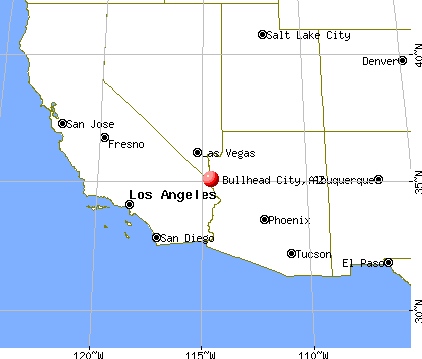
Nearest city with pop. 50,000+: Henderson, NV  (67.8 miles , pop. 175,381).
Nearest city with pop. 200,000+: Las Vegas, NV (82.7 miles , pop. 478,434).
Nearest city with pop. 1,000,000+: Phoenix, AZ (180.7 miles , pop. 1,321,045).
Nearest cities:
), ), Latitude: 35.12 N, Longitude: 114.59 W
Daytime population change due to commuting: -3,834 (-8.9%)
Workers who live and work in this city: 7,236 (46.1%)
Area code: 928

Bullhead City tourist attractions:
Bullhead City, Arizona accommodation & food services, waste management - Economy and Business Data
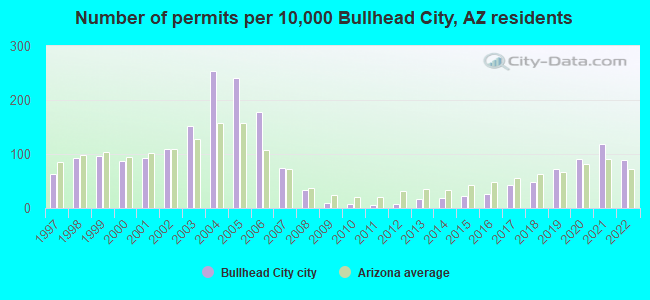
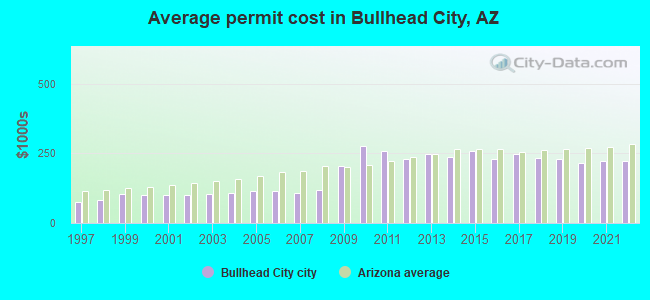
Single-family new house construction building permits:
- 2022: 297 buildings, average cost: $221,500
- 2021: 398 buildings, average cost: $220,800
- 2020: 305 buildings, average cost: $214,100
- 2019: 246 buildings, average cost: $230,000
- 2018: 161 buildings, average cost: $233,400
- 2017: 143 buildings, average cost: $247,200
- 2016: 88 buildings, average cost: $227,900
- 2015: 79 buildings, average cost: $256,800
- 2014: 61 buildings, average cost: $237,700
- 2013: 54 buildings, average cost: $249,400
- 2012: 27 buildings, average cost: $231,400
- 2011: 20 buildings, average cost: $257,700
- 2010: 28 buildings, average cost: $274,800
- 2009: 34 buildings, average cost: $206,100
- 2008: 113 buildings, average cost: $117,200
- 2007: 252 buildings, average cost: $105,600
- 2006: 597 buildings, average cost: $115,600
- 2005: 810 buildings, average cost: $112,500
- 2004: 858 buildings, average cost: $107,600
- 2003: 512 buildings, average cost: $102,900
- 2002: 373 buildings, average cost: $101,100
- 2001: 309 buildings, average cost: $99,200
- 2000: 295 buildings, average cost: $101,300
- 1999: 324 buildings, average cost: $102,800
- 1998: 310 buildings, average cost: $82,800
- 1997: 213 buildings, average cost: $74,900
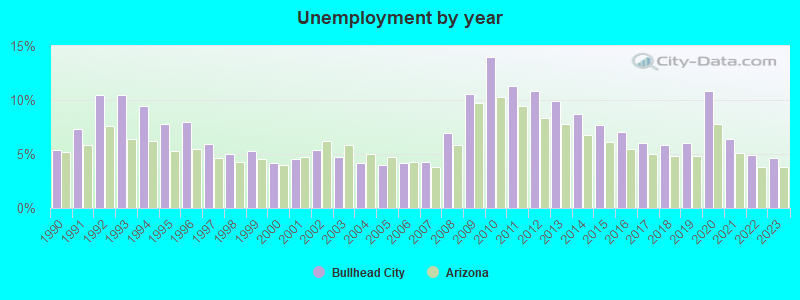
| Here: | 4.6% |
| Arizona: | 3.8% |
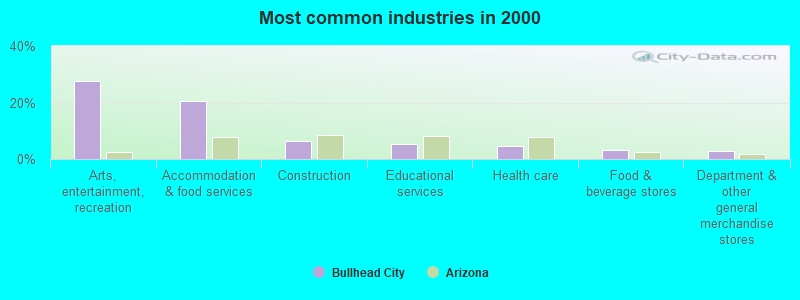
- Arts, entertainment, recreation (27.7%)
- Accommodation & food services (20.4%)
- Construction (6.3%)
- Educational services (5.2%)
- Health care (4.6%)
- Food & beverage stores (3.3%)
- Department & other general merchandise stores (2.9%)
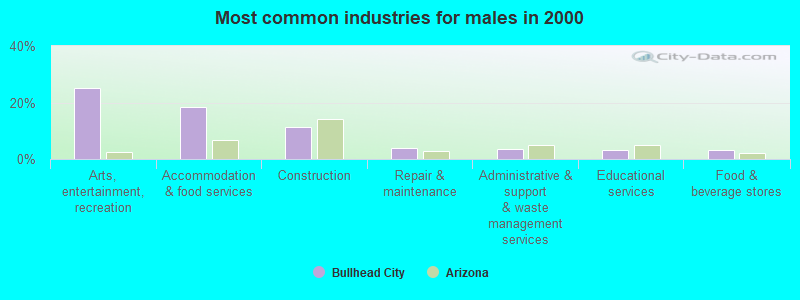
- Arts, entertainment, recreation (25.3%)
- Accommodation & food services (18.4%)
- Construction (11.3%)
- Repair & maintenance (3.8%)
- Administrative & support & waste management services (3.5%)
- Educational services (3.3%)
- Food & beverage stores (3.2%)
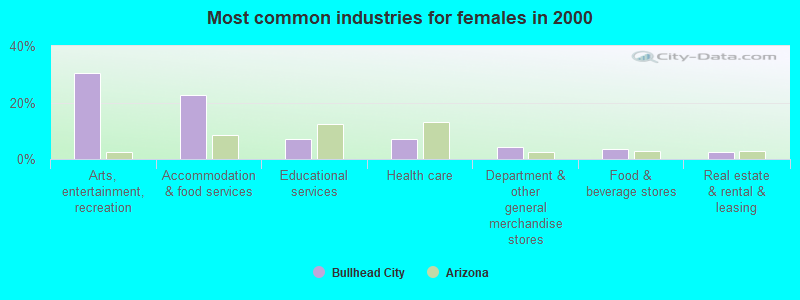
- Arts, entertainment, recreation (30.3%)
- Accommodation & food services (22.6%)
- Educational services (7.2%)
- Health care (6.9%)
- Department & other general merchandise stores (4.3%)
- Food & beverage stores (3.4%)
- Real estate & rental & leasing (2.4%)
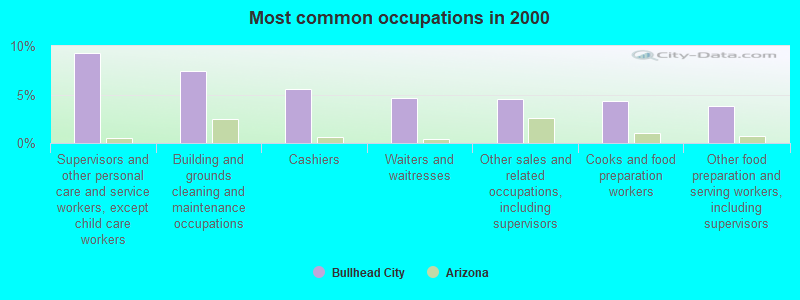
- Supervisors and other personal care and service workers, except child care workers (9.3%)
- Building and grounds cleaning and maintenance occupations (7.4%)
- Cashiers (5.5%)
- Waiters and waitresses (4.6%)
- Other sales and related occupations, including supervisors (4.6%)
- Cooks and food preparation workers (4.3%)
- Other food preparation and serving workers, including supervisors (3.9%)
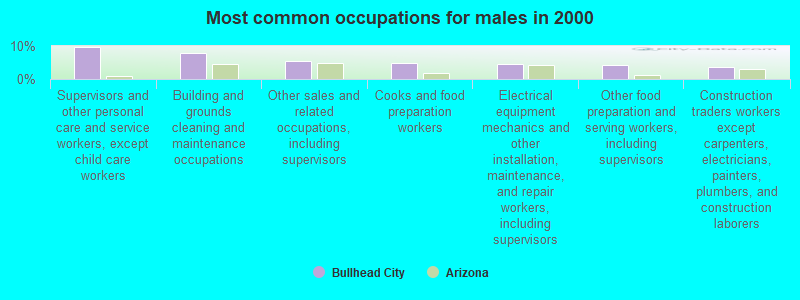
- Supervisors and other personal care and service workers, except child care workers (9.7%)
- Building and grounds cleaning and maintenance occupations (8.0%)
- Other sales and related occupations, including supervisors (5.4%)
- Cooks and food preparation workers (5.0%)
- Electrical equipment mechanics and other installation, maintenance, and repair workers, including supervisors (4.5%)
- Other food preparation and serving workers, including supervisors (4.3%)
- Construction traders workers except carpenters, electricians, painters, plumbers, and construction laborers (3.5%)
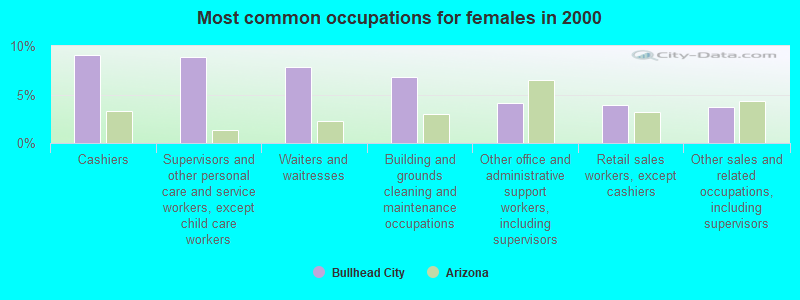
- Cashiers (9.1%)
- Supervisors and other personal care and service workers, except child care workers (8.9%)
- Waiters and waitresses (7.9%)
- Building and grounds cleaning and maintenance occupations (6.8%)
- Other office and administrative support workers, including supervisors (4.1%)
- Retail sales workers, except cashiers (3.9%)
- Other sales and related occupations, including supervisors (3.7%)
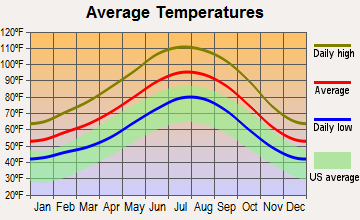
Average climate in Bullhead City, Arizona
Based on data reported by over 4,000 weather stations


|
|


(lower is better)
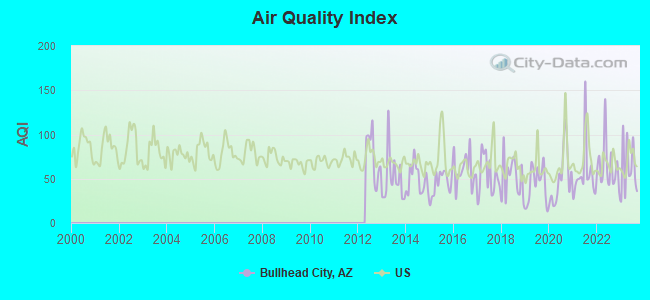
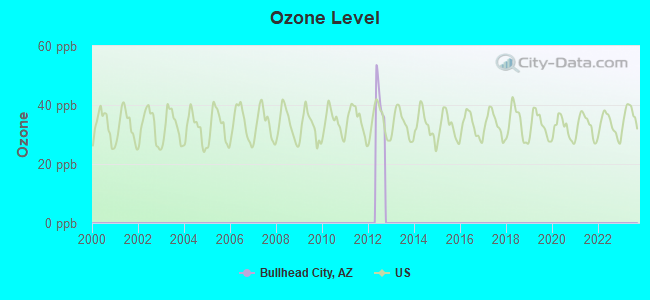
Air Quality Index (AQI) level in 2023 was 61.8. This is about average.
| City: | 61.8 |
| U.S.: | 72.6 |
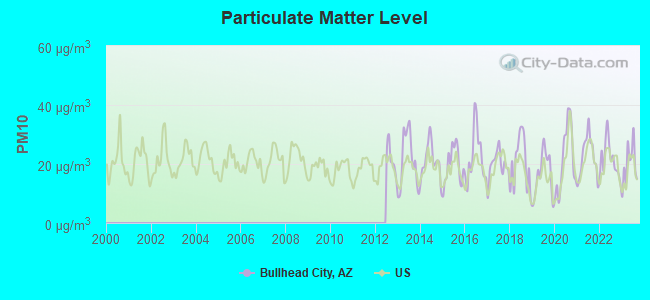
Particulate Matter (PM10) [µg/m3] level in 2023 was 19.8. This is about average. Closest monitor was 2.9 miles away from the city center.
| City: | 19.8 |
| U.S.: | 19.2 |
Earthquake activity:
Bullhead City-area historical earthquake activity is significantly above Arizona state average. It is 5152% greater than the overall U.S. average.On 6/28/1992 at 11:57:34, a magnitude 7.6 (6.2 MB, 7.6 MS, 7.3 MW, Depth: 0.7 mi, Class: Major, Intensity: VIII - XII) earthquake occurred 128.0 miles away from the city center, causing 3 deaths (1 shaking deaths, 2 other deaths) and 400 injuries, causing $100,000,000 total damage and $40,000,000 insured losses
On 10/16/1999 at 09:46:44, a magnitude 7.4 (6.3 MB, 7.4 MS, 7.2 MW, 7.3 ML) earthquake occurred 112.8 miles away from the city center
On 7/21/1952 at 11:52:14, a magnitude 7.7 (7.7 UK) earthquake occurred 249.9 miles away from the city center, causing $50,000,000 total damage
On 5/19/1940 at 04:36:40, a magnitude 7.2 (7.2 UK) earthquake occurred 145.5 miles away from Bullhead City center, causing $33,000,000 total damage
On 12/31/1934 at 18:45:56, a magnitude 7.1 (7.1 UK) earthquake occurred 181.1 miles away from Bullhead City center
On 6/28/1992 at 15:05:30, a magnitude 6.9 (6.3 MB, 6.7 MS, 6.5 MW, 6.9 ME, Depth: 3.1 mi, Class: Strong, Intensity: VII - IX) earthquake occurred 139.0 miles away from the city center
Magnitude types: body-wave magnitude (MB), energy magnitude (ME), local magnitude (ML), surface-wave magnitude (MS), moment magnitude (MW)
Natural disasters:
The number of natural disasters in Mohave County (12) is smaller than the US average (15).Major Disasters (Presidential) Declared: 8
Emergencies Declared: 2
Causes of natural disasters: Floods: 7, Storms: 5, Drought: 1, Fire: 1, Heavy Rain: 1, Hurricane: 1, Wind: 1, Winter Storm: 1, Other: 1 (Note: some incidents may be assigned to more than one category).
Hospitals and medical centers in Bullhead City:
- SPECIAL CARE HOSPICE (1514 C GOLD RUSH ROAD, SUTIE 236)
- WESTERN ARIZONA REGIONAL MEDICAL CTR (Proprietary, 2735 SILVER CREEK ROAD)
- THE LEGACY REHAB AND CARE CENTER (2812 SILVER CREEK ROAD)
- THE RIVER GARDENS REHAB AND CARE CENTER (2150 SILVER CREEK ROAD)
- BULLHEAD CITY DIALYSIS (FMC) (2650 MIRACLE MILE)
- MOHAVE HOME HEALTH (2755 SILVER CREEK ROAD, SUITE 127)
Airports and heliports located in Bullhead City:
- Laughlin/Bullhead International Airport (IFP) (Runways: 1, Commercial Ops: 1,678, Air Taxi Ops: 1,817, Itinerant Ops: 7,773, Local Ops: 1,688, Military Ops: 504)
- Willow Springs Ranch Airport (1AZ8) (Runways: 1)
- Western Arizona Regional Medical Center Heliport (22AZ)
Amtrak stations near Bullhead City:
- 3 miles: LAUGHLIN (RAMADA EXPRESS, 2121 S. CASINO DR.) - Bus Station . Services: enclosed waiting area, public restrooms, public payphones, full-service food facilities, call for car rental service, taxi stand.
- 20 miles: NEEDLES (900 FRONT ST.) . Services: partially wheelchair accessible, public payphones, free short-term parking, free long-term parking, call for taxi service, intercity bus service.
Colleges/universities with over 2000 students nearest to Bullhead City:
- Mohave Community College (about 34 miles; Kingman, AZ; Full-time enrollment: 3,309)
- Nevada State College (about 64 miles; Henderson, NV; FT enrollment: 2,346)
- University of Nevada-Las Vegas (about 76 miles; Las Vegas, NV; FT enrollment: 21,153)
- College of Southern Nevada (about 81 miles; Las Vegas, NV; FT enrollment: 18,996)
- Yavapai College (about 128 miles; Prescott, AZ; FT enrollment: 4,258)
- Northcentral University (about 136 miles; Prescott Valley, AZ; FT enrollment: 5,927)
- Barstow Community College (about 140 miles; Barstow, CA; FT enrollment: 2,120)
Private elementary/middle school in Bullhead City:
Points of interest:
Notable locations in Bullhead City: Chaparral Golf Course (A), Bullhead City Hall (B), Mohave County Library District Bullhead City Branch (C), Bullhead City Fire Department Station 6 (D), Bullhead City Fire Department Station 5 (E), Bullhead City Fire Department Station 3 (F), Bullhead City Fire Department Station 2 (G), Bullhead City Fire Department Station 1 (H), Bullhead City Police Department (I). Display/hide their locations on the map
Churches in Bullhead City include: Desert Shores Community Baptist Church (A), Community Lutheran Church (B), Calvary Chapel of Bullhead City (C), Bullhead First Southern Baptist Church (D), Bullhead City Church of Christ (E), Anointed Word International Church (F), Amazing Grace Fellowship International (G), Riviera Baptist Church (H), Valley Christian Church (I). Display/hide their locations on the map
Cemetery: Hardyville Pioneer Cemetery (1). Display/hide its location on the map
Reservoir: Lake Mohave (A). Display/hide its location on the map
Streams, rivers, and creeks: Montana Wash (A), Silver Creek (B). Display/hide their locations on the map
Tourist attractions: Colorado River Museums (2250 Highway 68) (1), Scooter's Family Fun Center (Amusement & Theme Parks; 2750 South Miracle Mile) (2), Bull Head City Watercraft Rentals (Tours & Charters; 1631 Highway 95) (3). Display/hide their approximate locations on the map
Hotels: Desert Rancho Motel (1041 Highway 95) (1), Colorado River Resort (434 River Glen Drive) (2), Howard Johnson Attorney at Law (1071 Hancock Road Suite 2) (3), Hilltop Hotel-Motel (2037 Highway 95) (4), Best Western Bullhead City Inn (2360 4th Street) (5), Grand Vista Retirment Village & Hotel (1817 Arcadia Plaza) (6), Fishermen's Trailer Lodge (491 Moser Avenue) (7), Metro Inn (2201 Rancho Colorado Blvd) (8), Oasis Park (126 Lee Avenue) (9). Display/hide their approximate locations on the map
Courts: Mohave County - Risk Management- Clerk Of Court (809 East Beale) (1), Mohave County - Finance Dept- Justice Court Dept- Court System- Justice Court Depart (2225 Trane Road) (2), Mohave County - Superior Court Judges- Superior Court Judge- Divisi (2225 Trane Road) (3). Display/hide their approximate locations on the map
Drinking water stations with addresses in Bullhead City and their reported violations in the past:
BERMUDA WATER CO INC (Address: 4544 HWY 95 , Population served: 18,000, Groundwater):Past monitoring violations:HI SAHARA OASIS (Serves CA, Population served: 500, Groundwater):
- Monitoring and Reporting (DBP) - Between JAN-2012 and MAR-2012, Contaminant: Chlorine. Follow-up actions: St Compliance achieved (DEC-19-2012)
- Monitoring and Reporting (DBP) - Between APR-2009 and JUN-2009, Contaminant: Chlorine. Follow-up actions: St Compliance achieved (JUL-30-2009)
- Monitoring and Reporting (DBP) - Between JAN-2009 and MAR-2009, Contaminant: Chlorine. Follow-up actions: St Compliance achieved (MAY-04-2009)
- Monitoring and Reporting (DBP) - Between JUL-2008 and SEP-2008, Contaminant: Chlorine. Follow-up actions: St Violation/Reminder Notice (OCT-20-2008), St Compliance achieved (JAN-12-2009)
- Monitoring and Reporting (DBP) - Between APR-2008 and JUN-2008, Contaminant: Chlorine. Follow-up actions: St Violation/Reminder Notice (AUG-14-2008), St Compliance achieved (AUG-27-2008)
- 2 routine major monitoring violations
- 3 minor monitoring violations
- 610 regular monitoring violations
- 9 other older monitoring violations
Past monitoring violations:RIVER CITY RV PARK (Address: 2225 MERRILL AVE , Population served: 160, Groundwater):
- One regular monitoring violation
Past health violations:VALLEY CHRISTIAN CHURCH (Address: 1706 N OATMAN RD , Population served: 125, Groundwater):Past monitoring violations:
- MCL, Monthly (TCR) - In AUG-2006, Contaminant: Coliform. Follow-up actions: St Compliance achieved (FEB-01-2007)
- Monitoring, Repeat Major (TCR) - In AUG-2006, Contaminant: Coliform (TCR). Follow-up actions: St Compliance achieved (FEB-01-2007)
- 3 regular monitoring violations
Past monitoring violations:PANGUITCH LAKE RESORT (Serves UT, Population served: 25, Groundwater):
- 5 routine major monitoring violations
- One regular monitoring violation
Past health violations:Past monitoring violations:
- MCL, Monthly (TCR) - In AUG-2008, Contaminant: Coliform. Follow-up actions: St Violation/Reminder Notice (SEP-29-2008), St Public Notif requested (SEP-29-2008), St Compliance achieved (JUL-01-2010)
- 3 routine major monitoring violations
- 3 regular monitoring violations
| This city: | 2.4 people |
| Arizona: | 2.6 people |
| This city: | 62.7% |
| Whole state: | 66.2% |
| This city: | 10.3% |
| Whole state: | 7.8% |
Likely homosexual households (counted as self-reported same-sex unmarried-partner households)
- Lesbian couples: 0.5% of all households
- Gay men: 0.3% of all households
People in group quarters in Bullhead City in 2010:
- 93 people in nursing facilities/skilled-nursing facilities
- 37 people in other noninstitutional facilities
- 33 people in emergency and transitional shelters (with sleeping facilities) for people experiencing homelessness
- 3 people in group homes for juveniles (non-correctional)
People in group quarters in Bullhead City in 2000:
- 77 people in nursing homes
- 29 people in other noninstitutional group quarters
- 9 people in other group homes
- 2 people in wards in general hospitals for patients who have no usual home elsewhere
Banks with most branches in Bullhead City (2011 data):
- Wells Fargo Bank, National Association: Lakeside & Hancock Branch at 1775 Lakeside Drive, branch established on 1996/12/31; Bullhead City Branch at 1751 Highway 95, branch established on 1980/12/15. Info updated 2011/04/05: Bank assets: $1,161,490.0 mil, Deposits: $905,653.0 mil, headquarters in Sioux Falls, SD, positive income, 6395 total offices, Holding Company: Wells Fargo & Company
- JPMorgan Chase Bank, National Association: Holiday Shores Branch at 1465 Palma Way, branch established on 1972/02/07; Hwy 95 And Long Ave Branch at 3699 Hwy 95, Ste 900, branch established on 2009/08/18. Info updated 2011/11/10: Bank assets: $1,811,678.0 mil, Deposits: $1,190,738.0 mil, headquarters in Columbus, OH, positive income, International Specialization, 5577 total offices, Holding Company: Jpmorgan Chase & Co.
- Compass Bank: Bullhead City Kbc Branch at 2840 Highway 95, Suite 414, branch established on 1997/04/10. Info updated 2011/02/24: Bank assets: $63,107.0 mil, Deposits: $46,232.4 mil, headquarters in Birmingham, AL, negative income in the last year, Commercial Lending Specialization, 720 total offices, Holding Company: Banco Bilbao Vizcaya Argentaria, S.A.
- Mutual of Omaha Bank: Bullhead City Branch at 2350 Miracle Mile, Ste 600, branch established on 2004/12/13. Info updated 2011/07/21: Bank assets: $5,553.2 mil, Deposits: $4,599.7 mil, headquarters in Omaha, NE, positive income, Commercial Lending Specialization, 45 total offices
- Mohave State Bank: Bullhead City Branch at 3651 Highway 95, branch established on 1999/02/22. Info updated 2010/07/22: Bank assets: $282.8 mil, Deposits: $243.7 mil, headquarters in Lake Havasu City, AZ, positive income, Commercial Lending Specialization, 6 total offices, Holding Company: State Bank Corp.
- National Bank of Arizona: Bullhead City Branch at 1979 Highway 95, Suite #15, branch established on 1985/05/16. Info updated 2008/09/11: Bank assets: $4,485.6 mil, Deposits: $3,731.3 mil, headquarters in Tucson, AZ, positive income, Commercial Lending Specialization, 73 total offices, Holding Company: Zions Bancorporation
- Mission Bank: Bullhead City Branch at 1455 Palma Way, branch established on 2006/04/10. Info updated 2010/12/13: Bank assets: $89.6 mil, Deposits: $78.6 mil, headquarters in Kingman, AZ, positive income, Commercial Lending Specialization, 3 total offices, Holding Company: Community Bancshares, Inc.
- Bank of America, National Association: Bullhead City Branch at 1755 Lakeside Drive, branch established on 1976/05/14. Info updated 2009/11/18: Bank assets: $1,451,969.3 mil, Deposits: $1,077,176.8 mil, headquarters in Charlotte, NC, positive income, 5782 total offices, Holding Company: Bank Of America Corporation
- U.S. Bank National Association: Bullhead City Branch at 2840 Highway 95 Suite 300, branch established on 2001/12/03. Info updated 2012/01/30: Bank assets: $330,470.8 mil, Deposits: $236,091.5 mil, headquarters in Cincinnati, OH, positive income, 3121 total offices, Holding Company: U.S. Bancorp
For population 15 years and over in Bullhead City:
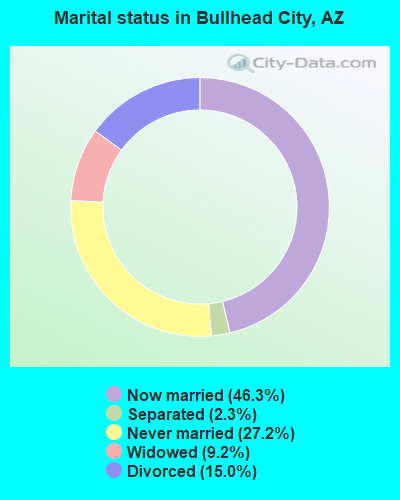
- Never married: 27.2%
- Now married: 46.3%
- Separated: 2.3%
- Widowed: 9.2%
- Divorced: 15.0%
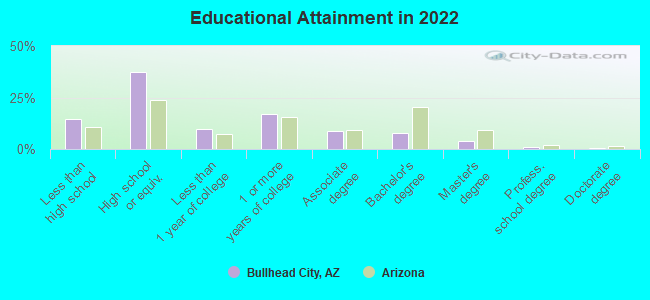
For population 25 years and over in Bullhead City:
- High school or higher: 85.0%
- Bachelor's degree or higher: 12.1%
- Graduate or professional degree: 4.5%
- Unemployed: 6.5%
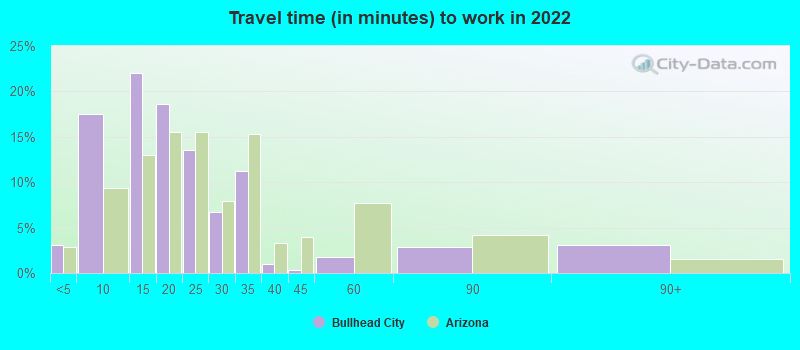
- Mean travel time to work (commute): 19.8 minutes
| Here: | 10.7 |
| Arizona average: | 12.2 |
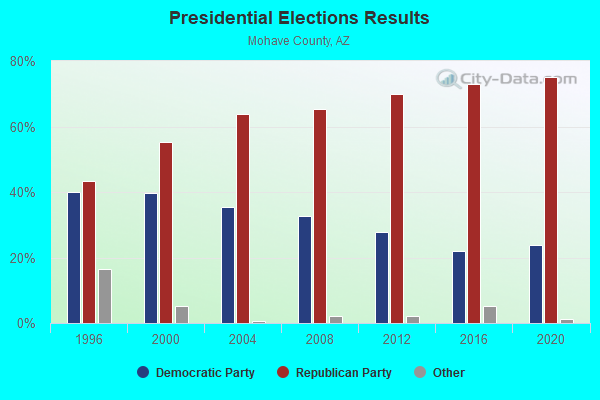
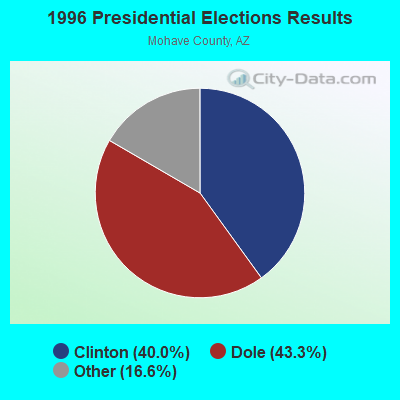
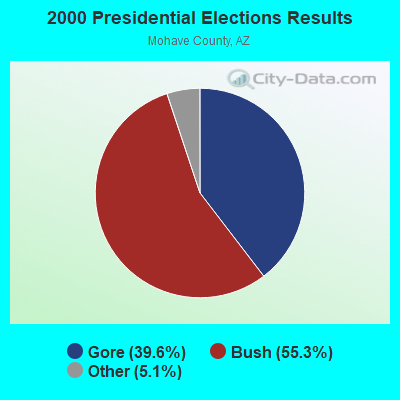
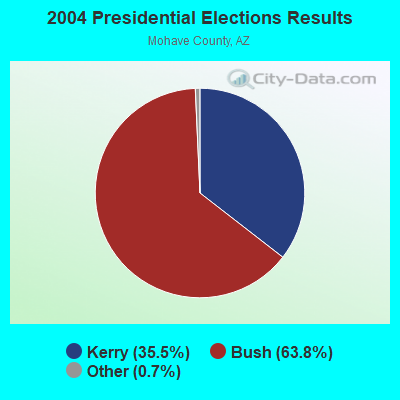
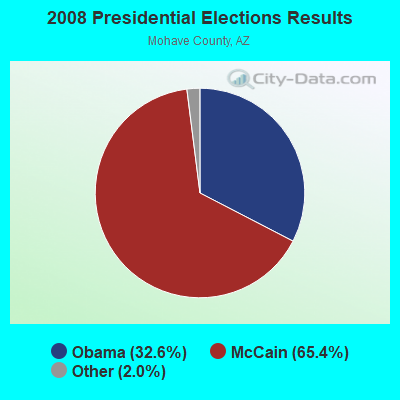
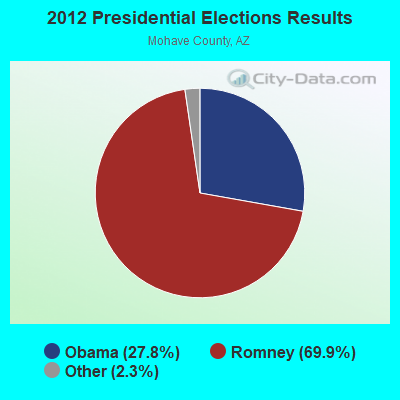
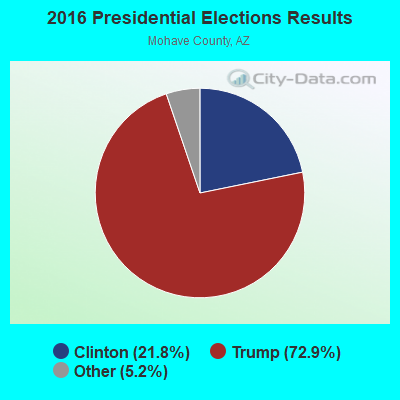
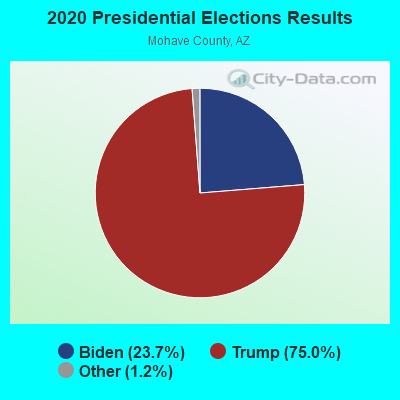
Graphs represent county-level data. Detailed 2008 Election Results
Religion statistics for Bullhead City, AZ (based on Mohave County data)
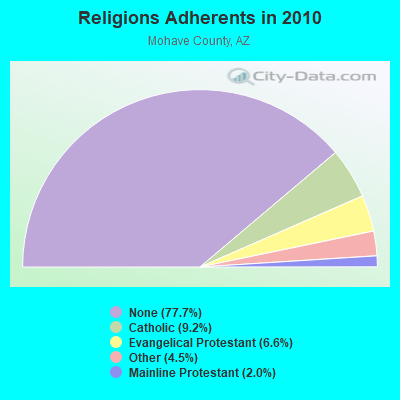
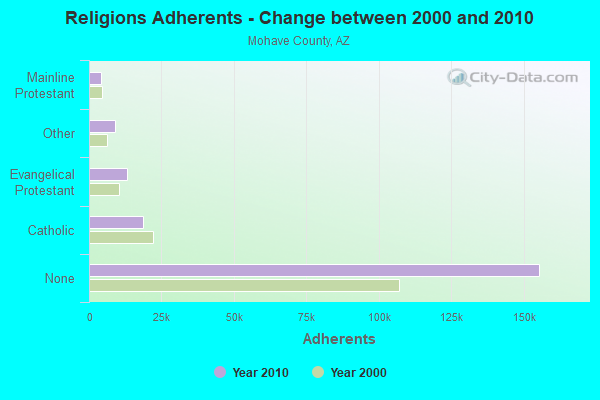
| Religion | Adherents | Congregations |
|---|---|---|
| Catholic | 18,500 | 5 |
| Evangelical Protestant | 13,180 | 97 |
| Other | 8,930 | 22 |
| Mainline Protestant | 4,061 | 12 |
| Orthodox | 64 | 2 |
| Black Protestant | - | 1 |
| None | 155,451 | - |
Food Environment Statistics:
| This county: | 1.23 / 10,000 pop. |
| Arizona: | 1.36 / 10,000 pop. |
| Here: | 0.10 / 10,000 pop. |
| Arizona: | 0.14 / 10,000 pop. |
| This county: | 0.61 / 10,000 pop. |
| State: | 0.55 / 10,000 pop. |
| Mohave County: | 3.62 / 10,000 pop. |
| Arizona: | 2.47 / 10,000 pop. |
| This county: | 6.84 / 10,000 pop. |
| Arizona: | 6.21 / 10,000 pop. |
| This county: | 9.3% |
| Arizona: | 8.0% |
| Here: | 26.2% |
| Arizona: | 22.8% |
| This county: | 12.0% |
| State: | 14.2% |
Health and Nutrition:
| Bullhead City: | 48.7% |
| State: | 49.0% |
| Bullhead City: | 44.7% |
| State: | 47.3% |
| This city: | 28.8 |
| Arizona: | 28.5 |
| Bullhead City: | 22.3% |
| State: | 20.8% |
| Here: | 11.4% |
| Arizona: | 10.2% |
| Here: | 6.9 |
| Arizona: | 6.8 |
| Here: | 35.2% |
| Arizona: | 33.5% |
| This city: | 53.6% |
| Arizona: | 56.1% |
| This city: | 76.1% |
| Arizona: | 79.4% |
More about Health and Nutrition of Bullhead City, AZ Residents
| Local government employment and payroll (March 2022) | |||||
| Function | Full-time employees | Monthly full-time payroll | Average yearly full-time wage | Part-time employees | Monthly part-time payroll |
|---|---|---|---|---|---|
| Police Protection - Officers | 71 | $468,775 | $79,230 | 0 | $0 |
| Police - Other | 31 | $165,327 | $63,998 | 0 | $0 |
| Streets and Highways | 29 | $101,162 | $41,860 | 0 | $0 |
| Water Supply | 24 | $155,710 | $77,855 | 0 | $0 |
| Other Government Administration | 17 | $116,335 | $82,119 | 0 | $0 |
| Sewerage | 14 | $62,431 | $53,512 | 0 | $0 |
| Parks and Recreation | 13 | $49,060 | $45,286 | 30 | $38,904 |
| Financial Administration | 13 | $78,037 | $72,034 | 0 | $0 |
| Other and Unallocable | 11 | $38,345 | $41,831 | 0 | $0 |
| Judicial and Legal | 9 | $57,704 | $76,939 | 0 | $0 |
| Transit | 8 | $35,450 | $53,175 | 0 | $0 |
| Housing and Community Development (Local) | 8 | $48,468 | $72,702 | 0 | $0 |
| Totals for Government | 248 | $1,376,803 | $66,620 | 30 | $38,904 |
Bullhead City government finances - Expenditure in 2021 (per resident):
- Construction - Regular Highways: $4,423,000 ($103.05)
Central Staff Services: $8,000 ($0.19)
- Current Operations - Police Protection: $13,696,000 ($319.11)
General - Other: $11,684,000 ($272.23)
Sewerage: $7,573,000 ($176.44)
Regular Highways: $4,769,000 ($111.11)
Parks and Recreation: $3,386,000 ($78.89)
Judicial and Legal Services: $2,882,000 ($67.15)
Central Staff Services: $1,320,000 ($30.75)
Protective Inspection and Regulation - Other: $1,134,000 ($26.42)
General Public Buildings: $1,095,000 ($25.51)
Financial Administration: $1,045,000 ($24.35)
Water Utilities: $434,000 ($10.11)
Health - Other: $340,000 ($7.92)
Housing and Community Development: $202,000 ($4.71)
Natural Resources - Other: $77,000 ($1.79)
- General - Interest on Debt: $616,000 ($14.35)
- Intergovernmental to Local - Other - General - Other: $163,000 ($3.80)
Other - Elementary and Secondary Education: $13,000 ($0.30)
- Intergovernmental to State - General - Other: $31,000 ($0.72)
Corrections: $5,000 ($0.12)
- Other Capital Outlay - General Public Building: $1,096,000 ($25.54)
Parks and Recreation: $635,000 ($14.79)
Regular Highways: $289,000 ($6.73)
Central Staff Services: $217,000 ($5.06)
Judicial and Legal Services: $43,000 ($1.00)
Miscellaneous Commercial Activities - Other: $16,000 ($0.37)
Protective Inspection and Regulation - Other: $16,000 ($0.37)
- Total Salaries and Wages: $17,498,000 ($407.69)
Bullhead City government finances - Revenue in 2021 (per resident):
- Charges - Sewerage: $9,783,000 ($227.94)
Other: $9,151,000 ($213.21)
Parks and Recreation: $309,000 ($7.20)
- Federal Intergovernmental - Other: $259,000 ($6.03)
Sewerage: $244,000 ($5.68)
Housing and Community Development: $145,000 ($3.38)
- Local Intergovernmental - Other: $1,197,000 ($27.89)
- Miscellaneous - Special Assessments: $2,536,000 ($59.09)
Fines and Forfeits: $178,000 ($4.15)
Donations From Private Sources: $108,000 ($2.52)
Rents: $70,000 ($1.63)
Sale of Property: $22,000 ($0.51)
- Revenue - Water Utilities: $717,000 ($16.71)
Transit Utilities: $172,000 ($4.01)
- State Intergovernmental - General Local Government Support: $12,455,000 ($290.19)
Highways: $4,213,000 ($98.16)
Other: $161,000 ($3.75)
Housing and Community Development: $6,000 ($0.14)
- Tax - General Sales and Gross Receipts: $16,665,000 ($388.28)
Public Utilities Sales: $912,000 ($21.25)
Other License: $684,000 ($15.94)
Occupation and Business License - Other: $218,000 ($5.08)
Other Selective Sales: $91,000 ($2.12)
Other: $17,000 ($0.40)
Alcoholic Beverage License: $2,000 ($0.05)
Bullhead City government finances - Debt in 2021 (per resident):
- Long Term Debt - Beginning Outstanding - Unspecified Public Purpose: $28,403,000 ($661.77)
Outstanding Unspecified Public Purpose: $26,808,000 ($624.60)
Retired Unspecified Public Purpose: $1,595,000 ($37.16)
Bullhead City government finances - Cash and Securities in 2021 (per resident):
- Bond Funds - Cash and Securities: $159,000 ($3.70)
| Businesses in Bullhead City, AZ | ||||
| Name | Count | Name | Count | |
|---|---|---|---|---|
| AT&T | 1 | Lane Bryant | 1 | |
| Ace Hardware | 2 | Little Caesars Pizza | 1 | |
| Arby's | 1 | Long John Silver's | 1 | |
| AutoZone | 1 | Lowe's | 1 | |
| Bed Bath & Beyond | 1 | McDonald's | 3 | |
| Best Western | 1 | New Balance | 1 | |
| Big O Tires | 1 | Nike | 3 | |
| Budget Car Rental | 1 | Panda Express | 2 | |
| Buffalo Wild Wings | 1 | Payless | 1 | |
| CVS | 1 | PetSmart | 1 | |
| Carl\s Jr. | 2 | Pizza Hut | 2 | |
| Chevrolet | 1 | RadioShack | 1 | |
| Circle K | 4 | SONIC Drive-In | 1 | |
| Cold Stone Creamery | 1 | Safeway | 1 | |
| Curves | 1 | Sam's Club | 1 | |
| Dennys | 1 | Sears | 1 | |
| Domino's Pizza | 1 | Sprint Nextel | 1 | |
| Famous Footwear | 1 | Staples | 1 | |
| Fashion Bug | 1 | Starbucks | 2 | |
| FedEx | 10 | Subway | 3 | |
| GameStop | 1 | T-Mobile | 2 | |
| Goodwill | 1 | Taco Bell | 2 | |
| H&R Block | 1 | Target | 1 | |
| Home Depot | 1 | U-Haul | 2 | |
| JCPenney | 1 | UPS | 8 | |
| Jones New York | 1 | Vans | 2 | |
| KFC | 1 | Vons | 1 | |
| Kmart | 1 | Walgreens | 1 | |
| Kohl's | 1 | Walmart | 1 | |
| Kroger | 1 | Wendy's | 1 | |
Strongest AM radio stations in Bullhead City:
- KZZZ (1490 AM; 1 kW; BULLHEAD CITY, AZ; Owner: CAMERON BROADCASTING, INC.)
- KFLG (1000 AM; daytime; 1 kW; BULLHEAD CITY, AZ; Owner: CAMERON BROADCASTING, INC.)
- KDWN (720 AM; 50 kW; LAS VEGAS, NV; Owner: RADIO NEVADA CORP.)
- KXNT (840 AM; 50 kW; NORTH LAS VEGAS, NV; Owner: INFINITY RADIO OPERATIONS INC.)
- KLSQ (870 AM; 10 kW; WHITNEY, NV; Owner: KLSQ-AM LICENSE CORPORATION)
- KMIA (710 AM; 50 kW; BLACK CANYON CITY, AZ; Owner: ENTRAVISION HOLDINGS, LLC)
- KTOX (1340 AM; 1 kW; NEEDLES, CA; Owner: CREATIVE BROADCASTING SERVICES, INC.)
- KLAC (570 AM; 50 kW; LOS ANGELES, CA; Owner: AMFM RADIO LICENSES, L.L.C.)
- KFI (640 AM; 50 kW; LOS ANGELES, CA; Owner: CAPSTAR TX LIMITED PARTNERSHIP)
- KPLS (830 AM; 50 kW; ORANGE, CA; Owner: CRN LICENSES, LLC)
- KFNX (1100 AM; 50 kW; CAVE CREEK, AZ; Owner: NORTH AMERICAN BROADCASTING CO., INC.)
- KFMB (760 AM; 50 kW; SAN DIEGO, CA; Owner: MIDWEST TELEVISION, INC.)
- KSPN (710 AM; 50 kW; LOS ANGELES, CA; Owner: KABC-AM RADIO, INC.)
Strongest FM radio stations in Bullhead City:
- KFLG-FM (94.7 FM; KINGMAN, AZ; Owner: CAMERON BROADCASTING, INC.)
- K240CL (95.9 FM; BULLHEAD CITY, AZ; Owner: CAMERON BROADCASTING, INC.)
- KNKK (107.1 FM; NEEDLES, CA; Owner: CAMERON BROADCASTING, INC.)
- KADD (93.5 FM; LAUGHLIN, NV; Owner: M&M BROADCASTING LLC)
- KLUK (97.9 FM; NEEDLES, CA; Owner: CAMERON BROADCASTING, INC.)
- K256AA (99.1 FM; KINGMAN, AZ; Owner: CAROL L. VINE DBA VINE COMMUNICATNS)
- K264AB (100.7 FM; KINGMAN, AZ; Owner: CAROL L. VINE DBA VINE COMMUNICATNS)
- K268AC (101.5 FM; KINGMAN, AZ; Owner: CAROL L. VINE DBA VINE COMMUNICATNS)
- KRRN (92.7 FM; DOLAN SPRINGS, AZ; Owner: ENTRAVISION HOLDINGS, LLC)
- K242AQ (96.3 FM; KINGMAN, AZ; Owner: DONALD F. HENDREN)
- K224BV (92.7 FM; KINGMAN, AZ; Owner: RICHARD R. FULKERSON)
- K280EH (103.9 FM; KINGMAN, AZ; Owner: JANE G. BREDER)
- KGMN (100.1 FM; KINGMAN, AZ; Owner: NEW WEST BROADCASTING SYSTEMS, INC.)
- KVGS (107.9 FM; LAUGHLIN, NV; Owner: DESERT SKY MEDIA, LLC)
- K263AI (100.5 FM; LAKE HAVASU CITY, AZ; Owner: DONALD F. HENDREN)
- KRCY-FM (96.7 FM; LAKE HAVASU CITY, AZ; Owner: RICK L. MURPHY)
- KRRK (101.1 FM; LAKE HAVASU CITY, AZ; Owner: SMOKE AND MIRRORS, LLC)
- KZUL-FM (104.5 FM; LAKE HAVASU CITY, AZ; Owner: MAD DOG WIRELESS, INC.)
- KJJJ (102.3 FM; LAKE HAVASU CITY, AZ; Owner: STEVEN M. GREELEY)
- KXPT (97.1 FM; LAS VEGAS, NV; Owner: LOTUS BROADCASTING CORP.)
TV broadcast stations around Bullhead City:
- KACN-LP (Channel 26; BULLHEAD CITY, AZ; Owner: TRI-STATE BROADCASTING, INC.)
- K61HA (Channel 61; BULLHEAD CITY, AZ; Owner: TRINITY BROADCASTING NETWORK)
- K53DG (Channel 53; LAUGHLIN, NV; Owner: CLARK COUNTY SCHOOL DISTRICT)
- K02HR (Channel 2; BULLHEAD CITY, AZ; Owner: MOHAVE COUNTY BOARD OF SUPERVISORS)
- K09KG (Channel 9; BULLHEAD CITY, AZ; Owner: MOHAVE COUNTY BOARD OF SUPERVISORS)
- KMOH-TV (Channel 6; KINGMAN, AZ; Owner: MULTIMEDIA HOLDINGS CORPORATION)
- K04GT (Channel 4; BULLHEAD CITY, AZ; Owner: MOHAVE COUNTY BOARD OF SUPERVISORS)
- National Bridge Inventory (NBI) Statistics
- 48Number of bridges
- 594ft / 181mTotal length
- $36,000Total costs
- 566,108Total average daily traffic
- 29,883Total average daily truck traffic
- 583,217Total future (year 2034) average daily traffic
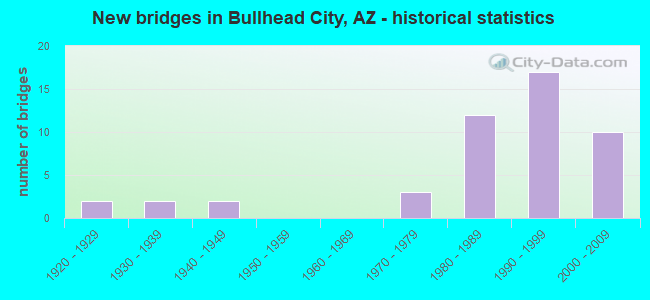
- New bridges - historical statistics
- 21920-1929
- 21930-1939
- 21940-1949
- 31970-1979
- 121980-1989
- 171990-1999
- 102000-2009
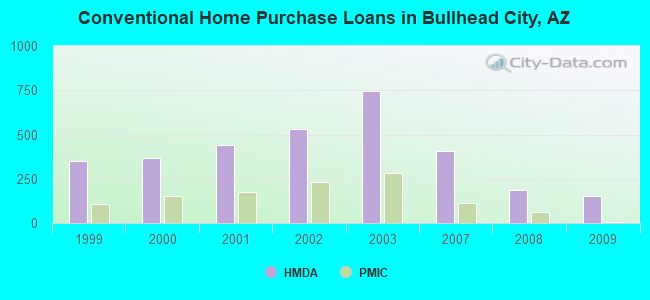
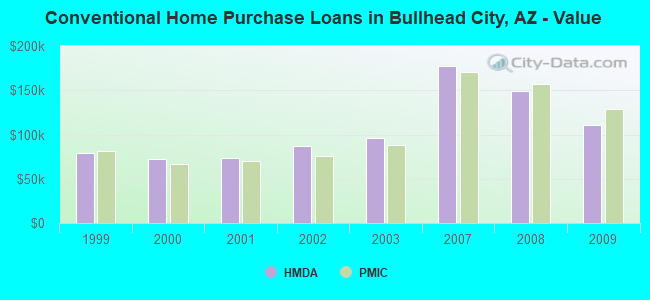
| Home Mortgage Disclosure Act Aggregated Statistics For Year 2009 (Based on 3 full and 3 partial tracts) | ||||||||||||
| A) FHA, FSA/RHS & VA Home Purchase Loans | B) Conventional Home Purchase Loans | C) Refinancings | D) Home Improvement Loans | F) Non-occupant Loans on < 5 Family Dwellings (A B C & D) | G) Loans On Manufactured Home Dwelling (A B C & D) | |||||||
|---|---|---|---|---|---|---|---|---|---|---|---|---|
| Number | Average Value | Number | Average Value | Number | Average Value | Number | Average Value | Number | Average Value | Number | Average Value | |
| LOANS ORIGINATED | 107 | $119,043 | 153 | $110,673 | 301 | $158,477 | 12 | $83,584 | 169 | $147,366 | 75 | $84,242 |
| APPLICATIONS APPROVED, NOT ACCEPTED | 9 | $92,930 | 19 | $104,814 | 34 | $162,469 | 4 | $66,990 | 18 | $144,478 | 10 | $79,840 |
| APPLICATIONS DENIED | 31 | $110,399 | 47 | $146,611 | 254 | $156,666 | 46 | $54,226 | 89 | $187,697 | 80 | $65,578 |
| APPLICATIONS WITHDRAWN | 14 | $113,641 | 23 | $130,313 | 107 | $147,095 | 19 | $61,614 | 30 | $170,302 | 34 | $76,926 |
| FILES CLOSED FOR INCOMPLETENESS | 4 | $106,212 | 5 | $136,818 | 23 | $155,878 | 3 | $36,700 | 10 | $125,447 | 3 | $85,953 |
Detailed HMDA statistics for the following Tracts: 9514.00 , 9515.00, 9516.00, 9517.00, 9518.00, 9519.00
| Private Mortgage Insurance Companies Aggregated Statistics For Year 2009 (Based on 3 full and 3 partial tracts) | ||||||
| A) Conventional Home Purchase Loans | B) Refinancings | C) Non-occupant Loans on < 5 Family Dwellings (A & B) | ||||
|---|---|---|---|---|---|---|
| Number | Average Value | Number | Average Value | Number | Average Value | |
| LOANS ORIGINATED | 4 | $129,290 | 3 | $116,700 | 0 | $0 |
| APPLICATIONS APPROVED, NOT ACCEPTED | 5 | $212,168 | 1 | $375,230 | 3 | $220,930 |
| APPLICATIONS DENIED | 3 | $140,967 | 0 | $0 | 0 | $0 |
| APPLICATIONS WITHDRAWN | 0 | $0 | 0 | $0 | 0 | $0 |
| FILES CLOSED FOR INCOMPLETENESS | 0 | $0 | 0 | $0 | 0 | $0 |
Detailed PMIC statistics for the following Tracts: 9514.00 , 9515.00, 9516.00, 9517.00, 9518.00, 9519.00
2003 - 2018 National Fire Incident Reporting System (NFIRS) incidents
- Fire incident types reported to NFIRS in Bullhead City, AZ
- 1,12440.1%Outside Fires
- 80228.6%Mobile Property/Vehicle Fires
- 76027.1%Structure Fires
- 1204.3%Other
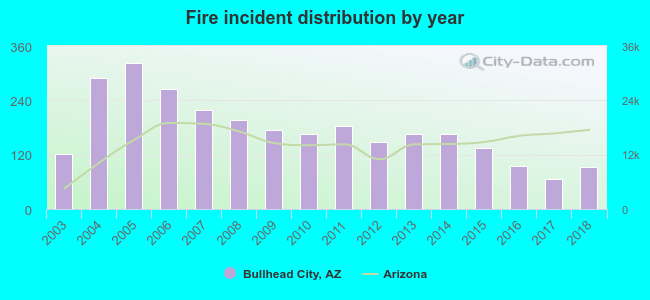 Based on the data from the years 2003 - 2018 the average number of fire incidents per year is 175. The highest number of reported fire incidents - 323 took place in 2005, and the least - 66 in 2017. The data has a dropping trend.
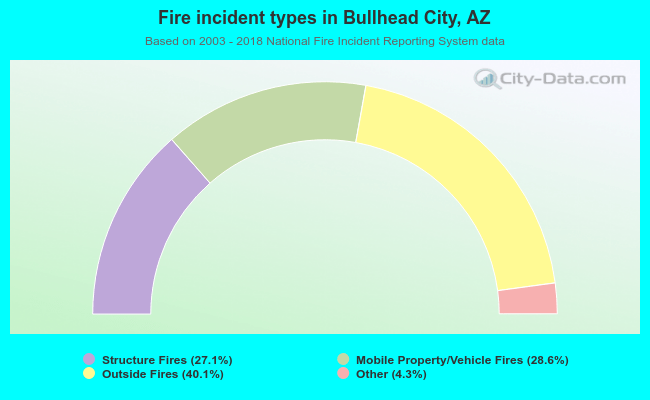 When looking into fire subcategories, the most reports belonged to: Outside Fires (40.1%), and Mobile Property/Vehicle Fires (28.6%).
Fire-safe hotels and motels in Bullhead City, Arizona:
- Motel 6 No 1116, 1616 Hwy 95, Bullhead City, Arizona 86442 , Phone: (928) 763-1002, Fax: (928) 763-3868
- Econo Lodge Riverside, 1717 Hwy 95, Bullhead City, Arizona 86442 , Phone: (928) 758-8080
- Days Inn Bullhead City Inn, 1126 Hwy 95, Bullhead City, Arizona 86429 , Phone: (928) 754-3000, Fax: (928) 754-5234
| Most common first names in Bullhead City, AZ among deceased individuals | ||
| Name | Count | Lived (average) |
|---|---|---|
| Robert | 272 | 70.2 years |
| William | 232 | 72.1 years |
| John | 220 | 73.2 years |
| James | 203 | 70.9 years |
| Charles | 135 | 74.3 years |
| Mary | 135 | 76.1 years |
| George | 117 | 75.1 years |
| Donald | 112 | 70.5 years |
| Dorothy | 102 | 74.9 years |
| Richard | 95 | 68.5 years |
| Most common last names in Bullhead City, AZ among deceased individuals | ||
| Last name | Count | Lived (average) |
|---|---|---|
| Smith | 74 | 72.4 years |
| Johnson | 63 | 75.1 years |
| Williams | 55 | 74.7 years |
| Brown | 48 | 74.2 years |
| Jones | 46 | 72.2 years |
| Miller | 45 | 70.4 years |
| Anderson | 39 | 75.6 years |
| Clark | 31 | 70.5 years |
| Wilson | 30 | 71.1 years |
| Moore | 29 | 73.5 years |
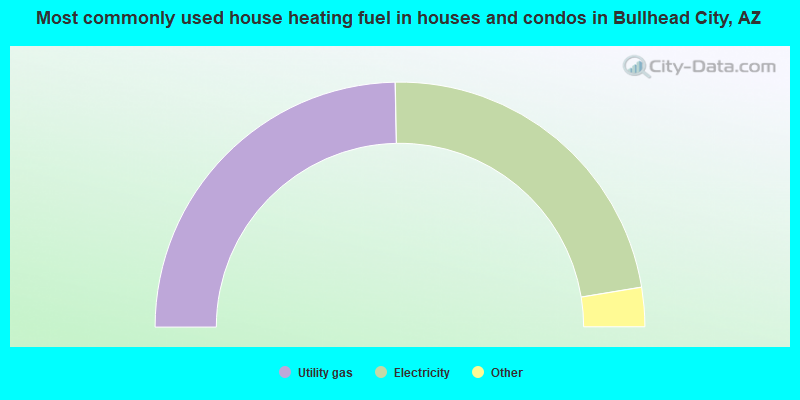
- 49.4%Utility gas
- 45.4%Electricity
- 2.6%Bottled, tank, or LP gas
- 0.8%Wood
- 0.6%Fuel oil, kerosene, etc.
- 0.6%Solar energy
- 0.5%No fuel used
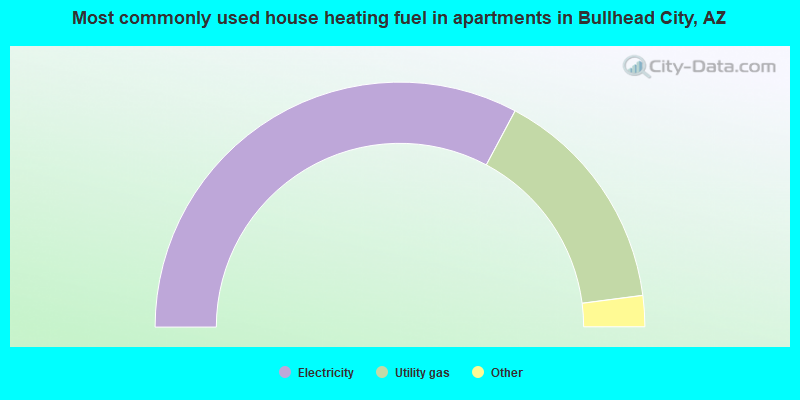
- 65.6%Electricity
- 30.3%Utility gas
- 2.0%No fuel used
- 1.5%Bottled, tank, or LP gas
- 0.2%Fuel oil, kerosene, etc.
- 0.2%Wood
- 0.2%Other fuel
Bullhead City compared to Arizona state average:
- Median household income below state average.
- Median house value below state average.
- Unemployed percentage below state average.
- Median age significantly above state average.
- Length of stay since moving in significantly above state average.
- Percentage of population with a bachelor's degree or higher below state average.
Bullhead City on our top lists:
- #21 on the list of "Top 101 cities with largest percentage of females in industries: arts, entertainment, and recreation (population 5,000+)"
- #26 on the list of "Top 100 cities with strongest arts, entertainment, recreation, accommodation and food services industries"
- #32 on the list of "Top 101 cities with largest percentage of males in industries: arts, entertainment, and recreation (population 5,000+)"
- #92 on the list of "Top 101 cities with the most people born in other U.S. states (population 5,000+)"
- #94 on the list of "Top 101 cities with the largest percentage of mobile homes (2,000+ housing units)"
- #97 on the list of "Top 101 cities with largest percentage of females in industries: accommodation and food services (population 5,000+)"
- #6 on the list of "Top 101 counties with the lowest Particulate Matter (PM2.5) Annual air pollution readings in 2012 (µg/m3)"
- #11 on the list of "Top 101 counties with the highest number of deaths per 1000 residents 2007-2013 (pop. 50,000+)"
- #22 on the list of "Top 101 counties with the lowest percentage of residents relocating to foreign countries in 2011"
- #37 on the list of "Top 101 counties with the largest decrease in the number of births per 1000 residents 2000-2006 to 2007-2013 (pop 50,000+)"
- #50 on the list of "Top 101 counties with the smallest number of children under 18 without health insurance coverage in 2000 (pop. 50,000+)"

|
|
Total of 22 patent applications in 2008-2024.