Burlington, Wisconsin Submit your own pictures of this city and show them to the world
OSM Map
General Map
Google Map
MSN Map
OSM Map
General Map
Google Map
MSN Map
OSM Map
General Map
Google Map
MSN Map
OSM Map
General Map
Google Map
MSN Map
Please wait while loading the map...
Population in 2022: 11,005 (100% urban, 0% rural). Population change since 2000: +10.8%Males: 5,567 Females: 5,438
March 2022 cost of living index in Burlington: 95.2 (less than average, U.S. average is 100) Percentage of residents living in poverty in 2022: 10.4%for White Non-Hispanic residents , 59.8% for Black residents , 25.9% for Hispanic or Latino residents , 100.0% for American Indian residents , 27.5% for other race residents , 8.6% for two or more races residents )
Profiles of local businesses
Business Search - 14 Million verified businesses
Data:
Median household income ($)
Median household income (% change since 2000)
Household income diversity
Ratio of average income to average house value (%)
Ratio of average income to average rent
Median household income ($) - White
Median household income ($) - Black or African American
Median household income ($) - Asian
Median household income ($) - Hispanic or Latino
Median household income ($) - American Indian and Alaska Native
Median household income ($) - Multirace
Median household income ($) - Other Race
Median household income for houses/condos with a mortgage ($)
Median household income for apartments without a mortgage ($)
Races - White alone (%)
Races - White alone (% change since 2000)
Races - Black alone (%)
Races - Black alone (% change since 2000)
Races - American Indian alone (%)
Races - American Indian alone (% change since 2000)
Races - Asian alone (%)
Races - Asian alone (% change since 2000)
Races - Hispanic (%)
Races - Hispanic (% change since 2000)
Races - Native Hawaiian and Other Pacific Islander alone (%)
Races - Native Hawaiian and Other Pacific Islander alone (% change since 2000)
Races - Two or more races (%)
Races - Two or more races (% change since 2000)
Races - Other race alone (%)
Races - Other race alone (% change since 2000)
Racial diversity
Unemployment (%)
Unemployment (% change since 2000)
Unemployment (%) - White
Unemployment (%) - Black or African American
Unemployment (%) - Asian
Unemployment (%) - Hispanic or Latino
Unemployment (%) - American Indian and Alaska Native
Unemployment (%) - Multirace
Unemployment (%) - Other Race
Population density (people per square mile)
Population - Males (%)
Population - Females (%)
Population - Males (%) - White
Population - Males (%) - Black or African American
Population - Males (%) - Asian
Population - Males (%) - Hispanic or Latino
Population - Males (%) - American Indian and Alaska Native
Population - Males (%) - Multirace
Population - Males (%) - Other Race
Population - Females (%) - White
Population - Females (%) - Black or African American
Population - Females (%) - Asian
Population - Females (%) - Hispanic or Latino
Population - Females (%) - American Indian and Alaska Native
Population - Females (%) - Multirace
Population - Females (%) - Other Race
Coronavirus confirmed cases (Jun 16, 2024)
Deaths caused by coronavirus (Jun 16, 2024)
Coronavirus confirmed cases (per 100k population) (Jun 16, 2024)
Deaths caused by coronavirus (per 100k population) (Jun 16, 2024)
Daily increase in number of cases (Jun 16, 2024)
Weekly increase in number of cases (Jun 16, 2024)
Cases doubled (in days) (Jun 16, 2024)
Hospitalized patients (Apr 18, 2022)
Negative test results (Apr 18, 2022)
Total test results (Apr 18, 2022)
COVID Vaccine doses distributed (per 100k population) (Sep 19, 2023)
COVID Vaccine doses administered (per 100k population) (Sep 19, 2023)
COVID Vaccine doses distributed (Sep 19, 2023)
COVID Vaccine doses administered (Sep 19, 2023)
Likely homosexual households (%)
Likely homosexual households (% change since 2000)
Likely homosexual households - Lesbian couples (%)
Likely homosexual households - Lesbian couples (% change since 2000)
Likely homosexual households - Gay men (%)
Likely homosexual households - Gay men (% change since 2000)
Cost of living index
Median gross rent ($)
Median contract rent ($)
Median monthly housing costs ($)
Median house or condo value ($)
Median house or condo value ($ change since 2000)
Mean house or condo value by units in structure - 1, detached ($)
Mean house or condo value by units in structure - 1, attached ($)
Mean house or condo value by units in structure - 2 ($)
Mean house or condo value by units in structure by units in structure - 3 or 4 ($)
Mean house or condo value by units in structure - 5 or more ($)
Mean house or condo value by units in structure - Boat, RV, van, etc. ($)
Mean house or condo value by units in structure - Mobile home ($)
Median house or condo value ($) - White
Median house or condo value ($) - Black or African American
Median house or condo value ($) - Asian
Median house or condo value ($) - Hispanic or Latino
Median house or condo value ($) - American Indian and Alaska Native
Median house or condo value ($) - Multirace
Median house or condo value ($) - Other Race
Median resident age
Resident age diversity
Median resident age - Males
Median resident age - Females
Median resident age - White
Median resident age - Black or African American
Median resident age - Asian
Median resident age - Hispanic or Latino
Median resident age - American Indian and Alaska Native
Median resident age - Multirace
Median resident age - Other Race
Median resident age - Males - White
Median resident age - Males - Black or African American
Median resident age - Males - Asian
Median resident age - Males - Hispanic or Latino
Median resident age - Males - American Indian and Alaska Native
Median resident age - Males - Multirace
Median resident age - Males - Other Race
Median resident age - Females - White
Median resident age - Females - Black or African American
Median resident age - Females - Asian
Median resident age - Females - Hispanic or Latino
Median resident age - Females - American Indian and Alaska Native
Median resident age - Females - Multirace
Median resident age - Females - Other Race
Commute - mean travel time to work (minutes)
Travel time to work - Less than 5 minutes (%)
Travel time to work - Less than 5 minutes (% change since 2000)
Travel time to work - 5 to 9 minutes (%)
Travel time to work - 5 to 9 minutes (% change since 2000)
Travel time to work - 10 to 19 minutes (%)
Travel time to work - 10 to 19 minutes (% change since 2000)
Travel time to work - 20 to 29 minutes (%)
Travel time to work - 20 to 29 minutes (% change since 2000)
Travel time to work - 30 to 39 minutes (%)
Travel time to work - 30 to 39 minutes (% change since 2000)
Travel time to work - 40 to 59 minutes (%)
Travel time to work - 40 to 59 minutes (% change since 2000)
Travel time to work - 60 to 89 minutes (%)
Travel time to work - 60 to 89 minutes (% change since 2000)
Travel time to work - 90 or more minutes (%)
Travel time to work - 90 or more minutes (% change since 2000)
Marital status - Never married (%)
Marital status - Now married (%)
Marital status - Separated (%)
Marital status - Widowed (%)
Marital status - Divorced (%)
Median family income ($)
Median family income (% change since 2000)
Median non-family income ($)
Median non-family income (% change since 2000)
Median per capita income ($)
Median per capita income (% change since 2000)
Median family income ($) - White
Median family income ($) - Black or African American
Median family income ($) - Asian
Median family income ($) - Hispanic or Latino
Median family income ($) - American Indian and Alaska Native
Median family income ($) - Multirace
Median family income ($) - Other Race
Median year house/condo built
Median year apartment built
Year house built - Built 2005 or later (%)
Year house built - Built 2000 to 2004 (%)
Year house built - Built 1990 to 1999 (%)
Year house built - Built 1980 to 1989 (%)
Year house built - Built 1970 to 1979 (%)
Year house built - Built 1960 to 1969 (%)
Year house built - Built 1950 to 1959 (%)
Year house built - Built 1940 to 1949 (%)
Year house built - Built 1939 or earlier (%)
Average household size
Household density (households per square mile)
Average household size - White
Average household size - Black or African American
Average household size - Asian
Average household size - Hispanic or Latino
Average household size - American Indian and Alaska Native
Average household size - Multirace
Average household size - Other Race
Occupied housing units (%)
Vacant housing units (%)
Owner occupied housing units (%)
Renter occupied housing units (%)
Vacancy status - For rent (%)
Vacancy status - For sale only (%)
Vacancy status - Rented or sold, not occupied (%)
Vacancy status - For seasonal, recreational, or occasional use (%)
Vacancy status - For migrant workers (%)
Vacancy status - Other vacant (%)
Residents with income below the poverty level (%)
Residents with income below 50% of the poverty level (%)
Children below poverty level (%)
Poor families by family type - Married-couple family (%)
Poor families by family type - Male, no wife present (%)
Poor families by family type - Female, no husband present (%)
Poverty status for native-born residents (%)
Poverty status for foreign-born residents (%)
Poverty among high school graduates not in families (%)
Poverty among people who did not graduate high school not in families (%)
Residents with income below the poverty level (%) - White
Residents with income below the poverty level (%) - Black or African American
Residents with income below the poverty level (%) - Asian
Residents with income below the poverty level (%) - Hispanic or Latino
Residents with income below the poverty level (%) - American Indian and Alaska Native
Residents with income below the poverty level (%) - Multirace
Residents with income below the poverty level (%) - Other Race
Air pollution - Air Quality Index (AQI)
Air pollution - CO
Air pollution - NO2
Air pollution - SO2
Air pollution - Ozone
Air pollution - PM10
Air pollution - PM25
Air pollution - Pb
Crime - Murders per 100,000 population
Crime - Rapes per 100,000 population
Crime - Robberies per 100,000 population
Crime - Assaults per 100,000 population
Crime - Burglaries per 100,000 population
Crime - Thefts per 100,000 population
Crime - Auto thefts per 100,000 population
Crime - Arson per 100,000 population
Crime - City-data.com crime index
Crime - Violent crime index
Crime - Property crime index
Crime - Murders per 100,000 population (5 year average)
Crime - Rapes per 100,000 population (5 year average)
Crime - Robberies per 100,000 population (5 year average)
Crime - Assaults per 100,000 population (5 year average)
Crime - Burglaries per 100,000 population (5 year average)
Crime - Thefts per 100,000 population (5 year average)
Crime - Auto thefts per 100,000 population (5 year average)
Crime - Arson per 100,000 population (5 year average)
Crime - City-data.com crime index (5 year average)
Crime - Violent crime index (5 year average)
Crime - Property crime index (5 year average)
1996 Presidential Elections Results (%) - Democratic Party (Clinton)
1996 Presidential Elections Results (%) - Republican Party (Dole)
1996 Presidential Elections Results (%) - Other
2000 Presidential Elections Results (%) - Democratic Party (Gore)
2000 Presidential Elections Results (%) - Republican Party (Bush)
2000 Presidential Elections Results (%) - Other
2004 Presidential Elections Results (%) - Democratic Party (Kerry)
2004 Presidential Elections Results (%) - Republican Party (Bush)
2004 Presidential Elections Results (%) - Other
2008 Presidential Elections Results (%) - Democratic Party (Obama)
2008 Presidential Elections Results (%) - Republican Party (McCain)
2008 Presidential Elections Results (%) - Other
2012 Presidential Elections Results (%) - Democratic Party (Obama)
2012 Presidential Elections Results (%) - Republican Party (Romney)
2012 Presidential Elections Results (%) - Other
2016 Presidential Elections Results (%) - Democratic Party (Clinton)
2016 Presidential Elections Results (%) - Republican Party (Trump)
2016 Presidential Elections Results (%) - Other
2020 Presidential Elections Results (%) - Democratic Party (Biden)
2020 Presidential Elections Results (%) - Republican Party (Trump)
2020 Presidential Elections Results (%) - Other
Ancestries Reported - Arab (%)
Ancestries Reported - Czech (%)
Ancestries Reported - Danish (%)
Ancestries Reported - Dutch (%)
Ancestries Reported - English (%)
Ancestries Reported - French (%)
Ancestries Reported - French Canadian (%)
Ancestries Reported - German (%)
Ancestries Reported - Greek (%)
Ancestries Reported - Hungarian (%)
Ancestries Reported - Irish (%)
Ancestries Reported - Italian (%)
Ancestries Reported - Lithuanian (%)
Ancestries Reported - Norwegian (%)
Ancestries Reported - Polish (%)
Ancestries Reported - Portuguese (%)
Ancestries Reported - Russian (%)
Ancestries Reported - Scotch-Irish (%)
Ancestries Reported - Scottish (%)
Ancestries Reported - Slovak (%)
Ancestries Reported - Subsaharan African (%)
Ancestries Reported - Swedish (%)
Ancestries Reported - Swiss (%)
Ancestries Reported - Ukrainian (%)
Ancestries Reported - United States (%)
Ancestries Reported - Welsh (%)
Ancestries Reported - West Indian (%)
Ancestries Reported - Other (%)
Educational Attainment - No schooling completed (%)
Educational Attainment - Less than high school (%)
Educational Attainment - High school or equivalent (%)
Educational Attainment - Less than 1 year of college (%)
Educational Attainment - 1 or more years of college (%)
Educational Attainment - Associate degree (%)
Educational Attainment - Bachelor's degree (%)
Educational Attainment - Master's degree (%)
Educational Attainment - Professional school degree (%)
Educational Attainment - Doctorate degree (%)
School Enrollment - Nursery, preschool (%)
School Enrollment - Kindergarten (%)
School Enrollment - Grade 1 to 4 (%)
School Enrollment - Grade 5 to 8 (%)
School Enrollment - Grade 9 to 12 (%)
School Enrollment - College undergrad (%)
School Enrollment - Graduate or professional (%)
School Enrollment - Not enrolled in school (%)
School enrollment - Public schools (%)
School enrollment - Private schools (%)
School enrollment - Not enrolled (%)
Median number of rooms in houses and condos
Median number of rooms in apartments
Housing units lacking complete plumbing facilities (%)
Housing units lacking complete kitchen facilities (%)
Density of houses
Urban houses (%)
Rural houses (%)
Households with people 60 years and over (%)
Households with people 65 years and over (%)
Households with people 75 years and over (%)
Households with one or more nonrelatives (%)
Households with no nonrelatives (%)
Population in households (%)
Family households (%)
Nonfamily households (%)
Population in families (%)
Family households with own children (%)
Median number of bedrooms in owner occupied houses
Mean number of bedrooms in owner occupied houses
Median number of bedrooms in renter occupied houses
Mean number of bedrooms in renter occupied houses
Median number of vehichles in owner occupied houses
Mean number of vehichles in owner occupied houses
Median number of vehichles in renter occupied houses
Mean number of vehichles in renter occupied houses
Mortgage status - with mortgage (%)
Mortgage status - with second mortgage (%)
Mortgage status - with home equity loan (%)
Mortgage status - with both second mortgage and home equity loan (%)
Mortgage status - without a mortgage (%)
Average family size
Average family size - White
Average family size - Black or African American
Average family size - Asian
Average family size - Hispanic or Latino
Average family size - American Indian and Alaska Native
Average family size - Multirace
Average family size - Other Race
Geographical mobility - Same house 1 year ago (%)
Geographical mobility - Moved within same county (%)
Geographical mobility - Moved from different county within same state (%)
Geographical mobility - Moved from different state (%)
Geographical mobility - Moved from abroad (%)
Place of birth - Born in state of residence (%)
Place of birth - Born in other state (%)
Place of birth - Native, outside of US (%)
Place of birth - Foreign born (%)
Housing units in structures - 1, detached (%)
Housing units in structures - 1, attached (%)
Housing units in structures - 2 (%)
Housing units in structures - 3 or 4 (%)
Housing units in structures - 5 to 9 (%)
Housing units in structures - 10 to 19 (%)
Housing units in structures - 20 to 49 (%)
Housing units in structures - 50 or more (%)
Housing units in structures - Mobile home (%)
Housing units in structures - Boat, RV, van, etc. (%)
House/condo owner moved in on average (years ago)
Renter moved in on average (years ago)
Year householder moved into unit - Moved in 1999 to March 2000 (%)
Year householder moved into unit - Moved in 1995 to 1998 (%)
Year householder moved into unit - Moved in 1990 to 1994 (%)
Year householder moved into unit - Moved in 1980 to 1989 (%)
Year householder moved into unit - Moved in 1970 to 1979 (%)
Year householder moved into unit - Moved in 1969 or earlier (%)
Means of transportation to work - Drove car alone (%)
Means of transportation to work - Carpooled (%)
Means of transportation to work - Public transportation (%)
Means of transportation to work - Bus or trolley bus (%)
Means of transportation to work - Streetcar or trolley car (%)
Means of transportation to work - Subway or elevated (%)
Means of transportation to work - Railroad (%)
Means of transportation to work - Ferryboat (%)
Means of transportation to work - Taxicab (%)
Means of transportation to work - Motorcycle (%)
Means of transportation to work - Bicycle (%)
Means of transportation to work - Walked (%)
Means of transportation to work - Other means (%)
Working at home (%)
Industry diversity
Most Common Industries - Agriculture, forestry, fishing and hunting, and mining (%)
Most Common Industries - Agriculture, forestry, fishing and hunting (%)
Most Common Industries - Mining, quarrying, and oil and gas extraction (%)
Most Common Industries - Construction (%)
Most Common Industries - Manufacturing (%)
Most Common Industries - Wholesale trade (%)
Most Common Industries - Retail trade (%)
Most Common Industries - Transportation and warehousing, and utilities (%)
Most Common Industries - Transportation and warehousing (%)
Most Common Industries - Utilities (%)
Most Common Industries - Information (%)
Most Common Industries - Finance and insurance, and real estate and rental and leasing (%)
Most Common Industries - Finance and insurance (%)
Most Common Industries - Real estate and rental and leasing (%)
Most Common Industries - Professional, scientific, and management, and administrative and waste management services (%)
Most Common Industries - Professional, scientific, and technical services (%)
Most Common Industries - Management of companies and enterprises (%)
Most Common Industries - Administrative and support and waste management services (%)
Most Common Industries - Educational services, and health care and social assistance (%)
Most Common Industries - Educational services (%)
Most Common Industries - Health care and social assistance (%)
Most Common Industries - Arts, entertainment, and recreation, and accommodation and food services (%)
Most Common Industries - Arts, entertainment, and recreation (%)
Most Common Industries - Accommodation and food services (%)
Most Common Industries - Other services, except public administration (%)
Most Common Industries - Public administration (%)
Occupation diversity
Most Common Occupations - Management, business, science, and arts occupations (%)
Most Common Occupations - Management, business, and financial occupations (%)
Most Common Occupations - Management occupations (%)
Most Common Occupations - Business and financial operations occupations (%)
Most Common Occupations - Computer, engineering, and science occupations (%)
Most Common Occupations - Computer and mathematical occupations (%)
Most Common Occupations - Architecture and engineering occupations (%)
Most Common Occupations - Life, physical, and social science occupations (%)
Most Common Occupations - Education, legal, community service, arts, and media occupations (%)
Most Common Occupations - Community and social service occupations (%)
Most Common Occupations - Legal occupations (%)
Most Common Occupations - Education, training, and library occupations (%)
Most Common Occupations - Arts, design, entertainment, sports, and media occupations (%)
Most Common Occupations - Healthcare practitioners and technical occupations (%)
Most Common Occupations - Health diagnosing and treating practitioners and other technical occupations (%)
Most Common Occupations - Health technologists and technicians (%)
Most Common Occupations - Service occupations (%)
Most Common Occupations - Healthcare support occupations (%)
Most Common Occupations - Protective service occupations (%)
Most Common Occupations - Fire fighting and prevention, and other protective service workers including supervisors (%)
Most Common Occupations - Law enforcement workers including supervisors (%)
Most Common Occupations - Food preparation and serving related occupations (%)
Most Common Occupations - Building and grounds cleaning and maintenance occupations (%)
Most Common Occupations - Personal care and service occupations (%)
Most Common Occupations - Sales and office occupations (%)
Most Common Occupations - Sales and related occupations (%)
Most Common Occupations - Office and administrative support occupations (%)
Most Common Occupations - Natural resources, construction, and maintenance occupations (%)
Most Common Occupations - Farming, fishing, and forestry occupations (%)
Most Common Occupations - Construction and extraction occupations (%)
Most Common Occupations - Installation, maintenance, and repair occupations (%)
Most Common Occupations - Production, transportation, and material moving occupations (%)
Most Common Occupations - Production occupations (%)
Most Common Occupations - Transportation occupations (%)
Most Common Occupations - Material moving occupations (%)
People in Group quarters - Institutionalized population (%)
People in Group quarters - Correctional institutions (%)
People in Group quarters - Federal prisons and detention centers (%)
People in Group quarters - Halfway houses (%)
People in Group quarters - Local jails and other confinement facilities (including police lockups) (%)
People in Group quarters - Military disciplinary barracks (%)
People in Group quarters - State prisons (%)
People in Group quarters - Other types of correctional institutions (%)
People in Group quarters - Nursing homes (%)
People in Group quarters - Hospitals/wards, hospices, and schools for the handicapped (%)
People in Group quarters - Hospitals/wards and hospices for chronically ill (%)
People in Group quarters - Hospices or homes for chronically ill (%)
People in Group quarters - Military hospitals or wards for chronically ill (%)
People in Group quarters - Other hospitals or wards for chronically ill (%)
People in Group quarters - Hospitals or wards for drug/alcohol abuse (%)
People in Group quarters - Mental (Psychiatric) hospitals or wards (%)
People in Group quarters - Schools, hospitals, or wards for the mentally retarded (%)
People in Group quarters - Schools, hospitals, or wards for the physically handicapped (%)
People in Group quarters - Institutions for the deaf (%)
People in Group quarters - Institutions for the blind (%)
People in Group quarters - Orthopedic wards and institutions for the physically handicapped (%)
People in Group quarters - Wards in general hospitals for patients who have no usual home elsewhere (%)
People in Group quarters - Wards in military hospitals for patients who have no usual home elsewhere (%)
People in Group quarters - Juvenile institutions (%)
People in Group quarters - Long-term care (%)
People in Group quarters - Homes for abused, dependent, and neglected children (%)
People in Group quarters - Residential treatment centers for emotionally disturbed children (%)
People in Group quarters - Training schools for juvenile delinquents (%)
People in Group quarters - Short-term care, detention or diagnostic centers for delinquent children (%)
People in Group quarters - Type of juvenile institution unknown (%)
People in Group quarters - Noninstitutionalized population (%)
People in Group quarters - College dormitories (includes college quarters off campus) (%)
People in Group quarters - Military quarters (%)
People in Group quarters - On base (%)
People in Group quarters - Barracks, unaccompanied personnel housing (UPH), (Enlisted/Officer), ;and similar group living quarters for military personnel (%)
People in Group quarters - Transient quarters for temporary residents (%)
People in Group quarters - Military ships (%)
People in Group quarters - Group homes (%)
People in Group quarters - Homes or halfway houses for drug/alcohol abuse (%)
People in Group quarters - Homes for the mentally ill (%)
People in Group quarters - Homes for the mentally retarded (%)
People in Group quarters - Homes for the physically handicapped (%)
People in Group quarters - Other group homes (%)
People in Group quarters - Religious group quarters (%)
People in Group quarters - Dormitories (%)
People in Group quarters - Agriculture workers' dormitories on farms (%)
People in Group quarters - Job Corps and vocational training facilities (%)
People in Group quarters - Other workers' dormitories (%)
People in Group quarters - Crews of maritime vessels (%)
People in Group quarters - Other nonhousehold living situations (%)
People in Group quarters - Other noninstitutional group quarters (%)
Residents speaking English at home (%)
Residents speaking English at home - Born in the United States (%)
Residents speaking English at home - Native, born elsewhere (%)
Residents speaking English at home - Foreign born (%)
Residents speaking Spanish at home (%)
Residents speaking Spanish at home - Born in the United States (%)
Residents speaking Spanish at home - Native, born elsewhere (%)
Residents speaking Spanish at home - Foreign born (%)
Residents speaking other language at home (%)
Residents speaking other language at home - Born in the United States (%)
Residents speaking other language at home - Native, born elsewhere (%)
Residents speaking other language at home - Foreign born (%)
Class of Workers - Employee of private company (%)
Class of Workers - Self-employed in own incorporated business (%)
Class of Workers - Private not-for-profit wage and salary workers (%)
Class of Workers - Local government workers (%)
Class of Workers - State government workers (%)
Class of Workers - Federal government workers (%)
Class of Workers - Self-employed workers in own not incorporated business and Unpaid family workers (%)
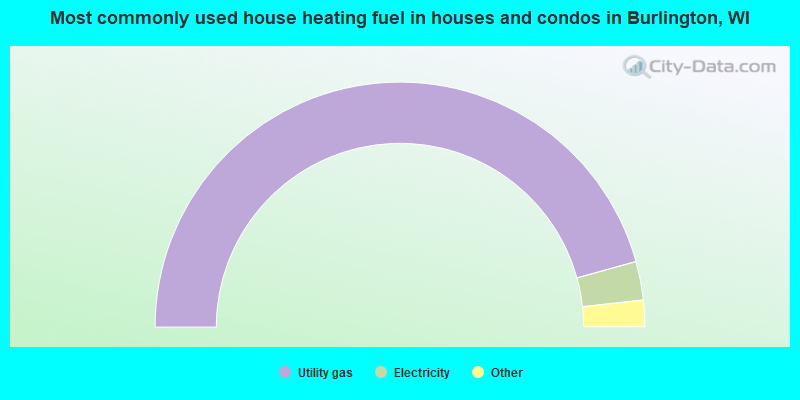
House heating fuel used in houses and condos - Utility gas (%)
House heating fuel used in houses and condos - Bottled, tank, or LP gas (%)
House heating fuel used in houses and condos - Electricity (%)
House heating fuel used in houses and condos - Fuel oil, kerosene, etc. (%)
House heating fuel used in houses and condos - Coal or coke (%)
House heating fuel used in houses and condos - Wood (%)
House heating fuel used in houses and condos - Solar energy (%)
House heating fuel used in houses and condos - Other fuel (%)
House heating fuel used in houses and condos - No fuel used (%)
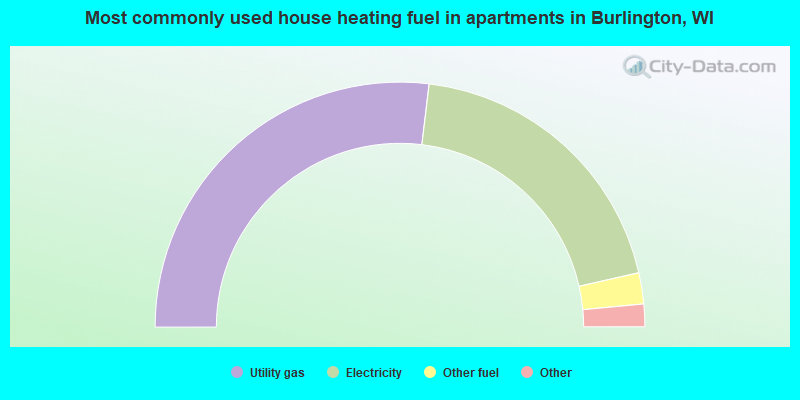
House heating fuel used in apartments - Utility gas (%)
House heating fuel used in apartments - Bottled, tank, or LP gas (%)
House heating fuel used in apartments - Electricity (%)
House heating fuel used in apartments - Fuel oil, kerosene, etc. (%)
House heating fuel used in apartments - Coal or coke (%)
House heating fuel used in apartments - Wood (%)
House heating fuel used in apartments - Solar energy (%)
House heating fuel used in apartments - Other fuel (%)
House heating fuel used in apartments - No fuel used (%)
Armed forces status - In Armed Forces (%)
Armed forces status - Civilian (%)
Armed forces status - Civilian - Veteran (%)
Armed forces status - Civilian - Nonveteran (%)
Fatal accidents locations in years 2005-2021
Fatal accidents locations in 2005
Fatal accidents locations in 2006
Fatal accidents locations in 2007
Fatal accidents locations in 2008
Fatal accidents locations in 2009
Fatal accidents locations in 2010
Fatal accidents locations in 2011
Fatal accidents locations in 2012
Fatal accidents locations in 2013
Fatal accidents locations in 2014
Fatal accidents locations in 2015
Fatal accidents locations in 2016
Fatal accidents locations in 2017
Fatal accidents locations in 2018
Fatal accidents locations in 2019
Fatal accidents locations in 2020
Fatal accidents locations in 2021
Alcohol use - People drinking some alcohol every month (%)
Alcohol use - People not drinking at all (%)
Alcohol use - Average days/month drinking alcohol
Alcohol use - Average drinks/week
Alcohol use - Average days/year people drink much
Audiometry - Average condition of hearing (%)
Audiometry - People that can hear a whisper from across a quiet room (%)
Audiometry - People that can hear normal voice from across a quiet room (%)
Audiometry - Ears ringing, roaring, buzzing (%)
Audiometry - Had a job exposure to loud noise (%)
Audiometry - Had off-work exposure to loud noise (%)
Blood Pressure & Cholesterol - Has high blood pressure (%)
Blood Pressure & Cholesterol - Checking blood pressure at home (%)
Blood Pressure & Cholesterol - Frequently checking blood cholesterol (%)
Blood Pressure & Cholesterol - Has high cholesterol level (%)
Consumer Behavior - Money monthly spent on food at supermarket/grocery store
Consumer Behavior - Money monthly spent on food at other stores
Consumer Behavior - Money monthly spent on eating out
Consumer Behavior - Money monthly spent on carryout/delivered foods
Consumer Behavior - Income spent on food at supermarket/grocery store (%)
Consumer Behavior - Income spent on food at other stores (%)
Consumer Behavior - Income spent on eating out (%)
Consumer Behavior - Income spent on carryout/delivered foods (%)
Current Health Status - General health condition (%)
Current Health Status - Blood donors (%)
Current Health Status - Has blood ever tested for HIV virus (%)
Current Health Status - Left-handed people (%)
Dermatology - People using sunscreen (%)
Diabetes - Diabetics (%)
Diabetes - Had a blood test for high blood sugar (%)
Diabetes - People taking insulin (%)
Diet Behavior & Nutrition - Diet health (%)
Diet Behavior & Nutrition - Milk product consumption (# of products/month)
Diet Behavior & Nutrition - Meals not home prepared (#/week)
Diet Behavior & Nutrition - Meals from fast food or pizza place (#/week)
Diet Behavior & Nutrition - Ready-to-eat foods (#/month)
Diet Behavior & Nutrition - Frozen meals/pizza (#/month)
Drug Use - People that ever used marijuana or hashish (%)
Drug Use - Ever used hard drugs (%)
Drug Use - Ever used any form of cocaine (%)
Drug Use - Ever used heroin (%)
Drug Use - Ever used methamphetamine (%)
Health Insurance - People covered by health insurance (%)
Kidney Conditions-Urology - Avg. # of times urinating at night
Medical Conditions - People with asthma (%)
Medical Conditions - People with anemia (%)
Medical Conditions - People with psoriasis (%)
Medical Conditions - People with overweight (%)
Medical Conditions - Elderly people having difficulties in thinking or remembering (%)
Medical Conditions - People who ever received blood transfusion (%)
Medical Conditions - People having trouble seeing even with glass/contacts (%)
Medical Conditions - People with arthritis (%)
Medical Conditions - People with gout (%)
Medical Conditions - People with congestive heart failure (%)
Medical Conditions - People with coronary heart disease (%)
Medical Conditions - People with angina pectoris (%)
Medical Conditions - People who ever had heart attack (%)
Medical Conditions - People who ever had stroke (%)
Medical Conditions - People with emphysema (%)
Medical Conditions - People with thyroid problem (%)
Medical Conditions - People with chronic bronchitis (%)
Medical Conditions - People with any liver condition (%)
Medical Conditions - People who ever had cancer or malignancy (%)
Mental Health - People who have little interest in doing things (%)
Mental Health - People feeling down, depressed, or hopeless (%)
Mental Health - People who have trouble sleeping or sleeping too much (%)
Mental Health - People feeling tired or having little energy (%)
Mental Health - People with poor appetite or overeating (%)
Mental Health - People feeling bad about themself (%)
Mental Health - People who have trouble concentrating on things (%)
Mental Health - People moving or speaking slowly or too fast (%)
Mental Health - People having thoughts they would be better off dead (%)
Oral Health - Average years since last visit a dentist
Oral Health - People embarrassed because of mouth (%)
Oral Health - People with gum disease (%)
Oral Health - General health of teeth and gums (%)
Oral Health - Average days a week using dental floss/device
Oral Health - Average days a week using mouthwash for dental problem
Oral Health - Average number of teeth
Pesticide Use - Households using pesticides to control insects (%)
Pesticide Use - Households using pesticides to kill weeds (%)
Physical Activity - People doing vigorous-intensity work activities (%)
Physical Activity - People doing moderate-intensity work activities (%)
Physical Activity - People walking or bicycling (%)
Physical Activity - People doing vigorous-intensity recreational activities (%)
Physical Activity - People doing moderate-intensity recreational activities (%)
Physical Activity - Average hours a day doing sedentary activities
Physical Activity - Average hours a day watching TV or videos
Physical Activity - Average hours a day using computer
Physical Functioning - People having limitations keeping them from working (%)
Physical Functioning - People limited in amount of work they can do (%)
Physical Functioning - People that need special equipment to walk (%)
Physical Functioning - People experiencing confusion/memory problems (%)
Physical Functioning - People requiring special healthcare equipment (%)
Prescription Medications - Average number of prescription medicines taking
Preventive Aspirin Use - Adults 40+ taking low-dose aspirin (%)
Reproductive Health - Vaginal deliveries (%)
Reproductive Health - Cesarean deliveries (%)
Reproductive Health - Deliveries resulted in a live birth (%)
Reproductive Health - Pregnancies resulted in a delivery (%)
Reproductive Health - Women breastfeeding newborns (%)
Reproductive Health - Women that had a hysterectomy (%)
Reproductive Health - Women that had both ovaries removed (%)
Reproductive Health - Women that have ever taken birth control pills (%)
Reproductive Health - Women taking birth control pills (%)
Reproductive Health - Women that have ever used Depo-Provera or injectables (%)
Reproductive Health - Women that have ever used female hormones (%)
Sexual Behavior - People 18+ that ever had sex (vaginal, anal, or oral) (%)
Sexual Behavior - Males 18+ that ever had vaginal sex with a woman (%)
Sexual Behavior - Males 18+ that ever performed oral sex on a woman (%)
Sexual Behavior - Males 18+ that ever had anal sex with a woman (%)
Sexual Behavior - Males 18+ that ever had any sex with a man (%)
Sexual Behavior - Females 18+ that ever had vaginal sex with a man (%)
Sexual Behavior - Females 18+ that ever performed oral sex on a man (%)
Sexual Behavior - Females 18+ that ever had anal sex with a man (%)
Sexual Behavior - Females 18+ that ever had any kind of sex with a woman (%)
Sexual Behavior - Average age people first had sex
Sexual Behavior - Average number of female sex partners in lifetime (males 18+)
Sexual Behavior - Average number of female vaginal sex partners in lifetime (males 18+)
Sexual Behavior - Average age people first performed oral sex on a woman (18+)
Sexual Behavior - Average number of woman performed oral sex on in lifetime (18+)
Sexual Behavior - Average number of male sex partners in lifetime (males 18+)
Sexual Behavior - Average number of male anal sex partners in lifetime (males 18+)
Sexual Behavior - Average age people first performed oral sex on a man (18+)
Sexual Behavior - Average number of male oral sex partners in lifetime (18+)
Sexual Behavior - People using protection when performing oral sex (%)
Sexual Behavior - Average number of times people have vaginal or anal sex a year
Sexual Behavior - People having sex without condom (%)
Sexual Behavior - Average number of male sex partners in lifetime (females 18+)
Sexual Behavior - Average number of male vaginal sex partners in lifetime (females 18+)
Sexual Behavior - Average number of female sex partners in lifetime (females 18+)
Sexual Behavior - Circumcised males 18+ (%)
Sleep Disorders - Average hours sleeping at night
Sleep Disorders - People that has trouble sleeping (%)
Smoking-Cigarette Use - People smoking cigarettes (%)
Taste & Smell - People 40+ having problems with smell (%)
Taste & Smell - People 40+ having problems with taste (%)
Taste & Smell - People 40+ that ever had wisdom teeth removed (%)
Taste & Smell - People 40+ that ever had tonsils teeth removed (%)
Taste & Smell - People 40+ that ever had a loss of consciousness because of a head injury (%)
Taste & Smell - People 40+ that ever had a broken nose or other serious injury to face or skull (%)
Taste & Smell - People 40+ that ever had two or more sinus infections (%)
Weight - Average height (inches)
Weight - Average weight (pounds)
Weight - Average BMI
Weight - People that are obese (%)
Weight - People that ever were obese (%)
Weight - People trying to lose weight (%)
Officers per 1,000 residents here:
2.01Wisconsin average:
2.07
Latest news from Burlington, WI collected exclusively by city-data.com from local newspapers, TV, and radio stations
Ancestries: German (35.2%), English (6.3%), Norwegian (5.2%), Irish (5.1%), Polish (5.0%), Italian (4.6%).
Current Local Time:
Land area: 5.96 square miles.
Population density: 1,847 people per square mile (low).
400 residents are foreign born (2.7% Latin America , 0.7% Europe ).
This city:
3.7%Wisconsin:
5.0%
Median real estate property taxes paid for housing units with mortgages in 2022: $4,705 (1.7%)Median real estate property taxes paid for housing units with no mortgage in 2022: $3,796 (1.5%)
Nearest city with pop. 50,000+: Kenosha, WI
Nearest city with pop. 200,000+: Milwaukee, WI
Nearest city with pop. 1,000,000+: Chicago, IL
Nearest cities:
Latitude: 42.68 N, Longitude: 88.28 W
Daytime population change due to commuting: +2,222 (+20.3%)Workers who live and work in this city: 2,169 (40.3%)
Burlington tourist attractions:
Single-family new house construction building permits:
2022: 3 buildings , average cost: $334,6002021: 9 buildings , average cost: $288,2002020: 20 buildings , average cost: $243,6002019: 12 buildings , average cost: $267,8002018: 19 buildings , average cost: $240,3002017: 14 buildings , average cost: $243,5002016: 20 buildings , average cost: $203,2002015: 15 buildings , average cost: $235,8002014: 24 buildings , average cost: $215,5002013: 17 buildings , average cost: $324,7002012: 7 buildings , average cost: $199,9002011: 3 buildings , average cost: $198,6002010: 6 buildings , average cost: $123,8002009: 9 buildings , average cost: $186,9002008: 14 buildings , average cost: $197,7002007: 15 buildings , average cost: $208,1002006: 14 buildings , average cost: $211,9002005: 22 buildings , average cost: $222,5002004: 25 buildings , average cost: $214,4002003: 25 buildings , average cost: $168,0002002: 21 buildings , average cost: $166,7002001: 21 buildings , average cost: $112,8002000: 20 buildings , average cost: $112,8001999: 20 buildings , average cost: $112,8001998: 19 buildings , average cost: $112,8001997: 18 buildings , average cost: $112,600Unemployment in December 2023:
Population change in the 1990s: +930 (+10.3%).
Most common occupations in Burlington, WI (%)
Both Males Females
Other production occupations, including supervisors (7.5%)
Preschool, kindergarten, elementary, and middle school teachers (4.4%)
Electrical equipment mechanics and other installation, maintenance, and repair workers, including supervisors (4.0%)
Retail sales workers, except cashiers (3.7%)
Other sales and related occupations, including supervisors (3.2%)
Material recording, scheduling, dispatching, and distributing workers (3.1%)
Metal workers and plastic workers (2.8%)
Electrical equipment mechanics and other installation, maintenance, and repair workers, including supervisors (7.6%)
Other production occupations, including supervisors (6.9%)
Vehicle and mobile equipment mechanics, installers, and repairers (4.9%)
Sales representatives, services, wholesale and manufacturing (3.8%)
Driver/sales workers and truck drivers (3.6%)
Laborers and material movers, hand (3.6%)
Retail sales workers, except cashiers (3.5%)
Other production occupations, including supervisors (8.0%)
Preschool, kindergarten, elementary, and middle school teachers (6.8%)
Secretaries and administrative assistants (4.7%)
Registered nurses (4.5%)
Other office and administrative support workers, including supervisors (4.3%)
Retail sales workers, except cashiers (3.9%)
Information and record clerks, except customer service representatives (3.5%)
Tornado activity:
Burlington-area historical tornado activity is slightly above Wisconsin state average. It is 36% greater than the overall U.S. average.
On 4/27/1984, a category F4 (max. wind speeds 207-260 mph) tornado 21.4 miles away from the Burlington city center killed one person and injured 14 people and caused between $500,000 and $5,000,000 in damages.
On 4/21/1967, a category F4 tornado 24.0 miles away from the city center killed 24 people and injured 450 people and caused between $50,000 and $500,000 in damages.
Earthquake activity:
Burlington-area historical earthquake activity is significantly above Wisconsin state average. It is 26% greater than the overall U.S. average. On 4/18/2008 at 09:36:59, a magnitude 5.4 (5.1 MB, 4.8 MS, 5.4 MW, 5.2 MW, Class: Moderate, Intensity: VI - VII) earthquake occurred 293.0 miles away from Burlington center On 6/28/2004 at 06:10:52, a magnitude 4.2 (4.2 MW, Depth: 6.2 mi, Class: Light, Intensity: IV - V) earthquake occurred 90.1 miles away from the city center On 6/10/1987 at 23:48:54, a magnitude 5.1 (4.9 MB, 4.4 MS, 4.6 MS, 5.1 LG) earthquake occurred 267.6 miles away from the city center On 4/18/2008 at 09:36:59, a magnitude 5.2 (5.2 MW, Depth: 8.9 mi) earthquake occurred 293.1 miles away from Burlington center On 2/10/2010 at 09:59:35, a magnitude 3.8 (3.8 MW, Depth: 6.2 mi, Class: Light, Intensity: II - III) earthquake occurred 50.3 miles away from Burlington center On 5/2/2015 at 16:23:07, a magnitude 4.2 (4.2 MW, Depth: 2.8 mi) earthquake occurred 148.6 miles away from the city center Magnitude types: regional Lg-wave magnitude (LG), body-wave magnitude (MB), surface-wave magnitude (MS), moment magnitude (MW) Natural disasters: The number of natural disasters in Racine County (15) is near the US average (15).Major Disasters (Presidential) Declared: 11Emergencies Declared: 4Floods: 9, Storms: 8, Tornadoes: 3, Winter Storms: 3, Snowstorms: 2, Blizzard: 1, Hurricane: 1, Snow: 1, Other: 1 (Note: some incidents may be assigned to more than one category). Main business address for: FIRST BANKING CENTER INC STATE COMMERCIAL BANKS ).
Hospitals and medical centers in Burlington: AURORA MEMORIAL HSPTL BURLINGTON (Voluntary non-profit - Private, 252 MCHENRY ST) KINDRED NURSING AND REHAB-BURLINGTON (677 E STATE ST)
MOUNT CARMEL CARE CENTER (677 E STATE ST)
Amtrak station near Burlington: 20 miles: STURTEVANT (2904 WISCONSIN ST.) Services: enclosed waiting area, public restrooms, public payphones, free short-term parking, free long-term parking, call for taxi service, public transit connection.
Colleges/universities with over 2000 students nearest to Burlington:
University of Wisconsin-Parkside (about 22 miles; Kenosha, WI ; Full-time enrollment: 3,843)
Gateway Technical College (about 23 miles; Kenosha, WI ; FT enrollment: 5,089)
Carroll University (about 23 miles; Waukesha, WI ; FT enrollment: 3,313)
Carthage College (about 24 miles; Kenosha, WI ; FT enrollment: 3,130)
University of Wisconsin-Whitewater (about 26 miles; Whitewater, WI ; FT enrollment: 11,124)
College of Lake County (about 27 miles; Grayslake, IL ; FT enrollment: 11,041)
Waukesha County Technical College (about 28 miles; Pewaukee, WI ; FT enrollment: 4,415)
Public high school in Burlington: BURLINGTON HIGH Students: 1,249, Location: 400 MCCANNA PKWY, Grades: 9-12)Private high school in Burlington: CATHOLIC CENTRAL HIGH SCHOOL Students: 150, Location: 148 MCHENRY ST, Grades: 9-12)
Public elementary/middle schools in Burlington: RANDALL CONSOLIDATED SCHOOL Students: 715, Location: 37101 - 87TH ST, Grades: PK-8)NETTIE E KARCHER SCHOOL Students: 532, Location: 225 ROBERT ST, Grades: 7-8)DR EDWARD G DYER SCHOOL Students: 454, Location: 201 S KENDRICK AVE, Grades: 4-6)WHEATLAND CENTER ELEMENTARY Students: 399, Location: 6606 368TH AVE, Grades: PK-8)WALLER ELEMENTARY Students: 379, Location: 195 GARDNER AVE, Grades: PK-4)COOPER ELEMENTARY Students: 281, Location: 249 CONKEY ST, Grades: PK-4)WINKLER ELEMENTARY Students: 195, Location: 34150 FULTON ST, Grades: PK-4)LYONS CENTER Students: 137, Location: 1622 MILL ST, Grades: PK-4)Private elementary/middle schools in Burlington: ST MARYS SCHOOL Students: 342, Location: 225 W STATE ST, Grades: KG-8)
ST CHARLES SCHOOL Students: 196, Location: 449 CONKEY ST, Grades: PK-8)ST JOHNS LUTHERAN SCHOOL Students: 155, Location: 198 WESTRIDGE AVE, Grades: KG-8)
See full list of schools located in Burlington Library in Burlington: BURLINGTON PUBLIC LIBRARY Operating income: $679,438; Location: 166 E. JEFFERSON ST.; 61,556 books ; 8,805 e-books ; 6,431 audio materials ; 4,028 video materials ; 4 local licensed databases ; 28 state licensed databases ; 1 other licensed databases ; 179 print serial subscriptions )
User-submitted facts and corrections:
MUSEUMS IN BURLINGTON WISCONSIN: Spinning Top Museum: hands-on tops and top games, videos, live presentation, & exhibit of more than 2000 tops, yo-yos, & gyroscopes. Call for hours for families and for groups. 533 Milwaukee Av, downtown Burlington www.topmuseum.org 262.763-3946 Logic Puzzles Museum: exhibit of mechanical & 3-D puzzles both antique and modern, 50 hands-on lgoci & brain puzzles to try, & make one to keep. Call for hours. 533 Milwaukee Av, downtown Burlington 262. 763.3946 Chocolate Museum: 112 E. Chestnut, Burlington 262.763.6044 Burlington Historical Society Museum: 232 N. Perkins Blvd., Burlington 262.767.2884
Notable locations in Burlington: (A) , Browns Lake Golf Course (B) , Burlington Rescue Squad (C) , Medix Ambulance Service (D) , Burlington City Fire Department (E) , Luther Hall (F) , Burlington Public Library (G) , Burlington City Hall (H) . Display/hide their locations on the map
Main business address in Burlington: (A) . Display/hide its location on the map
Churches in Burlington include: (A) , Saint Johns Evangelical Lutheran Church (B) , Saint Johns Episcopal Church (C) , Saint Charles Catholic Church (D) , Plymouth Congregational Church (E) , Our Savior Lutheran Church (F) , First Methodist Church (G) , First Church of Christ Scientist (H) , Cross Evangelical Lutheran Church (I) . Display/hide their locations on the map
Cemeteries: (1) , Burlington Cemetery (2) , Saint Mary Cemetery (3) . Display/hide their locations on the map
Reservoirs: (A) , Echo Lake (B) . Display/hide their locations on the map
River: (A) . Display/hide its location on the map
Parks in Burlington include: (1) , Benson Park (2) , Devor Park (3) , Grove Street Park (4) , Highridge Park (5) , McCanna Park (6) , Meinhardt Park (7) , Nestles Park (8) , Riverside Park (9) . Display/hide their locations on the map
Tourist attractions:
Hotels:
Courts:
Birthplace of: Bill Kazmaier - Professional wrestler, Braggo Roth - Baseball player, John Pregenzer - Baseball player, Paul Miller (baseball) - Baseball player, Samantha Kerkman - Politician.
Racine County has a predicted average indoor radon screening level between 2 and 4 pCi/L (pico curies per liter) - Moderate Potential Drinking water stations with addresses in Burlington and their reported violations in the past:
BURLINGTON WATERWORKS (Population served: 9,958, Groundwater):
Past health violations:
MCL, Average - Between JAN-2011 and MAR-2011, Contaminant: Gross Alpha, Excl. Radon and U. Follow-up actions: St Public Notif received (APR-05-2011), St Consent Decree/Judgement (APR-05-2011), St Public Notif issued (APR-05-2011), St Other (APR-05-2011), St Compliance achieved (FEB-27-2013)
MCL, Average - Between OCT-2010 and DEC-2010, Contaminant: Gross Alpha, Excl. Radon and U. Follow-up actions: St Public Notif received (DEC-03-2010), St Consent Decree/Judgement (DEC-03-2010), St Public Notif issued (DEC-03-2010), St Other (DEC-03-2010), St Compliance achieved (FEB-27-2013)
MCL, Average - Between JUL-2010 and SEP-2010, Contaminant: Gross Alpha, Excl. Radon and U. Follow-up actions: St Public Notif received (AUG-02-2010), St Other (AUG-02-2010), St Public Notif issued (AUG-02-2010), St Consent Decree/Judgement (AUG-10-2010), St Compliance achieved (FEB-27-2013)
MCL, Average - Between APR-2010 and JUN-2010, Contaminant: Gross Alpha, Excl. Radon and U. Follow-up actions: St Public Notif issued (MAY-04-2010), St Violation/Reminder Notice (MAY-04-2010), St Public Notif requested (MAY-04-2010), St Other (MAY-04-2010), St Consent Decree/Judgement (MAY-04-2010), St Public Notif received (MAY-04-2010), St Consent Decree/Judgement (AUG-10-2010), St Compliance achieved (FEB-27-2013)
MCL, Average - Between JAN-2009 and DEC-2009, Contaminant: Gross Alpha, Excl. Radon and U. Follow-up actions: St Public Notif requested (APR-30-2009), St Violation/Reminder Notice (APR-30-2009), St Public Notif issued (MAY-22-2009), St Public Notif received (MAY-28-2009), St Other (APR-02-2010), St Consent Decree/Judgement (APR-02-2010), St Public Notif received (JUN-18-2010), St Public Notif issued (JUN-18-2010), St Consent Decree/Judgement (AUG-10-2010), St Compliance achieved (FEB-27-2013)
MCL, Average - Between JAN-2009 and DEC-2009, Contaminant: Combined Radium (-226 and -228). Follow-up actions: St Other (APR-24-2009), St Public Notif requested (APR-30-2009), St Violation/Reminder Notice (APR-30-2009), St Public Notif issued (MAY-22-2009), St Public Notif received (MAY-28-2009), St Formal NOV issued (JAN-07-2010), St Consent Decree/Judgement (2 times from APR-02-2010 to AUG-10-2010), St Compliance achieved (FEB-27-2013)
2 other older health violations
Past monitoring violations:
Lead Consumer Notice - In JAN-01-2014, Contaminant: Lead and Copper Rule. Follow-up actions: St Violation/Reminder Notice (JAN-29-2014), St Compliance achieved (FEB-05-2014)
Monitoring and Reporting (DBP) - Between JAN-2005 and DEC-2005, Contaminant: TTHM. Follow-up actions: St Violation/Reminder Notice (NOV-23-2005), St Public Notif received (JUL-16-2006), St Compliance achieved (AUG-22-2006)
Monitoring and Reporting (DBP) - Between JAN-2005 and DEC-2005, Contaminant: Total Haloacetic Acids (HAA5). Follow-up actions: St Violation/Reminder Notice (NOV-23-2005), St Public Notif received (JUL-16-2006), St Compliance achieved (AUG-22-2006)
14 regular monitoring violations
Population served: 500, Groundwater):
Past monitoring violations:
Monitoring and Reporting (DBP) - Between JUL-2011 and SEP-2011, Contaminant: Chlorine. Follow-up actions: St Compliance achieved (OCT-05-2011), St Public Notif requested (OCT-14-2011), St Violation/Reminder Notice (OCT-14-2011), St Public Notif received (JUN-20-2012), St Public Notif issued (JUN-20-2012)
Monitoring and Reporting (DBP) - Between APR-2011 and JUN-2011, Contaminant: Chlorine. Follow-up actions: St Compliance achieved (MAY-11-2011), St Public Notif requested (MAY-17-2011), St Violation/Reminder Notice (MAY-17-2011), St Public Notif received (JUN-20-2012), St Public Notif issued (JUN-20-2012)
2 routine major monitoring violations
Population served: 302, Groundwater):
Past health violations:
MCL, Monthly (TCR) - In SEP-2013, Contaminant: Coliform. Follow-up actions: St Public Notif requested (SEP-16-2013), St Boil Water Order (SEP-16-2013), St Public Notif received (SEP-16-2013), St Public Notif issued (SEP-16-2013), St Violation/Reminder Notice (SEP-16-2013), St Compliance achieved (NOV-25-2013)
MCL, Monthly (TCR) - In NOV-2006, Contaminant: Coliform. Follow-up actions: St Boil Water Order (DEC-01-2006), St Violation/Reminder Notice (DEC-01-2006), St Public Notif requested (DEC-01-2006), St Public Notif received (DEC-02-2006), St Compliance achieved (DEC-06-2006)
MCL, Monthly (TCR) - In SEP-2006, Contaminant: Coliform. Follow-up actions: St Public Notif requested (SEP-27-2006), St Violation/Reminder Notice (SEP-27-2006), St Public Notif received (SEP-27-2006), St Boil Water Order (SEP-27-2006), St Compliance achieved (OCT-05-2006)
Population served: 42, Groundwater):
Past health violations:
MCL, Monthly (TCR) - In NOV-2013, Contaminant: Coliform. Follow-up actions: St Public Notif received (NOV-12-2013), St Public Notif issued (NOV-12-2013), St Violation/Reminder Notice (NOV-14-2013), St Public Notif requested (NOV-14-2013), St Boil Water Order (NOV-14-2013), St Compliance achieved (DEC-09-2013)
Population served: 28, Groundwater):
Past health violations:
MCL, Monthly (TCR) - In SEP-2011, Contaminant: Coliform. Follow-up actions: St Public Notif requested (SEP-23-2011), St Boil Water Order (SEP-23-2011), St Violation/Reminder Notice (SEP-23-2011), St Public Notif issued (SEP-24-2011), St Public Notif received (OCT-05-2011), St Compliance achieved (OCT-06-2011)
Past monitoring violations:
Monitoring, Source Water (GWR) - In MAY-2010, Contaminant: E. COLI. Follow-up actions: St Compliance achieved (MAY-14-2010), St Public Notif requested (MAY-25-2010), St Violation/Reminder Notice (MAY-25-2010), St Public Notif issued (JUN-09-2010), St Public Notif received (JUN-14-2010)
One routine major monitoring violation
Drinking water stations with addresses in Burlington that have no violations reported:
YMCA CAMP MACLEAN LODGE (Population served: 250, Primary Water Source Type: Groundwater)
YMCA CAMP MACLEAN KELSEYS PLACE (Population served: 250, Primary Water Source Type: Groundwater)
RIVERWOOD COMMUNITY CHURCH (Population served: 125, Primary Water Source Type: Groundwater)
LITTLE COUNTRY STORE (Population served: 100, Primary Water Source Type: Groundwater)
THE WATERFRONT (Population served: 50, Primary Water Source Type: Groundwater)
THOMAS BUS SERVICE (Population served: 33, Primary Water Source Type: Groundwater)
STOWELL CATERING SERVICE INC (Population served: 32, Primary Water Source Type: Groundwater)
SQUARED PIZZA (Population served: 29, Primary Water Source Type: Groundwater)
ROCHESTER MINI MART (Population served: 27, Primary Water Source Type: Groundwater)
PEDAL N CUP (Population served: 27, Primary Water Source Type: Groundwater)
Average household size: This city:
2.4 peopleWisconsin:
2.4 people
Percentage of family households: This city:
63.7%Whole state:
64.4%
Percentage of households with unmarried partners: This city:
7.1%Whole state:
7.3%
Likely homosexual households (counted as self-reported same-sex unmarried-partner households)
Lesbian couples: 0.2% of all households Gay men: 0.0% of all households
People in group quarters in Burlington in 2010:
116 people in nursing facilities/skilled-nursing facilities
28 people in group homes intended for adults
25 people in other noninstitutional facilities
8 people in emergency and transitional shelters (with sleeping facilities) for people experiencing homelessness
People in group quarters in Burlington in 2000:
190 people in nursing homes
18 people in homes or halfway houses for drug/alcohol abuse
14 people in homes for the mentally retarded
13 people in homes for the mentally ill
10 people in other noninstitutional group quarters
4 people in religious group quarters
Banks with most branches in Burlington (2011 data):
Talmer Bank and Trust: Burlington East Branch, Burlington - 400 Milwaukee Ave Branc, Burlington Mini Bank. Info updated 2011/05/03: Bank assets: $2,126.7 mil, Deposits: $1,722.6 mil, headquarters in Troy, MI, positive income , Commercial Lending Specialization, 56 total offices , Holding Company: Talmer Bancorp Inc.
Johnson Bank: Burlington Loan Production Office at 565 Milwaukee Avenue, branch established on 2002/11/01; Burlington Branch 28000 at 101 West Chestnut Street, branch established on 2005/04/01. Info updated 2006/07/05: Bank assets: $4,144.5 mil, Deposits: $3,567.4 mil, headquarters in Racine, WI, negative income in the last year , Commercial Lending Specialization, 55 total offices , Holding Company: Johnson Financial Group, Inc.
BMO Harris Bank National Association: Milwaukee Avenue, Burlington Branch at 1000 Milwaukee Avenue, branch established on 2010/10/25. Info updated 2011/07/14: Bank assets: $97,264.0 mil, Deposits: $75,624.6 mil, headquarters in Chicago, IL, positive income , 717 total offices , Holding Company: Bank Of Montreal
North Shore Bank, FSB: S Pine St Branch at 116 S Pine St, branch established on 1923/01/01. Info updated 2011/07/21: Bank assets: $1,769.3 mil, Deposits: $1,357.7 mil, headquarters in Brookfield, WI, negative income in the last year , Commercial Lending Specialization, 47 total offices
Fox River State Bank: at 241 E. Jefferson Street, branch established on 2003/08/15. Info updated 2006/11/03: Bank assets: $92.7 mil, Deposits: $81.1 mil, local headquarters , negative income in the last year , Commercial Lending Specialization, 1 total offices , Holding Company: Fox River Financial Corporation
Guaranty Bank: Burlington Branch at 1901 South Milwaukee, branch established on 2004/01/21. Info updated 2011/07/21: Bank assets: $1,179.1 mil, Deposits: $1,102.7 mil, headquarters in Milwaukee, WI, negative income in the last year , Mortgage Lending Specialization, 166 total offices
Associated Bank, National Association: Burlington Branch at 1050 Milwaukee Avenue, branch established on 1997/05/20. Info updated 2008/09/12: Bank assets: $21,715.0 mil, Deposits: $15,244.4 mil, headquarters in Green Bay, WI, positive income , Commercial Lending Specialization, 282 total offices , Holding Company: Associated Banc-Corp
JPMorgan Chase Bank, National Association: Burlington Branch at 189 East Chestnut Street, branch established on 1891/01/01. Info updated 2011/11/10: Bank assets: $1,811,678.0 mil, Deposits: $1,190,738.0 mil, headquarters in Columbus, OH, positive income , International Specialization, 5577 total offices , Holding Company: Jpmorgan Chase & Co.
Community State Bank: Burlington Branch at 308 North Bridge Street, branch established on 2004/01/05. Info updated 2006/11/03: Bank assets: $276.3 mil, Deposits: $242.0 mil, headquarters in Union Grove, WI, positive income , Commercial Lending Specialization, 9 total offices , Holding Company: Community State Bank Employee Stock Ownership Plan And Trust
For population 15 years and over in Burlington:
Never married: 34.6%Now married: 44.8%Separated: 0.5%Widowed: 6.2%Divorced: 13.9% For population 25 years and over in Burlington:
High school or higher: 95.1%Bachelor's degree or higher: 26.1%Graduate or professional degree: 10.6%Unemployed: 5.6%Mean travel time to work (commute): 19.7 minutes
Education Gini index (Inequality in education) Here:
9.4Wisconsin average:
10.4
Religion statistics for Burlington, WI (based on Racine County data)
Religion Adherents Congregations Catholic 43,335 21 Mainline Protestant 21,224 48 Evangelical Protestant 20,564 79 Black Protestant 3,520 14 Orthodox 2,020 5 Other 1,213 10 None 103,532 -
Source: Clifford Grammich, Kirk Hadaway, Richard Houseal, Dale E.Jones, Alexei Krindatch, Richie Stanley and Richard H.Taylor. 2012. 2010 U.S.Religion Census: Religious Congregations & Membership Study. Association of Statisticians of American Religious Bodies. Jones, Dale E., et al. 2002. Congregations and Membership in the United States 2000. Nashville, TN: Glenmary Research Center. Graphs represent county-level data
Food Environment Statistics: Number of grocery stores : 37Here :
1.86 / 10,000 pop.State :
1.86 / 10,000 pop.
Number of supercenters and club stores : 2This county :
0.10 / 10,000 pop.Wisconsin :
0.11 / 10,000 pop.
Number of convenience stores (no gas) : 7This county :
0.35 / 10,000 pop.Wisconsin :
0.38 / 10,000 pop.
Number of convenience stores (with gas) : 70This county :
3.52 / 10,000 pop.Wisconsin :
4.12 / 10,000 pop.
Number of full-service restaurants : 125Racine County :
6.28 / 10,000 pop.Wisconsin :
8.64 / 10,000 pop.
Adult diabetes rate : This county :
8.3%State :
7.6%
Adult obesity rate : Racine County :
28.0%Wisconsin :
27.5%
Low-income preschool obesity rate : This county :
13.3%Wisconsin :
13.0%
Health and Nutrition: Healthy diet rate : Burlington:
50.1%Wisconsin:
49.5%
Average overall health of teeth and gums : This city:
46.6%Wisconsin:
46.6%
Average BMI : Burlington:
28.8Wisconsin:
28.7
People feeling badly about themselves : This city:
20.5%State:
21.4%
People not drinking alcohol at all : Average hours sleeping at night : This city:
6.8Wisconsin:
6.8
Overweight people : This city:
34.8%State:
34.0%
General health condition : Burlington:
56.4%State:
56.3%
Average condition of hearing : Burlington:
78.1%State:
78.5%
More about Health and Nutrition of Burlington, WI Residents
Local government employment and payroll (March 2022)
Function
Full-time employees
Monthly full-time payroll
Average yearly full-time wage
Part-time employees
Monthly part-time payroll
Police Protection - Officers
22 $153,349 $83,645 0 $0 Firefighters
9 $62,030 $82,707 13 $2,678 Streets and Highways
8 $42,842 $64,263 0 $0 Sewerage
7 $37,646 $64,536 0 $0 Other Government Administration
5 $37,471 $89,930 9 $3,066 Water Supply
4 $23,044 $69,132 0 $0 Local Libraries
4 $20,083 $60,249 13 $13,982 Parks and Recreation
3 $15,891 $63,564 0 $0 Financial Administration
3 $17,845 $71,380 1 $1,428 Other and Unallocable
2 $13,029 $78,174 0 $0 Police - Other
1 $4,127 $49,524 2 $474 Fire - Other
0 $0 1 $267 Judicial and Legal
0 $0 2 $1,988
Totals for Government
68 $427,357 $75,416 41 $23,885
Burlington government finances - Expenditure in 2018 (per resident):
Construction - Parks and Recreation: $2,203,000 ($200.18)
Regular Highways: $651,000 ($59.15)Natural Resources - Other: $297,000 ($26.99)Libraries: $16,000 ($1.45)Current Operations - Sewerage: $3,469,000 ($315.22)
Police Protection: $2,985,000 ($271.24)Water Utilities: $2,275,000 ($206.72)Regular Highways: $1,165,000 ($105.86)Local Fire Protection: $809,000 ($73.51)Libraries: $748,000 ($67.97)Air Transportation: $678,000 ($61.61)General - Other: $649,000 ($58.97)Parks and Recreation: $583,000 ($52.98)Solid Waste Management: $522,000 ($47.43)Central Staff Services: $507,000 ($46.07)Financial Administration: $247,000 ($22.44)Judicial and Legal Services: $191,000 ($17.36)Natural Resources - Other: $146,000 ($13.27)Protective Inspection and Regulation - Other: $111,000 ($10.09)Health - Other: $78,000 ($7.09)Parking Facilities: $13,000 ($1.18)Miscellaneous Commercial Activities - Other: $4,000 ($0.36)General Public Buildings: $3,000 ($0.27)General - Interest on Debt: $835,000 ($75.87)
Other Capital Outlay - Central Staff Services: $877,000 ($79.69)
Regular Highways: $183,000 ($16.63)Police Protection: $24,000 ($2.18)Local Fire Protection: $12,000 ($1.09)
Burlington government finances - Revenue in 2018 (per resident):
Charges - Sewerage: $2,623,000 ($238.35)
Air Transportation: $586,000 ($53.25)Other: $136,000 ($12.36)Parks and Recreation: $24,000 ($2.18)Regular Highways: $1,000 ($0.09)Federal Intergovernmental - Housing and Community Development: $45,000 ($4.09)
Local Intergovernmental - Sewerage: $620,000 ($56.34)
Other: $345,000 ($31.35)Miscellaneous - General Revenue - Other: $291,000 ($26.44)
Fines and Forfeits: $167,000 ($15.17)Interest Earnings: $138,000 ($12.54)Donations From Private Sources: $114,000 ($10.36)Rents: $97,000 ($8.81)Sale of Property: $69,000 ($6.27)Special Assessments: $28,000 ($2.54)Revenue - Water Utilities: $2,477,000 ($225.08)
State Intergovernmental - Highways: $591,000 ($53.70)
General Local Government Support: $496,000 ($45.07)Other: $334,000 ($30.35)Education: $274,000 ($24.90)Housing and Community Development: $157,000 ($14.27)Tax - Property: $10,056,000 ($913.77)
Occupation and Business License - Other: $252,000 ($22.90)Other License: $226,000 ($20.54)Other Selective Sales: $134,000 ($12.18)Other: $49,000 ($4.45)
Burlington government finances - Debt in 2018 (per resident):
Long Term Debt - Outstanding Unspecified Public Purpose: $29,821,000 ($2709.77)
Beginning Outstanding - Unspecified Public Purpose: $25,077,000 ($2278.69)Outstanding Nonguaranteed - Industrial Revenue: $11,075,000 ($1006.36)Issue, Unspecified Public Purpose: $10,100,000 ($917.76)Beginning Outstanding - Public Debt for Private Purpose: $10,059,000 ($914.04)Retired Unspecified Public Purpose: $5,357,000 ($486.78)Issue, Nonguaranteed - Public Debt for Private Purpose: $1,610,000 ($146.30)Retired Nonguaranteed - Public Debt for Private Purpose: $594,000 ($53.98)
Burlington government finances - Cash and Securities in 2018 (per resident):
Bond Funds - Cash and Securities: $480,000 ($43.62)
Sinking Funds - Cash and Securities: $11,075,000 ($1006.36)
Businesses in Burlington, WI
Name Count Name Count
AT&T 1 MasterBrand Cabinets 2 Advance Auto Parts 1 McDonald's 1 AmericInn 1 Menards 1 Blockbuster 1 Nike 3 Chevrolet 1 Pizza Hut 1 Dairy Queen 1 SAS Shoes 1 Domino's Pizza 1 T-Mobile 1 Fashion Bug 1 Taco Bell 1 FedEx 1 True Value 1 H&R Block 1 U-Haul 3 Hilton 1 UPS 2 KFC 1 Walgreens 1 Kmart 1 Walmart 1 Kohl's 1 Wendy's 1 Lane Furniture 1 YMCA 1 Long John Silver's 1
Strongest AM radio stations in Burlington:
WTMJ (620 AM; 50 kW; MILWAUKEE, WI; Owner: JOURNAL BROADCAST CORPORATION)
WISN (1130 AM; 50 kW; MILWAUKEE, WI; Owner: CAPSTAR TX LIMITED PARTNERSHIP)
WGN (720 AM; 50 kW; CHICAGO, IL; Owner: WGN CONTINENTAL BROADCASTING CO.)
WSCR (670 AM; 50 kW; CHICAGO, IL; Owner: INFINITY BROADCASTING OPERATIONS, INC.)
WBBM (780 AM; 50 kW; CHICAGO, IL; Owner: INFINITY BROADCASTING OPERATIONS, INC.)
WMVP (1000 AM; 50 kW; CHICAGO, IL; Owner: ABC, INC.)
WAUK (1510 AM; daytime; 10 kW; WAUKESHA, WI; Owner: WALT-WEST WISCONSIN, INC.)
WZRK (1550 AM; 1 kW; LAKE GENEVA, WI)
WOKY (920 AM; 5 kW; MILWAUKEE, WI; Owner: CLEAR CHANNEL BROADCASTING LICENSES, INC.)
WEMP (1250 AM; 5 kW; MILWAUKEE, WI; Owner: ENTERCOM MILWAUKEE LICENSE, LLC)
WLS (890 AM; 50 kW; CHICAGO, IL; Owner: WLS, INC.)
WKSH (1640 AM; 10 kW; SUSSEX, WI; Owner: ABC, INC.)
WMCS (1290 AM; 5 kW; GREENFIELD, WI; Owner: MILWAUKEE RADIO ALLIANCE, LLC)
Strongest FM radio stations in Burlington:
WBSD (89.1 FM; BURLINGTON, WI; Owner: BURLINGTON AREA SCHOOL DISTRICT)
WLKG (96.1 FM; LAKE GENEVA, WI; Owner: CTJ COMMUNICATIONS, LTD.)
WKKV-FM (100.7 FM; RACINE, WI; Owner: CLEAR CHANNEL BROADCASTING LICENSES, INC.)
WFZH (105.3 FM; MUKWONAGO, WI; Owner: CARON BROADCASTING, INC.)
WHAD (90.7 FM; DELAFIELD, WI; Owner: STATE OF WISCONSIN - EDUCATIONAL COMMUNICATIONS BOARD)
WJZI (93.3 FM; MILWAUKEE, WI; Owner: MILWAUKEE RADIO ALLIANCE, LLC)
WMIL-FM (106.1 FM; WAUKESHA, WI; Owner: CLEAR CHANNEL BROADCASTING LICENSES, INC.)
WVCY-FM (107.7 FM; MILWAUKEE, WI; Owner: VCY AMERICA, INC.)
WKTI-FM (94.5 FM; MILWAUKEE, WI; Owner: JOURNAL BROADCAST CORPORATION)
WEZY (92.1 FM; RACINE, WI; Owner: RACINE BROADCASTING, L.L.C.)
WLTQ (97.3 FM; MILWAUKEE, WI; Owner: CAPSTAR TX LIMITED PARTNERSHIP)
WUWM (89.7 FM; MILWAUKEE, WI; Owner: BOARD OF REGENTS, UNIVERSITY OF WISCONSIN SYSTEM)
WMYX-FM (99.1 FM; MILWAUKEE, WI; Owner: ENTERCOM MILWAUKEE LICENSE, LLC)
WWDV (96.9 FM; ZION, IL; Owner: BONNEVILLE HOLDING COMPANY)
WXSS (103.7 FM; WAUWATOSA, WI; Owner: ENTERCOM MILWAUKEE LICENSE, LLC)
WKLH (96.5 FM; MILWAUKEE, WI; Owner: LAKEFRONT COMMUNICATIONS, LLC)
WMWK (88.1 FM; MILWAUKEE, WI; Owner: FAMILY STATIONS, INC.)
WLUM-FM (102.1 FM; MILWAUKEE, WI; Owner: MILWAUKEE RADIO ALLIANCE, LLC)
WIIL (95.1 FM; KENOSHA, WI; Owner: NM LICENSING, LLC)
WZSR (105.5 FM; WOODSTOCK, IL; Owner: NM LICENSING, LLC)
TV broadcast stations around Burlington:
W64CQ (Channel 64; ARLINGTON HEIGHTS, IL; Owner: TRINITY BROADCASTING NETWORK)
WJJA (Channel 49; RACINE, WI; Owner: TV-49, INC.)
WPXE (Channel 55; KENOSHA, WI; Owner: PAXSON MILWAUKEE LICENSE, INC.)
W34CK (Channel 34; ARLINGTON HEIGHTS, IL; Owner: FIRST UNITED, INC.)
WMVS (Channel 10; MILWAUKEE, WI; Owner: MILWAUKEE AREA TECHNICAL COLLEGE DISTRICT BOARD)
WDJT-TV (Channel 58; MILWAUKEE, WI; Owner: WDJT-TV LIMITED PARTNERSHIP)
WISN-TV (Channel 12; MILWAUKEE, WI; Owner: WISN HEARST-ARGYLE TV, INC. (CA CORP.))
WMVT (Channel 36; MILWAUKEE, WI; Owner: MILWAUKEE AREA TECHNICAL COLLEGE DISTRICT BOARD)
WCGV-TV (Channel 24; MILWAUKEE, WI; Owner: WCGV LICENSEE, LLC)
WMLW-CA (Channel 46; MILWAUKEE, WI; Owner: CHANNEL 41 AND 63 LIMITED PARTNERSHIP)
W63CU (Channel 63; MILWAUKEE, WI; Owner: CHANNEL 41 AND 63 LIMITED PARTNERSHIP)
WVTV (Channel 18; MILWAUKEE, WI; Owner: WVTV LICENSEE, INC.)
WTMJ-TV (Channel 4; MILWAUKEE, WI; Owner: JOURNAL BROADCAST CORPORATION)
WVCY-TV (Channel 30; MILWAUKEE, WI; Owner: VCY AMERICA, INC.)
WMKE-CA (Channel 7; MILWAUKEE, WI; Owner: KM LPTV OF MILWAUKEE, L.L.C.)
WGBO-TV (Channel 66; JOLIET, IL; Owner: WGBO LICENSE PARTNERSHIP, G.P.)
WITI (Channel 6; MILWAUKEE, WI; Owner: WITI LICENSE,INC.)
WTAS-LP (Channel 43; WAUKESHA, WI; Owner: WAUKESHA TOWER ASSOCIATES)
National Bridge Inventory (NBI) Statistics 22 Number of bridges440ft / 134m Total length $7,055,000 Total costs138,154 Total average daily traffic960 Total average daily truck traffic
New bridges - historical statistics
1 1950-1959 1 1970-1979 1 1980-1989 2 1990-1999 17 2000-2009
See full National Bridge Inventory statistics for Burlington, WI
Home Mortgage Disclosure Act Aggregated Statistics For Year 2009(Based on 2 partial tracts) A) FHA, FSA/RHS & VA B) Conventional C) Refinancings D) Home Improvement Loans E) Loans on Dwellings For 5+ Families F) Non-occupant Loans on Number Average Value Number Average Value Number Average Value Number Average Value Number Average Value Number Average Value
LOANS ORIGINATED 10 $155,016 20 $154,843 133 $158,419 4 $37,675 1 $1,812,980 7 $142,551 APPLICATIONS APPROVED, NOT ACCEPTED 0 $0 1 $140,480 14 $163,010 1 $73,360 0 $0 0 $0 APPLICATIONS DENIED 3 $134,233 0 $0 26 $167,418 2 $47,965 0 $0 1 $89,080 APPLICATIONS WITHDRAWN 0 $0 3 $97,467 19 $172,018 1 $48,360 0 $0 1 $212,470 FILES CLOSED FOR INCOMPLETENESS 0 $0 1 $224,430 5 $178,950 0 $0 0 $0 0 $0
Aggregated Statistics For Year 2008(Based on 2 partial tracts) A) FHA, FSA/RHS & VA B) Conventional C) Refinancings D) Home Improvement Loans E) Loans on Dwellings For 5+ Families F) Non-occupant Loans on Number Average Value Number Average Value Number Average Value Number Average Value Number Average Value Number Average Value
LOANS ORIGINATED 7 $163,601 22 $187,526 72 $169,925 7 $56,054 1 $1,341,040 5 $256,522 APPLICATIONS APPROVED, NOT ACCEPTED 0 $0 4 $123,302 11 $150,053 2 $12,845 0 $0 0 $0 APPLICATIONS DENIED 1 $260,950 2 $138,355 26 $181,258 3 $67,277 0 $0 0 $0 APPLICATIONS WITHDRAWN 0 $0 1 $109,320 10 $168,331 2 $98,585 0 $0 0 $0 FILES CLOSED FOR INCOMPLETENESS 0 $0 0 $0 3 $141,997 1 $106,260 0 $0 0 $0
Aggregated Statistics For Year 2007(Based on 2 partial tracts) A) FHA, FSA/RHS & VA B) Conventional C) Refinancings D) Home Improvement Loans E) Loans on Dwellings For 5+ Families F) Non-occupant Loans on Number Average Value Number Average Value Number Average Value Number Average Value Number Average Value Number Average Value
LOANS ORIGINATED 2 $153,235 47 $168,159 84 $160,892 13 $109,302 1 $398,510 13 $193,232 APPLICATIONS APPROVED, NOT ACCEPTED 0 $0 3 $131,410 18 $161,618 3 $74,920 0 $0 2 $141,295 APPLICATIONS DENIED 3 $270,623 8 $178,835 36 $136,328 7 $68,180 0 $0 3 $187,633 APPLICATIONS WITHDRAWN 0 $0 3 $182,080 19 $148,004 1 $92,960 0 $0 1 $157,560 FILES CLOSED FOR INCOMPLETENESS 0 $0 1 $95,400 6 $170,198 0 $0 0 $0 0 $0
Aggregated Statistics For Year 2006(Based on 2 partial tracts) A) FHA, FSA/RHS & VA B) Conventional C) Refinancings D) Home Improvement Loans F) Non-occupant Loans on Number Average Value Number Average Value Number Average Value Number Average Value Number Average Value
LOANS ORIGINATED 3 $162,603 52 $154,772 74 $140,082 12 $64,567 11 $169,670 APPLICATIONS APPROVED, NOT ACCEPTED 0 $0 3 $157,270 16 $128,450 0 $0 1 $124,260 APPLICATIONS DENIED 0 $0 6 $167,208 33 $138,495 5 $71,712 1 $95,840 APPLICATIONS WITHDRAWN 0 $0 5 $187,584 29 $142,239 2 $328,355 1 $155,450 FILES CLOSED FOR INCOMPLETENESS 0 $0 3 $90,450 12 $147,662 0 $0 1 $168,810
Aggregated Statistics For Year 2005(Based on 2 partial tracts) A) FHA, FSA/RHS & VA B) Conventional C) Refinancings D) Home Improvement Loans E) Loans on Dwellings For 5+ Families F) Non-occupant Loans on G) Loans On Manufactured Number Average Value Number Average Value Number Average Value Number Average Value Number Average Value Number Average Value Number Average Value
LOANS ORIGINATED 7 $150,969 62 $146,778 86 $130,989 8 $33,381 1 $693,560 17 $142,906 0 $0 APPLICATIONS APPROVED, NOT ACCEPTED 0 $0 3 $108,240 11 $111,976 1 $54,640 0 $0 1 $132,710 0 $0 APPLICATIONS DENIED 1 $182,900 9 $123,113 52 $146,932 6 $33,107 0 $0 3 $109,037 1 $28,250 APPLICATIONS WITHDRAWN 1 $113,100 8 $121,568 31 $142,341 2 $160,235 0 $0 3 $104,277 0 $0 FILES CLOSED FOR INCOMPLETENESS 0 $0 1 $100,790 13 $165,231 0 $0 0 $0 0 $0 0 $0
Aggregated Statistics For Year 2004(Based on 2 partial tracts) A) FHA, FSA/RHS & VA B) Conventional C) Refinancings D) Home Improvement Loans E) Loans on Dwellings For 5+ Families F) Non-occupant Loans on Number Average Value Number Average Value Number Average Value Number Average Value Number Average Value Number Average Value
LOANS ORIGINATED 5 $134,658 56 $142,201 95 $124,572 13 $49,000 2 $607,125 12 $112,057 APPLICATIONS APPROVED, NOT ACCEPTED 0 $0 4 $100,848 8 $144,790 0 $0 0 $0 0 $0 APPLICATIONS DENIED 0 $0 7 $124,487 33 $140,170 4 $13,945 0 $0 0 $0 APPLICATIONS WITHDRAWN 2 $129,850 3 $145,623 18 $123,264 1 $39,510 0 $0 2 $133,300 FILES CLOSED FOR INCOMPLETENESS 0 $0 2 $118,035 14 $138,261 0 $0 0 $0 0 $0
Aggregated Statistics For Year 2003(Based on 2 partial tracts) A) FHA, FSA/RHS & VA B) Conventional C) Refinancings D) Home Improvement Loans E) Loans on Dwellings For 5+ Families F) Non-occupant Loans on Number Average Value Number Average Value Number Average Value Number Average Value Number Average Value Number Average Value
LOANS ORIGINATED 13 $137,028 51 $136,254 212 $115,301 7 $13,337 4 $599,972 18 $118,290 APPLICATIONS APPROVED, NOT ACCEPTED 0 $0 4 $96,515 20 $115,668 2 $35,740 0 $0 2 $114,795 APPLICATIONS DENIED 0 $0 4 $115,568 50 $120,076 3 $37,923 0 $0 2 $73,725 APPLICATIONS WITHDRAWN 1 $82,940 8 $105,719 23 $115,583 0 $0 0 $0 3 $90,943 FILES CLOSED FOR INCOMPLETENESS 0 $0 2 $115,820 7 $147,050 1 $16,120 0 $0 1 $207,850
Aggregated Statistics For Year 2002(Based on 2 partial tracts) A) FHA, FSA/RHS & VA B) Conventional C) Refinancings D) Home Improvement Loans E) Loans on Dwellings For 5+ Families F) Non-occupant Loans on Number Average Value Number Average Value Number Average Value Number Average Value Number Average Value Number Average Value
LOANS ORIGINATED 11 $119,947 52 $120,436 172 $119,417 5 $17,066 4 $1,645,248 13 $122,345 APPLICATIONS APPROVED, NOT ACCEPTED 1 $52,520 3 $136,630 13 $119,695 1 $70,090 0 $0 2 $132,225 APPLICATIONS DENIED 0 $0 6 $71,622 33 $104,918 2 $13,750 0 $0 1 $139,760 APPLICATIONS WITHDRAWN 0 $0 6 $84,408 14 $113,891 1 $8,780 0 $0 1 $150,850 FILES CLOSED FOR INCOMPLETENESS 0 $0 1 $100,020 5 $115,222 0 $0 0 $0 0 $0
Aggregated Statistics For Year 2001(Based on 2 partial tracts) A) FHA, FSA/RHS & VA B) Conventional C) Refinancings D) Home Improvement Loans E) Loans on Dwellings For 5+ Families F) Non-occupant Loans on Number Average Value Number Average Value Number Average Value Number Average Value Number Average Value Number Average Value
LOANS ORIGINATED 6 $117,707 49 $112,284 140 $104,803 6 $14,272 3 $847,100 8 $115,909 APPLICATIONS APPROVED, NOT ACCEPTED 0 $0 4 $95,490 12 $101,225 1 $44,840 0 $0 0 $0 APPLICATIONS DENIED 1 $76,880 7 $114,326 30 $100,577 2 $29,760 0 $0 1 $49,900 APPLICATIONS WITHDRAWN 1 $100,110 6 $105,190 16 $95,819 2 $33,075 0 $0 0 $0 FILES CLOSED FOR INCOMPLETENESS 0 $0 1 $64,480 2 $106,080 0 $0 0 $0 0 $0
Aggregated Statistics For Year 2000(Based on 2 partial tracts) A) FHA, FSA/RHS & VA B) Conventional C) Refinancings D) Home Improvement Loans F) Non-occupant Loans on Number Average Value Number Average Value Number Average Value Number Average Value Number Average Value
LOANS ORIGINATED 5 $119,868 49 $107,652 34 $89,141 10 $16,249 5 $79,122 APPLICATIONS APPROVED, NOT ACCEPTED 1 $70,370 3 $73,397 9 $54,831 4 $17,155 0 $0 APPLICATIONS DENIED 1 $68,640 10 $87,487 19 $67,606 3 $32,630 1 $101,970 APPLICATIONS WITHDRAWN 1 $95,600 3 $86,503 11 $80,253 2 $74,135 0 $0 FILES CLOSED FOR INCOMPLETENESS 0 $0 2 $98,855 6 $93,422 1 $20,000 0 $0
Aggregated Statistics For Year 1999(Based on 2 partial tracts) A) FHA, FSA/RHS & VA B) Conventional C) Refinancings D) Home Improvement Loans E) Loans on Dwellings For 5+ Families F) Non-occupant Loans on Number Average Value Number Average Value Number Average Value Number Average Value Number Average Value Number Average Value
LOANS ORIGINATED 11 $101,985 49 $108,479 74 $86,899 13 $15,530 2 $427,150 6 $100,063 APPLICATIONS APPROVED, NOT ACCEPTED 0 $0 3 $79,513 6 $76,767 3 $16,933 0 $0 0 $0 APPLICATIONS DENIED 0 $0 7 $57,751 19 $105,274 3 $16,547 0 $0 0 $0 APPLICATIONS WITHDRAWN 0 $0 3 $86,563 9 $84,510 4 $45,782 0 $0 0 $0 FILES CLOSED FOR INCOMPLETENESS 0 $0 1 $135,430 5 $97,730 0 $0 0 $0 0 $0
Detailed HMDA statistics for the following Tracts:
0024.01
, 0024.02
Private Mortgage Insurance Companies Aggregated Statistics For Year 2009(Based on 2 partial tracts) A) Conventional B) Refinancings Number Average Value Number Average Value
LOANS ORIGINATED 4 $158,158 7 $186,837 APPLICATIONS APPROVED, NOT ACCEPTED 1 $224,070 2 $178,215 APPLICATIONS DENIED 1 $232,730 3 $157,070 APPLICATIONS WITHDRAWN 0 $0 1 $321,130 FILES CLOSED FOR INCOMPLETENESS 0 $0 0 $0
Aggregated Statistics For Year 2008(Based on 2 partial tracts) A) Conventional B) Refinancings Number Average Value Number Average Value
LOANS ORIGINATED 5 $204,254 8 $204,505 APPLICATIONS APPROVED, NOT ACCEPTED 1 $186,680 5 $212,362 APPLICATIONS DENIED 1 $103,560 1 $252,110 APPLICATIONS WITHDRAWN 0 $0 0 $0 FILES CLOSED FOR INCOMPLETENESS 0 $0 0 $0
Aggregated Statistics For Year 2007(Based on 2 partial tracts) A) Conventional B) Refinancings Number Average Value Number Average Value
LOANS ORIGINATED 18 $175,679 5 $197,424 APPLICATIONS APPROVED, NOT ACCEPTED 1 $164,940 1 $358,150 APPLICATIONS DENIED 1 $107,640 0 $0 APPLICATIONS WITHDRAWN 0 $0 0 $0 FILES CLOSED FOR INCOMPLETENESS 0 $0 0 $0
Aggregated Statistics For Year 2006(Based on 2 partial tracts) A) Conventional B) Refinancings C) Non-occupant Loans on Number Average Value Number Average Value Number Average Value
LOANS ORIGINATED 12 $166,648 4 $175,202 1 $81,060 APPLICATIONS APPROVED, NOT ACCEPTED 0 $0 2 $134,325 0 $0 APPLICATIONS DENIED 0 $0 0 $0 0 $0 APPLICATIONS WITHDRAWN 0 $0 0 $0 0 $0 FILES CLOSED FOR INCOMPLETENESS 0 $0 0 $0 0 $0
Aggregated Statistics For Year 2005(Based on 2 partial tracts) A) Conventional B) Refinancings C) Non-occupant Loans on Number Average Value Number Average Value Number Average Value
LOANS ORIGINATED 13 $163,267 4 $168,580 2 $105,815 APPLICATIONS APPROVED, NOT ACCEPTED 1 $211,440 3 $133,843 0 $0 APPLICATIONS DENIED 0 $0 0 $0 0 $0 APPLICATIONS WITHDRAWN 0 $0 0 $0 0 $0 FILES CLOSED FOR INCOMPLETENESS 0 $0 0 $0 0 $0
Aggregated Statistics For Year 2004(Based on 2 partial tracts) A) Conventional B) Refinancings C) Non-occupant Loans on Number Average Value Number Average Value Number Average Value
LOANS ORIGINATED 12 $150,081 7 $138,536 1 $94,120 APPLICATIONS APPROVED, NOT ACCEPTED 1 $171,860 0 $0 0 $0 APPLICATIONS DENIED 0 $0 0 $0 0 $0 APPLICATIONS WITHDRAWN 0 $0 1 $87,880 0 $0 FILES CLOSED FOR INCOMPLETENESS 0 $0 0 $0 0 $0
Aggregated Statistics For Year 2003(Based on 2 partial tracts) A) Conventional B) Refinancings C) Non-occupant Loans on Number Average Value Number Average Value Number Average Value
LOANS ORIGINATED 11 $126,843 17 $128,962 1 $89,990 APPLICATIONS APPROVED, NOT ACCEPTED 2 $122,465 4 $123,658 0 $0 APPLICATIONS DENIED 0 $0 0 $0 0 $0 APPLICATIONS WITHDRAWN 1 $105,770 0 $0 0 $0 FILES CLOSED FOR INCOMPLETENESS 0 $0 0 $0 0 $0
Aggregated Statistics For Year 2002(Based on 2 partial tracts) A) Conventional B) Refinancings C) Non-occupant Loans on Number Average Value Number Average Value Number Average Value
LOANS ORIGINATED 16 $124,194 14 $131,986 2 $78,295 APPLICATIONS APPROVED, NOT ACCEPTED 3 $101,970 4 $118,262 0 $0 APPLICATIONS DENIED 0 $0 1 $92,130 0 $0 APPLICATIONS WITHDRAWN 1 $76,120 1 $96,980 0 $0 FILES CLOSED FOR INCOMPLETENESS 0 $0 0 $0 0 $0
Aggregated Statistics For Year 2001(Based on 2 partial tracts) A) Conventional B) Refinancings C) Non-occupant Loans on Number Average Value Number Average Value Number Average Value
LOANS ORIGINATED 18 $117,887 14 $127,116 1 $98,070 APPLICATIONS APPROVED, NOT ACCEPTED 1 $174,200 5 $127,358 0 $0 APPLICATIONS DENIED 0 $0 1 $304,190 0 $0 APPLICATIONS WITHDRAWN 0 $0 1 $88,140 0 $0 FILES CLOSED FOR INCOMPLETENESS 0 $0 0 $0 0 $0
Aggregated Statistics For Year 2000(Based on 2 partial tracts) A) Conventional B) Refinancings Number Average Value Number Average Value
LOANS ORIGINATED 19 $109,796 2 $104,725 APPLICATIONS APPROVED, NOT ACCEPTED 1 $162,910 0 $0 APPLICATIONS DENIED 0 $0 2 $137,830 APPLICATIONS WITHDRAWN 1 $71,920 1 $71,240 FILES CLOSED FOR INCOMPLETENESS 0 $0 0 $0
Aggregated Statistics For Year 1999(Based on 2 partial tracts) A) Conventional B) Refinancings Number Average Value Number Average Value
LOANS ORIGINATED 16 $112,230 6 $100,932 APPLICATIONS APPROVED, NOT ACCEPTED 1 $68,700 0 $0 APPLICATIONS DENIED 0 $0 0 $0 APPLICATIONS WITHDRAWN 0 $0 0 $0 FILES CLOSED FOR INCOMPLETENESS 0 $0 0 $0
Detailed PMIC statistics for the following Tracts:
0024.01
, 0024.02 Fire-safe hotels and motels in Burlington, Wisconsin:
Americinn Lodge & Suites Of Burlington, 2709 Brown's Lake Dr, Burlington, Wisconsin 53105 Phone: (262) 534-2125, Fax: (262) 534-5221
Hampton Inn, 400 N Dodge, Burlington, Wisconsin 53105 Phone: (262) 767-1900, Fax: (262) 767-0900
All 2 fire-safe hotels and motels in Burlington, Wisconsin Burlington compared to Wisconsin state average:
Unemployed percentage below state average. Black race population percentage significantly below state average. Length of stay since moving in significantly above state average. Burlington on our top lists :
#93 on the list of "Top 101 cities with the largest percentage of elementary and middle school students in private schools (1,000+ students)"
#94 on the list of "Top 101 cities with largest percentage of females in occupations: office and administrative support occupations (population 5,000+)"
#97 on the list of "Top 101 cities with the most local government spending on current operations of libraries per resident (population 10,000+)"
#78 on the list of "Top 101 counties with the lowest percentage of residents relocating to foreign countries in 2011"
#81 on the list of "Top 101 counties with the lowest percentage of residents relocating from foreign countries between 2010 and 2011"
#86 on the list of "Top 101 counties with the largest number of people moving out compared to moving in (pop. 50,000+)"
#88 on the list of "Top 101 counties with the highest Ozone (1-hour) air pollution readings in 2012 (ppm)"
Top Patent Applicants
Jeremy F. Knopow (19)
David C. Belongia (15)
Simon M. Conway (12)
Daniel A. Andersen (11)
Ryan Michael Pisani (9)
Brian T. Davis (8)
Alan J. Varacins (8)
Lawrence A. Shimp (7)
Craig D. Raleigh (7)
Cherrie K. Donawho (6)
Total of 279 patent applications in 2008-2024.
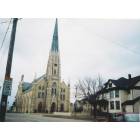
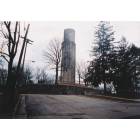
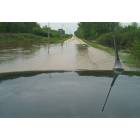
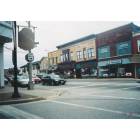
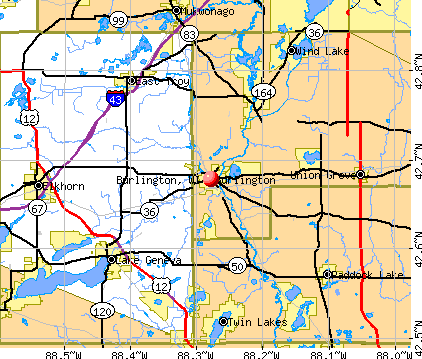


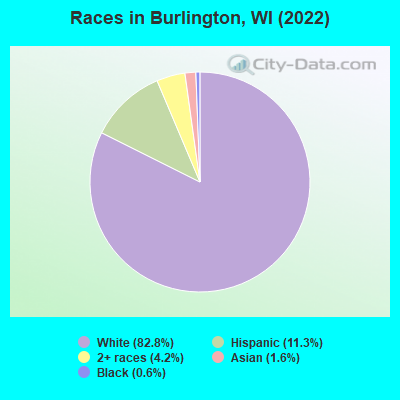
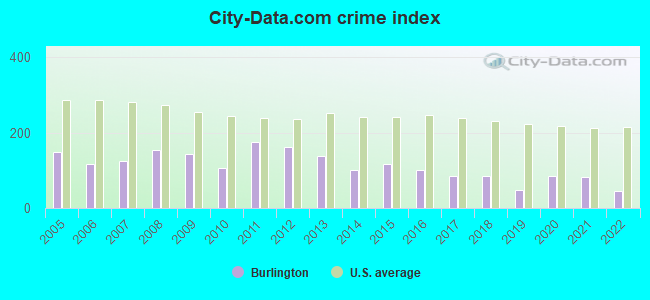
 Recent articles from our blog. Our writers, many of them Ph.D. graduates or candidates, create easy-to-read articles on a wide variety of topics.

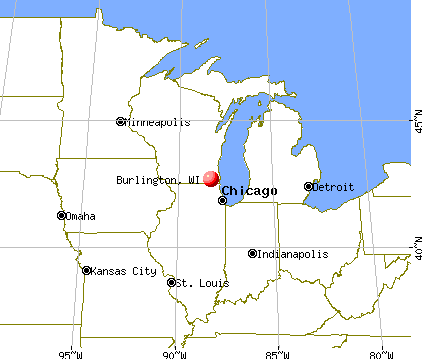
 (23.0 miles
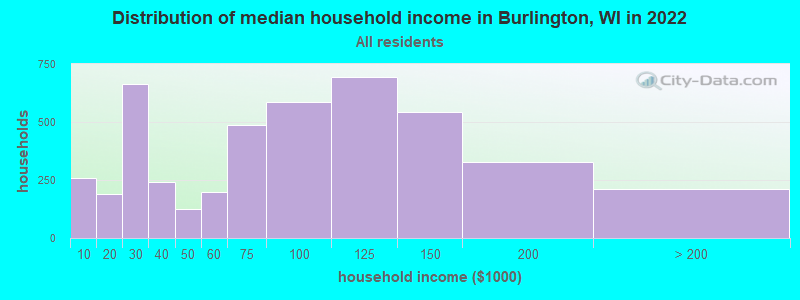
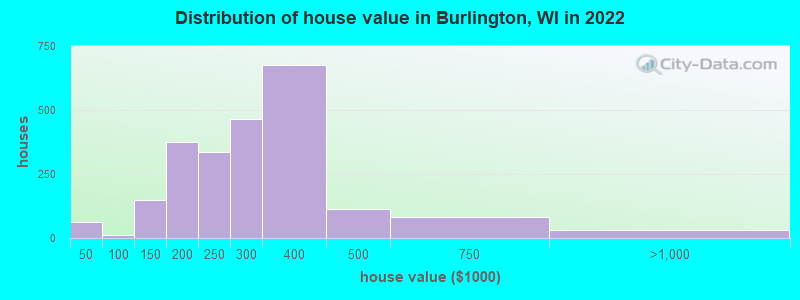
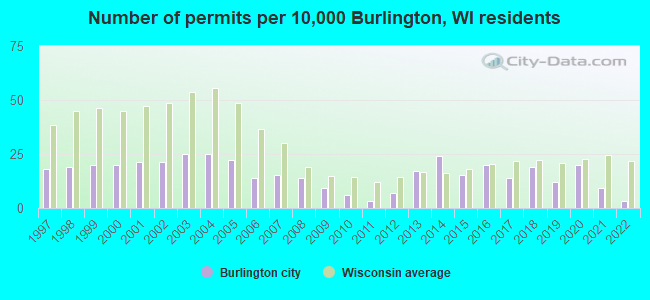
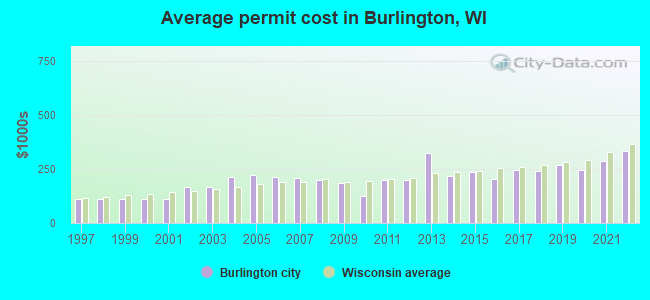
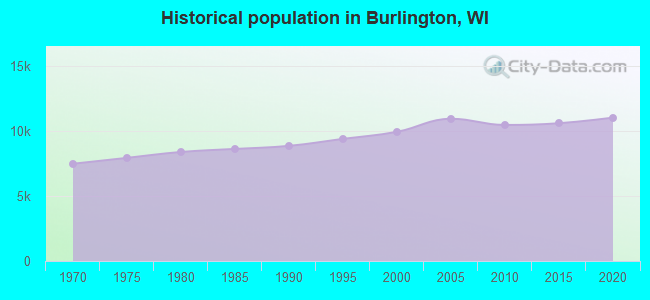
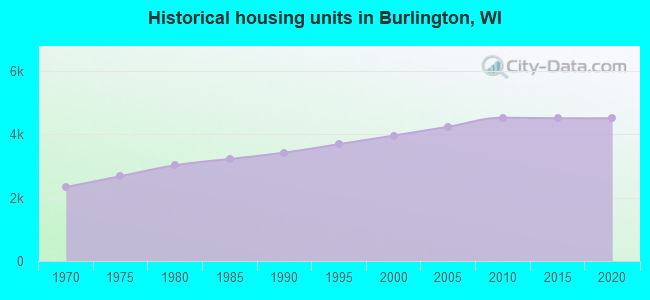
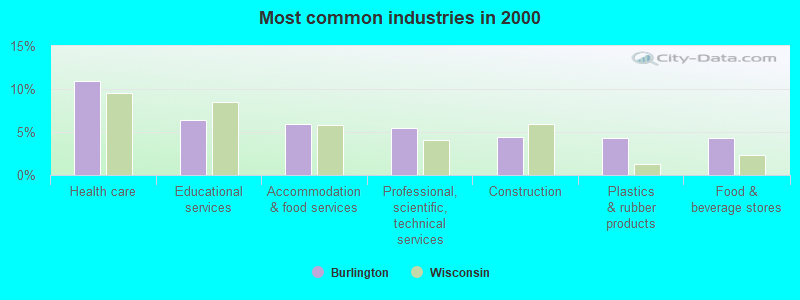
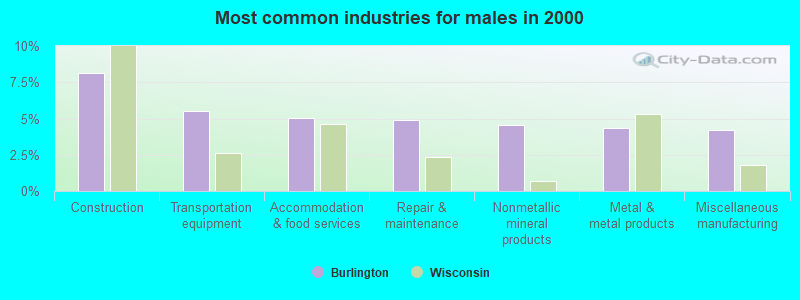
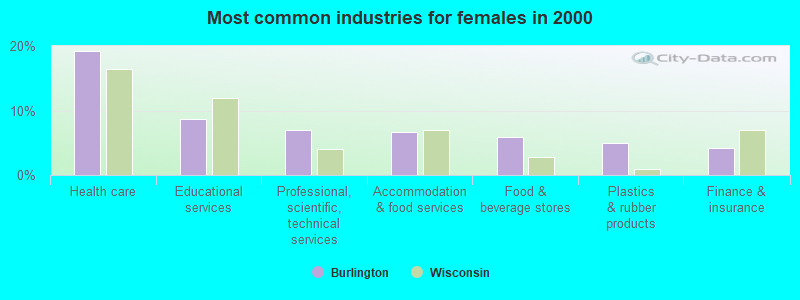
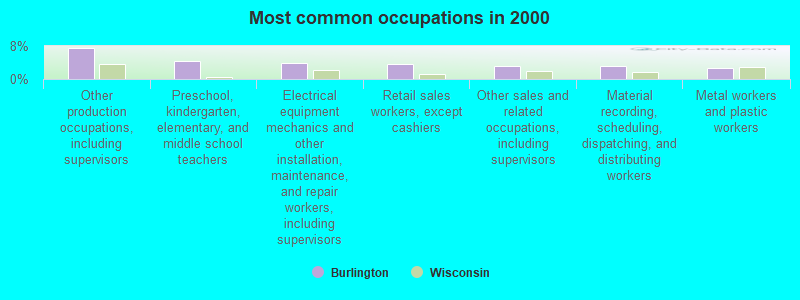
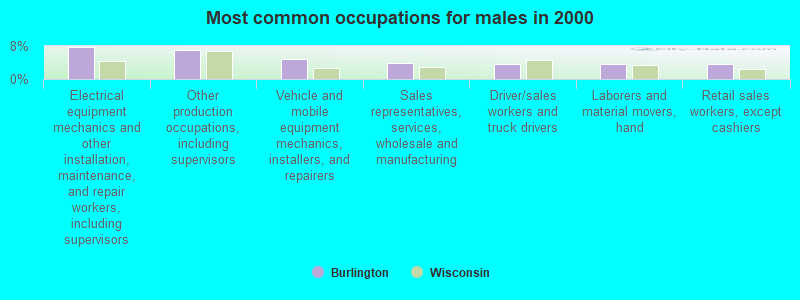
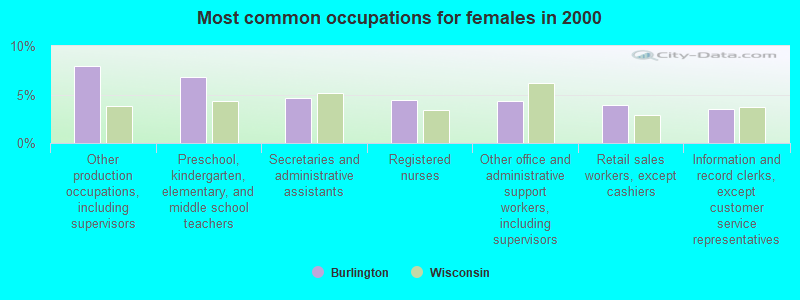


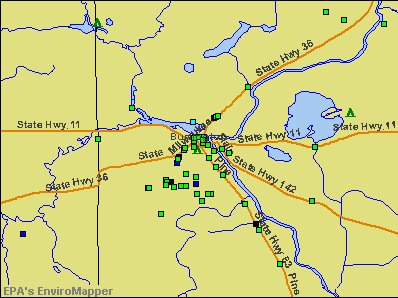

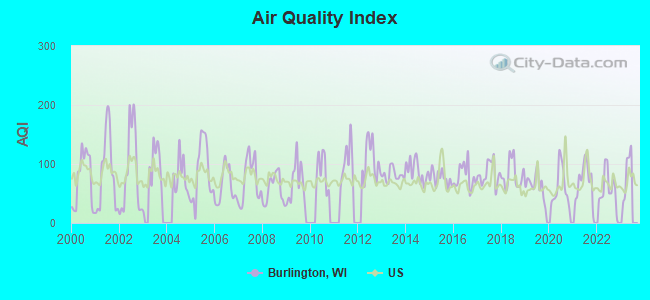
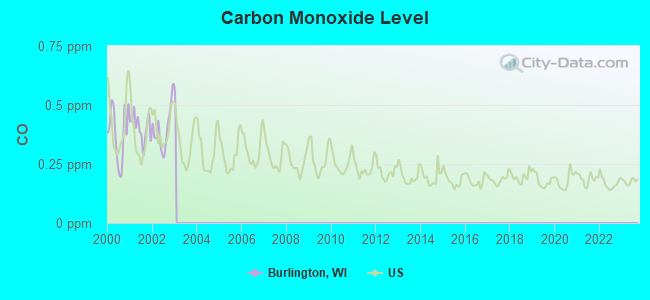
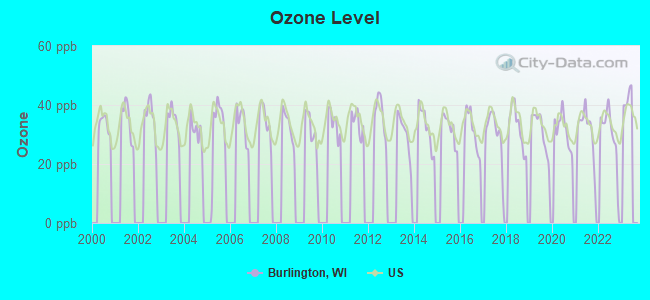
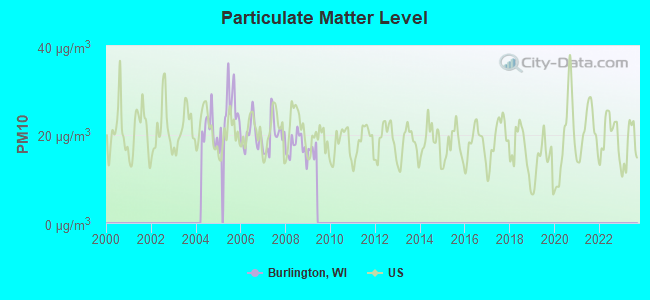
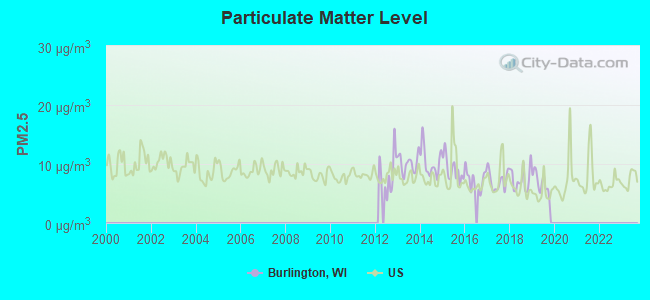
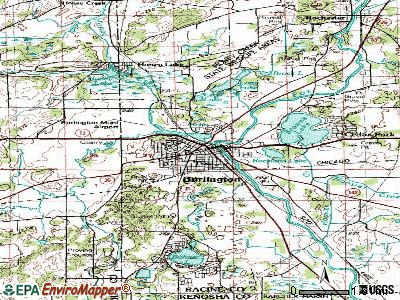

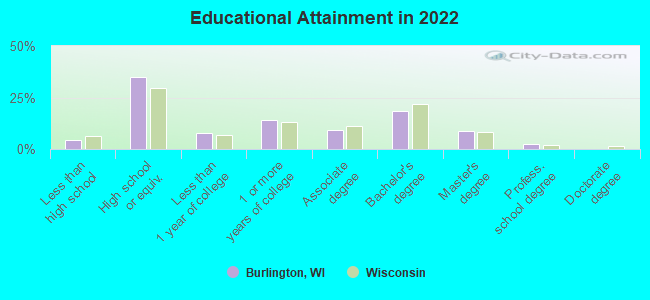
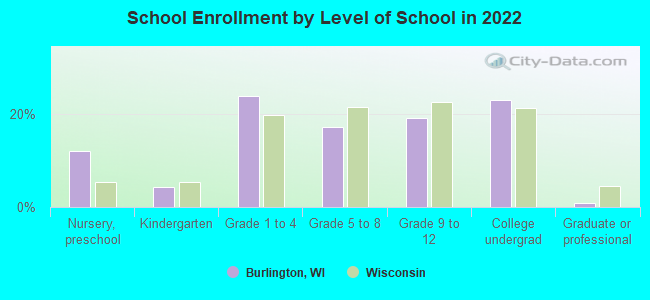
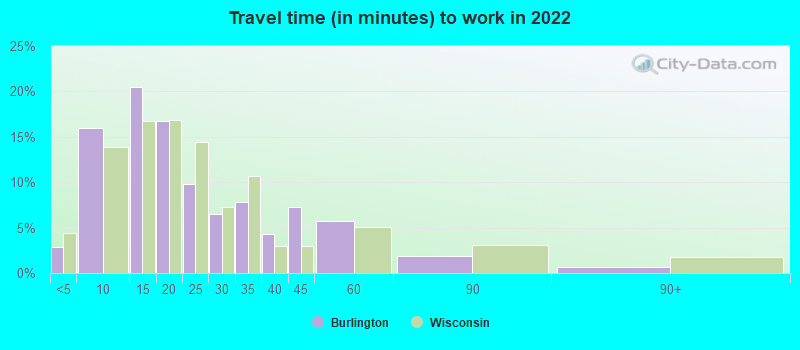
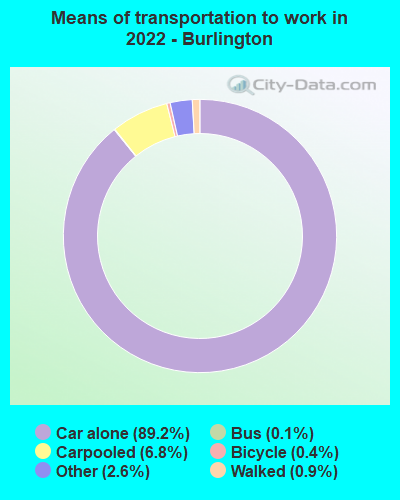
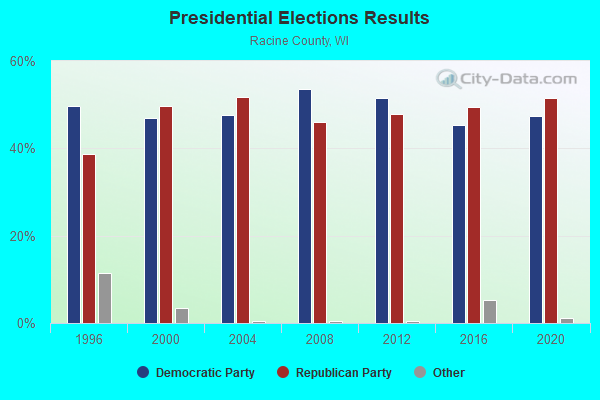
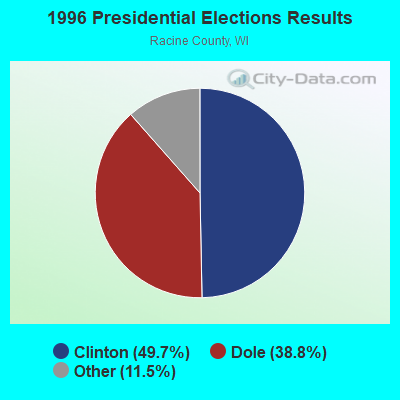
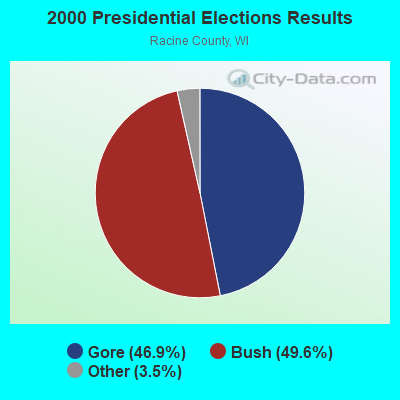
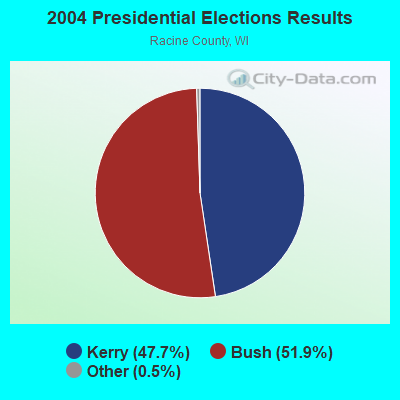
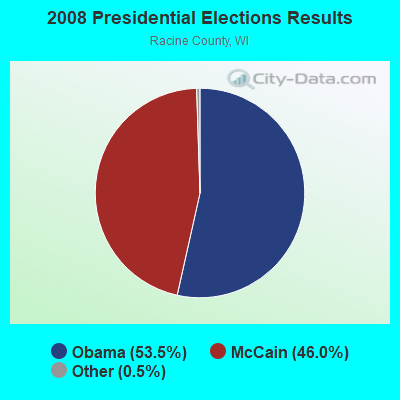
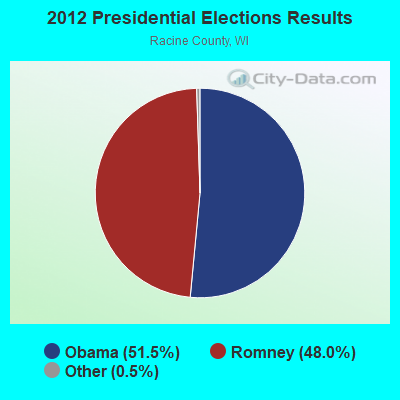
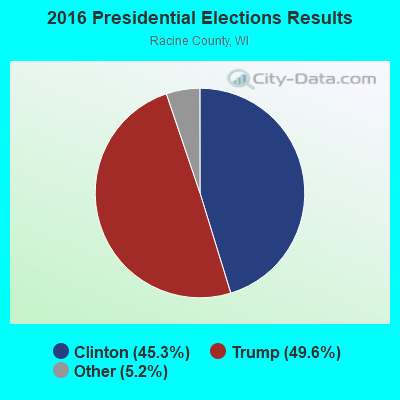
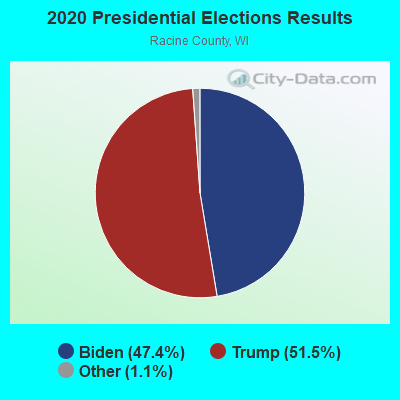
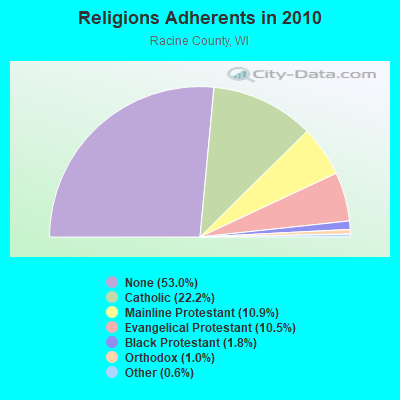
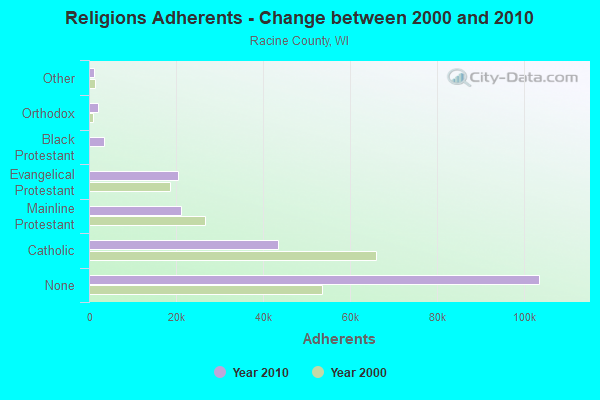
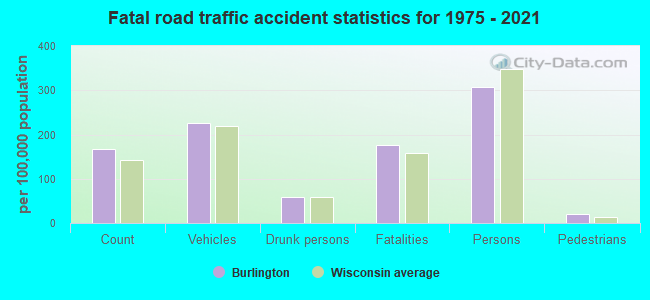
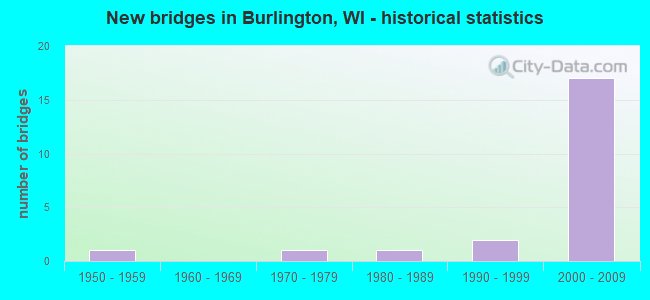
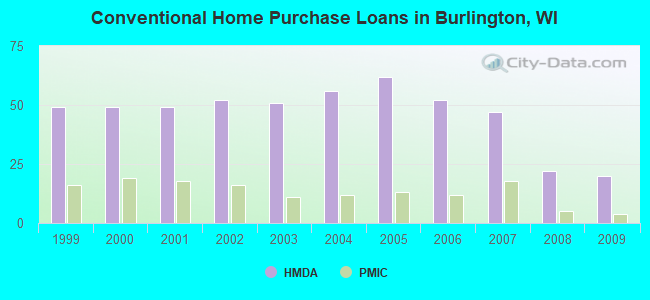
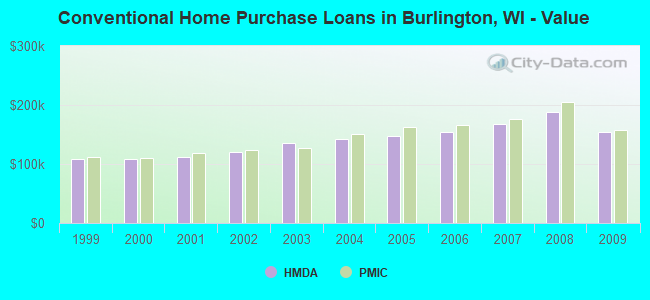
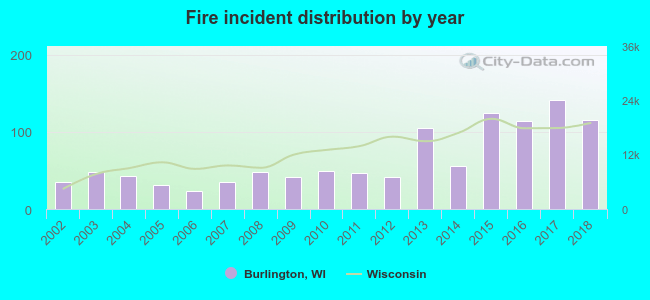 According to the data from the years 2002 - 2018 the average number of fire incidents per year is 65. The highest number of fires - 141 took place in 2017, and the least - 23 in 2006. The data has a rising trend.
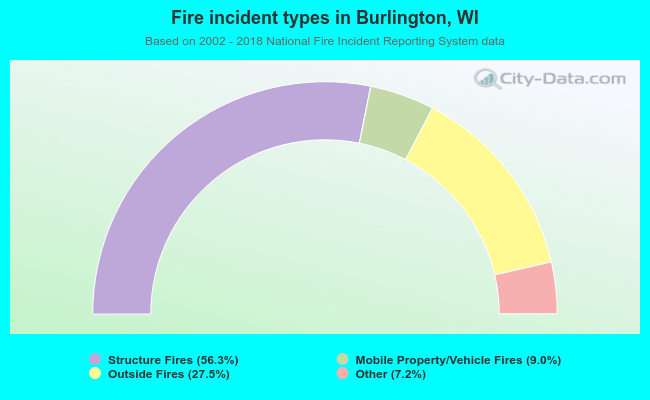 When looking into fire subcategories, the most reports belonged to: Structure Fires (56.3%), and Outside Fires (27.5%).