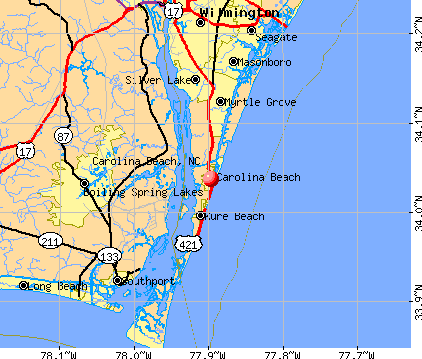
Carolina Beach, North Carolina
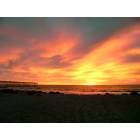
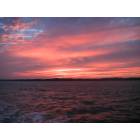
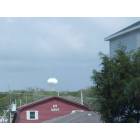
Carolina Beach: Sunrise at Carolina Beach, north end, 10/27/06
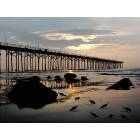
Carolina Beach: Carolina Beach N.C Fishing Pier sunrise
Carolina Beach: Sunrise at Carolina Beach
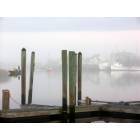
Carolina Beach: Foggy day fishing Cape fear River Pleasure Island,Carolina Beach
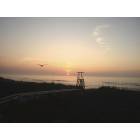
Carolina Beach: Sunset from the Fort Fisher Ferry
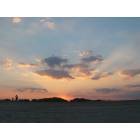
Carolina Beach: Sunset at Fort Fischer
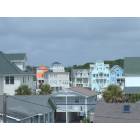
Carolina Beach: Homes
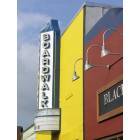
Carolina Beach: Boardwalk at Carolina Beach
Carolina Beach: Water tower
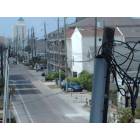
Carolina Beach: Looking toward downtown
- add
your
Submit your own pictures of this town and show them to the world
- OSM Map
- General Map
- Google Map
- MSN Map
Population change since 2000: +44.1%
| Males: 3,268 | |
| Females: 3,504 |
| Median resident age: | 51.2 years |
| North Carolina median age: | 39.2 years |
Zip codes: 28428.
| Carolina Beach: | $90,993 |
| NC: | $67,481 |
Estimated per capita income in 2022: $54,986 (it was $24,128 in 2000)
Carolina Beach town income, earnings, and wages data
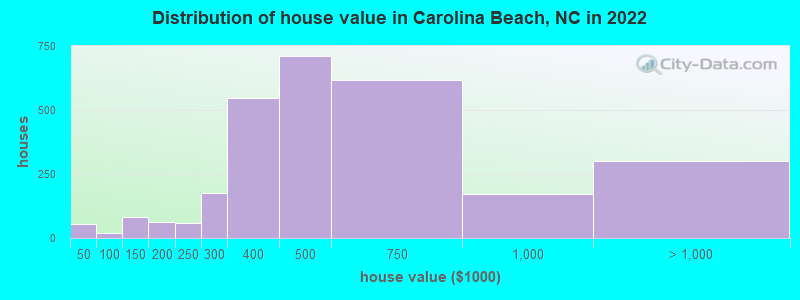
Estimated median house or condo value in 2022: $509,474 (it was $146,900 in 2000)
| Carolina Beach: | $509,474 |
| NC: | $280,600 |
Mean prices in 2022: all housing units: $617,792; detached houses: $718,958; townhouses or other attached units: $604,171; in 2-unit structures: $562,703; in 3-to-4-unit structures: $466,333; in 5-or-more-unit structures: $287,783; mobile homes: $84,702
Median gross rent in 2022: $1,400.
Carolina Beach, NC residents, houses, and apartments details
(8.1% for White Non-Hispanic residents, 13.2% for Hispanic or Latino residents, 50.0% for American Indian residents, 60.0% for other race residents, 1.5% for two or more races residents)
Detailed information about poverty and poor residents in Carolina Beach, NC

Compare current foreclosures near Carolina Beach, NC:
| Photo | Address | Area | Beds / Baths | Price | Details |
|---|---|---|---|---|---|

|
#1
Spencer Farlow Dr
Carolina Beach, NC 28428
|
1,188 sq. feet
|
2 baths 3 beds |
show details | |

|
#2
Fern Creek Ln
Carolina Beach, NC 28428
|
1,697 sq. feet
|
2 baths 3 beds |
show details | |

|
#3
N 8th St
Carolina Beach, NC 28428
|
2,755 sq. feet
|
3 baths 5 beds |
show details | |

|
#4
Virginia Ave
Carolina Beach, NC 28428
|
912 sq. feet
|
2 baths 2 beds |
show details | |

|
#5
Goldsboro Ave
Carolina Beach, NC 28428
|
1,264 sq. feet
|
2 baths 2 beds |
show details | |

|
#6
Searay Ln
Carolina Beach, NC 28428
|
- sq. feet
|
- baths - beds |
show details | |

|
#7
Spot Ln
Carolina Beach, NC 28428
|
- sq. feet
|
- baths - beds |
show details | |

|
#8
Carolina Beach Ave N
Carolina Beach, NC 28428
|
- sq. feet
|
- baths - beds |
show details | |

|
#9
Carolina Beach Ave S # 200
Carolina Beach, NC 28428
|
- sq. feet
|
- baths - beds |
show details | |

|
#10
Snapper Ln
Carolina Beach, NC 28428
|
- sq. feet
|
- baths - beds |
show details |
| Photo | Address | Area | Beds / Baths | Price | Details |
|---|---|---|---|---|---|

|
#11
Worth Dr
Wilmington, NC 28412
|
1,344 sq. feet
|
1 baths 3 beds |
$93,600
|
show details |

|
#12
Goldsboro Ave
Carolina Beach, NC 28428
|
- sq. feet
|
- baths - beds |
show details | |

|
#13
Old Dow Rd # 14
Carolina Beach, NC 28428
|
- sq. feet
|
- baths - beds |
show details | |

|
#14
Church St
Leland, NC 28451
|
2,295 sq. feet
|
2 baths 4 beds |
show details | |

|
#15
N 10th St
Wilmington, NC 28401
|
1,220 sq. feet
|
2 baths 3 beds |
show details | |

|
#16
Reigate Way
Wilmington, NC 28409
|
1,288 sq. feet
|
2 baths 3 beds |
show details | |

|
#17
Godfrey Way
Wilmington, NC 28409
|
2,692 sq. feet
|
3 baths 5 beds |
show details | |

|
#18
Harborside Way
Southport, NC 28461
|
4,688 sq. feet
|
5 baths 4 beds |
show details | |

|
#19
Princess Place Dr
Wilmington, NC 28405
|
1,340 sq. feet
|
1 baths 3 beds |
show details | |

|
#20
Ventura Dr
Wilmington, NC 28412
|
1,050 sq. feet
|
1 baths 3 beds |
show details |
| Photo | Address | Area | Beds / Baths | Price | Details |
|---|---|---|---|---|---|

|
#21
S 10th St
Wilmington, NC 28401
|
1,041 sq. feet
|
1 baths 3 beds |
show details | |

|
#22
Evanston Dr
Leland, NC 28451
|
1,792 sq. feet
|
2 baths 3 beds |
show details | |

|
#23
Cherokee Rd
Southport, NC 28461
|
1,377 sq. feet
|
2 baths 3 beds |
show details | |

|
#24
Wood Sorrell Rd
Wilmington, NC 28405
|
1,024 sq. feet
|
2 baths 2 beds |
show details | |

|
#25
Bradshaw Ter
Wilmington, NC 28412
|
3,429 sq. feet
|
3 baths 3 beds |
show details | |

|
#26
Carolina Beach Rd
Wilmington, NC 28412
|
1,340 sq. feet
|
1 baths 2 beds |
show details | |

|
#27
Burton Rd
Southport, NC 28461
|
1,359 sq. feet
|
2 baths 3 beds |
show details | |

|
#28
Huron Dr
Wilmington, NC 28412
|
1,940 sq. feet
|
3 baths 3 beds |
show details | |

|
#29
Myrtle Grove Rd
Wilmington, NC 28409
|
2,928 sq. feet
|
3 baths 3 beds |
show details | |

|
#30
Huron Dr
Wilmington, NC 28412
|
3,218 sq. feet
|
3 baths 4 beds |
show details |
| Photo | Address | Area | Beds / Baths | Price | Details |
|---|---|---|---|---|---|

|
#31
Coniston Dr
Leland, NC 28451
|
2,953 sq. feet
|
4 baths 4 beds |
show details | |

|
#32
Rl Honeycutt Dr
Wilmington, NC 28412
|
2,306 sq. feet
|
3 baths 3 beds |
show details | |

|
#33
N Kerr Ave
Wilmington, NC 28405
|
2,068 sq. feet
|
3 baths 4 beds |
show details | |

|
#34
Night Harbor Dr SE
Leland, NC 28451
|
1,312 sq. feet
|
2 baths 3 beds |
show details | |

|
#35
E Leonard St
Southport, NC 28461
|
2,490 sq. feet
|
3 baths 3 beds |
show details | |

|
#36
Elder Dr
Wilmington, NC 28405
|
1,456 sq. feet
|
2 baths 3 beds |
show details | |

|
#37
Elder Dr
Wilmington, NC 28405
|
1,582 sq. feet
|
2 baths 3 beds |
show details | |

|
#38
Dunlop Dr NE
Leland, NC 28451
|
1,525 sq. feet
|
2 baths 3 beds |
show details | |

|
#39
Tidalwalk Dr
Wilmington, NC 28409
|
4,282 sq. feet
|
4 baths 5 beds |
show details | |

|
#40
Aloft Way
Wilmington, NC 28411
|
3,447 sq. feet
|
4 baths 4 beds |
show details |
| Photo | Address | Area | Beds / Baths | Price | Details |
|---|---|---|---|---|---|

|
#41
Cannon Rd
Wilmington, NC 28411
|
1,356 sq. feet
|
2 baths 3 beds |
show details | |

|
#42
Burton Trl SE
Leland, NC 28451
|
1,529 sq. feet
|
2 baths 3 beds |
show details | |

|
#43
S 9th St
Wilmington, NC 28401
|
924 sq. feet
|
1 baths 3 beds |
show details | |

|
#44
Clay St
Wilmington, NC 28405
|
920 sq. feet
|
2 baths 3 beds |
show details | |

|
#45
Hanna Dr
Wilmington, NC 28412
|
1,632 sq. feet
|
2 baths 3 beds |
show details | |

|
#46
Camway Dr
Wilmington, NC 28403
|
1,565 sq. feet
|
2 baths 3 beds |
show details | |

|
#47
Glasgow Ave
Wilmington, NC 28403
|
850 sq. feet
|
1 baths 2 beds |
show details | |

|
#48
Greenville Ave
Wilmington, NC 28403
|
1,596 sq. feet
|
2 baths 4 beds |
show details | |

|
#49
Seabrook Ct
Wilmington, NC 28403
|
1,488 sq. feet
|
2 baths 3 beds |
show details | |

|
Check over 1 million property listings on Foreclosure.com!
|
browse all offers | |||


- 6,16891.0%White alone
- 3885.7%Hispanic
- 1281.9%Two or more races
- 350.5%Other race alone
- 230.3%American Indian alone
- 220.3%Asian alone
- 90.1%Native Hawaiian and Other
Pacific Islander alone
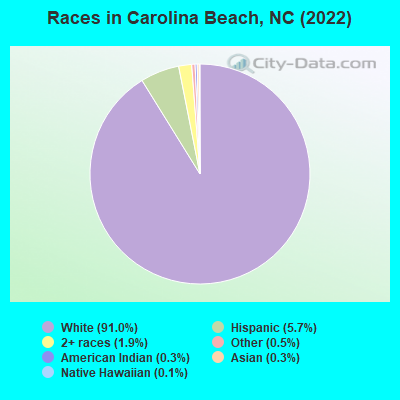
Races in Carolina Beach detailed stats: ancestries, foreign born residents, place of birth
According to our research of North Carolina and other state lists, there were 3 registered sex offenders living in Carolina Beach, North Carolina as of June 16, 2024.
The ratio of all residents to sex offenders in Carolina Beach is 2,058 to 1.
The ratio of registered sex offenders to all residents in this city is much lower than the state average.
Type |
2009 |
2010 |
2011 |
2012 |
2013 |
2014 |
2015 |
2016 |
2017 |
2018 |
2019 |
2020 |
2021 |
2022 |
|---|---|---|---|---|---|---|---|---|---|---|---|---|---|---|
| Murders (per 100,000) | 0 (0.0) | 2 (35.1) | 0 (0.0) | 0 (0.0) | 0 (0.0) | 12 (198.2) | 0 (0.0) | 0 (0.0) | 0 (0.0) | 0 (0.0) | 0 (0.0) | 0 (0.0) | 0 (0.0) | 0 (0.0) |
| Rapes (per 100,000) | 0 (0.0) | 5 (87.6) | 0 (0.0) | 2 (34.1) | 1 (16.8) | 0 (0.0) | 0 (0.0) | 3 (48.2) | 3 (47.6) | 3 (47.2) | 4 (62.1) | 7 (108.0) | 4 (62.1) | 7 (105.2) |
| Robberies (per 100,000) | 4 (67.2) | 4 (70.1) | 8 (138.5) | 5 (85.2) | 0 (0.0) | 1 (16.5) | 4 (65.3) | 6 (96.4) | 4 (63.5) | 3 (47.2) | 2 (31.1) | 2 (30.9) | 2 (31.1) | 0 (0.0) |
| Assaults (per 100,000) | 18 (302.3) | 11 (192.8) | 10 (173.1) | 18 (306.8) | 10 (168.4) | 13 (214.8) | 18 (293.9) | 14 (225.0) | 8 (127.1) | 15 (236.1) | 24 (372.8) | 21 (324.1) | 19 (295.2) | 24 (360.8) |
| Burglaries (per 100,000) | 70 (1,175) | 51 (893.8) | 60 (1,038) | 89 (1,517) | 67 (1,129) | 47 (776.5) | 68 (1,110) | 65 (1,045) | 46 (730.6) | 23 (362.1) | 27 (419.5) | 35 (540.2) | 23 (357.3) | 37 (556.2) |
| Thefts (per 100,000) | 289 (4,853) | 245 (4,294) | 209 (3,617) | 197 (3,358) | 181 (3,049) | 199 (3,288) | 145 (2,368) | 87 (1,398) | 92 (1,461) | 112 (1,763) | 153 (2,377) | 139 (2,145) | 96 (1,491) | 107 (1,609) |
| Auto thefts (per 100,000) | 15 (251.9) | 13 (227.8) | 8 (138.5) | 22 (375.0) | 8 (134.7) | 12 (198.2) | 10 (163.3) | 5 (80.3) | 7 (111.2) | 9 (141.7) | 7 (108.7) | 12 (185.2) | 12 (186.4) | 4 (60.1) |
| Arson (per 100,000) | 1 (16.8) | 0 (0.0) | 0 (0.0) | 2 (34.1) | 0 (0.0) | 1 (16.5) | 0 (0.0) | 1 (16.1) | 1 (15.9) | 3 (47.2) | 0 (0.0) | 1 (15.4) | 0 (0.0) | 1 (15.0) |
| City-Data.com crime index | 377.2 | 452.3 | 304.6 | 384.7 | 258.9 | 646.1 | 263.9 | 248.0 | 201.1 | 206.4 | 266.7 | 299.0 | 217.6 | 264.4 |
The City-Data.com crime index weighs serious crimes and violent crimes more heavily. Higher means more crime, U.S. average is 246.1. It adjusts for the number of visitors and daily workers commuting into cities.
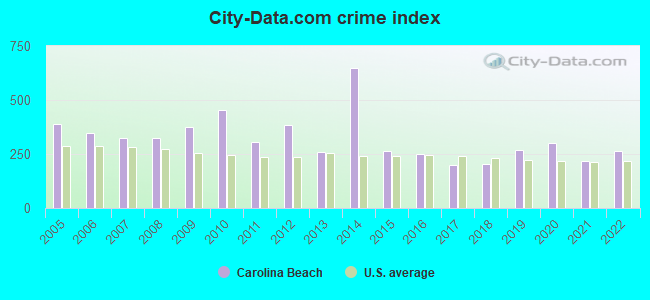
Crime rate in Carolina Beach detailed stats: murders, rapes, robberies, assaults, burglaries, thefts, arson
Full-time law enforcement employees in 2021, including police officers: 27 (25 officers - 22 male; 3 female).
| Officers per 1,000 residents here: | 3.88 |
| North Carolina average: | 2.27 |
 Recent articles from our blog. Our writers, many of them Ph.D. graduates or candidates, create easy-to-read articles on a wide variety of topics.

 | Re locating to NC (16 replies) |
| Federal Point Shopping Center, Carolina Beach, North Carolina (17 replies) |
| Kayaking Tour Carolina Beach area (1 reply) |
| Wrightsville Beach COVID response disaster (how limited access makes the siuation MORE DANGEROUS) (58 replies) |
| Lost dog in Wilmington near Carolina Beach (4 replies) |
| Pros and Cons of Carolina Beach (9 replies) |
Latest news from Carolina Beach, NC collected exclusively by city-data.com from local newspapers, TV, and radio stations
Ancestries: English (26.5%), American (10.1%), German (9.5%), Irish (8.9%), European (6.8%), Polish (3.2%).
Current Local Time: EST time zone
Elevation: 5 feet
Land area: 2.25 square miles.
Population density: 3,006 people per square mile (average).
310 residents are foreign born (2.1% Europe, 1.2% Latin America, 0.7% North America).
| This town: | 4.6% |
| North Carolina: | 8.3% |
Median real estate property taxes paid for housing units with mortgages in 2022: $2,578 (0.5%)
Median real estate property taxes paid for housing units with no mortgage in 2022: $2,653 (0.6%)
Nearest city with pop. 50,000+: Wilmington, NC  (12.9 miles , pop. 75,838).
Nearest city with pop. 200,000+: Raleigh, NC (130.3 miles , pop. 276,093).
Nearest city with pop. 1,000,000+: Philadelphia, PA (439.4 miles , pop. 1,517,550).
Nearest cities:
), ), ), ), )Latitude: 34.04 N, Longitude: 77.90 W
Daytime population change due to commuting: -837 (-12.3%)
Workers who live and work in this town: 1,252 (35.8%)
Area code: 910

Carolina Beach tourist attractions:
Single-family new house construction building permits:
- 2022: 120 buildings, average cost: $418,800
- 2021: 69 buildings, average cost: $383,100
- 2020: 58 buildings, average cost: $315,200
- 2019: 50 buildings, average cost: $316,500
- 2018: 71 buildings, average cost: $321,300
- 2017: 119 buildings, average cost: $214,300
- 2016: 47 buildings, average cost: $247,300
- 2015: 67 buildings, average cost: $245,000
- 2014: 78 buildings, average cost: $222,500
- 2013: 78 buildings, average cost: $216,200
- 2012: 69 buildings, average cost: $206,100
- 2011: 32 buildings, average cost: $198,300
- 2010: 22 buildings, average cost: $215,800
- 2009: 22 buildings, average cost: $192,500
- 2008: 20 buildings, average cost: $256,600
- 2007: 24 buildings, average cost: $231,300
- 2006: 79 buildings, average cost: $217,300
- 2005: 52 buildings, average cost: $261,600
- 2004: 123 buildings, average cost: $149,100
- 2003: 26 buildings, average cost: $143,100
| Here: | 3.0% |
| North Carolina: | 3.2% |
Population change in the 1990s: +676 (+16.8%).
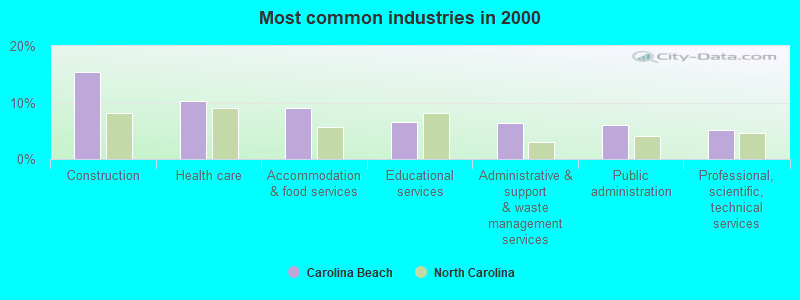
- Construction (15.4%)
- Health care (10.3%)
- Accommodation & food services (9.0%)
- Educational services (6.6%)
- Administrative & support & waste management services (6.3%)
- Public administration (5.9%)
- Professional, scientific, technical services (5.2%)
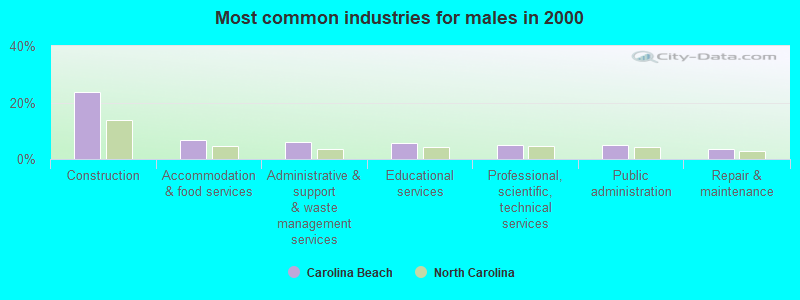
- Construction (23.6%)
- Accommodation & food services (6.8%)
- Administrative & support & waste management services (6.1%)
- Educational services (5.8%)
- Professional, scientific, technical services (5.1%)
- Public administration (4.8%)
- Repair & maintenance (3.4%)
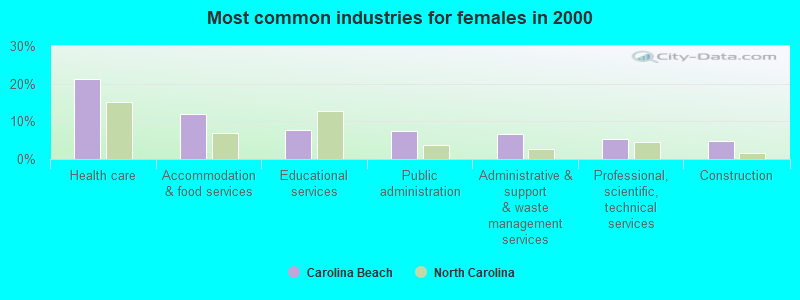
- Health care (21.4%)
- Accommodation & food services (12.0%)
- Educational services (7.7%)
- Public administration (7.4%)
- Administrative & support & waste management services (6.6%)
- Professional, scientific, technical services (5.4%)
- Construction (4.8%)
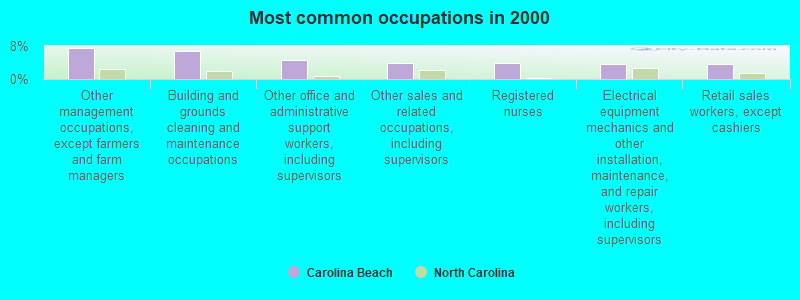
- Other management occupations, except farmers and farm managers (7.6%)
- Building and grounds cleaning and maintenance occupations (6.9%)
- Other office and administrative support workers, including supervisors (4.5%)
- Other sales and related occupations, including supervisors (4.0%)
- Registered nurses (3.9%)
- Electrical equipment mechanics and other installation, maintenance, and repair workers, including supervisors (3.5%)
- Retail sales workers, except cashiers (3.5%)
- Other management occupations, except farmers and farm managers (10.6%)
- Building and grounds cleaning and maintenance occupations (7.2%)
- Electrical equipment mechanics and other installation, maintenance, and repair workers, including supervisors (6.2%)
- Other sales and related occupations, including supervisors (4.9%)
- Retail sales workers, except cashiers (4.2%)
- Sales representatives, services, wholesale and manufacturing (3.4%)
- Carpenters (3.1%)
- Registered nurses (9.0%)
- Other office and administrative support workers, including supervisors (8.9%)
- Building and grounds cleaning and maintenance occupations (6.4%)
- Secretaries and administrative assistants (5.6%)
- Waiters and waitresses (4.3%)
- Other management occupations, except farmers and farm managers (3.7%)
- Accountants and auditors (3.6%)
Average climate in Carolina Beach, North Carolina
Based on data reported by over 4,000 weather stations


|
|


(lower is better)
Air Quality Index (AQI) level in 2023 was 71.2. This is about average.
| City: | 71.2 |
| U.S.: | 72.6 |
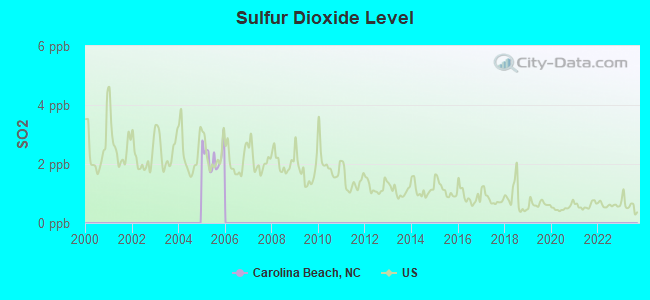
Sulfur Dioxide (SO2) [ppb] level in 2005 was 2.27. This is significantly worse than average. Closest monitor was 14.4 miles away from the city center.
| City: | 2.27 |
| U.S.: | 1.51 |
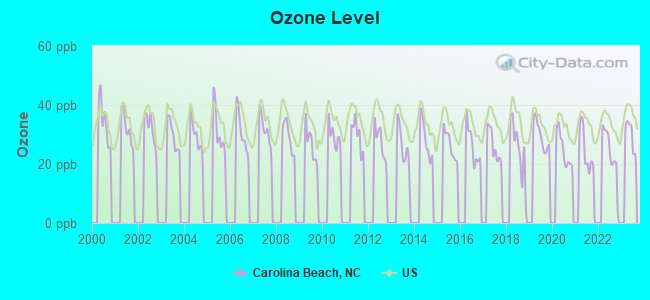
Ozone [ppb] level in 2022 was 23.5. This is significantly better than average. Closest monitor was 22.9 miles away from the city center.
| City: | 23.5 |
| U.S.: | 33.3 |
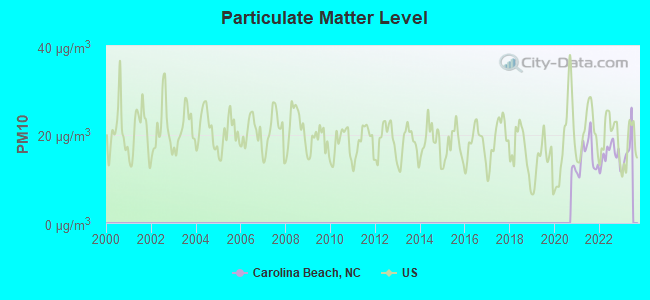
Particulate Matter (PM10) [µg/m3] level in 2022 was 15.4. This is better than average. Closest monitor was 12.7 miles away from the city center.
| City: | 15.4 |
| U.S.: | 19.2 |
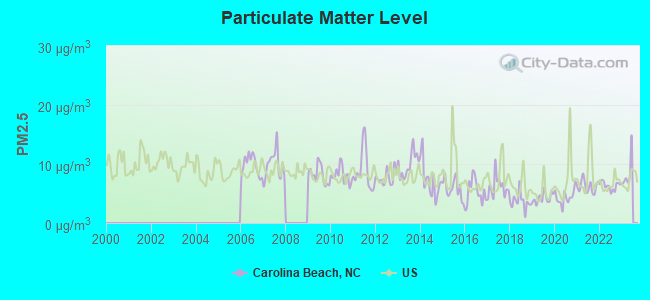
Particulate Matter (PM2.5) [µg/m3] level in 2022 was 6.30. This is better than average. Closest monitor was 13.9 miles away from the city center.
| City: | 6.30 |
| U.S.: | 8.11 |
Tornado activity:
Carolina Beach-area historical tornado activity is below North Carolina state average. It is 47% smaller than the overall U.S. average.
On 11/16/2006, a category F3 (max. wind speeds 158-206 mph) tornado 28.7 miles away from the Carolina Beach town center killed 8 people and injured 20 people and caused $1 million in damages.
On 10/9/1950, a category F3 tornado 41.3 miles away from the town center injured 3 people and caused between $50,000 and $500,000 in damages.
Earthquake activity:
Carolina Beach-area historical earthquake activity is significantly above North Carolina state average. It is 64% smaller than the overall U.S. average.On 8/23/2011 at 17:51:04, a magnitude 5.8 (5.8 MW, Depth: 3.7 mi, Class: Moderate, Intensity: VI - VII) earthquake occurred 267.9 miles away from Carolina Beach center
On 11/22/1974 at 05:25:55, a magnitude 4.7 (4.7 MB, Class: Light, Intensity: IV - V) earthquake occurred 151.7 miles away from Carolina Beach center
On 8/9/2020 at 12:07:37, a magnitude 5.1 (5.1 MW, Depth: 4.7 mi) earthquake occurred 247.0 miles away from Carolina Beach center
On 8/21/1992 at 16:31:55, a magnitude 4.4 (4.1 MB, 4.1 LG, 4.4 LG, Depth: 6.2 mi) earthquake occurred 145.0 miles away from the city center
On 8/2/1974 at 08:52:09, a magnitude 4.9 (4.3 MB, 4.9 LG) earthquake occurred 263.6 miles away from the city center
On 8/6/1994 at 19:54:09, a magnitude 3.8 (3.6 LG, 3.8 LG, Depth: 3.1 mi, Class: Light, Intensity: II - III) earthquake occurred 96.6 miles away from Carolina Beach center
Magnitude types: regional Lg-wave magnitude (LG), body-wave magnitude (MB), moment magnitude (MW)
Natural disasters:
The number of natural disasters in New Hanover County (23) is greater than the US average (15).Major Disasters (Presidential) Declared: 11
Emergencies Declared: 8
Causes of natural disasters: Hurricanes: 19, Tropical Storms: 2, Flood: 1, Snowfall: 1, Storm: 1, Wind: 1, Winter Storm: 1, Other: 1 (Note: some incidents may be assigned to more than one category).

Hospitals and medical centers near Carolina Beach:
- WELL CARE HOME HEALTH (Home Health Center, about 5 miles away; WILMINGTON, NC)
- MYRTLE GROVE GROUP HOME (Hospital, about 6 miles away; WILMINGTON, NC)
- LIFE, INC CHEROKEE TRAIL GROUP HOME (Hospital, about 9 miles away; WILMINGTON, NC)
- SOUTHPORT DIALYSIS CENTER (Dialysis Facility, about 11 miles away; SOUTHPORT, NC)
- OCEAN TRAIL CONVALESCENT CENTER (Nursing Home, about 11 miles away; SOUTHPORT, NC)
- OCEAN TRAIL HEALTHCARE AND REHAB CENTER (Nursing Home, about 11 miles away; SOUTHPORT, NC)
- J ARTHUR DOSHER MEM HOSP (Nursing Home, about 11 miles away; SOUTHPORT, NC)
Airports located in Carolina Beach:
- Pilots Ridge Airport (03NC) (Runways: 1, Itinerant Ops: 240, Local Ops: 2,400, Military Ops: 10)
Operable nuclear power plants near Carolina Beach:
- 11 miles: Brunswick 1 and 2 in Southport, NC.
Colleges/universities with over 2000 students nearest to Carolina Beach:
- University of North Carolina Wilmington (about 14 miles; Wilmington, NC; Full-time enrollment: 13,112)
- Miller-Motte College-Wilmington (about 14 miles; Wilmington, NC; FT enrollment: 2,395)
- Cape Fear Community College (about 15 miles; Wilmington, NC; FT enrollment: 8,372)
- Coastal Carolina Community College (about 59 miles; Jacksonville, NC; FT enrollment: 4,502)
- Horry-Georgetown Technical College (about 66 miles; Conway, SC; FT enrollment: 5,772)
- Coastal Carolina University (about 67 miles; Conway, SC; FT enrollment: 8,881)
- Robeson Community College (about 76 miles; Lumberton, NC; FT enrollment: 2,322)
Public elementary/middle school in Carolina Beach:
- CAROLINA BEACH ELEMENTARY (Location: 400 SOUTH 4TH ST, Grades: KG-5)
Points of interest:
Notable locations in Carolina Beach: Carolina Beach Police Department (A), Kure Beach Police Department (B), Carolina Beach Police Department (C). Display/hide their locations on the map
Reservoir: Carolina Lake (A). Display/hide its location on the map
Tourist attractions: Federal Point History Center (Museums; 1121 North Lake Park Boulevard), Island Trader (Tours & Charters; 1337 Bridge Barrier Road), Kayak Carolina (Tours & Charters; 1337 Bridge Barrier Road).
Hotels: Courtyard Marriott (100 Charlotte Avenue), Cole's Motel and Apartments (213 Raleigh Avenue), Beacon House Inn B & B (715 1/2 Carolina Beach Avenue North), Dolphin Lane Motel (318 Carolina Beach Avenue North), Cabana de Mar (31 North Carolina Avenue), Benson's Landing (801 Carolina Beach Avenue North), Beach House Inn & Suites (412 Carolina Beach Avenue North), Atlantic Towers Condominium Oceanfront Reservatins (1615 South Lake Park Boulevard), Dry Dock Motel (300 South Lake Park Boulevard).
Drinking water stations with addresses in Carolina Beach and their reported violations in the past:
CAROLINA BEACH WATER SYSTEM (Address: C/O TOWN OF CAROLINA BEACH , Population served: 12,567, Groundwater):Past health violations:WATERWAY CAMPSITES (Population served: 50, Groundwater):Past monitoring violations:
- MCL, Average - Between OCT-2011 and DEC-2011, Contaminant: TTHM. Follow-up actions: St AO (w/o penalty) issued (OCT-17-2011), St Public Notif received (FEB-29-2012), St Compliance achieved (MAR-31-2012), St Public Notif requested (MAY-09-2012), St Formal NOV issued (MAY-09-2012), St Compliance achieved (DEC-31-2012)
- MCL, Average - Between JUL-2011 and SEP-2011, Contaminant: TTHM. Follow-up actions: St AO (w/o penalty) issued (OCT-17-2011), St Public Notif requested (DEC-15-2011), St Formal NOV issued (DEC-15-2011), St Public Notif received (DEC-15-2011), St Compliance achieved (2 times from MAR-31-2012 to DEC-31-2012)
- MCL, Average - Between APR-2011 and JUN-2011, Contaminant: TTHM. Follow-up actions: St Public Notif requested (OCT-17-2011), St Formal NOV issued (OCT-17-2011), St AO (w/o penalty) issued (OCT-17-2011), St Public Notif received (NOV-15-2011), St Compliance achieved (2 times from MAR-31-2012 to DEC-31-2012)
- Monitoring, Routine (IDSE) - In APR-02-2008, Contaminant: DBP STAGE 2. Follow-up actions: St Compliance achieved (DEC-31-2008)
- Follow-up Or Routine LCR Tap M/R - In OCT-01-2006, Contaminant: Lead and Copper Rule. Follow-up actions: St Public Notif requested (JAN-18-2007), St Formal NOV issued (JAN-18-2007), St Compliance achieved (SEP-21-2009)
Past monitoring violations:
- One routine major monitoring violation
| This town: | 2.1 people |
| North Carolina: | 2.5 people |
| This town: | 55.3% |
| Whole state: | 66.7% |
| This town: | 10.0% |
| Whole state: | 5.9% |
Likely homosexual households (counted as self-reported same-sex unmarried-partner households)
- Lesbian couples: 0.7% of all households
- Gay men: 0.8% of all households
Banks with branches in Carolina Beach (2011 data):
- Bank of America, National Association: Carolina Beach Branch at 123 Harper Avenue, branch established on 1961/07/24. Info updated 2009/11/18: Bank assets: $1,451,969.3 mil, Deposits: $1,077,176.8 mil, headquarters in Charlotte, NC, positive income, 5782 total offices, Holding Company: Bank Of America Corporation
- Branch Banking and Trust Company: Carolina Beach Branch at 7 North Lake Park Boulevard, branch established on 1912/01/01. Info updated 2010/03/29: Bank assets: $168,867.6 mil, Deposits: $127,549.5 mil, headquarters in Winston Salem, NC, positive income, Commercial Lending Specialization, 1793 total offices, Holding Company: Bb&T Corporation
- First-Citizens Bank & Trust Company: Carolina Beach Branch at 612 Lake Park Boulevard, branch established on 1983/07/11. Info updated 2011/10/11: Bank assets: $20,566.4 mil, Deposits: $17,596.8 mil, headquarters in Raleigh, NC, positive income, Commercial Lending Specialization, 433 total offices, Holding Company: First Citizens Bancshares, Inc.
For population 15 years and over in Carolina Beach:
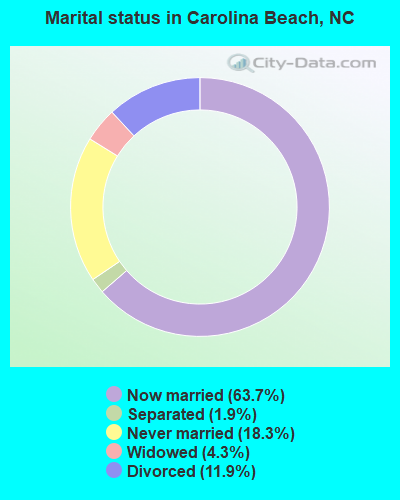
- Never married: 18.3%
- Now married: 63.7%
- Separated: 1.9%
- Widowed: 4.3%
- Divorced: 11.9%
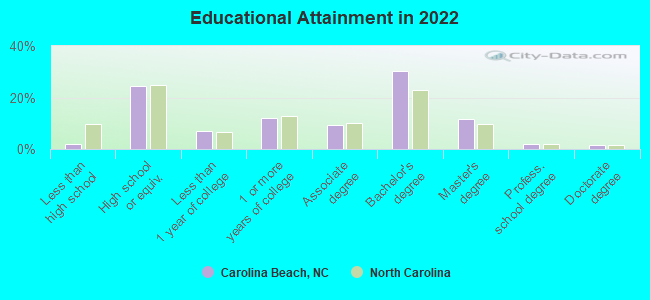
For population 25 years and over in Carolina Beach:
- High school or higher: 98.1%
- Bachelor's degree or higher: 44.6%
- Graduate or professional degree: 15.2%
- Unemployed: 3.1%
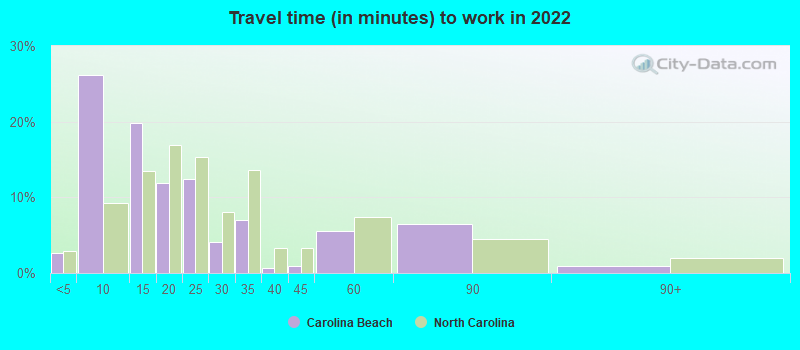
- Mean travel time to work (commute): 21.7 minutes
| Here: | 9.5 |
| North Carolina average: | 11.7 |
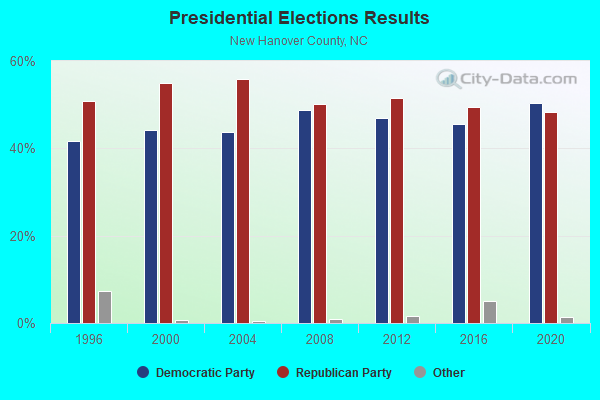
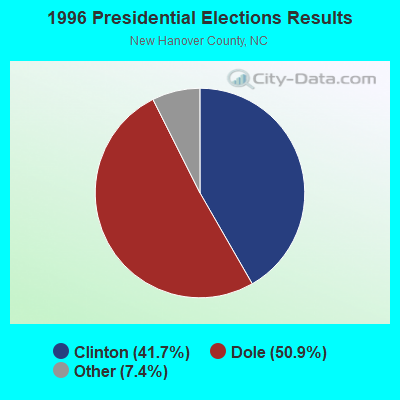
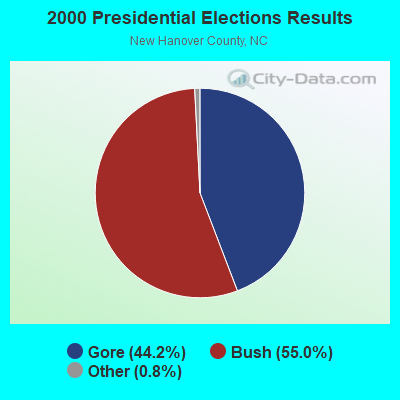
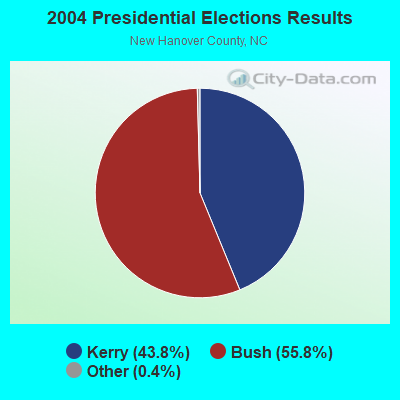
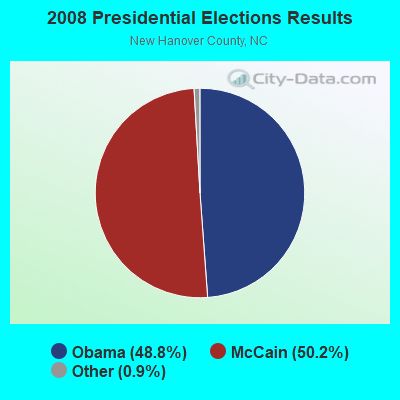
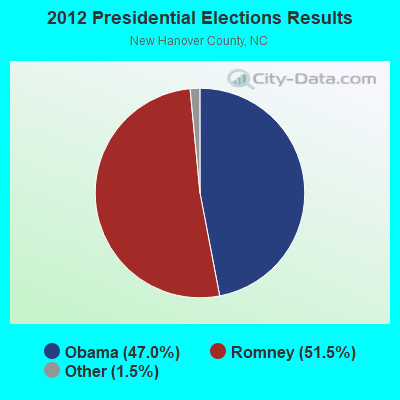
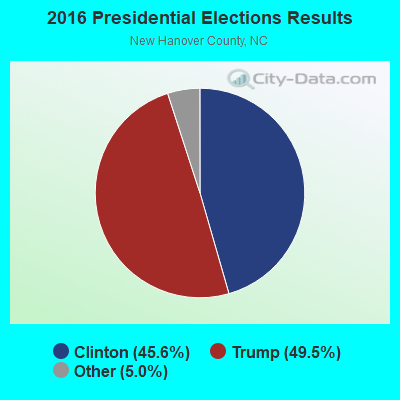
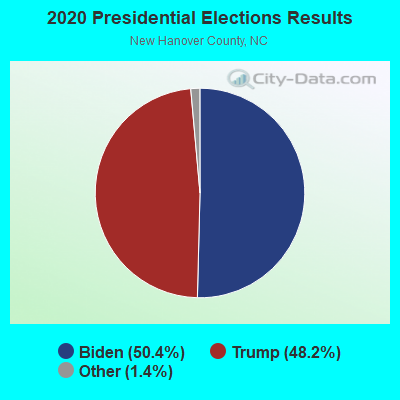
Graphs represent county-level data. Detailed 2008 Election Results
Political contributions by individuals in Carolina Beach, NC
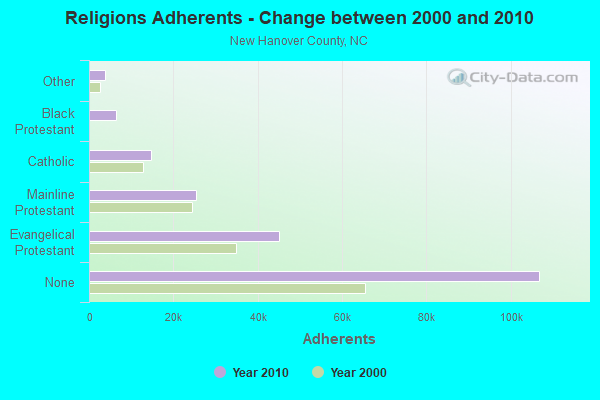
Religion statistics for Carolina Beach, NC (based on New Hanover County data)
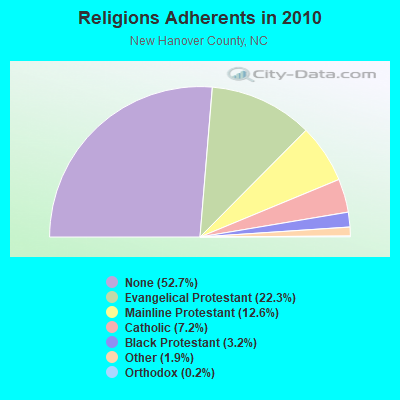
| Religion | Adherents | Congregations |
|---|---|---|
| Evangelical Protestant | 45,162 | 124 |
| Mainline Protestant | 25,476 | 43 |
| Catholic | 14,671 | 5 |
| Black Protestant | 6,408 | 34 |
| Other | 3,777 | 17 |
| Orthodox | 375 | 2 |
| None | 106,798 | - |
Food Environment Statistics:
| This county: | 2.31 / 10,000 pop. |
| North Carolina: | 2.05 / 10,000 pop. |
| New Hanover County: | 0.21 / 10,000 pop. |
| State: | 0.14 / 10,000 pop. |
| New Hanover County: | 0.68 / 10,000 pop. |
| North Carolina: | 0.92 / 10,000 pop. |
| This county: | 4.00 / 10,000 pop. |
| North Carolina: | 4.75 / 10,000 pop. |
| This county: | 13.78 / 10,000 pop. |
| State: | 7.57 / 10,000 pop. |
| New Hanover County: | 9.3% |
| North Carolina: | 9.8% |
| New Hanover County: | 23.8% |
| North Carolina: | 28.3% |
| New Hanover County: | 15.7% |
| State: | 15.6% |
Health and Nutrition:
| Here: | 60.0% |
| North Carolina: | 48.9% |
| This city: | 62.3% |
| North Carolina: | 46.1% |
| This city: | 27.2 |
| North Carolina: | 28.8 |
| Carolina Beach: | 17.2% |
| North Carolina: | 20.7% |
| Carolina Beach: | 5.4% |
| State: | 10.7% |
| Carolina Beach: | 7.1 |
| North Carolina: | 6.8 |
| Carolina Beach: | 32.2% |
| North Carolina: | 33.7% |
| Here: | 66.3% |
| State: | 55.8% |
| This city: | 82.4% |
| North Carolina: | 79.7% |
More about Health and Nutrition of Carolina Beach, NC Residents
| Local government employment and payroll (March 2022) | |||||
| Function | Full-time employees | Monthly full-time payroll | Average yearly full-time wage | Part-time employees | Monthly part-time payroll |
|---|---|---|---|---|---|
| Police Protection - Officers | 25 | $135,659 | $65,116 | 3 | $3,586 |
| Other Government Administration | 17 | $105,434 | $74,424 | 7 | $8,697 |
| Firefighters | 14 | $72,885 | $62,473 | 14 | $5,716 |
| Streets and Highways | 12 | $48,971 | $48,971 | 0 | $0 |
| Solid Waste Management | 10 | $43,119 | $51,743 | 0 | $0 |
| Natural Resources | 7 | $30,933 | $53,028 | 0 | $0 |
| Parks and Recreation | 7 | $34,115 | $58,483 | 3 | $3,443 |
| Financial Administration | 6 | $28,951 | $57,902 | 0 | $0 |
| Sewerage | 5 | $23,594 | $56,626 | 0 | $0 |
| Police - Other | 2 | $8,837 | $53,022 | 3 | $6,190 |
| Water Supply | 2 | $8,718 | $52,308 | 0 | $0 |
| Fire - Other | 1 | $4,747 | $56,964 | 0 | $0 |
| Totals for Government | 108 | $545,962 | $60,662 | 30 | $27,632 |
Carolina Beach government finances - Expenditure in 2021 (per resident):
- Current Operations - Sewerage: $3,272,000 ($483.17)
Police Protection: $2,951,000 ($435.76)
Solid Waste Management: $2,928,000 ($432.37)
Central Staff Services: $2,522,000 ($372.42)
Water Utilities: $1,444,000 ($213.23)
Local Fire Protection: $1,427,000 ($210.72)
Parks and Recreation: $910,000 ($134.38)
General - Other: $702,000 ($103.66)
Housing and Community Development: $590,000 ($87.12)
Financial Administration: $376,000 ($55.52)
Parking Facilities: $327,000 ($48.29)
Judicial and Legal Services: $210,000 ($31.01)
Transit Utilities: $164,000 ($24.22)
Regular Highways: $142,000 ($20.97)
- General - Interest on Debt: $643,000 ($94.95)
- Other Capital Outlay - General - Other: $230,000 ($33.96)
Solid Waste Management: $153,000 ($22.59)
Parking Facilities: $50,000 ($7.38)
Police Protection: $48,000 ($7.09)
Parks and Recreation: $47,000 ($6.94)
Local Fire Protection: $4,000 ($0.59)
- Water Utilities - Interest on Debt: $530,000 ($78.26)
Carolina Beach government finances - Revenue in 2021 (per resident):
- Charges - Sewerage: $6,080,000 ($897.81)
Parking Facilities: $2,310,000 ($341.11)
Solid Waste Management: $1,813,000 ($267.72)
Parks and Recreation: $1,154,000 ($170.41)
Miscellaneous Commercial Activities: $637,000 ($94.06)
Other: $328,000 ($48.43)
- Miscellaneous - Interest Earnings: $328,000 ($48.43)
Rents: $255,000 ($37.66)
General Revenue - Other: $154,000 ($22.74)
Special Assessments: $96,000 ($14.18)
Sale of Property: $55,000 ($8.12)
- Revenue - Water Utilities: $2,470,000 ($364.74)
- State Intergovernmental - Other: $650,000 ($95.98)
General Local Government Support: $595,000 ($87.86)
Highways: $174,000 ($25.69)
- Tax - Property: $5,019,000 ($741.14)
General Sales and Gross Receipts: $2,097,000 ($309.66)
Other Selective Sales: $579,000 ($85.50)
Occupation and Business License - Other: $116,000 ($17.13)
Other License: $7,000 ($1.03)
Carolina Beach government finances - Debt in 2021 (per resident):
- Long Term Debt - Beginning Outstanding - Unspecified Public Purpose: $29,624,000 ($4374.48)
Outstanding Unspecified Public Purpose: $27,681,000 ($4087.57)
Retired Unspecified Public Purpose: $1,943,000 ($286.92)
10.19% of this county's 2021 resident taxpayers lived in other counties in 2020 ($79,697 average adjusted gross income)
| Here: | 10.19% |
| North Carolina average: | 8.85% |
0.03% of residents moved from foreign countries ($166 average AGI)
New Hanover County: 0.03% North Carolina average: 0.04%
Top counties from which taxpayers relocated into this county between 2020 and 2021:
| from Brunswick County, NC | |
| from Wake County, NC | |
| from Pender County, NC |
8.46% of this county's 2020 resident taxpayers moved to other counties in 2021 ($61,225 average adjusted gross income)
| Here: | 8.46% |
| North Carolina average: | 7.89% |
0.02% of residents moved to foreign countries ($167 average AGI)
New Hanover County: 0.02% North Carolina average: 0.03%
Top counties to which taxpayers relocated from this county between 2020 and 2021:
| to Brunswick County, NC | |
| to Pender County, NC | |
| to Wake County, NC |
| Businesses in Carolina Beach, NC | ||||
| Name | Count | Name | Count | |
|---|---|---|---|---|
| Ace Hardware | 1 | Pizza Hut | 1 | |
| CVS | 1 | Subway | 1 | |
| FedEx | 1 | True Value | 1 | |
| H&R Block | 1 | UPS | 1 | |
| Marriott | 1 | Vans | 2 | |
| McDonald's | 1 | Walgreens | 1 | |
| Microtel | 1 | |||
Strongest AM radio stations in Carolina Beach:
- WMYT (1180 AM; daytime; 10 kW; CAROLINA BEACH, NC; Owner: FAMILY RADIO NETWORK, INC.)
- WAAV (980 AM; 5 kW; LELAND, NC; Owner: CUMULUS LICENSING CORP.)
- WMFD (630 AM; 1 kW; WILMINGTON, NC; Owner: OCEAN BROADCASTING II, LLC)
- WSMO (1120 AM; 20 kW; CAMP LEJEUNE, NC; Owner: CTC MEDIA GROUP, INC.)
- WPTF (680 AM; 50 kW; RALEIGH, NC; Owner: FIRST STATE COMMUNICATIONS)
- WLSG (1340 AM; 1 kW; WILMINGTON, NC; Owner: FAMILY RADIO NETWORK, INC.)
- WWIL (1490 AM; 1 kW; WILMINGTON, NC; Owner: FAMILY RADIO NETWORK, INC.)
- WCEO (840 AM; daytime; 50 kW; COLUMBIA, SC; Owner: EASTERN BROADCASTING GROUP, INC.)
- WFTK (1030 AM; daytime; 50 kW; WAKE FOREST, NC; Owner: POSITIVE RADIO GROUP, INC.)
- WMIR (1200 AM; 6 kW; ATLANTIC BEACH, SC; Owner: ATLANTIC BEACH RADIO, INC.)
- WQJM (1450 AM; 10 kW; MYRTLE BEACH, SC; Owner: NM LICENSING, LLC)
- WFNC (640 AM; 10 kW; FAYETTEVILLE, NC; Owner: CUMULUS LICENSING CORP.)
- WBAJ (890 AM; daytime; 50 kW; BLYTHEWOOD, SC; Owner: FAMILY FIRST)
Strongest FM radio stations in Carolina Beach:
- WUIN (106.7 FM; CAROLINA BEACH, NC; Owner: OCEAN BROADCASTING II, LLC)
- WSFM (107.5 FM; SOUTHPORT, NC; Owner: SEA-COMM, INC.)
- WWQQ-FM (101.3 FM; WILMINGTON, NC; Owner: CUMULUS LICENSING CORP.)
- WGNI (102.7 FM; WILMINGTON, NC; Owner: CUMULUS LICENSING CORP.)
- WHQR (91.3 FM; WILMINGTON, NC; Owner: FRIENDS OF PUBLIC RADIO, INC.)
- WRQR (104.5 FM; WILMINGTON, NC; Owner: OCEAN BROADCASTING II, L.L.C.)
- WAZO (98.3 FM; OAK ISLAND, NC; Owner: OCEAN BROADCASTING II, L.L.C.)
- WMNX (97.3 FM; WILMINGTON, NC; Owner: CUMULUS LICENSING CORP.)
- WDVV (89.7 FM; WILMINGTON, NC; Owner: FAMILY RADIO NETWORK, INC.)
- WWIL-FM (90.5 FM; WILMINGTON, NC; Owner: FAMILY RADIO NETWORK, INC.)
- WKXS-FM (94.1 FM; LELAND, NC; Owner: CUMULUS LICENSING CORP.)
- WBNE (93.7 FM; WRIGHTSVILLE BEACH, NC; Owner: SEA-COMM, INC.)
- WKXB (99.9 FM; BURGAW, NC; Owner: SEA-COMM, INC.)
- WKOO (98.7 FM; JACKSONVILLE, NC; Owner: NM LICENSING, LLC)
- WLTT (106.3 FM; SHALLOTTE, NC; Owner: GARY E. BURNS)
- WKVC (88.9 FM; NORTH MYRTLE BEACH, SC; Owner: EDUCATIONAL MEDIA FOUNDATION)
TV broadcast stations around Carolina Beach:
- WUNJ-TV (Channel 39; WILMINGTON, NC; Owner: UNIVERSITY OF NORTH CAROLINA)
- W51CW (Channel 51; WILMINGTON, NC; Owner: TRINITY BROADCASTING NETWORK)
- WILM-LP (Channel 10; WILMINGTON, NC; Owner: WILM, INC.)
- WECT (Channel 6; WILMINGTON, NC; Owner: RAYCOM AMERICA, INC.)
- WPXU-TV (Channel 35; JACKSONVILLE, NC; Owner: PAXSON JACKSONVILLE LICENSE, INC.)
- W47CK (Channel 47; SHALLOTTE, NC; Owner: CAROLINA CHRISTIAN BROADCASTING INC.)
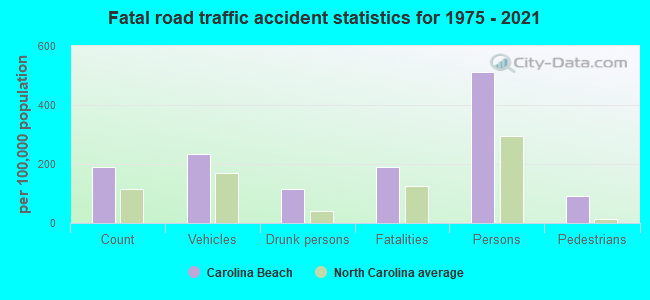
- National Bridge Inventory (NBI) Statistics
- 3Number of bridges
- 262ft / 79.8mTotal length
- 26,950Total average daily traffic
- 3,178Total average daily truck traffic
FCC Registered Cell Phone Towers:
1 (See the full list of FCC Registered Cell Phone Towers in Carolina Beach)FCC Registered Antenna Towers:
10 (See the full list of FCC Registered Antenna Towers)FCC Registered Private Land Mobile Towers:
1 (See the full list of FCC Registered Private Land Mobile Towers in Carolina Beach, NC)FCC Registered Broadcast Land Mobile Towers:
7 (See the full list of FCC Registered Broadcast Land Mobile Towers)FCC Registered Microwave Towers:
3- ORTON, Int Sr 153 & 1521 (Lat: 34.086833 Lon: -77.959417), Overall height: 128 m, Call Sign: WMQ385,
Assigned Frequencies: 10633.1 MHz, Grant Date: 03/06/2001, Expiration Date: 02/01/2011, Cancellation Date: 01/25/2006, Certifier: Glenn S Rabin, Registrant: Alltel Communications, Inc., One Allied Drive, B2f2-A, Little Rock, AR 72202, Phone: (501) 905-8555, Fax: (501) 905-6193, Email:
- NA CAROLINA, 805 Glen Ave (Lat: 34.045778 Lon: -77.901083), Type: Tank, Structure height: 35.1 m, Call Sign: WQMY825,
Assigned Frequencies: 11405.0 MHz, Grant Date: 11/10/2010, Expiration Date: 11/10/2020, Cancellation Date: 05/28/2019, Certifier: Christopher L Harris, Registrant: Conterra Ultra Broadband, LLC, 2101 Rexford Road Suite 200 E, Charlotte, NC 28211, Phone: (704) 936-1801, Fax: (704) 936-1801, Email:
- CAROLINA BEACH, 40 Yards East Int. Of Dow Rd & Elton Ave. (Lat: 34.045944 Lon: -77.901306), Type: Tank, Structure height: 35.1 m, Overall height: 45.7 m, Call Sign: WQTU469,
Assigned Frequencies: 11265.0 MHz, Grant Date: 04/15/2014, Expiration Date: 04/15/2024, Certifier: Steven T Campbell, Registrant: Wilkinson Barker Knauer, LLP, 1800 M Street Nw, Suite 800n, Washington, DC 20036, Phone: (202) 383-3420, Fax: (202) 783-5851, Email:
FCC Registered Maritime Coast & Aviation Ground Towers:
3- Sr 1628 Marina (Lat: 34.051000 Lon: -77.917500), Type: Building, Overall height: 5 m, Call Sign: KEB463, Licensee ID: L00002610,
Assigned Frequencies: 156.425 MHz, 156.450 MHz, 156.800 MHz, Grant Date: 08/05/2015, Expiration Date: 08/03/2025, Registrant: Carolina Beach State Park
- Harbor Oaks (Lat: 34.066833 Lon: -77.883028), Type: Building, Overall height: 37 m, Call Sign: WHX306,
Assigned Frequencies: 156.350 MHz, 156.800 MHz, 156.975 MHz, 156.450 MHz, Grant Date: 10/10/2000, Expiration Date: 10/10/2005, Cancellation Date: 01/07/2006, Registrant: East Coast Marine Inc, Wrightsville Beach, NC 28480
- Oceana Marina 401 Marina Street (Lat: 34.065333 Lon: -77.891917), Type: Mast, Structure height: 3 m, Overall height: 9.1 m, Call Sign: WPYG661, Licensee ID: L00705110,
Assigned Frequencies: 156.800 MHz, 156.425 MHz, Grant Date: 08/07/2003, Expiration Date: 08/07/2013, Cancellation Date: 10/12/2013, Certifier: Larry W Sincoskie, Registrant: Oceana Transient Dock Inc
FCC Registered Amateur Radio Licenses:
29 (See the full list of FCC Registered Amateur Radio Licenses in Carolina Beach)FAA Registered Aircraft:
11 (See the full list of FAA Registered Aircraft in Carolina Beach)| Home Mortgage Disclosure Act Aggregated Statistics For Year 2009 (Based on 2 partial tracts) | ||||||||||
| A) FHA, FSA/RHS & VA Home Purchase Loans | B) Conventional Home Purchase Loans | C) Refinancings | D) Home Improvement Loans | F) Non-occupant Loans on < 5 Family Dwellings (A B C & D) | ||||||
|---|---|---|---|---|---|---|---|---|---|---|
| Number | Average Value | Number | Average Value | Number | Average Value | Number | Average Value | Number | Average Value | |
| LOANS ORIGINATED | 3 | $209,263 | 29 | $233,339 | 63 | $231,179 | 1 | $142,700 | 51 | $242,719 |
| APPLICATIONS APPROVED, NOT ACCEPTED | 0 | $0 | 2 | $162,490 | 8 | $250,170 | 0 | $0 | 5 | $210,016 |
| APPLICATIONS DENIED | 1 | $139,720 | 7 | $225,793 | 27 | $256,244 | 1 | $93,450 | 18 | $244,173 |
| APPLICATIONS WITHDRAWN | 0 | $0 | 4 | $281,568 | 15 | $258,168 | 0 | $0 | 11 | $271,208 |
| FILES CLOSED FOR INCOMPLETENESS | 0 | $0 | 1 | $343,580 | 5 | $303,374 | 0 | $0 | 3 | $233,517 |
Detailed HMDA statistics for the following Tracts: 0122.00
| Private Mortgage Insurance Companies Aggregated Statistics For Year 2009 (Based on 2 partial tracts) | ||||
| A) Conventional Home Purchase Loans | C) Non-occupant Loans on < 5 Family Dwellings (A & B) | |||
|---|---|---|---|---|
| Number | Average Value | Number | Average Value | |
| LOANS ORIGINATED | 2 | $225,730 | 1 | $157,580 |
| APPLICATIONS APPROVED, NOT ACCEPTED | 1 | $204,750 | 1 | $142,850 |
| APPLICATIONS DENIED | 2 | $249,165 | 1 | $210,850 |
| APPLICATIONS WITHDRAWN | 0 | $0 | 0 | $0 |
| FILES CLOSED FOR INCOMPLETENESS | 0 | $0 | 0 | $0 |
Detailed PMIC statistics for the following Tracts: 0122.00
2002 - 2018 National Fire Incident Reporting System (NFIRS) incidents
- Fire incident types reported to NFIRS in Carolina Beach, NC
- 39149.6%Structure Fires
- 24430.9%Outside Fires
- 789.9%Other
- 769.6%Mobile Property/Vehicle Fires
 Based on the data from the years 2002 - 2018 the average number of fire incidents per year is 46. The highest number of fires - 140 took place in 2011, and the least - 1 in 2004. The data has a rising trend.
 When looking into fire subcategories, the most reports belonged to: Structure Fires (49.6%), and Outside Fires (30.9%).
Fire-safe hotels and motels in Carolina Beach, North Carolina:
- Courtyard By Marriott At Carolina Beach, 100 Charlotte Ave, Carolina Beach, North Carolina 28428 , Phone: (910) 458-2030, Fax: (910) 458-2050
- Hampton Inn & Suites, 1 Harper Ave, Carolina beach, North Carolina 28428 , Phone: (910) 707-1770, Fax: (910) 707-1771
| Most common first names in Carolina Beach, NC among deceased individuals | ||
| Name | Count | Lived (average) |
|---|---|---|
| Robert | 40 | 66.9 years |
| James | 36 | 67.0 years |
| John | 35 | 75.8 years |
| William | 30 | 71.1 years |
| Mary | 28 | 72.6 years |
| Joseph | 20 | 68.7 years |
| Charles | 18 | 76.5 years |
| Richard | 15 | 66.5 years |
| George | 15 | 70.3 years |
| Dorothy | 12 | 77.5 years |
| Most common last names in Carolina Beach, NC among deceased individuals | ||
| Last name | Count | Lived (average) |
|---|---|---|
| Williams | 15 | 72.6 years |
| Jones | 15 | 72.0 years |
| Johnson | 14 | 67.3 years |
| Lewis | 13 | 71.4 years |
| Smith | 12 | 67.8 years |
| Miller | 8 | 77.7 years |
| Taylor | 8 | 67.0 years |
| Passmore | 7 | 64.4 years |
| Brown | 7 | 74.4 years |
| Thompson | 6 | 74.5 years |
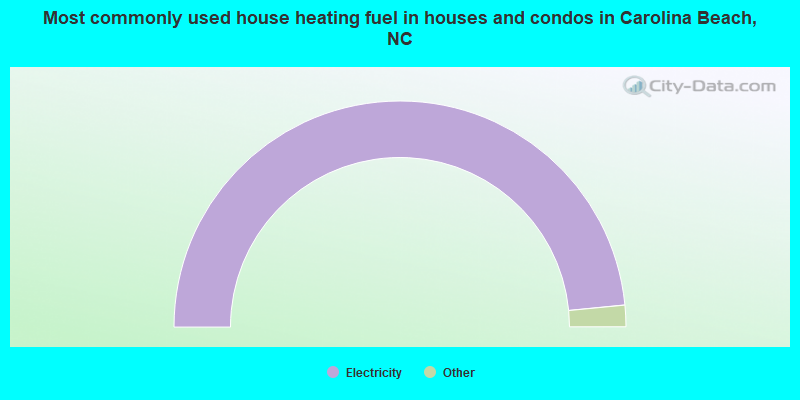
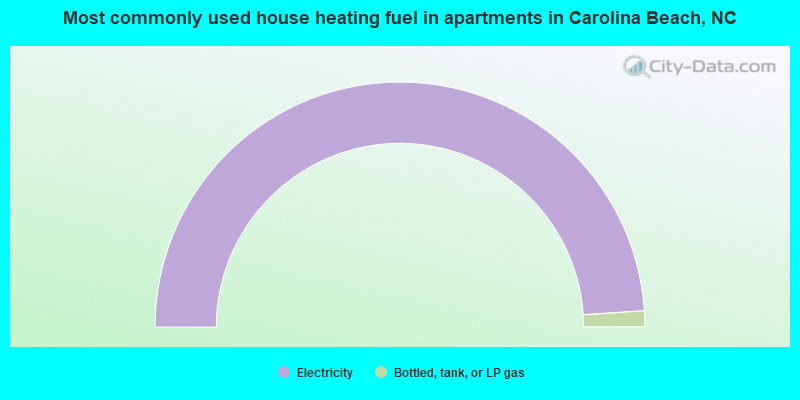
- 96.9%Electricity
- 2.1%Bottled, tank, or LP gas
- 1.0%Utility gas
- 97.9%Electricity
- 2.1%Bottled, tank, or LP gas
Carolina Beach compared to North Carolina state average:
- Median house value above state average.
- Unemployed percentage significantly below state average.
- Black race population percentage significantly below state average.
- Length of stay since moving in significantly above state average.
- Number of rooms per house below state average.
- Percentage of population with a bachelor's degree or higher above state average.
Carolina Beach on our top lists:
- #16 on the list of "Top 101 cities with largest percentage of females in industries: information (population 5,000+)"
- #51 on the list of "Top 101 cities with the highest number of police officers per 1000 residents (population 5,000+)"
- #89 on the list of "Top 101 cities with largest percentage of females in industries: other services, except public administration (population 5,000+)"
- #54 on the list of "Top 101 counties with the highest percentage of residents that smoked 100+ cigarettes in their lives"
- #56 on the list of "Top 101 counties with the lowest average weight of females"
- #86 on the list of "Top 101 counties with the highest percentage of residents that keep firearms around their homes"
- #98 on the list of "Top 101 counties with the highest percentage of residents that exercised in the past month"
- #100 on the list of "Top 101 counties with the lowest percentage of residents relocating to foreign countries in 2011 (pop. 50,000+)"

|
|
Total of 25 patent applications in 2008-2024.