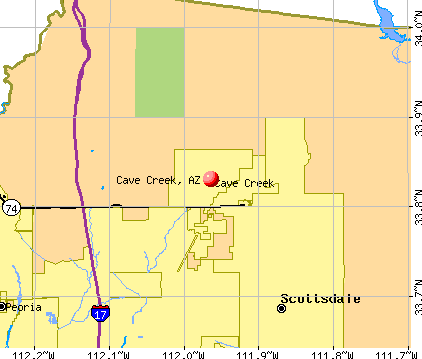
Cave Creek, Arizona
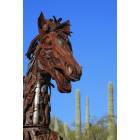
Cave Creek: art in Cave Creek
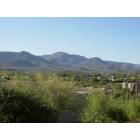
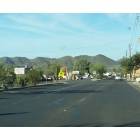
Cave Creek: Mountains in Cave Creek, way out in the desert
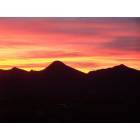
Cave Creek: A Cave Creek Sunset
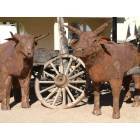
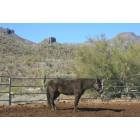
Cave Creek: bulls at frontier town
Cave Creek: beautiful vistas in Cave Creek
Cave Creek: Spur Cross Gallery
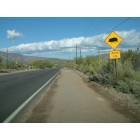
Cave Creek: beautiful trails to hike or ride in Cave Creek
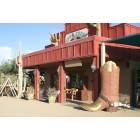
Cave Creek: main drag in town
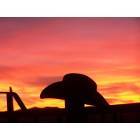
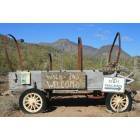
Cave Creek: A Cowboy's Dream
Cave Creek: Schoolhouse road
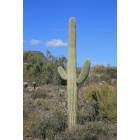
Cave Creek: Seguaro a mighty catus in Cave Creek
- see
13
more - add
your
Submit your own pictures of this town and show them to the world
- OSM Map
- General Map
- Google Map
- MSN Map
Population change since 2000: +37.7%
| Males: 2,439 | |
| Females: 2,696 |
| Median resident age: | 58.6 years |
| Arizona median age: | 38.8 years |
Zip codes: 85087.
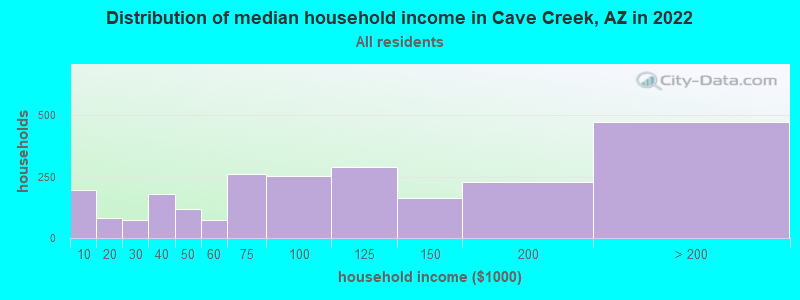
| Cave Creek: | $94,282 |
| AZ: | $74,568 |
Estimated per capita income in 2022: $60,240 (it was $38,070 in 2000)
Cave Creek town income, earnings, and wages data
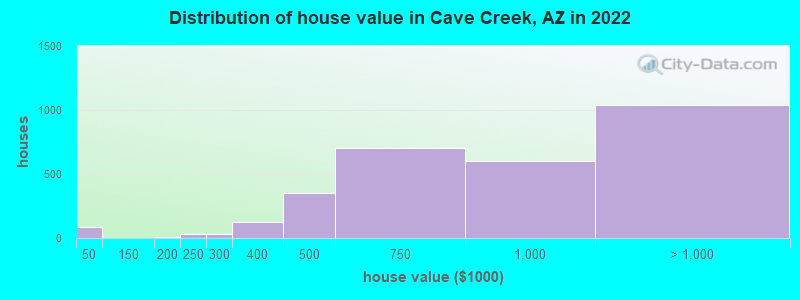
Estimated median house or condo value in 2022: $911,410 (it was $263,200 in 2000)
| Cave Creek: | $911,410 |
| AZ: | $402,800 |
Mean prices in 2022: all housing units: $846,197; detached houses: $855,719; townhouses or other attached units: $309,750; mobile homes: $814,608
Median gross rent in 2022: $1,675.
(10.9% for White Non-Hispanic residents, 51.3% for Hispanic or Latino residents, 42.5% for other race residents, 7.9% for two or more races residents)
Detailed information about poverty and poor residents in Cave Creek, AZ


Compare current foreclosures near Cave Creek, AZ:
| Photo | Address | Area | Beds / Baths | Price | Details |
|---|---|---|---|---|---|

|
#1
N Cave Creek Rd Unit 4a
Cave Creek, AZ 85331
|
2,358 sq. feet
|
3 baths 2 beds |
show details | |

|
#2
E Cascalote Dr
Cave Creek, AZ 85331
|
1,434 sq. feet
|
2 baths 3 beds |
show details | |

|
#3
E Duane Ln
Cave Creek, AZ 85331
|
1,805 sq. feet
|
3 baths 3 beds |
show details | |

|
#4
E Morning Vista Ln
Cave Creek, AZ 85331
|
1,388 sq. feet
|
2 baths - beds |
show details | |

|
#5
N 50th St
Cave Creek, AZ 85331
|
2,544 sq. feet
|
3 baths - beds |
show details | |

|
#6
E Wildcat Dr
Cave Creek, AZ 85331
|
1,739 sq. feet
|
3 baths - beds |
show details | |

|
#7
E Desert Forest Trl
Cave Creek, AZ 85331
|
3,702 sq. feet
|
4 baths - beds |
show details | |

|
#8
N 47th St
Cave Creek, AZ 85331
|
4,461 sq. feet
|
4 baths - beds |
show details | |

|
#9
N 25th St
Cave Creek, AZ 85331
|
2,350 sq. feet
|
- baths - beds |
show details | |

|
#10
N Tatum Blvd Apt 1019
Cave Creek, AZ 85331
|
- sq. feet
|
- baths - beds |
show details |
| Photo | Address | Area | Beds / Baths | Price | Details |
|---|---|---|---|---|---|

|
#11
N 58th St
Cave Creek, AZ 85331
|
3,006 sq. feet
|
- baths - beds |
show details | |

|
#12
E Roberta Dr
Cave Creek, AZ 85331
|
1,943 sq. feet
|
- baths - beds |
show details | |

|
#13
E Peak View Rd
Cave Creek, AZ 85331
|
2,141 sq. feet
|
- baths - beds |
show details | |

|
#14
N 56th St
Cave Creek, AZ 85331
|
4,406 sq. feet
|
- baths - beds |
show details | |

|
#15
E Roberta Dr
Cave Creek, AZ 85331
|
1,943 sq. feet
|
- baths - beds |
show details | |

|
#16
N 46th Pl
Cave Creek, AZ 85331
|
- sq. feet
|
- baths - beds |
show details | |

|
#17
N Cave Creek Rd, Ste 118 Pmb 451
Cave Creek, AZ 85331
|
- sq. feet
|
- baths - beds |
show details | |

|
#18
N 42nd Pl
Cave Creek, AZ 85331
|
- sq. feet
|
- baths - beds |
show details | |

|
#19
E Roy Rogers Rd
Cave Creek, AZ 85331
|
2,034 sq. feet
|
- baths - beds |
show details | |

|
#20
N Tatum Blvd Apt 121
Cave Creek, AZ 85331
|
- sq. feet
|
- baths - beds |
show details |
| Photo | Address | Area | Beds / Baths | Price | Details |
|---|---|---|---|---|---|

|
#21
E Rancho Paloma Dr, Unit 1037
Cave Creek, AZ 85331
|
- sq. feet
|
- baths - beds |
show details | |

|
#22
E Desert Vista Trl
Cave Creek, AZ 85331
|
- sq. feet
|
- baths - beds |
show details | |

|
#23
E Skinner Dr
Cave Creek, AZ 85331
|
- sq. feet
|
- baths - beds |
show details | |

|
#24
N 19th Ave Unit 1055
Phoenix, AZ 85023
|
927 sq. feet
|
2 baths 2 beds |
show details | |

|
#25
E Rough Rider Rd Condo 1077
Phoenix, AZ 85050
|
1,697 sq. feet
|
2 baths 2 beds |
show details | |

|
#26
N Tatum Blvd Unit 2004
Phoenix, AZ 85028
|
866 sq. feet
|
1 baths 1 beds |
show details | |

|
#27
E Paradise Village Pkwy N Apt 135
Phoenix, AZ 85032
|
713 sq. feet
|
1 baths 1 beds |
show details | |

|
#28
W Brianna Rd
Phoenix, AZ 85085
|
3,551 sq. feet
|
4 baths 4 beds |
show details | |

|
#29
E Thunderbird Rd
Scottsdale, AZ 85254
|
2,256 sq. feet
|
2 baths 4 beds |
show details | |

|
#30
E Danbury Rd
Phoenix, AZ 85032
|
1,190 sq. feet
|
2 baths 3 beds |
show details |
| Photo | Address | Area | Beds / Baths | Price | Details |
|---|---|---|---|---|---|

|
#31
E Nisbet Rd
Phoenix, AZ 85032
|
1,802 sq. feet
|
2 baths 4 beds |
show details | |

|
#32
N 6th Pl
Phoenix, AZ 85024
|
866 sq. feet
|
2 baths 2 beds |
show details | |

|
#33
N 43rd Ln
Glendale, AZ 85308
|
2,340 sq. feet
|
3 baths 3 beds |
show details | |

|
#34
W New River Rd
New River, AZ 85087
|
1,519 sq. feet
|
2 baths 3 beds |
show details | |

|
#35
N 46th Ln
Phoenix, AZ 85086
|
- sq. feet
|
2 baths 4 beds |
show details | |

|
#36
N 36th Ave
Glendale, AZ 85310
|
1,518 sq. feet
|
2 baths 3 beds |
show details | |

|
#37
W Paso Trl
Peoria, AZ 85383
|
3,376 sq. feet
|
3 baths 5 beds |
show details | |

|
#38
N 28th Pl
Phoenix, AZ 85032
|
1,434 sq. feet
|
2 baths 3 beds |
show details | |

|
#39
W Michelle Dr
Phoenix, AZ 85023
|
1,036 sq. feet
|
2 baths 3 beds |
show details | |

|
#40
E Contention Mine Rd
Phoenix, AZ 85032
|
1,659 sq. feet
|
1 baths 3 beds |
show details |
| Photo | Address | Area | Beds / Baths | Price | Details |
|---|---|---|---|---|---|

|
#41
E Mine Creek Rd
Phoenix, AZ 85024
|
- sq. feet
|
2 baths 2 beds |
show details | |

|
#42
E Dahlia Dr
Phoenix, AZ 85032
|
1,699 sq. feet
|
3 baths 3 beds |
show details | |

|
#43
W Danbury Dr
Glendale, AZ 85308
|
1,898 sq. feet
|
2 baths 4 beds |
show details | |

|
#44
N 34th Pl
Phoenix, AZ 85032
|
1,522 sq. feet
|
3 baths 3 beds |
show details | |

|
#45
N 42nd Ave
Glendale, AZ 85308
|
1,560 sq. feet
|
2 baths 3 beds |
show details | |

|
#46
N 22nd St
Phoenix, AZ 85022
|
1,320 sq. feet
|
2 baths 3 beds |
show details | |

|
#47
E Marriott Dr
Phoenix, AZ 85054
|
1,260 sq. feet
|
2 baths 2 beds |
show details | |

|
#48
N 26th St
Phoenix, AZ 85032
|
1,617 sq. feet
|
2 baths 3 beds |
show details | |

|
#49
E Deer Valley Rd Unit 184
Scottsdale, AZ 85255
|
2,371 sq. feet
|
3 baths 4 beds |
show details | |

|
Check over 1 million property listings on Foreclosure.com!
|
browse all offers | |||


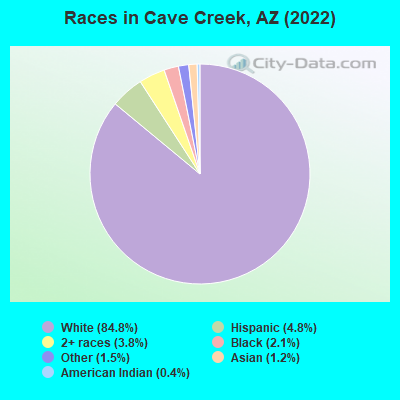
- 4,32884.8%White alone
- 2474.8%Hispanic
- 1963.8%Two or more races
- 1062.1%Black alone
- 741.5%Other race alone
- 631.2%Asian alone
- 200.4%American Indian alone
According to our research of Arizona and other state lists, there were 8 registered sex offenders living in Cave Creek, Arizona as of June 16, 2024.
The ratio of all residents to sex offenders in Cave Creek is 684 to 1.
The ratio of registered sex offenders to all residents in this city is near the state average.
 Recent articles from our blog. Our writers, many of them Ph.D. graduates or candidates, create easy-to-read articles on a wide variety of topics.

 | Cave Creek/Carefree vs Oro Valley? (17 replies) |
| Cave Creek Homes (27 replies) |
| Strangest succulant ever seen in Cave Creek? (3 replies) |
| Metropolitan Phoenix area photo thread (1900 replies) |
| Oro Valley/Marana versus Cave Creek/Carefree? (4 replies) |
| New River vs. Cave Creek vs. Apache Junction (5 replies) |
Latest news from Cave Creek, AZ collected exclusively by city-data.com from local newspapers, TV, and radio stations
Cave Creek, AZ City Guides:
Ancestries: Italian (21.2%), European (8.5%), Irish (7.4%), English (7.3%), German (6.8%), Norwegian (4.4%).
Current Local Time: MST (no DST) time zone
Land area: 28.2 square miles.
Population density: 182 people per square mile (very low).
319 residents are foreign born (2.5% Europe, 1.9% North America, 1.3% Latin America).
| This town: | 6.3% |
| Arizona: | 13.0% |
Median real estate property taxes paid for housing units with mortgages in 2022: $2,395 (0.3%)
Median real estate property taxes paid for housing units with no mortgage in 2022: $2,761 (0.3%)
Nearest city with pop. 50,000+: Deer Valley, AZ  (10.8 miles , pop. 148,777).
Nearest city with pop. 200,000+: Scottsdale, AZ (17.0 miles , pop. 202,705).
Nearest city with pop. 1,000,000+: Phoenix, AZ (21.9 miles , pop. 1,321,045).
Nearest cities:
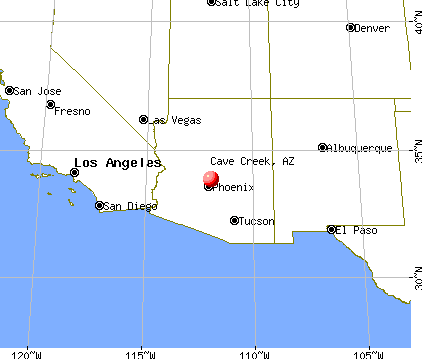
), ), Latitude: 33.83 N, Longitude: 111.96 W
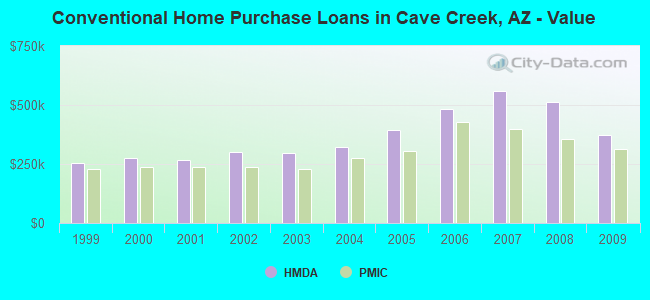
Property values in Cave Creek, AZ

Cave Creek tourist attractions:
- Rancho Manana Golf Club
- Cave Creek Trail Rides
- Dove Valley Ranch Golf Club
- Massacre Cave - Cave Creek, AZ - the massacre didn't take away from this caves beauty
- Tatum Ranch Golf Club - Cave Creek, AZ - an 18 hole luxury golf course
- Cave Creek Regional Park - Cave Creek, AZ - an enjoyable outdoor experience 365 days a year
Cave Creek, Arizona accommodation & food services, waste management - Economy and Business Data
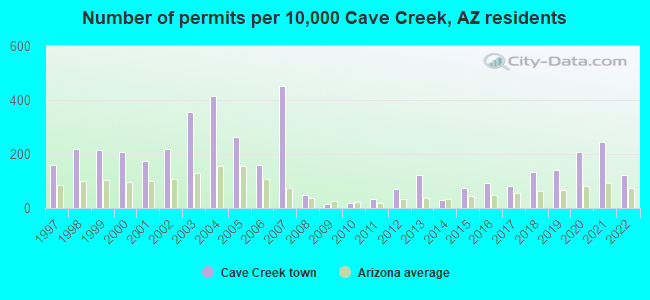
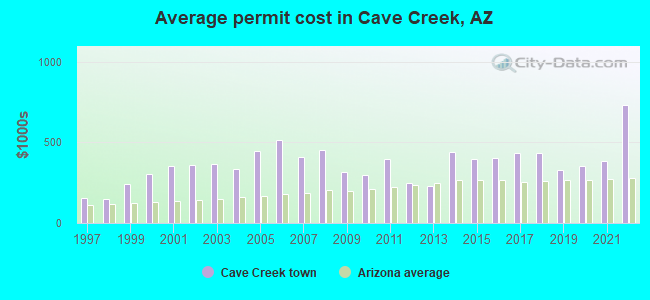
Single-family new house construction building permits:
- 2022: 46 buildings, average cost: $732,800
- 2021: 91 buildings, average cost: $386,900
- 2020: 77 buildings, average cost: $351,400
- 2019: 52 buildings, average cost: $327,900
- 2018: 50 buildings, average cost: $432,300
- 2017: 31 buildings, average cost: $434,200
- 2016: 35 buildings, average cost: $403,900
- 2015: 28 buildings, average cost: $399,200
- 2014: 11 buildings, average cost: $439,000
- 2013: 46 buildings, average cost: $230,300
- 2012: 27 buildings, average cost: $245,900
- 2011: 12 buildings, average cost: $398,300
- 2010: 7 buildings, average cost: $298,200
- 2009: 6 buildings, average cost: $316,500
- 2008: 18 buildings, average cost: $450,700
- 2007: 169 buildings, average cost: $408,500
- 2006: 59 buildings, average cost: $512,200
- 2005: 98 buildings, average cost: $443,500
- 2004: 154 buildings, average cost: $335,500
- 2003: 133 buildings, average cost: $368,900
- 2002: 82 buildings, average cost: $359,700
- 2001: 65 buildings, average cost: $356,300
- 2000: 77 buildings, average cost: $304,500
- 1999: 80 buildings, average cost: $245,300
- 1998: 81 buildings, average cost: $146,500
- 1997: 59 buildings, average cost: $156,600
| Here: | 3.3% |
| Arizona: | 3.8% |
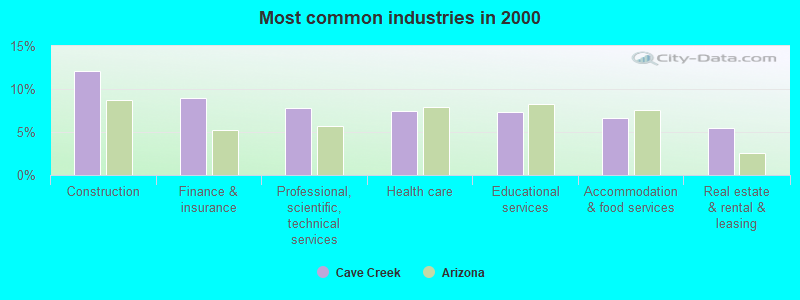
- Construction (12.1%)
- Finance & insurance (8.9%)
- Professional, scientific, technical services (7.8%)
- Health care (7.4%)
- Educational services (7.3%)
- Accommodation & food services (6.7%)
- Real estate & rental & leasing (5.4%)
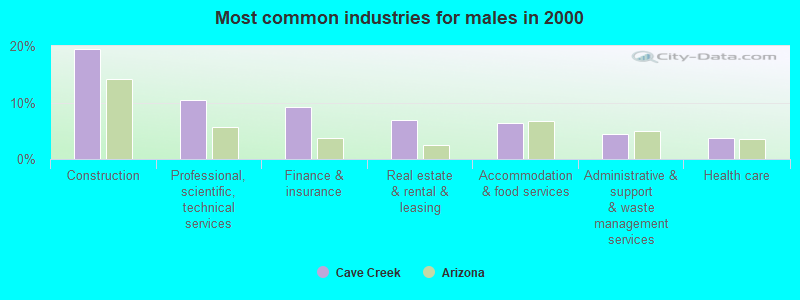
- Construction (19.4%)
- Professional, scientific, technical services (10.4%)
- Finance & insurance (9.2%)
- Real estate & rental & leasing (6.9%)
- Accommodation & food services (6.4%)
- Administrative & support & waste management services (4.5%)
- Health care (3.7%)
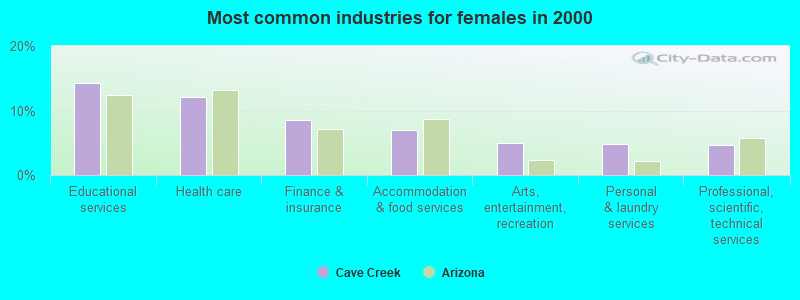
- Educational services (14.2%)
- Health care (12.1%)
- Finance & insurance (8.6%)
- Accommodation & food services (6.9%)
- Arts, entertainment, recreation (4.9%)
- Personal & laundry services (4.8%)
- Professional, scientific, technical services (4.6%)
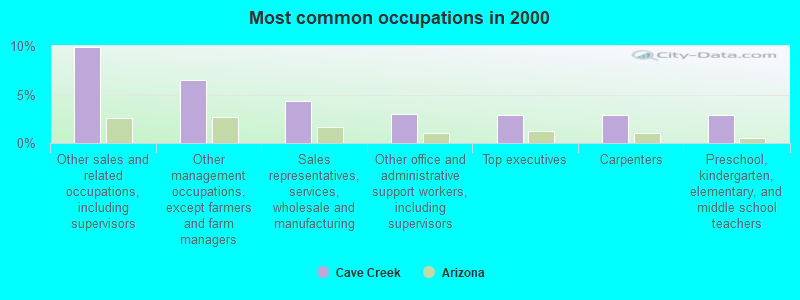
- Other sales and related occupations, including supervisors (9.9%)
- Other management occupations, except farmers and farm managers (6.5%)
- Sales representatives, services, wholesale and manufacturing (4.4%)
- Other office and administrative support workers, including supervisors (3.0%)
- Top executives (2.9%)
- Carpenters (2.9%)
- Preschool, kindergarten, elementary, and middle school teachers (2.9%)
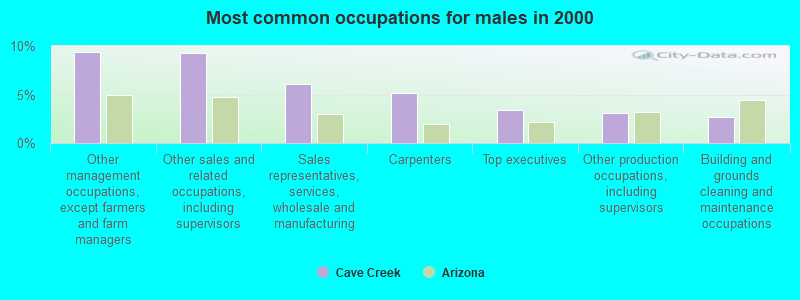
- Other management occupations, except farmers and farm managers (9.4%)
- Other sales and related occupations, including supervisors (9.2%)
- Sales representatives, services, wholesale and manufacturing (6.1%)
- Carpenters (5.1%)
- Top executives (3.5%)
- Other production occupations, including supervisors (3.1%)
- Building and grounds cleaning and maintenance occupations (2.7%)
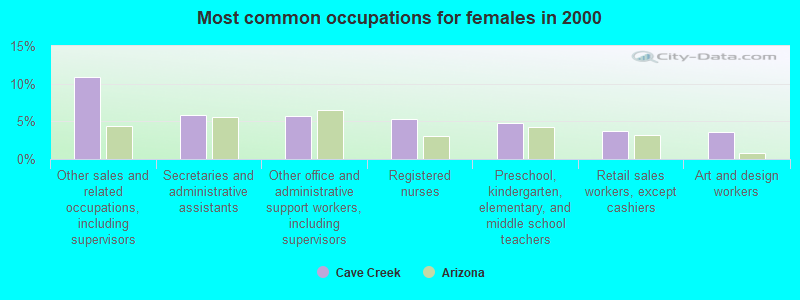
- Other sales and related occupations, including supervisors (10.8%)
- Secretaries and administrative assistants (5.9%)
- Other office and administrative support workers, including supervisors (5.6%)
- Registered nurses (5.3%)
- Preschool, kindergarten, elementary, and middle school teachers (4.8%)
- Retail sales workers, except cashiers (3.8%)
- Art and design workers (3.6%)
Average climate in Cave Creek, Arizona
Based on data reported by over 4,000 weather stations


|
|


(lower is better)
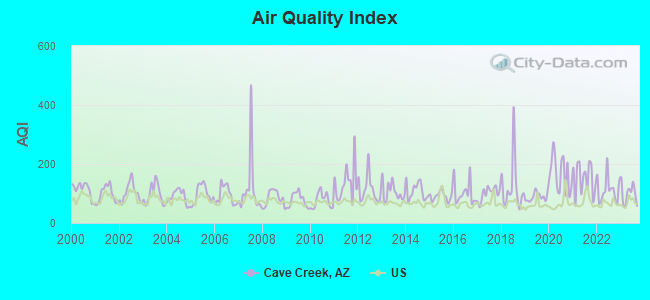
Air Quality Index (AQI) level in 2023 was 99.5. This is worse than average.
| City: | 99.5 |
| U.S.: | 72.6 |
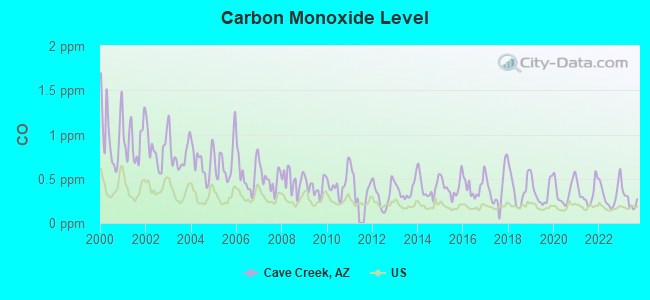
Carbon Monoxide (CO) [ppm] level in 2023 was 0.258. This is about average. Closest monitor was 10.6 miles away from the city center.
| City: | 0.258 |
| U.S.: | 0.251 |
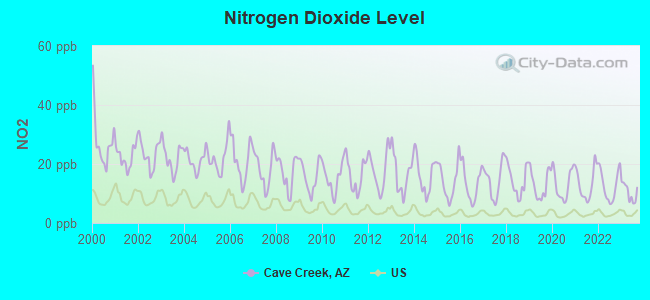
Nitrogen Dioxide (NO2) [ppb] level in 2023 was 10.4. This is significantly worse than average. Closest monitor was 23.1 miles away from the city center.
| City: | 10.4 |
| U.S.: | 5.1 |
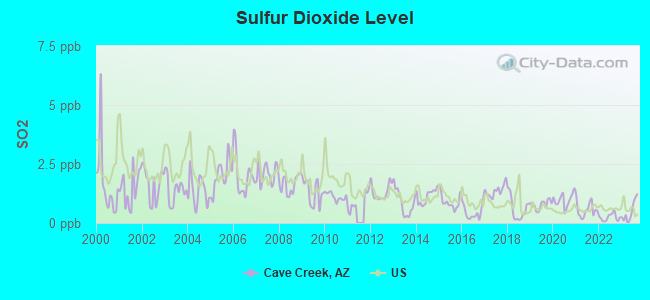
Sulfur Dioxide (SO2) [ppb] level in 2023 was 0.478. This is significantly better than average. Closest monitor was 22.0 miles away from the city center.
| City: | 0.478 |
| U.S.: | 1.515 |
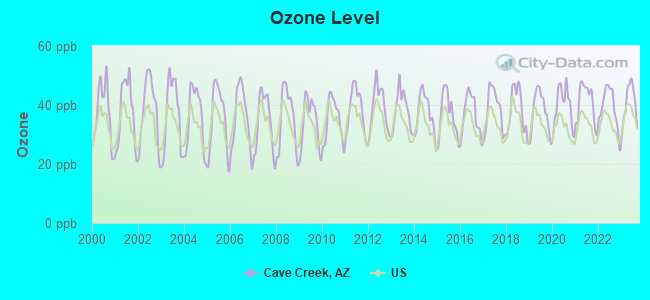
Ozone [ppb] level in 2023 was 40.4. This is worse than average. Closest monitor was 14.2 miles away from the city center.
| City: | 40.4 |
| U.S.: | 33.3 |
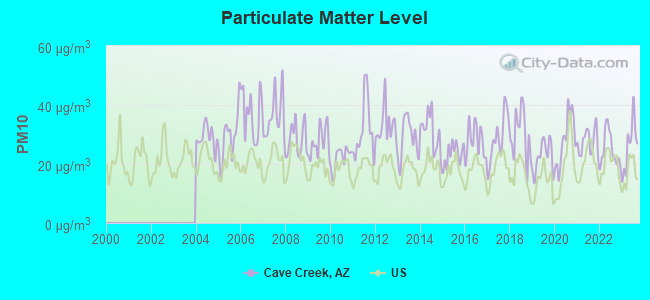
Particulate Matter (PM10) [µg/m3] level in 2023 was 26.3. This is worse than average. Closest monitor was 10.6 miles away from the city center.
| City: | 26.3 |
| U.S.: | 19.2 |
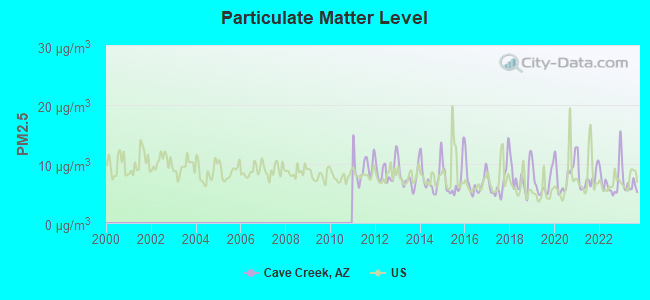
Particulate Matter (PM2.5) [µg/m3] level in 2023 was 6.51. This is better than average. Closest monitor was 19.6 miles away from the city center.
| City: | 6.51 |
| U.S.: | 8.11 |
Earthquake activity:
Cave Creek-area historical earthquake activity is significantly above Arizona state average. It is 2498% greater than the overall U.S. average.On 6/28/1992 at 11:57:34, a magnitude 7.6 (6.2 MB, 7.6 MS, 7.3 MW, Depth: 0.7 mi, Class: Major, Intensity: VIII - XII) earthquake occurred 263.0 miles away from Cave Creek center, causing 3 deaths (1 shaking deaths, 2 other deaths) and 400 injuries, causing $100,000,000 total damage and $40,000,000 insured losses
On 10/16/1999 at 09:46:44, a magnitude 7.4 (6.3 MB, 7.4 MS, 7.2 MW, 7.3 ML) earthquake occurred 260.2 miles away from Cave Creek center
On 5/19/1940 at 04:36:40, a magnitude 7.2 (7.2 UK) earthquake occurred 219.3 miles away from the city center, causing $33,000,000 total damage
On 12/31/1934 at 18:45:56, a magnitude 7.1 (7.1 UK) earthquake occurred 233.4 miles away from the city center
On 10/15/1979 at 23:16:54, a magnitude 7.0 (5.7 MB, 6.9 MS, 7.0 ML, 6.4 MW) earthquake occurred 223.7 miles away from Cave Creek center
On 7/21/1952 at 11:52:14, a magnitude 7.7 (7.7 UK) earthquake occurred 409.4 miles away from the city center, causing $50,000,000 total damage
Magnitude types: body-wave magnitude (MB), local magnitude (ML), surface-wave magnitude (MS), moment magnitude (MW)
Natural disasters:
The number of natural disasters in Maricopa County (16) is near the US average (15).Major Disasters (Presidential) Declared: 11
Emergencies Declared: 1
Causes of natural disasters: Floods: 10, Storms: 9, Fires: 3, Flash Flood: 1, Heavy Rain: 1, Hurricane: 1, Tornado: 1, Wind: 1, Other: 1 (Note: some incidents may be assigned to more than one category).

Hospitals and medical centers near Cave Creek:
- VI AT SILVERSTONE, A VI AND PLAZA COMPANIES COMMUN (Nursing Home, about 11 miles away; SCOTTSDALE, AZ)
- SCOTTSDALE HEALTHCARE-THOMPSON PEAK HOSPITAL Acute Care Hospitals (about 12 miles away; SCOTTSDALE, AZ)
- VI AT GRAYHAWK, A VI AND PLAZA COMPANIES COMMUNITY (Nursing Home, about 12 miles away; SCOTTSDALE, AZ)
- ACACIA HEALTH CENTER (Nursing Home, about 12 miles away; PHOENIX, AZ)
- MAYO CLINIC HOSPITAL Acute Care Hospitals (about 12 miles away; PHOENIX, AZ)
- SANTE OF NORTH SCOTTSDALE (Nursing Home, about 13 miles away; SCOTTSDALE, AZ)
- LIFE CARE CENTER OF PARADISE VALLEY (Nursing Home, about 14 miles away; PHOENIX, AZ)
Colleges/universities with over 2000 students nearest to Cave Creek:
- Paradise Valley Community College (about 13 miles; Phoenix, AZ; Full-time enrollment: 5,259)
- Universal Technical Institute of Arizona Inc-Motorcycle Mechanics Institute Division (about 14 miles; Phoenix, AZ; FT enrollment: 2,976)
- Arizona State University-West (about 20 miles; Glendale, AZ; FT enrollment: 3,454)
- Everest College-Phoenix (about 20 miles; Phoenix, AZ; FT enrollment: 2,008)
- Argosy University-Phoenix Online Division (about 21 miles; Phoenix, AZ; FT enrollment: 8,840)
- Glendale Community College (about 23 miles; Glendale, AZ; FT enrollment: 12,533)
- Scottsdale Community College (about 23 miles; Scottsdale, AZ; FT enrollment: 6,030)
Private elementary/middle schools in Cave Creek:
Points of interest:
Notable locations in Cave Creek: Liscum (A), Cave Creek Museum (B), Desert Foothills Library (C), Cave Creek Town Hall (D), Rural / Metro Fire Department Station 825 Cave Creek Fire Department (E). Display/hide their locations on the map
Churches in Cave Creek include: Good Shepherd of the Hills Episcopal Church (A), Black Mountain Baptist Church (B), The Church of Jesus Christ of Latter Day Saints (C). Display/hide their locations on the map
Reservoir: Ranieri Tank (A). Display/hide its location on the map
Streams, rivers, and creeks: Willow Springs Wash (A), West Fork Apache Wash (B), Cottonwood Creek (C), Grapevine Wash (D), Galloway Wash (E), Rowe Wash (F). Display/hide their locations on the map
Parks in Cave Creek include: Spur Cross Ranch Conservation Area (1), Cave Creek Recreation Area (2). Display/hide their locations on the map
Tourist attractions: Cave Creek Museum Inc (6140 East Skyline Drive) (1), Way Out West Off Road Expeditions Inc (Recreational Trips & Guides; 6547 East Dale Lane) (2), CEO Transportation (Tours & Charters; P.O. Box 4354) (3). Display/hide their approximate locations on the map
Hotel: Cave Creek Tumbleweed Hotel (6333 East Cave Creek Road) (1). Display/hide its approximate location on the map
Drinking water stations with addresses in Cave Creek and their reported violations in the past:
CAVE CREEK WATER CO (Address: 37622 N CAVE CREEK RD , Population served: 5,015, Surface water):Past health violations:DESERT HILLS WATER (Address: 37622 N CAVE CREEK RD , Population served: 4,000, Purch surface water):Past monitoring violations:
- MCL, Monthly (TCR) - In APR-2007, Contaminant: Coliform. Follow-up actions: St Compliance achieved (FEB-05-2008)
- MCL, Average - Between OCT-2005 and DEC-2005, Contaminant: Total Haloacetic Acids (HAA5). Follow-up actions: St Compliance achieved (DEC-06-2006)
- MCL, Average - Between JUL-2005 and SEP-2005, Contaminant: Total Haloacetic Acids (HAA5). Follow-up actions: St Compliance achieved (DEC-06-2006)
- MCL, Monthly (TCR) - In JUN-2005, Contaminant: Coliform. Follow-up actions: St Compliance achieved (NOV-21-2006)
- Monitoring and Reporting (DBP) - Between APR-2009 and JUN-2009, Contaminant: Chlorine. Follow-up actions: St Violation/Reminder Notice (JUL-31-2009), St Compliance achieved (AUG-17-2009)
- Monitoring and Reporting (DBP) - Between OCT-2008 and DEC-2008, Contaminant: Chlorine. Follow-up actions: St Violation/Reminder Notice (FEB-13-2009), St Compliance achieved (MAR-24-2009)
- Monitoring and Reporting (DBP) - Between JUL-2008 and SEP-2008, Contaminant: Chlorine. Follow-up actions: St Violation/Reminder Notice (OCT-20-2008)
- Monitoring and Reporting (DBP) - Between APR-2008 and JUN-2008, Contaminant: Chlorine. Follow-up actions: St Violation/Reminder Notice (AUG-14-2008)
- Monitoring and Reporting (DBP) - Between APR-2008 and JUN-2008, Contaminant: Chlorine. Follow-up actions: St Compliance achieved (OCT-20-2008)
- 2 routine major monitoring violations
- 43 regular monitoring violations
- 4 other older monitoring violations
Past health violations:Past monitoring violations:
- MCL, Average - Between JUL-2010 and SEP-2010, Contaminant: Arsenic. Follow-up actions: St Compliance achieved (MAY-06-2011)
- MCL, Average - Between APR-2010 and JUN-2010, Contaminant: Arsenic. Follow-up actions: St Compliance achieved (MAY-06-2011)
- MCL, Average - Between JAN-2010 and MAR-2010, Contaminant: Arsenic. Follow-up actions: St Compliance achieved (MAY-06-2011)
- MCL, Average - Between OCT-2009 and DEC-2009, Contaminant: Arsenic. Follow-up actions: St Compliance achieved (MAY-06-2011)
- MCL, Average - Between JUL-2009 and SEP-2009, Contaminant: Arsenic. Follow-up actions: St Compliance achieved (MAY-06-2011)
- MCL, Average - Between APR-2009 and JUN-2009, Contaminant: Arsenic. Follow-up actions: St Compliance achieved (MAY-06-2011)
- 5 other older health violations
- Monitoring and Reporting (DBP) - Between JUL-2011 and SEP-2011, Contaminant: TTHM. Follow-up actions: St Compliance achieved (OCT-17-2012)
- Monitoring and Reporting (DBP) - Between JUL-2011 and SEP-2011, Contaminant: Total Haloacetic Acids (HAA5). Follow-up actions: St Compliance achieved (OCT-17-2012)
- Monitoring and Reporting (DBP) - Between APR-2011 and JUN-2011, Contaminant: TTHM. Follow-up actions: St Compliance achieved (OCT-17-2012)
- Monitoring and Reporting (DBP) - Between APR-2011 and JUN-2011, Contaminant: Total Haloacetic Acids (HAA5). Follow-up actions: St Compliance achieved (OCT-17-2012)
- Monitoring and Reporting (DBP) - Between OCT-2010 and DEC-2010, Contaminant: TTHM. Follow-up actions: St Compliance achieved (OCT-17-2012)
- 4 minor monitoring violations
- 7 regular monitoring violations
- 8 other older monitoring violations
| This town: | 2.3 people |
| Arizona: | 2.6 people |
| This town: | 71.0% |
| Whole state: | 66.2% |
| This town: | 5.7% |
| Whole state: | 7.8% |
Likely homosexual households (counted as self-reported same-sex unmarried-partner households)
- Lesbian couples: 0.4% of all households
- Gay men: 0.4% of all households
Banks with branches in Cave Creek (2011 data):
- JPMorgan Chase Bank, National Association: Tatum & Dynamite Banking Center Bran, Carefree Branch, Cave Creek Branch. Info updated 2011/11/10: Bank assets: $1,811,678.0 mil, Deposits: $1,190,738.0 mil, headquarters in Columbus, OH, positive income, International Specialization, 5577 total offices, Holding Company: Jpmorgan Chase & Co.
- BMO Harris Bank National Association: Tatum Ranch Branch at 28215 North Tatum Boulevard, branch established on 2006/10/19; East Carefree Highway Branch at 4623 East Carefree Highway, branch established on 2006/11/20. Info updated 2011/07/14: Bank assets: $97,264.0 mil, Deposits: $75,624.6 mil, headquarters in Chicago, IL, positive income, 717 total offices, Holding Company: Bank Of Montreal
- Wells Fargo Bank, National Association: Cave Creek & Tatum Branch at 29425 North Cave Creek Road, branch established on 2006/02/09. Info updated 2011/04/05: Bank assets: $1,161,490.0 mil, Deposits: $905,653.0 mil, headquarters in Sioux Falls, SD, positive income, 6395 total offices, Holding Company: Wells Fargo & Company
- Parkway Bank and Trust Company: Cave Creek Branch at 6300 East Cave Creek Road, branch established on 2006/05/08. Info updated 2011/06/03: Bank assets: $2,237.7 mil, Deposits: $1,906.2 mil, headquarters in Harwood Heights, IL, positive income, Commercial Lending Specialization, 33 total offices, Holding Company: Parkway Bancorp, Inc.
- U.S. Bank National Association: Cave Creek Safeway at 29834 North Cave Creek Road, branch established on 2008/10/27. Info updated 2012/01/30: Bank assets: $330,470.8 mil, Deposits: $236,091.5 mil, headquarters in Cincinnati, OH, positive income, 3121 total offices, Holding Company: U.S. Bancorp
For population 15 years and over in Cave Creek:
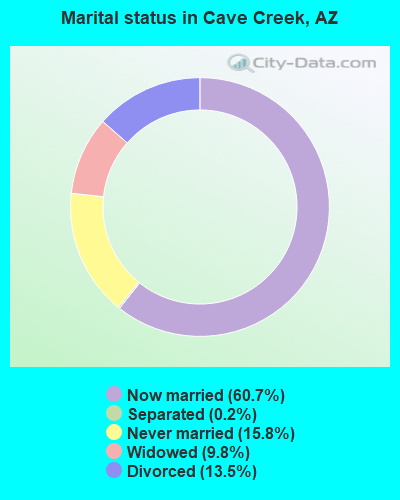
- Never married: 15.8%
- Now married: 60.7%
- Separated: 0.2%
- Widowed: 9.8%
- Divorced: 13.5%
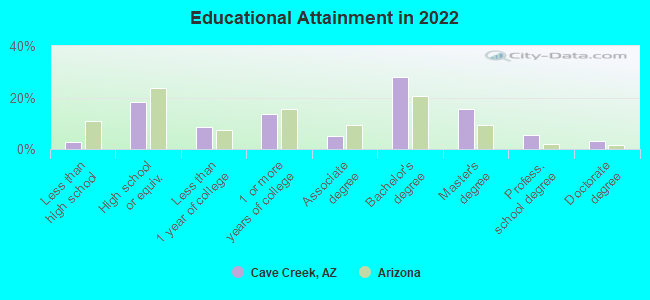
For population 25 years and over in Cave Creek:
- High school or higher: 97.4%
- Bachelor's degree or higher: 50.9%
- Graduate or professional degree: 23.9%
- Unemployed: 1.9%
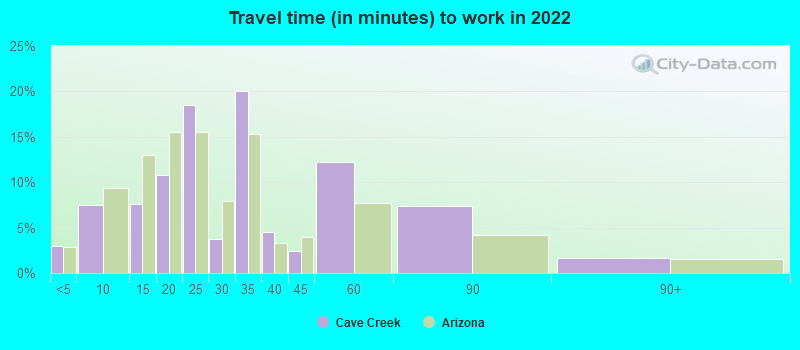
- Mean travel time to work (commute): 18.0 minutes
| Here: | 10.9 |
| Arizona average: | 12.2 |
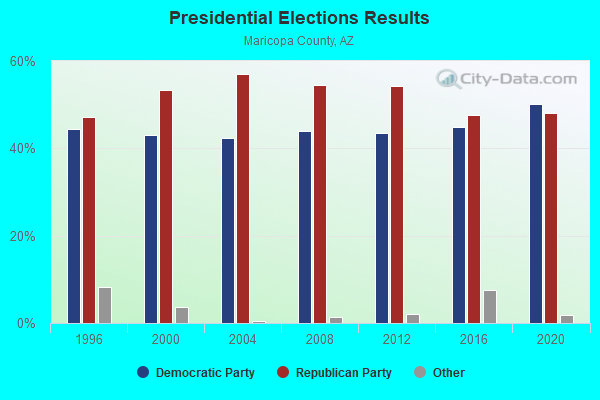
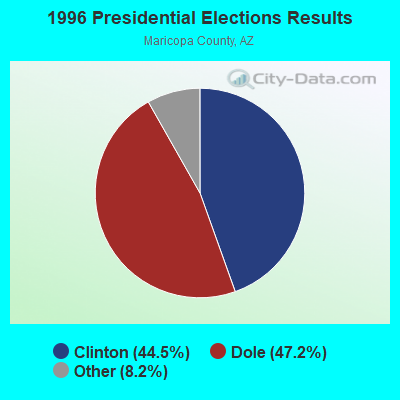
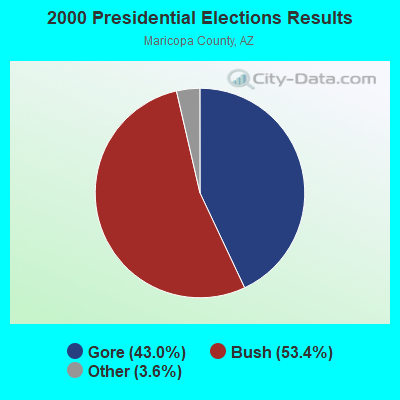
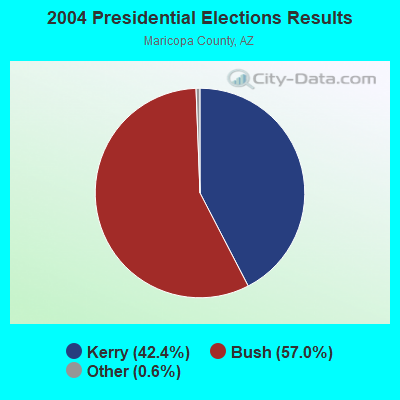
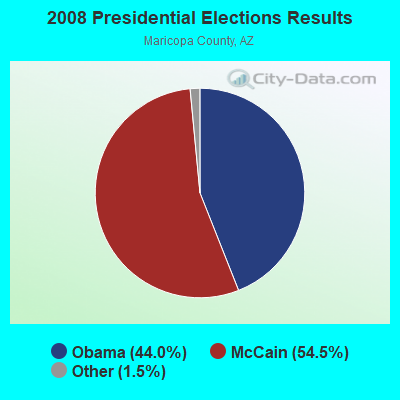
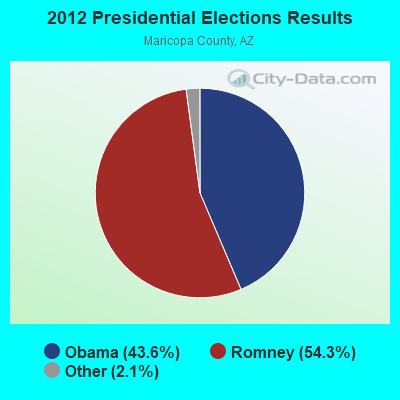
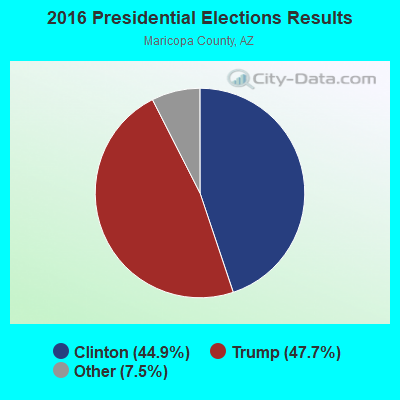
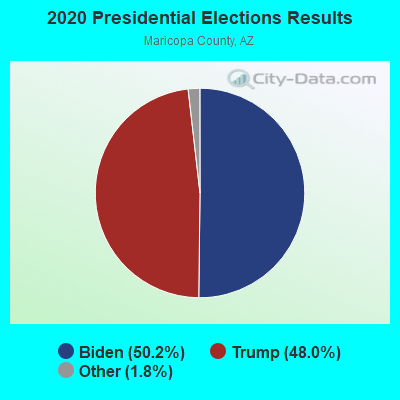
Graphs represent county-level data. Detailed 2008 Election Results
Religion statistics for Cave Creek, AZ (based on Maricopa County data)
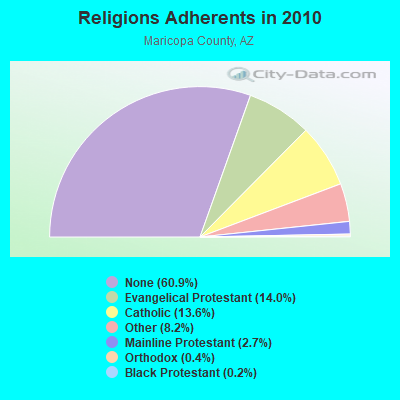
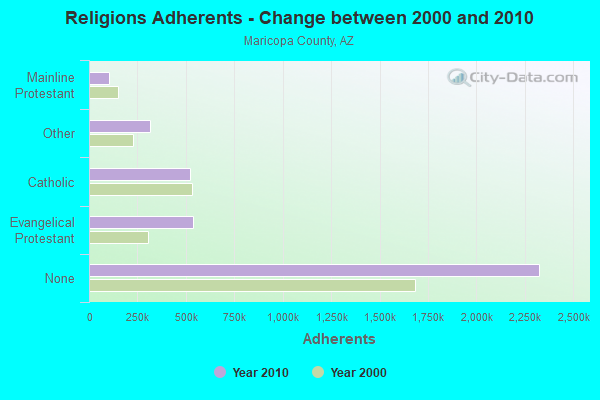
| Religion | Adherents | Congregations |
|---|---|---|
| Evangelical Protestant | 534,453 | 1,206 |
| Catholic | 520,651 | 100 |
| Other | 312,574 | 680 |
| Mainline Protestant | 104,145 | 241 |
| Orthodox | 13,379 | 24 |
| Black Protestant | 6,278 | 48 |
| None | 2,325,637 | - |
Food Environment Statistics:
| Maricopa County: | 1.30 / 10,000 pop. |
| Arizona: | 1.36 / 10,000 pop. |
| Here: | 0.16 / 10,000 pop. |
| Arizona: | 0.14 / 10,000 pop. |
| Maricopa County: | 0.57 / 10,000 pop. |
| State: | 0.55 / 10,000 pop. |
| Maricopa County: | 1.99 / 10,000 pop. |
| State: | 2.47 / 10,000 pop. |
| Here: | 5.86 / 10,000 pop. |
| Arizona: | 6.21 / 10,000 pop. |
| This county: | 7.7% |
| Arizona: | 8.0% |
| Maricopa County: | 22.5% |
| Arizona: | 22.8% |
| This county: | 14.8% |
| State: | 14.2% |
Health and Nutrition:
| Here: | 51.6% |
| Arizona: | 49.0% |
| This city: | 49.5% |
| Arizona: | 47.3% |
| Here: | 28.4 |
| Arizona: | 28.5 |
| Here: | 20.9% |
| Arizona: | 20.8% |
| Cave Creek: | 7.7% |
| Arizona: | 10.2% |
| This city: | 6.9 |
| Arizona: | 6.8 |
| Cave Creek: | 36.7% |
| Arizona: | 33.5% |
| This city: | 56.5% |
| Arizona: | 56.1% |
| This city: | 77.4% |
| Arizona: | 79.4% |
More about Health and Nutrition of Cave Creek, AZ Residents
| Local government employment and payroll (March 2022) | |||||
| Function | Full-time employees | Monthly full-time payroll | Average yearly full-time wage | Part-time employees | Monthly part-time payroll |
|---|---|---|---|---|---|
| Water Supply | 15 | $93,186 | $74,549 | 0 | $0 |
| Other Government Administration | 9 | $64,653 | $86,204 | 0 | $0 |
| Streets and Highways | 7 | $35,343 | $60,588 | 0 | $0 |
| Financial Administration | 6 | $45,124 | $90,248 | 0 | $0 |
| Other and Unallocable | 6 | $32,219 | $64,438 | 0 | $0 |
| Sewerage | 3 | $17,415 | $69,660 | 0 | $0 |
| Police Protection - Officers | 1 | $9,903 | $118,836 | 0 | $0 |
| Fire - Other | 1 | $9,368 | $112,416 | 0 | $0 |
| Totals for Government | 48 | $307,212 | $76,803 | 0 | $0 |
Cave Creek government finances - Expenditure in 2021 (per resident):
- Current Operations - Water Utilities: $6,012,000 ($1170.79)
Regular Highways: $1,260,000 ($245.37)
General Public Buildings: $1,253,000 ($244.01)
Central Staff Services: $1,186,000 ($230.96)
Sewerage: $1,072,000 ($208.76)
Judicial and Legal Services: $865,000 ($168.45)
Protective Inspection and Regulation - Other: $720,000 ($140.21)
Police Protection: $651,000 ($126.78)
Parks and Recreation: $435,000 ($84.71)
Financial Administration: $394,000 ($76.73)
- General - Interest on Debt: $532,000 ($103.60)
- Other Capital Outlay - Parks and Recreation: $10,000 ($1.95)
- Water Utilities - Interest on Debt: $666,000 ($129.70)
Cave Creek government finances - Revenue in 2021 (per resident):
- Charges - Sewerage: $1,762,000 ($343.14)
Other: $1,042,000 ($202.92)
Natural Resources - Other: $1,000 ($0.19)
- Miscellaneous - Rents: $190,000 ($37.00)
General Revenue - Other: $90,000 ($17.53)
Interest Earnings: $23,000 ($4.48)
- Revenue - Water Utilities: $10,455,000 ($2036.03)
- State Intergovernmental - General Local Government Support: $1,804,000 ($351.31)
Highways: $405,000 ($78.87)
- Tax - General Sales and Gross Receipts: $9,507,000 ($1851.41)
Other License: $737,000 ($143.52)
Property: $262,000 ($51.02)
Cave Creek government finances - Debt in 2021 (per resident):
- Long Term Debt - Beginning Outstanding - Unspecified Public Purpose: $38,376,000 ($7473.42)
Outstanding Unspecified Public Purpose: $27,217,000 ($5300.29)
Retired Unspecified Public Purpose: $11,159,000 ($2173.13)
Cave Creek government finances - Cash and Securities in 2021 (per resident):
- Other Funds - Cash and Securities: $34,092,000 ($6639.14)
5.80% of this county's 2021 resident taxpayers lived in other counties in 2020 ($92,013 average adjusted gross income)
| Here: | 5.80% |
| Arizona average: | 6.85% |
0.02% of residents moved from foreign countries ($227 average AGI)
Maricopa County: 0.02% Arizona average: 0.03%
Top counties from which taxpayers relocated into this county between 2020 and 2021:
| from Pinal County, AZ | |
| from Los Angeles County, CA | |
| from Pima County, AZ |
5.04% of this county's 2020 resident taxpayers moved to other counties in 2021 ($76,911 average adjusted gross income)
| Here: | 5.04% |
| Arizona average: | 5.72% |
0.02% of residents moved to foreign countries ($234 average AGI)
Maricopa County: 0.02% Arizona average: 0.03%
Top counties to which taxpayers relocated from this county between 2020 and 2021:
| to Pinal County, AZ | |
| to Pima County, AZ | |
| to Yavapai County, AZ |
| Businesses in Cave Creek, AZ | ||||
| Name | Count | Name | Count | |
|---|---|---|---|---|
| Ace Hardware | 1 | Pizza Hut | 2 | |
| Blockbuster | 1 | Safeway | 1 | |
| Carl\s Jr. | 1 | Starbucks | 1 | |
| Circle K | 2 | Subway | 1 | |
| Curves | 2 | Taco Bell | 1 | |
| Dairy Queen | 1 | True Value | 1 | |
| FedEx | 2 | UPS | 4 | |
| H&R Block | 1 | Vons | 1 | |
| Home Depot | 1 | Wendy's | 1 | |
| Kroger | 2 | |||
Strongest AM radio stations in Cave Creek:
- KFNX (1100 AM; 50 kW; CAVE CREEK, AZ; Owner: NORTH AMERICAN BROADCASTING CO., INC.)
- KMIA (710 AM; 50 kW; BLACK CANYON CITY, AZ; Owner: ENTRAVISION HOLDINGS, LLC)
- KFNN (1510 AM; 22 kW; MESA, AZ; Owner: CRC BROADCASTING COMPANY, INC.)
- KKNT (960 AM; 5 kW; PHOENIX, AZ; Owner: COMMON GROUND BROADCASTING, INC)
- KPXQ (1360 AM; 50 kW; GLENDALE, AZ; Owner: COMMON GROUND BROADCASTING, INC.)
- KMIK (1580 AM; 50 kW; TEMPE, AZ; Owner: ABC, INC.)
- KXEM (1010 AM; 15 kW; TOLLESON, AZ; Owner: JAMES CRYSTAL ENTERPRISES OF PHOENIX, INC.)
- KTAR (620 AM; 5 kW; PHOENIX, AZ; Owner: EMMIS RADIO LICENSE CORPORATION)
- KGME (910 AM; 5 kW; PHOENIX, AZ; Owner: AMFM RADIO LICENSES, L.L.C.)
- KFYI (550 AM; 5 kW; PHOENIX, AZ; Owner: AMFM RADIO LICENSES, L.L.C.)
- KASA (1540 AM; 10 kW; PHOENIX, AZ; Owner: KASA RADIO HOGAR, INC.)
- KAZG (1440 AM; 5 kW; SCOTTSDALE, AZ; Owner: CACTUS RADIO, INC.)
- KFLT (830 AM; 50 kW; TUCSON, AZ; Owner: FAMILY LIFE B/CING SYSTEM, INC.)
Strongest FM radio stations in Cave Creek:
- KMLE (107.9 FM; CHANDLER, AZ; Owner: INFINITY RADIO OPERATIONS INC.)
- KNAI (88.3 FM; PHOENIX, AZ; Owner: NATIONAL FARM WORKERS SERVICE CENTER)
- K205CI (88.9 FM; PHOENIX, AZ; Owner: FAMILY STATIONS, INC.)
- KLNZ (103.5 FM; GLENDALE, AZ; Owner: ENTRAVISION HOLDINGS, LLC)
- K248AL (97.5 FM; PHOENIX, AZ; Owner: ZORBA RESOURCES, INC.)
- KBAQ (89.5 FM; PHOENIX, AZ; Owner: MARICOPA COUNTY COMMUNITY COLLEGE DISTRICT)
- KSLX-FM (100.7 FM; SCOTTSDALE, AZ; Owner: CACTUS RADIO, INC.)
- KKLT (98.7 FM; PHOENIX, AZ; Owner: EMMIS RADIO LICENSE CORPORATION)
- KZON (101.5 FM; PHOENIX, AZ; Owner: INFINITY RADIO OPERATIONS INC.)
- KKFR (92.3 FM; GLENDALE, AZ; Owner: EMMIS RADIO LICENSE CORPORATION)
- KESZ (99.9 FM; PHOENIX, AZ; Owner: CLEAR CHANNEL BROADCASTING LICENSES, INC.)
- K220GI (91.9 FM; CAMP VERDE, AZ; Owner: CALVARY CHAPEL OF TWIN FALLS, INC.)
- KOOL-FM (94.5 FM; PHOENIX, AZ; Owner: INFINITY RADIO OPERATIONS INC.)
- KNIX-FM (102.5 FM; PHOENIX, AZ; Owner: CLEAR CHANNEL BROADCASTING LICENSES, INC.)
- KUPD (97.9 FM; TEMPE, AZ; Owner: TEMPE RADIO, INC.)
- KJZZ (91.5 FM; PHOENIX, AZ; Owner: MARICOPA COUNTY COMM. COLLEGE DIST.)
- KFLR-FM (90.3 FM; PHOENIX, AZ; Owner: FAMILY LIFE BROADCASTING, INC.)
- KYOT-FM (95.5 FM; PHOENIX, AZ; Owner: AMFM RADIO LICENSES, L.L.C.)
- KMXP (96.9 FM; PHOENIX, AZ; Owner: CITICASTERS LICENSES, L.P.)
- KZZP (104.7 FM; MESA, AZ; Owner: CITICASTERS LICENSES, L.P.)
TV broadcast stations around Cave Creek:
- KAET (Channel 8; PHOENIX, AZ; Owner: ARIZONA BOARD OF REGENTS)
- K55EH (Channel 55; PHOENIX, AZ; Owner: KAZT, L.L.C.)
- K43GV (Channel 43; PHOENIX, AZ; Owner: TELEVISION APOGEO DE PHOENIX, LLC)
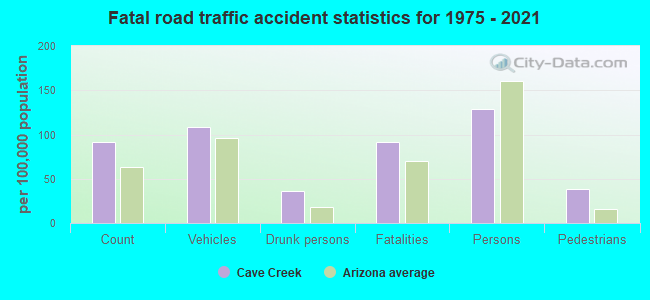
Cave Creek fatal accident list:
Apr 3, 2016 05:27 PM, Cave Creek Rd, School House Rd, Lat: 33.832089, Lon: -111.943269, Vehicles: 2, Persons: 2, Fatalities: 1, Drunk persons involved: 1
Dec 6, 2015 03:35 AM, Cave Creek Rd, Paseo Dulce, Lat: 33.828567, Lon: -111.955128, Vehicles: 1, Persons: 1, Pedestrians: 1, Fatalities: 1
Feb 22, 2009 07:27 PM, Cave Creek Rd, Lat: 33.833033, Lon: -111.939972, Vehicles: 1, Persons: 1, Fatalities: 1, Drunk persons involved: 1
Jan 27, 2007 12:30 AM, Carefree Hwy, Lat: 33.799131, Lon: -111.970231, Vehicles: 1, Persons: 2, Pedestrians: 1, Fatalities: 1
- National Bridge Inventory (NBI) Statistics
- 3Number of bridges
- 23ft / 6.8mTotal length
- $1,000Total costs
- 21,311Total average daily traffic
- 2,401Total average daily truck traffic
- 21,341Total future (year 2037) average daily traffic
FCC Registered Cell Phone Towers:
3- Cave Creek: 7005 East Cave Creek Road (Lat: 33.828833 Lon: -111.930167), Type: Mast, Structure height: 18.9 m, Overall height: 21.6 m, Call Sign: KNKA303
Assigned Frequencies: 869.040 MHz, 824.040 MHz, 890.010 MHz, 845.010 MHzGrant Date: 01/05/2016, Expiration Date: 02/09/2026, Certifier: Gregory M RomanoRegistrant: Verizon Wireless, 5055 North Point Pkwy, Np2ne Network Engineering, Alpharetta, GA 30022, Phone: (770) 797-1070, Fax: (202) 783-5851, Email:
- School House Site 38443 N School House Rd (Lat: 33.835222 Lon: -111.942333), Type: Pole, Structure height: 9.1 m, Call Sign: KNKA303
Assigned Frequencies: 869.040 MHz, 869.040 MHz, 869.040 MHz, 824.040 MHz, 824.040 MHz, 824.040 MHz, 890.010 MHz, 890.010 MHz, 890.010 MHz, 845.010 MHz, 845.010 MHz, 845.010 MHzGrant Date: 01/05/2016, Expiration Date: 02/09/2026, Certifier: Gregory M RomanoRegistrant: Verizon Wireless, 5055 North Point Pkwy, Np2ne Network Engineering, Alpharetta, GA 30022, Phone: (770) 797-1070, Fax: (202) 783-5851, Email:
- School House Site 38443 N School House Rd (Lat: 33.835222 Lon: -111.942333), Type: Pole, Structure height: 9.4 m, Call Sign: KNKA205
Assigned Frequencies: 880.020 MHz, 880.020 MHz, 880.020 MHz, 835.020 MHz, 835.020 MHz, 835.020 MHz, 891.510 MHz, 891.510 MHz, 891.510 MHz, 846.510 MHz, 846.510 MHz, 846.510 MHzGrant Date: 08/26/2014, Expiration Date: 10/01/2024, Certifier: Gregory M RomanoRegistrant: Verizon, 1300 I St Nw - Suite 500 East, Washington, DC 20005, Phone: (202) 515-2453, Email:
FCC Registered Private Land Mobile Towers:
2 (See the full list of FCC Registered Private Land Mobile Towers in Cave Creek, AZ)FCC Registered Broadcast Land Mobile Towers:
14 (See the full list of FCC Registered Broadcast Land Mobile Towers)FCC Registered Microwave Towers:
29 (See the full list of FCC Registered Microwave Towers in this town)FCC Registered Amateur Radio Licenses:
245 (See the full list of FCC Registered Amateur Radio Licenses in Cave Creek)FAA Registered Aircraft Manufacturers and Dealers:
3 (See the full list of FAA Registered Manufacturers and Dealers in Cave Creek)FAA Registered Aircraft:
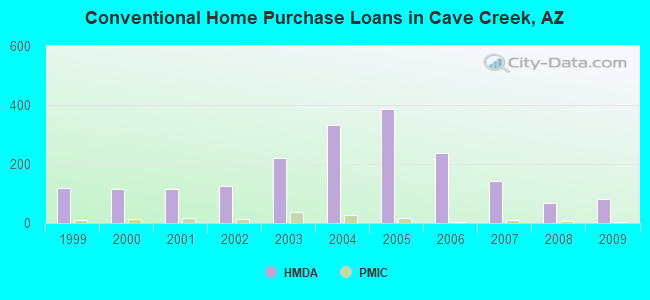
95 (See the full list of FAA Registered Aircraft)| Home Mortgage Disclosure Act Aggregated Statistics For Year 2009 (Based on 2 partial tracts) | ||||||||||||
| A) FHA, FSA/RHS & VA Home Purchase Loans | B) Conventional Home Purchase Loans | C) Refinancings | D) Home Improvement Loans | F) Non-occupant Loans on < 5 Family Dwellings (A B C & D) | G) Loans On Manufactured Home Dwelling (A B C & D) | |||||||
|---|---|---|---|---|---|---|---|---|---|---|---|---|
| Number | Average Value | Number | Average Value | Number | Average Value | Number | Average Value | Number | Average Value | Number | Average Value | |
| LOANS ORIGINATED | 17 | $250,284 | 80 | $374,080 | 224 | $323,392 | 5 | $336,818 | 48 | $357,076 | 7 | $141,929 |
| APPLICATIONS APPROVED, NOT ACCEPTED | 1 | $263,300 | 10 | $501,975 | 30 | $331,774 | 2 | $146,730 | 4 | $450,158 | 1 | $241,690 |
| APPLICATIONS DENIED | 6 | $196,730 | 15 | $454,407 | 105 | $405,158 | 5 | $217,488 | 20 | $365,748 | 4 | $121,945 |
| APPLICATIONS WITHDRAWN | 2 | $271,355 | 11 | $410,955 | 47 | $324,727 | 2 | $196,445 | 7 | $425,761 | 1 | $209,100 |
| FILES CLOSED FOR INCOMPLETENESS | 0 | $0 | 3 | $402,747 | 13 | $281,352 | 1 | $67,770 | 1 | $420,970 | 0 | $0 |
Detailed HMDA statistics for the following Tracts: 0303.77 , 0304.00
| Private Mortgage Insurance Companies Aggregated Statistics For Year 2009 (Based on 2 partial tracts) | ||||||
| A) Conventional Home Purchase Loans | B) Refinancings | C) Non-occupant Loans on < 5 Family Dwellings (A & B) | ||||
|---|---|---|---|---|---|---|
| Number | Average Value | Number | Average Value | Number | Average Value | |
| LOANS ORIGINATED | 5 | $314,120 | 1 | $150,140 | 0 | $0 |
| APPLICATIONS APPROVED, NOT ACCEPTED | 3 | $214,990 | 0 | $0 | 1 | $206,670 |
| APPLICATIONS DENIED | 1 | $264,190 | 0 | $0 | 0 | $0 |
| APPLICATIONS WITHDRAWN | 0 | $0 | 0 | $0 | 0 | $0 |
| FILES CLOSED FOR INCOMPLETENESS | 0 | $0 | 0 | $0 | 0 | $0 |
Detailed PMIC statistics for the following Tracts: 0303.77 , 0304.00
| Most common first names in Cave Creek, AZ among deceased individuals | ||
| Name | Count | Lived (average) |
|---|---|---|
| John | 62 | 72.9 years |
| Robert | 50 | 72.3 years |
| James | 37 | 70.4 years |
| Mary | 36 | 80.6 years |
| William | 32 | 73.2 years |
| Helen | 28 | 83.3 years |
| Charles | 28 | 75.5 years |
| Richard | 26 | 72.2 years |
| Edward | 21 | 71.4 years |
| Dorothy | 21 | 83.5 years |
| Most common last names in Cave Creek, AZ among deceased individuals | ||
| Last name | Count | Lived (average) |
|---|---|---|
| Smith | 16 | 75.4 years |
| Johnson | 13 | 75.3 years |
| Davis | 12 | 78.9 years |
| Williams | 12 | 75.1 years |
| Miller | 10 | 79.9 years |
| Brown | 10 | 70.4 years |
| Adams | 9 | 83.5 years |
| Clark | 7 | 77.1 years |
| Cook | 6 | 74.0 years |
| Anderson | 5 | 73.6 years |
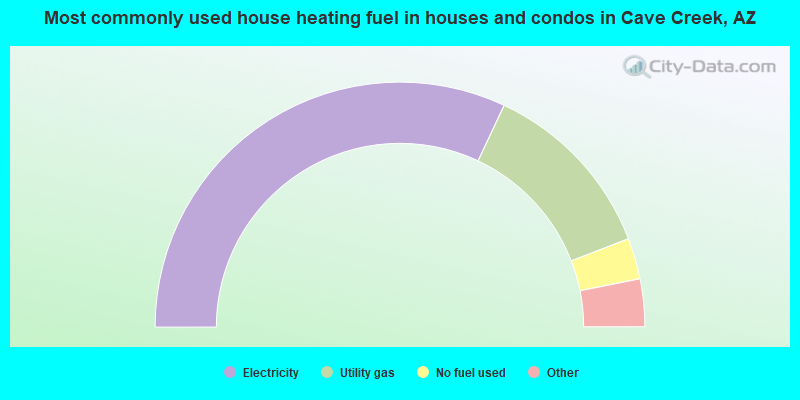
- 64.0%Electricity
- 24.3%Utility gas
- 5.4%No fuel used
- 2.6%Bottled, tank, or LP gas
- 2.3%Solar energy
- 1.3%Wood
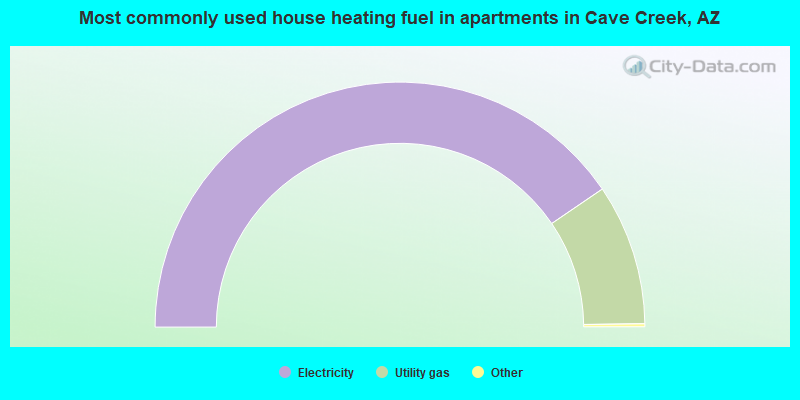
- 81.3%Electricity
- 18.7%Utility gas
Cave Creek compared to Arizona state average:
- Median house value significantly above state average.
- Unemployed percentage significantly below state average.
- Hispanic race population percentage significantly below state average.
- Median age significantly above state average.
- Renting percentage below state average.
- Length of stay since moving in above state average.
- Percentage of population with a bachelor's degree or higher above state average.
Cave Creek on our top lists:
- #8 on the list of "Top 101 cities with largest percentage of females in occupations: health diagnosing and treating practitioners and other technical occupations (population 5,000+)"
- #20 on the list of "Top 101 cities with largest percentage of males in occupations: management occupations (population 5,000+)"
- #49 on the list of "Top 101 cities with the most residents born in France (population 500+)"
- #50 on the list of "Top 101 cities with the lowest percentage of single-parent households, population 5,000+"
- #58 on the list of "Top 101 cities with largest percentage of males in occupations: business and financial operations occupations (population 5,000+)"
- #70 on the list of "Top 101 cities with largest percentage of males in industries: finance and insurance (population 5,000+)"
- #84 on the list of "Top 101 cities with largest percentage of females in occupations: transportation occupations (population 5,000+)"
- #99 on the list of "Top 101 cities with the most residents born in Sweden (population 500+)"
- #2 on the list of "Top 101 counties with the highest Nitrogen Dioxide air pollution readings in 2012 (ppm)"
- #3 on the list of "Top 101 counties with the highest total withdrawal of fresh water for public supply"
- #3 on the list of "Top 101 counties with the highest surface withdrawal of fresh water for public supply"
- #4 on the list of "Top 101 counties with the most Other congregations"
- #5 on the list of "Top 101 counties with the most Evangelical Protestant adherents (pop. 50,000+)"

|
|
Total of 548 patent applications in 2008-2024.