Percentage of residents living in poverty in 2022: 14.1%
(15.0% for White Non-Hispanic residents, 6.7% for Black residents, 4.6% for two or more races residents)
According to our research of Indiana and other state lists, there were 2 registered sex offenders living in Chesterfield, Indiana as of June 20, 2024. The ratio of all residents to sex offenders in Chesterfield is 1,275 to 1. The ratio of registered sex offenders to all residents in this city is lower than the state average.
Crime rates in Chesterfield by year
Type
2009
2010
2011
2012
2013
Murders (per 100,000)
0 (0.0)
0 (0.0)
1 (39.1)
0 (0.0)
0 (0.0)
Rapes (per 100,000)
0 (0.0)
1 (39.3)
0 (0.0)
0 (0.0)
0 (0.0)
Robberies (per 100,000)
0 (0.0)
1 (39.3)
0 (0.0)
0 (0.0)
0 (0.0)
Assaults (per 100,000)
8 (292.7)
9 (353.4)
1 (39.1)
7 (274.5)
1 (39.9)
Burglaries (per 100,000)
12 (439.1)
5 (196.3)
4 (156.2)
6 (235.3)
5 (199.4)
Thefts (per 100,000)
47 (1,720)
57 (2,238)
42 (1,641)
69 (2,706)
43 (1,715)
Auto thefts (per 100,000)
3 (109.8)
5 (196.3)
3 (117.2)
3 (117.6)
3 (119.6)
Arson (per 100,000)
0 (0.0)
0 (0.0)
0 (0.0)
0 (0.0)
0 (0.0)
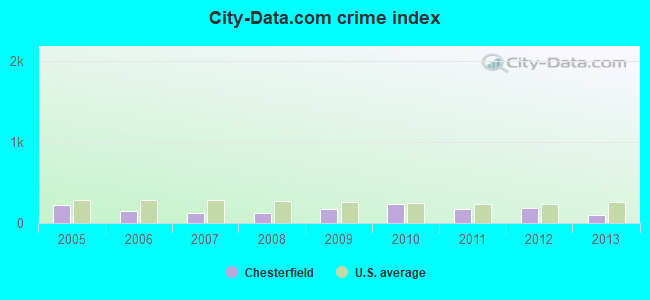
City-Data.com crime index
166.8
232.8
171.9
189.0
100.1
The City-Data.com crime index weighs serious crimes and violent crimes more heavily. Higher means more crime, U.S. average is 246.1. It adjusts for the number of visitors and daily workers commuting into cities.
Latest news from Chesterfield, IN collected exclusively by city-data.com from local newspapers, TV, and radio stations
Ancestries: American (21.1%), German (15.5%), Irish (11.3%), English (6.0%), European (3.6%), Scotch-Irish (1.2%).
Current Local Time: EST time zone
Elevation: 908 feet
Land area: 1.15 square miles.
Population density: 2,176 people per square mile (low).
32 residents are foreign born
This town:
1.2%
Indiana:
5.6%
Median real estate property taxes paid for housing units with mortgages in 2022: $899 (0.8%) Median real estate property taxes paid for housing units with no mortgage in 2022: $489 (0.7%)
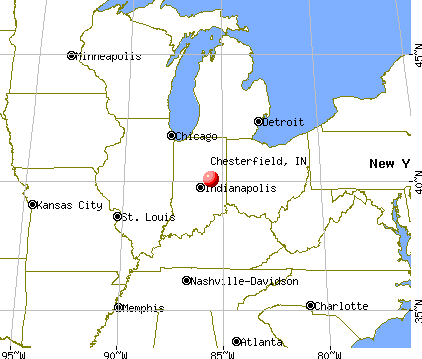
Nearest city with pop. 50,000+: Anderson, IN (4.6 miles , pop. 59,734).
Nearest city with pop. 200,000+: Indianapolis, IN (36.7 miles , pop. 781,870).
Nearest city with pop. 1,000,000+: Chicago, IL (161.6 miles , pop. 2,896,016).
Air Quality Index (AQI) level in 2023 was 93.9. This is worse than average.
City:
93.9
U.S.:
72.6
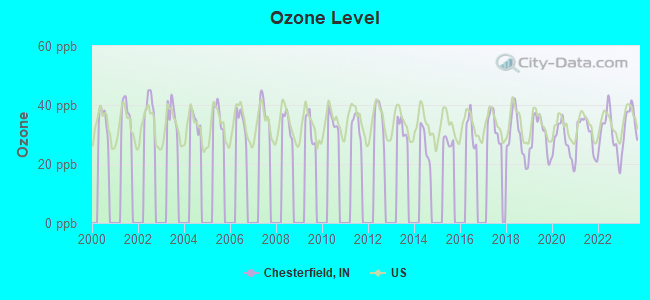
Ozone [ppb] level in 2023 was 33.8. This is about average.Closest monitor was 3.1 miles away from the city center.
City:
33.8
U.S.:
33.3
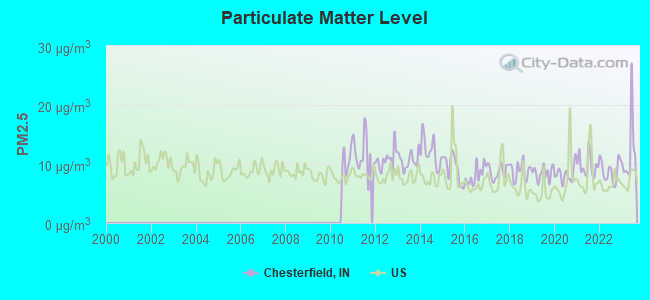
Particulate Matter (PM2.5) [µg/m3] level in 2023 was 11.9. This is significantly worse than average.Closest monitor was 3.1 miles away from the city center.
City:
11.9
U.S.:
8.1
Tornado activity:
Chesterfield-area historical tornado activity is slightly above Indiana state average. It is 125% greater than the overall U.S. average.
On 5/14/1972, a category F4 (max. wind speeds 207-260 mph) tornado 8.1 miles away from the Chesterfield town center injured 20 peopleand causedbetween $50,000 and $500,000 in damages.
On 4/3/1974, a category F4 tornado 12.0 miles away from the town center injured 17 peopleand causedbetween $5,000,000 and $50,000,000 in damages.
Earthquake activity:
Chesterfield-area historical earthquake activity is significantly above Indiana state average. It is 32% greater than the overall U.S. average.
On 4/18/2008 at 09:36:59, a magnitude 5.4 (5.1 MB, 4.8 MS, 5.4 MW, 5.2 MW, Class: Moderate, Intensity: VI - VII) earthquake occurred 168.0 miles away from the city center On 7/27/1980 at 18:52:21, a magnitude 5.2 (5.1 MB, 4.7 MS, 5.0 UK, 5.2 UK) earthquake occurred 158.9 miles away from the city center On 4/18/2008 at 09:36:59, a magnitude 5.2 (5.2 MW, Depth: 8.9 mi) earthquake occurred 168.0 miles away from the city center On 6/10/1987 at 23:48:54, a magnitude 5.1 (4.9 MB, 4.4 MS, 4.6 MS, 5.1 LG) earthquake occurred 151.4 miles away from Chesterfield center On 7/12/1986 at 08:19:37, a magnitude 4.5 (4.5 MB, Class: Light, Intensity: IV - V) earthquake occurred 71.0 miles away from Chesterfield center On 6/18/2002 at 17:37:15, a magnitude 5.0 (4.3 MB, 4.6 MW, 5.0 LG) earthquake occurred 188.0 miles away from Chesterfield center Magnitude types: regional Lg-wave magnitude (LG), body-wave magnitude (MB), surface-wave magnitude (MS), moment magnitude (MW)
Natural disasters:
The number of natural disasters in Madison County (18) is near the US average (15). Major Disasters (Presidential) Declared: 12 Emergencies Declared: 5
Causes of natural disasters: Storms: 9, Floods: 8, Tornadoes: 6, Winter Storms: 3, Snows: 2, Snowstorms: 2, Blizzard: 1, Hurricane: 1, Ice Storm: 1, Other: 1 (Note: some incidents may be assigned to more than one category).
Hospitals and medical centers in Chesterfield:
CARDINAL SERVICE MGMT, INC (23 SKYVIEW DR)
CJ'S ABUNDANT CARE (523 W PLUM ST)
MILLER'S MERRY MANOR (524 ANDERSON RD)
Colleges/universities with over 2000 students nearest to Chesterfield:
Anderson University (about 4 miles; Anderson, IN; Full-time enrollment: 2,378)
Ball State University (about 12 miles; Muncie, IN; FT enrollment: 20,254)
Taylor University (about 25 miles; Upland, IN; FT enrollment: 2,272)
Indiana Wesleyan University (about 29 miles; Marion, IN; FT enrollment: 13,681)
ITT Technical Institute-Indianapolis (about 36 miles; Indianapolis, IN; FT enrollment: 4,765)
Butler University (about 36 miles; Indianapolis, IN; FT enrollment: 4,388)
Ivy Tech Community College (about 37 miles; Indianapolis, IN; FT enrollment: 71,493)
Madison County has a predicted average indoor radon screening level greater than 4 pCi/L (pico curies per liter) - Highest Potential
Drinking water stations with addresses in Chesterfield and their reported violations in the past:
CHESTERFIELD WATER DEPARTMENT (Population served: 2,800, Groundwater):
Past monitoring violations:
One minor monitoring violation
One regular monitoring violation
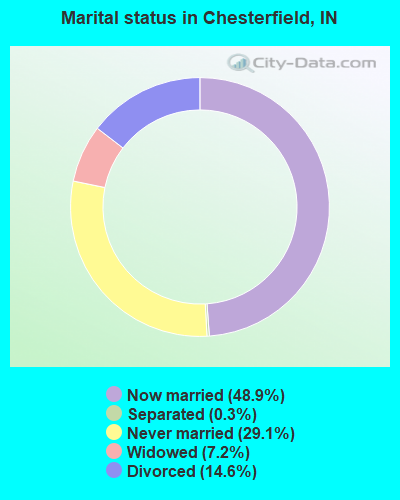
Average household size:
This town:
2.3 people
Indiana:
2.5 people
Percentage of family households:
This town:
60.8%
Whole state:
66.9%
Percentage of households with unmarried partners:
This town:
8.6%
Whole state:
6.9%
Likely homosexual households (counted as self-reported same-sex unmarried-partner households)
Lesbian couples: 0.3% of all households
Gay men: 0.5% of all households
51 people in nursing facilities/skilled-nursing facilities in 2010
8 people in group homes intended for adults in 2010
56 people in nursing homes in 2000
Banks with branches in Chesterfield (2011 data):
PNC Bank, National Association: Chesterfield Branch at 221 Federal Drive, branch established on 1955/12/02. Info updated 2012/03/20: Bank assets: $263,309.6 mil, Deposits: $197,343.0 mil, headquarters in Wilmington, DE, positive income, Commercial Lending Specialization, 3085 total offices, Holding Company: Pnc Financial Services Group, Inc., The
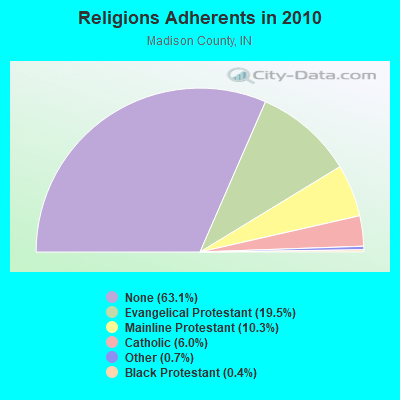
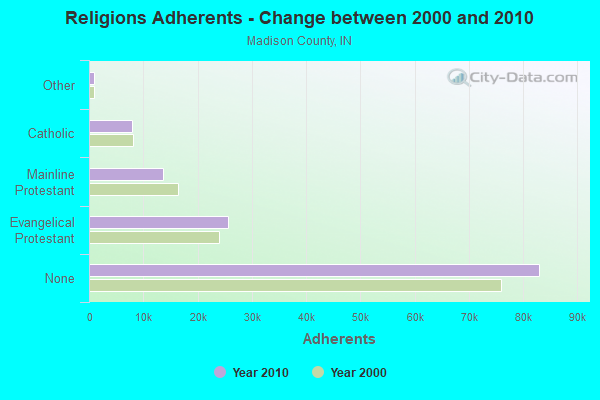
Religion statistics for Chesterfield, IN (based on Madison County data)
Religion
Adherents
Congregations
Evangelical Protestant
25,695
121
Mainline Protestant
13,624
51
Catholic
7,867
4
Other
934
10
Black Protestant
504
5
None
83,012
-
Source: Clifford Grammich, Kirk Hadaway, Richard Houseal, Dale E.Jones, Alexei Krindatch, Richie Stanley and Richard H.Taylor. 2012. 2010 U.S.Religion Census: Religious Congregations & Membership Study. Association of Statisticians of American Religious Bodies. Jones, Dale E., et al. 2002. Congregations and Membership in the United States 2000. Nashville, TN: Glenmary Research Center. Graphs represent county-level data
Cr Right Of Way Along Sr 37 1/2 Mi W (Lat: 40.110556 Lon: -85.587861), Type: Pole, Structure height: 7.6 m, Overall height: 10.7 m, Call Sign: WZH608, Assigned Frequencies: 160.800 MHz, Grant Date: 02/22/2024, Expiration Date: 04/21/2034, Certifier: Rae A Greene, Registrant: Csx Transportation, 6735 Southpoint Dr S, Suite 400, Jacksonville, FL 32216, Phone: (904) 279-6938, Email:
FCC Registered Microwave Towers:
2
HIGHLAND HGH, 2108 E. County Rd (Lat: 40.136250 Lon: -85.629389), Type: Tower, Structure height: 39.6 m, Call Sign: WQAH650, Assigned Frequencies: 19620.0 MHz, Grant Date: 06/02/2004, Expiration Date: 06/02/2014, Cancellation Date: 08/02/2014, Certifier: Joseph Cronk, Registrant: Comsearch, 19700 Janelia Farm Boulevard, Ashburn, VA 20147, Phone: (703) 726-5671, Fax: (703) 726-5594, Email:
Highland Middle Scho, 2108 E. County Rd (Lat: 40.136250 Lon: -85.629389), Type: Mtower, Structure height: 39.6 m, Call Sign: WQRZ334, Assigned Frequencies: 19475.0 MHz, 19475.0 MHz, 19475.0 MHz, 19475.0 MHz, 19475.0 MHz, 19475.0 MHz, 19475.0 MHz, 19475.0 MHz, Grant Date: 06/28/2023, Expiration Date: 08/19/2033, Certifier: Susan Reed, Registrant: Anderson Community School Corporation, 1600 Hillcrest Ave., Anderson, IN 46011, Phone: (765) 641-2001, Fax: (765) 641-2012, Email:
Aircraft: HILDEBRAND BRIAN KR-2 (Category: Land, Seats: 2, Weight: Up to 12,499 Pounds), Engine: AMA/EXPR UNKNOWN ENG (Reciprocating) N-Number: 8BH, N8BH, N-8BH, Serial Number: 6434, Year manufactured: 1984, Airworthiness Date: 06/14/1984, Certificate Issue Date: 07/25/1984 Registrant (Individual): Brian R Hildebrand, Po Box 23, Chesterfield, IN 46017
Aircraft: PIPER PA-30 (Category: Land, Engines: 2, Seats: 6, Weight: Up to 12,499 Pounds, Speed: 139 mph), Engine: LYCOMING IO-320 SERIES (150 HP) (Reciprocating) N-Number: 7751Y, N7751Y, N-7751Y, Serial Number: 30-839, Year manufactured: 1965, Airworthiness Date: 07/12/1965, Certificate Issue Date: 12/17/2008 Registrant (Individual): Jeffrey C Barrett, 121 Gaywood Dr, Chesterfield, IN 46017 Deregistered:Cancel Date: 07/10/2019
Home Mortgage Disclosure Act Aggregated Statistics For Year 2009 (Based on 1 partial tract)
A) FHA, FSA/RHS & VA Home Purchase Loans
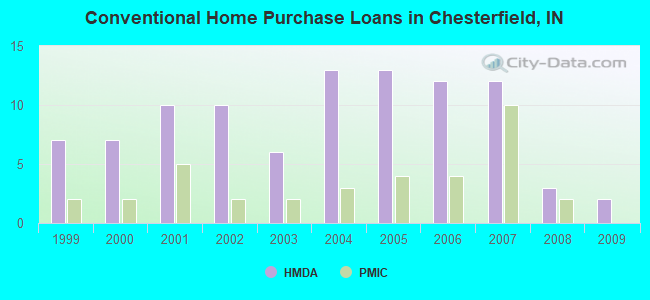
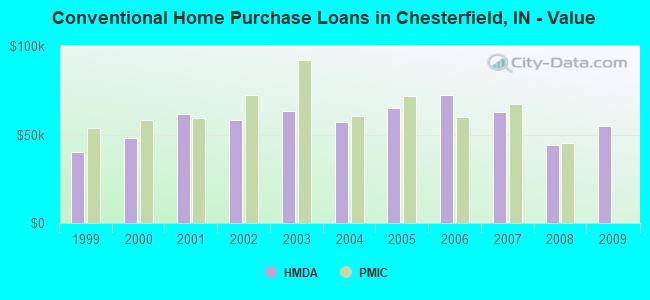
B) Conventional Home Purchase Loans
C) Refinancings
D) Home Improvement Loans
F) Non-occupant Loans on < 5 Family Dwellings (A B C & D)
Number
Average Value
Number
Average Value
Number
Average Value
Number
Average Value
Number
Average Value
LOANS ORIGINATED
7
$61,344
2
$55,030
10
$74,317
1
$24,410
2
$77,240
APPLICATIONS APPROVED, NOT ACCEPTED
0
$0
0
$0
2
$74,635
0
$0
0
$0
APPLICATIONS DENIED
1
$58,030
0
$0
6
$81,708
3
$6,537
0
$0
APPLICATIONS WITHDRAWN
0
$0
0
$0
2
$105,255
0
$0
0
$0
FILES CLOSED FOR INCOMPLETENESS
0
$0
0
$0
0
$0
0
$0
0
$0
Aggregated Statistics For Year 2008 (Based on 1 partial tract)
A) FHA, FSA/RHS & VA Home Purchase Loans
B) Conventional Home Purchase Loans
C) Refinancings
D) Home Improvement Loans
F) Non-occupant Loans on < 5 Family Dwellings (A B C & D)
Number
Average Value
Number
Average Value
Number
Average Value
Number
Average Value
Number
Average Value
LOANS ORIGINATED
3
$49,623
3
$43,890
11
$71,235
1
$9,200
2
$63,830
APPLICATIONS APPROVED, NOT ACCEPTED
0
$0
0
$0
0
$0
1
$15,610
0
$0
APPLICATIONS DENIED
0
$0
1
$32,820
11
$78,003
4
$31,915
1
$36,820
APPLICATIONS WITHDRAWN
0
$0
1
$50,030
5
$91,086
0
$0
0
$0
FILES CLOSED FOR INCOMPLETENESS
0
$0
0
$0
0
$0
0
$0
0
$0
Aggregated Statistics For Year 2007 (Based on 1 partial tract)
A) FHA, FSA/RHS & VA Home Purchase Loans
B) Conventional Home Purchase Loans
C) Refinancings
D) Home Improvement Loans
F) Non-occupant Loans on < 5 Family Dwellings (A B C & D)
G) Loans On Manufactured Home Dwelling (A B C & D)
Number
Average Value
Number
Average Value
Number
Average Value
Number
Average Value
Number
Average Value
Number
Average Value
LOANS ORIGINATED
2
$87,245
12
$62,832
16
$64,782
3
$14,273
4
$57,530
0
$0
APPLICATIONS APPROVED, NOT ACCEPTED
0
$0
1
$58,030
3
$62,430
0
$0
0
$0
0
$0
APPLICATIONS DENIED
0
$0
3
$58,030
12
$76,238
5
$30,096
1
$54,430
1
$9,600
APPLICATIONS WITHDRAWN
0
$0
0
$0
5
$70,516
1
$34,820
0
$0
0
$0
FILES CLOSED FOR INCOMPLETENESS
0
$0
0
$0
2
$82,840
0
$0
0
$0
0
$0
Aggregated Statistics For Year 2006 (Based on 1 partial tract)
A) FHA, FSA/RHS & VA Home Purchase Loans
B) Conventional Home Purchase Loans
C) Refinancings
D) Home Improvement Loans
F) Non-occupant Loans on < 5 Family Dwellings (A B C & D)
G) Loans On Manufactured Home Dwelling (A B C & D)
Number
Average Value
Number
Average Value
Number
Average Value
Number
Average Value
Number
Average Value
Number
Average Value
LOANS ORIGINATED
3
$64,300
12
$72,236
15
$71,769
2
$20,810
2
$53,225
1
$56,430
APPLICATIONS APPROVED, NOT ACCEPTED
0
$0
1
$64,830
5
$85,402
2
$14,805
0
$0
0
$0
APPLICATIONS DENIED
0
$0
4
$47,422
18
$68,368
4
$25,912
1
$56,430
1
$20,010
APPLICATIONS WITHDRAWN
0
$0
2
$50,425
10
$79,960
0
$0
0
$0
0
$0
FILES CLOSED FOR INCOMPLETENESS
0
$0
1
$77,640
4
$83,542
0
$0
0
$0
0
$0
Aggregated Statistics For Year 2005 (Based on 1 partial tract)
A) FHA, FSA/RHS & VA Home Purchase Loans
B) Conventional Home Purchase Loans
C) Refinancings
D) Home Improvement Loans
F) Non-occupant Loans on < 5 Family Dwellings (A B C & D)
G) Loans On Manufactured Home Dwelling (A B C & D)
Number
Average Value
Number
Average Value
Number
Average Value
Number
Average Value
Number
Average Value
Number
Average Value
LOANS ORIGINATED
4
$63,932
13
$64,709
22
$68,070
4
$39,220
3
$52,960
1
$50,830
APPLICATIONS APPROVED, NOT ACCEPTED
0
$0
1
$67,630
7
$90,960
1
$39,220
0
$0
0
$0
APPLICATIONS DENIED
1
$55,630
2
$84,840
20
$72,416
4
$36,118
1
$124,860
0
$0
APPLICATIONS WITHDRAWN
0
$0
2
$56,030
9
$96,137
1
$125,660
1
$31,620
0
$0
FILES CLOSED FOR INCOMPLETENESS
0
$0
0
$0
3
$97,917
0
$0
0
$0
0
$0
Aggregated Statistics For Year 2004 (Based on 1 partial tract)
A) FHA, FSA/RHS & VA Home Purchase Loans
B) Conventional Home Purchase Loans
C) Refinancings
D) Home Improvement Loans
F) Non-occupant Loans on < 5 Family Dwellings (A B C & D)
G) Loans On Manufactured Home Dwelling (A B C & D)
Number
Average Value
Number
Average Value
Number
Average Value
Number
Average Value
Number
Average Value
Number
Average Value
LOANS ORIGINATED
6
$74,037
13
$56,890
32
$68,334
3
$19,610
5
$38,740
0
$0
APPLICATIONS APPROVED, NOT ACCEPTED
1
$43,220
3
$38,420
8
$83,091
1
$5,600
0
$0
1
$27,210
APPLICATIONS DENIED
1
$75,240
4
$50,125
16
$78,539
1
$17,210
2
$51,425
2
$31,215
APPLICATIONS WITHDRAWN
0
$0
0
$0
12
$94,381
0
$0
1
$60,030
0
$0
FILES CLOSED FOR INCOMPLETENESS
0
$0
0
$0
3
$87,243
1
$20,810
0
$0
0
$0
Aggregated Statistics For Year 2003 (Based on 1 partial tract)
A) FHA, FSA/RHS & VA Home Purchase Loans
B) Conventional Home Purchase Loans
C) Refinancings
D) Home Improvement Loans
F) Non-occupant Loans on < 5 Family Dwellings (A B C & D)
Number
Average Value
Number
Average Value
Number
Average Value
Number
Average Value
Number
Average Value
LOANS ORIGINATED
4
$70,435
6
$63,432
45
$62,947
4
$13,908
4
$47,322
APPLICATIONS APPROVED, NOT ACCEPTED
1
$54,030
0
$0
5
$64,832
1
$18,410
0
$0
APPLICATIONS DENIED
1
$94,850
1
$58,030
20
$59,410
4
$13,508
1
$58,830
APPLICATIONS WITHDRAWN
0
$0
2
$55,230
10
$77,399
1
$5,600
0
$0
FILES CLOSED FOR INCOMPLETENESS
0
$0
1
$67,230
1
$96,850
0
$0
0
$0
Aggregated Statistics For Year 2002 (Based on 1 partial tract)
A) FHA, FSA/RHS & VA Home Purchase Loans
B) Conventional Home Purchase Loans
C) Refinancings
D) Home Improvement Loans
F) Non-occupant Loans on < 5 Family Dwellings (A B C & D)
Number
Average Value
Number
Average Value
Number
Average Value
Number
Average Value
Number
Average Value
LOANS ORIGINATED
8
$63,481
10
$58,229
34
$66,174
4
$8,705
3
$44,957
APPLICATIONS APPROVED, NOT ACCEPTED
0
$0
1
$16,010
7
$64,031
0
$0
0
$0
APPLICATIONS DENIED
1
$60,030
5
$30,576
17
$56,828
7
$10,920
1
$34,020
APPLICATIONS WITHDRAWN
0
$0
0
$0
8
$75,738
1
$7,200
0
$0
FILES CLOSED FOR INCOMPLETENESS
0
$0
1
$50,030
2
$65,435
0
$0
0
$0
Aggregated Statistics For Year 2001 (Based on 1 partial tract)
A) FHA, FSA/RHS & VA Home Purchase Loans
B) Conventional Home Purchase Loans
C) Refinancings
D) Home Improvement Loans
F) Non-occupant Loans on < 5 Family Dwellings (A B C & D)
Number
Average Value
Number
Average Value
Number
Average Value
Number
Average Value
Number
Average Value
LOANS ORIGINATED
10
$77,719
10
$61,831
36
$64,743
9
$7,782
3
$42,687
APPLICATIONS APPROVED, NOT ACCEPTED
0
$0
3
$68,300
8
$61,281
1
$54,030
0
$0
APPLICATIONS DENIED
1
$48,020
7
$38,763
20
$60,990
9
$11,072
1
$27,610
APPLICATIONS WITHDRAWN
1
$70,440
2
$55,230
10
$71,876
2
$15,010
0
$0
FILES CLOSED FOR INCOMPLETENESS
0
$0
0
$0
1
$126,860
0
$0
0
$0
Aggregated Statistics For Year 2000 (Based on 1 partial tract)
A) FHA, FSA/RHS & VA Home Purchase Loans
B) Conventional Home Purchase Loans
C) Refinancings
D) Home Improvement Loans
F) Non-occupant Loans on < 5 Family Dwellings (A B C & D)
Number
Average Value
Number
Average Value
Number
Average Value
Number
Average Value
Number
Average Value
LOANS ORIGINATED
8
$62,431
7
$47,853
16
$60,080
8
$12,206
2
$45,225
APPLICATIONS APPROVED, NOT ACCEPTED
0
$0
1
$20,810
7
$53,856
4
$11,705
0
$0
APPLICATIONS DENIED
0
$0
7
$34,131
14
$55,028
8
$8,905
0
$0
APPLICATIONS WITHDRAWN
0
$0
2
$65,435
5
$56,908
1
$4,400
0
$0
FILES CLOSED FOR INCOMPLETENESS
0
$0
0
$0
3
$60,030
0
$0
0
$0
Aggregated Statistics For Year 1999 (Based on 1 partial tract)
A) FHA, FSA/RHS & VA Home Purchase Loans
B) Conventional Home Purchase Loans
C) Refinancings
D) Home Improvement Loans
F) Non-occupant Loans on < 5 Family Dwellings (A B C & D)
Detailed PMIC statistics for the following Tracts:0113.00
2002 - 2018 National Fire Incident Reporting System (NFIRS) incidents
According to the data from the years 2002 - 2018 the average number of fire incidents per year is 32. The highest number of reported fires - 59 took place in 2009, and the least - 2 in 2018. The data has a declining trend.
When looking into fire subcategories, the most reports belonged to: Structure Fires (47.9%), and Outside Fires (31.4%).
Fire incident types reported to NFIRS in Chesterfield, IN


 Recent articles from our blog. Our writers, many of them Ph.D. graduates or candidates, create easy-to-read articles on a wide variety of topics.

 (4.6 miles


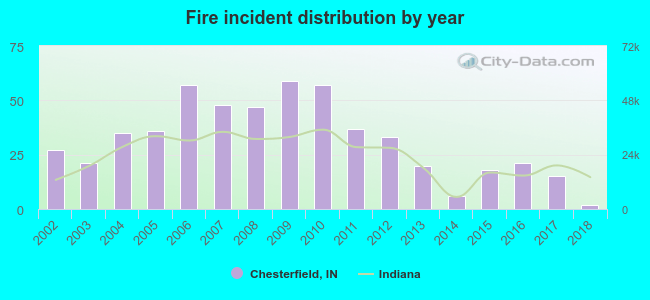 According to the data from the years 2002 - 2018 the average number of fire incidents per year is 32. The highest number of reported fires - 59 took place in 2009, and the least - 2 in 2018. The data has a declining trend.
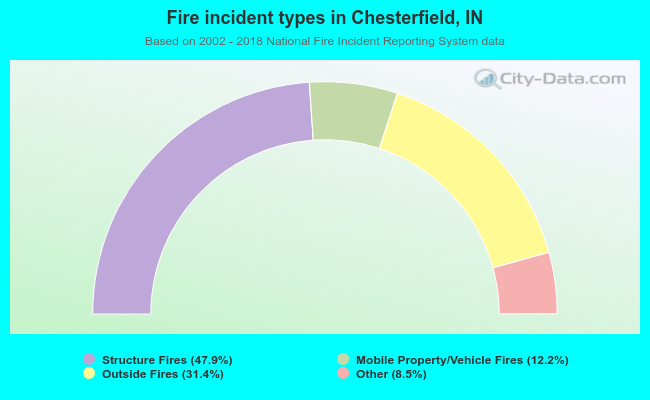 When looking into fire subcategories, the most reports belonged to: Structure Fires (47.9%), and Outside Fires (31.4%).