Childersburg, Alabama
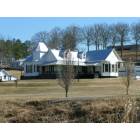
Childersburg: Childersburg Area
Childersburg: Childersburg Area
Childersburg: Childersburg Area
Childersburg: Childersburg Area
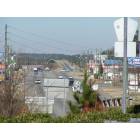
Childersburg: Childersburg Area
Childersburg: Childersburg Area
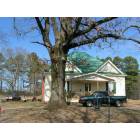
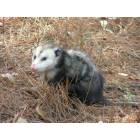
Childersburg: Childersburg Area 2
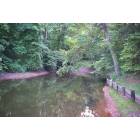
Childersburg: slough at Logan Martin lake near Childersburg
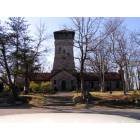
Childersburg: Childersburg Area
Childersburg: Childersburg Area
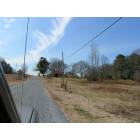
Childersburg: Childersburg Area
- see
47
more - add
your
Submit your own pictures of this city and show them to the world
- OSM Map
- General Map
- Google Map
- MSN Map
Population change since 2000: -5.5%
 |
| Males: 2,303 | |
| Females: 2,353 |
| Median resident age: | 41.4 years |
| Alabama median age: | 39.6 years |
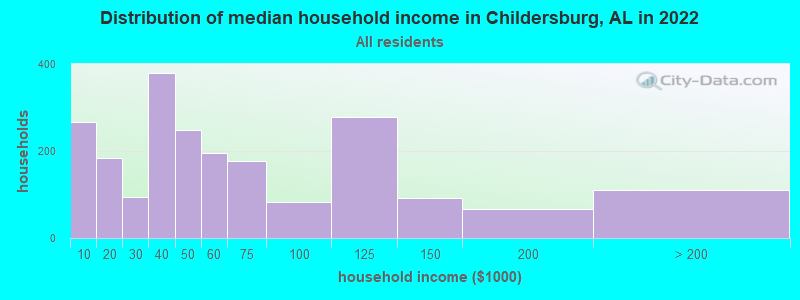
| Childersburg: | $49,315 |
| AL: | $59,674 |
Estimated per capita income in 2022: $32,638 (it was $15,412 in 2000)
Childersburg city income, earnings, and wages data
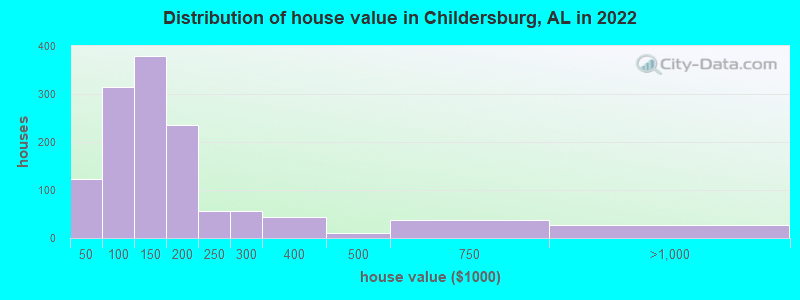
Estimated median house or condo value in 2022: $127,160 (it was $61,900 in 2000)
| Childersburg: | $127,160 |
| AL: | $200,900 |
Mean prices in 2022: all housing units: $164,836; detached houses: $170,321; mobile homes: $123,655
Median gross rent in 2022: $764.
(11.8% for White Non-Hispanic residents, 25.4% for Black residents, 20.8% for two or more races residents)
Detailed information about poverty and poor residents in Childersburg, AL
Compare current foreclosures in Childersburg, AL:
| Photo | Address | Area | Beds / Baths | Price | Details |
|---|---|---|---|---|---|

|
#1
James Garrett Ln
Childersburg, AL 35044
|
1,764 sq. feet
|
2 baths 4 beds |
$139,900
|
show details |

|
#2
13th St SW
Childersburg, AL 35044
|
1,958 sq. feet
|
1 baths - beds |
show details | |

|
#3
Lessor Dr
Childersburg, AL 35044
|
1,226 sq. feet
|
1 baths - beds |
show details | |

|
#4
Green Leaf Ln
Childersburg, AL 35044
|
1,620 sq. feet
|
1 baths - beds |
show details | |

|
#5
Pinecrest Dr
Childersburg, AL 35044
|
1,440 sq. feet
|
- baths - beds |
show details | |

|
#6
Old Sylacauga Hwy Apt 7
Childersburg, AL 35044
|
- sq. feet
|
- baths - beds |
show details | |

|
#7
5th St SW
Childersburg, AL 35044
|
1,678 sq. feet
|
- baths - beds |
show details | |

|
#8
Evans Dr
Childersburg, AL 35044
|
- sq. feet
|
- baths - beds |
show details | |

|
#9
Cooper Dr
Childersburg, AL 35044
|
- sq. feet
|
- baths - beds |
show details | |

|
#10
Parkdale Dr
Childersburg, AL 35044
|
- sq. feet
|
- baths - beds |
show details |
| Photo | Address | Area | Beds / Baths | Price | Details |
|---|---|---|---|---|---|

|
#11
Johnson Acres, O Eli Bronshteyn
Childersburg, AL 35044
|
1,008 sq. feet
|
- baths - beds |
show details | |

|
#12
Cooper Dr
Childersburg, AL 35044
|
1,176 sq. feet
|
- baths - beds |
show details | |

|
#13
7th St SW
Childersburg, AL 35044
|
- sq. feet
|
- baths - beds |
show details | |

|
#14
Lakeside Dr
Childersburg, AL 35044
|
704 sq. feet
|
- baths - beds |
show details | |

|
#15
Mcgowans Ferry Rd
Childersburg, AL 35044
|
1,280 sq. feet
|
- baths - beds |
show details | |

|
#16
Pinecrest Dr
Childersburg, AL 35044
|
924 sq. feet
|
- baths - beds |
show details | |

|
#17
Earl St
Childersburg, AL 35044
|
780 sq. feet
|
- baths - beds |
show details | |

|
#18
Ever Green Ln
Childersburg, AL 35044
|
- sq. feet
|
- baths - beds |
show details | |

|
#19
Desoto Ct
Childersburg, AL 35044
|
- sq. feet
|
- baths - beds |
show details | |

|
#20
Shady Ln
Childersburg, AL 35044
|
1,848 sq. feet
|
- baths - beds |
show details |
| Photo | Address | Area | Beds / Baths | Price | Details |
|---|---|---|---|---|---|

|
#21
River Walk Pkwy
Childersburg, AL 35044
|
1,860 sq. feet
|
- baths - beds |
show details | |

|
#22
Desoto Ct
Childersburg, AL 35044
|
- sq. feet
|
- baths - beds |
show details | |

|
#23
Southern St NW
Childersburg, AL 35044
|
1,620 sq. feet
|
- baths - beds |
show details | |

|
#24
River Walk Pkwy
Childersburg, AL 35044
|
- sq. feet
|
- baths - beds |
show details | |

|
#25
Killough Dr
Childersburg, AL 35044
|
- sq. feet
|
- baths - beds |
show details | |

|
#26
Childersburg Fayette Hwy
Childersburg, AL 35044
|
- sq. feet
|
- baths - beds |
show details | |

|
#27
4th St SE
Childersburg, AL 35044
|
- sq. feet
|
- baths - beds |
show details | |

|
#28
16th Ave NW
Childersburg, AL 35044
|
- sq. feet
|
- baths - beds |
show details | |

|
#29
Desoto Ct # 23dc
Childersburg, AL 35044
|
- sq. feet
|
- baths - beds |
show details | |

|
#30
Kymulga Rd
Childersburg, AL 35044
|
- sq. feet
|
- baths - beds |
show details |
| Photo | Address | Area | Beds / Baths | Price | Details |
|---|---|---|---|---|---|

|
#31
Dale Ln
Childersburg, AL 35044
|
1,200 sq. feet
|
- baths - beds |
show details | |

|
#32
1st St SE
Childersburg, AL 35044
|
- sq. feet
|
- baths - beds |
show details | |

|
#33
Cloverlane Dr
Childersburg, AL 35044
|
- sq. feet
|
- baths - beds |
show details | |

|
#34
Childersburg Fayette Hwy
Childersburg, AL 35044
|
- sq. feet
|
- baths - beds |
show details | |

|
#35
Veazey Cir
Childersburg, AL 35044
|
- sq. feet
|
- baths - beds |
show details | |

|
#36
Eleanor Ter
Childersburg, AL 35044
|
1,313 sq. feet
|
- baths - beds |
show details | |

|
#37
Desoto Caverns Pkwy
Childersburg, AL 35044
|
- sq. feet
|
- baths - beds |
show details | |

|
Check over 1 million property listings on Foreclosure.com!
|
browse all offers | |||


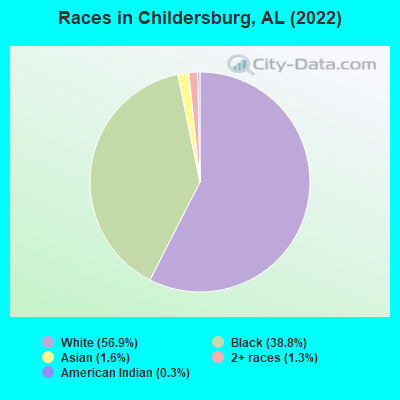
- 2,72356.9%White alone
- 1,85738.8%Black alone
- 761.6%Asian alone
- 621.3%Two or more races
- 130.3%American Indian alone
According to our research of Alabama and other state lists, there were 21 registered sex offenders living in Childersburg, Alabama as of June 16, 2024.
The ratio of all residents to sex offenders in Childersburg is 242 to 1.
Type |
2009 |
2011 |
2012 |
2013 |
2014 |
2015 |
2016 |
2017 |
2018 |
2019 |
2020 |
2021 |
2022 |
|---|---|---|---|---|---|---|---|---|---|---|---|---|---|
| Murders (per 100,000) | 0 (0.0) | 0 (0.0) | 0 (0.0) | 0 (0.0) | 0 (0.0) | 1 (19.8) | 1 (19.9) | 1 (20.1) | 2 (41.1) | 0 (0.0) | 1 (20.8) | 0 (0.0) | 0 (0.0) |
| Rapes (per 100,000) | 1 (20.0) | 0 (0.0) | 0 (0.0) | 0 (0.0) | 0 (0.0) | 1 (19.8) | 2 (39.8) | 4 (80.5) | 1 (20.5) | 3 (61.9) | 4 (83.3) | 0 (0.0) | 0 (0.0) |
| Robberies (per 100,000) | 8 (160.3) | 1 (19.2) | 1 (19.4) | 1 (19.6) | 0 (0.0) | 12 (237.9) | 1 (19.9) | 2 (40.2) | 2 (41.1) | 1 (20.6) | 4 (83.3) | 0 (0.0) | 1 (21.6) |
| Assaults (per 100,000) | 19 (380.7) | 0 (0.0) | 2 (38.7) | 0 (0.0) | 2 (39.4) | 60 (1,190) | 52 (1,035) | 71 (1,429) | 59 (1,211) | 44 (908.0) | 31 (645.3) | 4 (84.3) | 8 (172.7) |
| Burglaries (per 100,000) | 60 (1,202) | 11 (211.5) | 45 (871.6) | 42 (821.8) | 15 (295.7) | 81 (1,606) | 41 (816.2) | 29 (583.5) | 43 (883.0) | 29 (598.4) | 20 (416.3) | 22 (463.5) | 44 (950.1) |
| Thefts (per 100,000) | 142 (2,845) | 34 (653.8) | 68 (1,317) | 59 (1,154) | 15 (295.7) | 224 (4,441) | 159 (3,165) | 143 (2,877) | 141 (2,895) | 78 (1,610) | 69 (1,436) | 51 (1,074) | 49 (1,058) |
| Auto thefts (per 100,000) | 8 (160.3) | 2 (38.5) | 2 (38.7) | 3 (58.7) | 1 (19.7) | 6 (119.0) | 3 (59.7) | 13 (261.6) | 13 (266.9) | 7 (144.4) | 8 (166.5) | 4 (84.3) | 14 (302.3) |
| Arson (per 100,000) | 0 (0.0) | 0 (0.0) | 0 (0.0) | 0 (0.0) | 0 (0.0) | 0 (0.0) | 0 (0.0) | 0 (0.0) | 0 (0.0) | 0 (0.0) | 0 (0.0) | 0 (0.0) | 0 (0.0) |
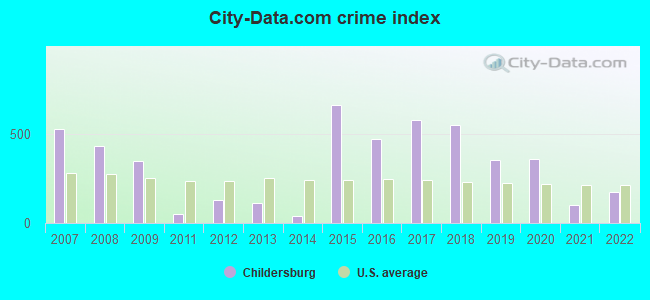
| City-Data.com crime index | 351.0 | 49.8 | 130.4 | 114.3 | 42.0 | 664.4 | 473.2 | 579.3 | 552.2 | 355.1 | 362.2 | 99.0 | 174.0 |
The City-Data.com crime index weighs serious crimes and violent crimes more heavily. Higher means more crime, U.S. average is 246.1. It adjusts for the number of visitors and daily workers commuting into cities.
Crime rate in Childersburg detailed stats: murders, rapes, robberies, assaults, burglaries, thefts, arson
Full-time law enforcement employees in 2021, including police officers: 14 (13 officers - 13 male; 0 female).
| Officers per 1,000 residents here: | 2.74 |
| Alabama average: | 2.40 |
 Recent articles from our blog. Our writers, many of them Ph.D. graduates or candidates, create easy-to-read articles on a wide variety of topics.

 | Childersburg/Sylacauga area--considering a move from Bham (5 replies) |
| Lawsuit seeks to stop ‘luxury housing’ development in Huntsville (73 replies) |
| 100+ Largest Cities in Alabama (16 replies) |
| Advice on where to move to in Alabama (25 replies) |
| Moving Here? Need Advice? Help Us Help You. (523 replies) |
| Possible move to Childersburg area. Info please? (1 reply) |
Latest news from Childersburg, AL collected exclusively by city-data.com from local newspapers, TV, and radio stations
Ancestries: American (17.8%), English (9.7%), German (8.5%), Irish (3.0%), European (1.7%).
Current Local Time: CST time zone
Elevation: 419 feet
Land area: 7.73 square miles.
Population density: 602 people per square mile (low).
70 residents are foreign born
| This city: | 1.5% |
| Alabama: | 3.5% |
Median real estate property taxes paid for housing units with mortgages in 2022: $600 (0.4%)
Median real estate property taxes paid for housing units with no mortgage in 2022: $532 (0.4%)
Nearest city with pop. 50,000+: Hoover, AL  (27.2 miles , pop. 62,742).
Nearest city with pop. 200,000+: Birmingham, AL (31.7 miles , pop. 242,820).
Nearest city with pop. 1,000,000+: Houston, TX (584.9 miles , pop. 1,953,631).
Nearest cities:
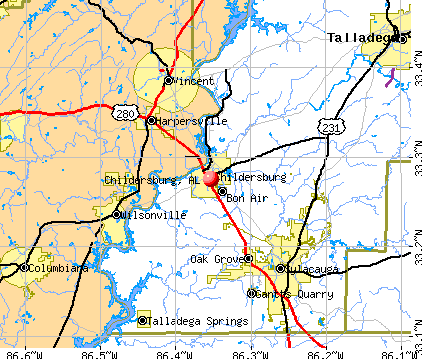
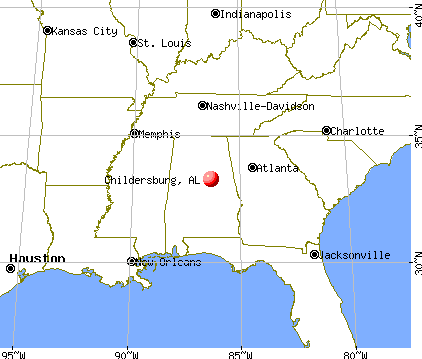
), ), )Latitude: 33.28 N, Longitude: 86.35 W
Area code: 256

Childersburg tourist attractions:
Childersburg, Alabama accommodation & food services, waste management - Economy and Business Data
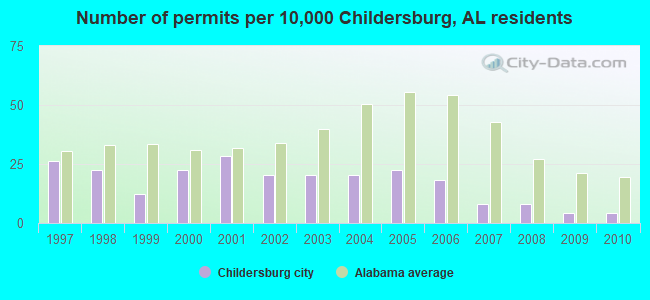
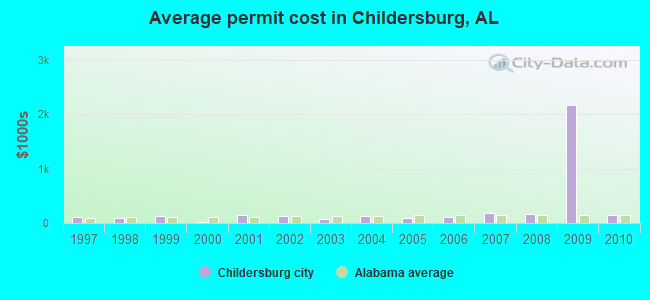
Single-family new house construction building permits:
- 2010: 2 buildings, average cost: $137,500
- 2009: 2 buildings, average cost: $2,170,000
- 2008: 4 buildings, average cost: $161,500
- 2007: 4 buildings, average cost: $182,500
- 2006: 9 buildings, average cost: $107,900
- 2005: 11 buildings, average cost: $94,000
- 2004: 10 buildings, average cost: $131,300
- 2003: 10 buildings, average cost: $81,800
- 2002: 10 buildings, average cost: $123,100
- 2001: 14 buildings, average cost: $155,900
- 2000: 11 buildings, average cost: $10,500
- 1999: 6 buildings, average cost: $121,200
- 1998: 11 buildings, average cost: $92,900
- 1997: 13 buildings, average cost: $118,600
| Here: | 2.8% |
| Alabama: | 2.6% |
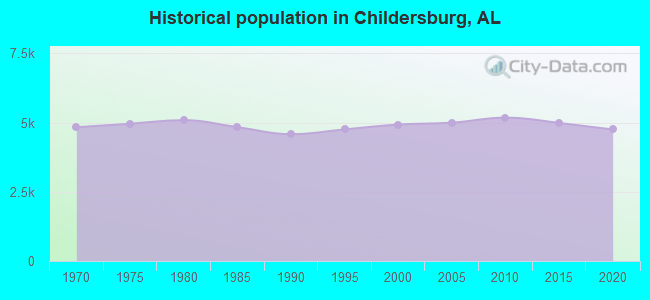
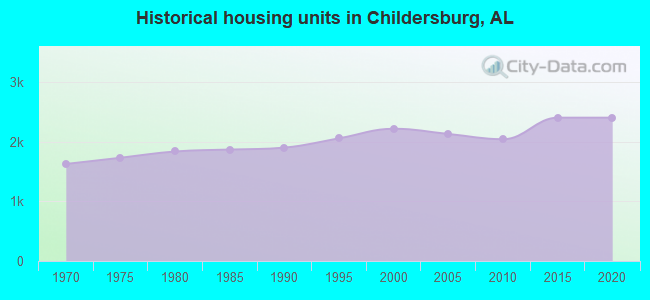
Population change in the 1990s: +170 (+3.6%).
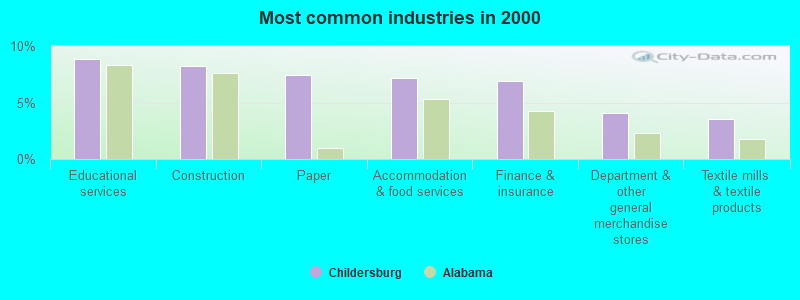
- Educational services (8.8%)
- Construction (8.3%)
- Paper (7.5%)
- Accommodation & food services (7.2%)
- Finance & insurance (6.9%)
- Department & other general merchandise stores (4.1%)
- Textile mills & textile products (3.5%)
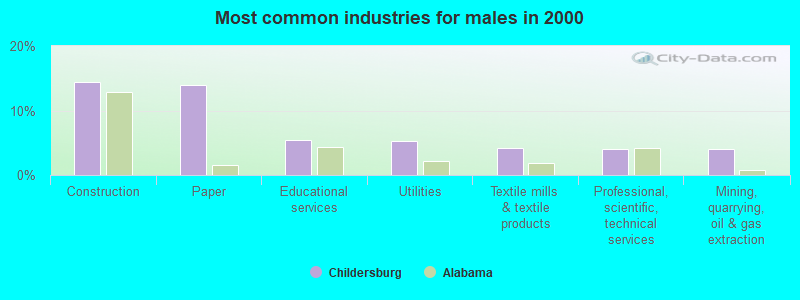
- Construction (14.5%)
- Paper (13.9%)
- Educational services (5.5%)
- Utilities (5.3%)
- Textile mills & textile products (4.2%)
- Professional, scientific, technical services (4.1%)
- Mining, quarrying, oil & gas extraction (4.0%)
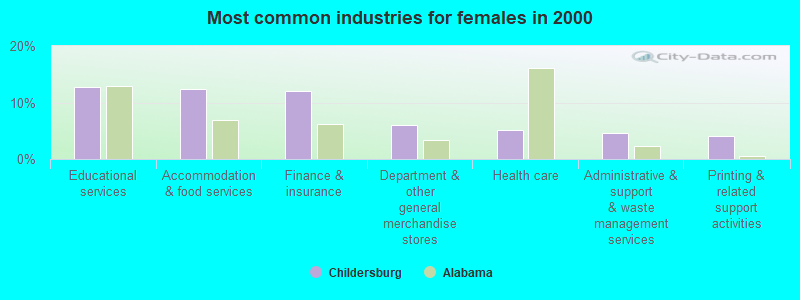
- Educational services (12.8%)
- Accommodation & food services (12.4%)
- Finance & insurance (12.0%)
- Department & other general merchandise stores (6.1%)
- Health care (5.2%)
- Administrative & support & waste management services (4.6%)
- Printing & related support activities (4.1%)
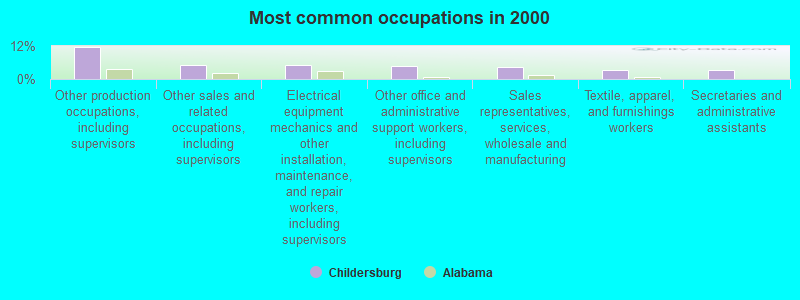
- Other production occupations, including supervisors (11.7%)
- Other sales and related occupations, including supervisors (5.3%)
- Electrical equipment mechanics and other installation, maintenance, and repair workers, including supervisors (5.2%)
- Other office and administrative support workers, including supervisors (4.8%)
- Sales representatives, services, wholesale and manufacturing (4.5%)
- Textile, apparel, and furnishings workers (3.4%)
- Secretaries and administrative assistants (3.2%)
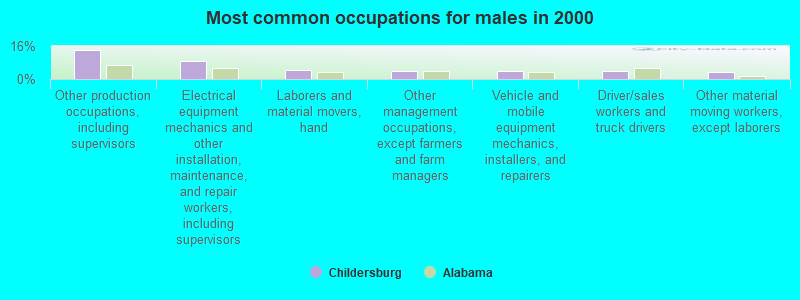
- Other production occupations, including supervisors (14.0%)
- Electrical equipment mechanics and other installation, maintenance, and repair workers, including supervisors (8.9%)
- Laborers and material movers, hand (4.3%)
- Other management occupations, except farmers and farm managers (4.0%)
- Vehicle and mobile equipment mechanics, installers, and repairers (4.0%)
- Driver/sales workers and truck drivers (3.7%)
- Other material moving workers, except laborers (3.6%)
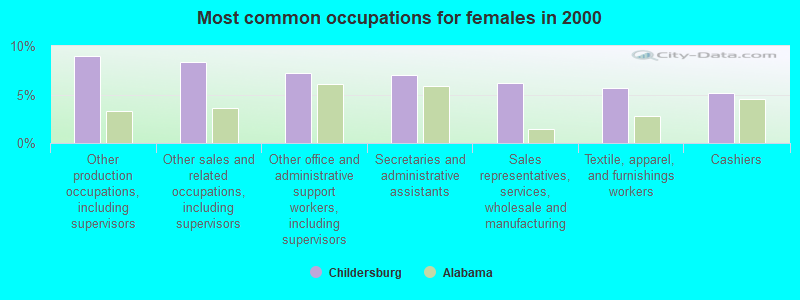
- Other production occupations, including supervisors (9.0%)
- Other sales and related occupations, including supervisors (8.4%)
- Other office and administrative support workers, including supervisors (7.2%)
- Secretaries and administrative assistants (7.0%)
- Sales representatives, services, wholesale and manufacturing (6.2%)
- Textile, apparel, and furnishings workers (5.6%)
- Cashiers (5.2%)
Average climate in Childersburg, Alabama
Based on data reported by over 4,000 weather stations


|
|


(lower is better)
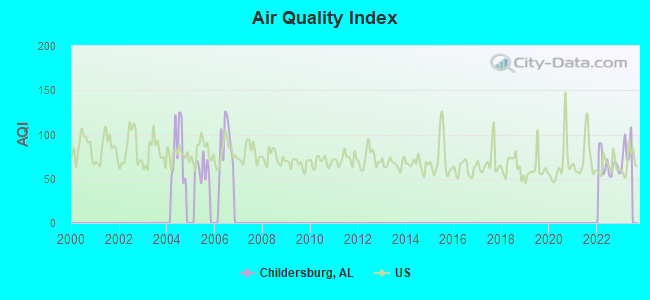
Air Quality Index (AQI) level in 2022 was 66.4. This is about average.
| City: | 66.4 |
| U.S.: | 72.6 |
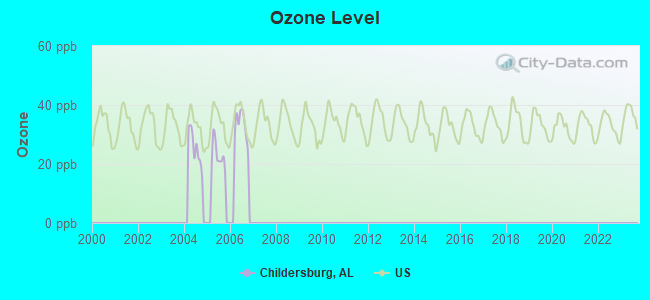
Ozone [ppb] level in 2006 was 32.8. This is about average. Closest monitor was 20.4 miles away from the city center.
| City: | 32.8 |
| U.S.: | 33.3 |
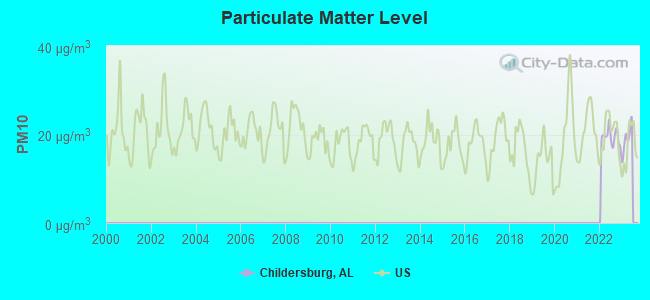
Particulate Matter (PM10) [µg/m3] level in 2022 was 19.5. This is about average. Closest monitor was 21.6 miles away from the city center.
| City: | 19.5 |
| U.S.: | 19.2 |
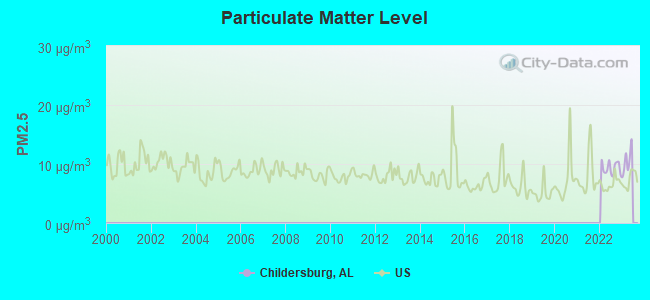
Particulate Matter (PM2.5) [µg/m3] level in 2022 was 9.34. This is about average. Closest monitor was 21.8 miles away from the city center.
| City: | 9.34 |
| U.S.: | 8.11 |
Tornado activity:
Childersburg-area historical tornado activity is slightly above Alabama state average. It is 118% greater than the overall U.S. average.
On 1/24/1964, a category F4 (max. wind speeds 207-260 mph) tornado 4.1 miles away from the Childersburg city center killed 10 people and injured 6 people and caused between $50,000 and $500,000 in damages.
On 4/4/1977, a category F5 (max. wind speeds 261-318 mph) tornado 30.1 miles away from the city center killed 22 people and injured 130 people and caused between $5,000,000 and $50,000,000 in damages.
Earthquake activity:
Childersburg-area historical earthquake activity is significantly above Alabama state average. It is 103% greater than the overall U.S. average.On 1/18/1999 at 07:00:53, a magnitude 4.8 (4.8 MB, 4.0 LG, Depth: 0.6 mi, Class: Light, Intensity: IV - V) earthquake occurred 52.9 miles away from Childersburg center
On 4/29/2003 at 08:59:39, a magnitude 4.9 (4.4 MB, 4.6 MW, 4.9 LG) earthquake occurred 94.0 miles away from the city center
On 4/29/2003 at 08:59:39, a magnitude 4.6 (4.6 MW, Depth: 12.3 mi) earthquake occurred 94.0 miles away from Childersburg center
On 10/24/1997 at 08:35:17, a magnitude 4.9 (4.8 MB, 4.2 MS, 4.9 LG, Depth: 6.2 mi) earthquake occurred 158.3 miles away from the city center
On 6/24/1975 at 11:11:36, a magnitude 4.5 (4.5 MB) earthquake occurred 91.1 miles away from Childersburg center
On 11/7/2004 at 11:20:21, a magnitude 4.3 (4.3 MW, Depth: 3.1 mi) earthquake occurred 101.4 miles away from Childersburg center
Magnitude types: regional Lg-wave magnitude (LG), body-wave magnitude (MB), surface-wave magnitude (MS), moment magnitude (MW)
Natural disasters:
The number of natural disasters in Talladega County (19) is greater than the US average (15).Major Disasters (Presidential) Declared: 11
Emergencies Declared: 6
Causes of natural disasters: Storms: 9, Floods: 7, Hurricanes: 6, Tornadoes: 6, Winds: 3, Drought: 1, Snowfall: 1, Winter Storm: 1, Other: 1 (Note: some incidents may be assigned to more than one category).
Hospitals and medical centers near Childersburg:
- AMERICAN HOMECARE HOSPICE - SYLACAUGA (Hospital, about 6 miles away; SYLACAUGA, AL)
- SYLACAUGA DIALYSIS (Dialysis Facility, about 8 miles away; SYLACAUGA, AL)
- FAITH HOMECARE HOSPICE (Hospital, about 9 miles away; SYLACAUGA, AL)
- MID-SOUTH HOME HEALTH (Home Health Center, about 9 miles away; SYLACAUGA, AL)
- SHELBY COUNTY HEALTH DEPARTMENT (Home Health Center, about 10 miles away; SYLACAUGA, AL)
- TALLADEGA COUNTY HOME CARE AGENCY (Home Health Center, about 10 miles away; SYLACAUGA, AL)
- SYLACAUGA HEALTH AND REHAB SERVICES (Nursing Home, about 10 miles away; SYLACAUGA, AL)
Heliports located in Childersburg:
Colleges/universities with over 2000 students nearest to Childersburg:
- Samford University (about 29 miles; Birmingham, AL; Full-time enrollment: 3,829)
- Virginia College-Birmingham (about 31 miles; Birmingham, AL; FT enrollment: 8,167)
- University of Alabama at Birmingham (about 31 miles; Birmingham, AL; FT enrollment: 14,853)
- University of Montevallo (about 32 miles; Montevallo, AL; FT enrollment: 2,826)
- Jefferson State Community College (about 34 miles; Birmingham, AL; FT enrollment: 6,041)
- Lawson State Community College-Birmingham Campus (about 34 miles; Birmingham, AL; FT enrollment: 2,695)
- Southern Union State Community College (about 47 miles; Wadley, AL; FT enrollment: 4,120)
Public high school in Childersburg:
- CHILDERSBURG HIGH SCH (Students: 488, Location: 122 FAY S PERRY DR, Grades: 9-12)
Public elementary/middle schools in Childersburg:
- CHILDERSBURG MIDDLE SCH (Students: 556, Location: 800 4TH ST SE, Grades: 5-8)
- AH WATWOOD ELEM SCH (Students: 367, Location: 3002 LIMBAUGH BLVD, Grades: KG-4)
- CHILDERSBURG ELEM SCH (Students: 255, Location: 235 PINECREST DRIVE, Grades: KG-4)
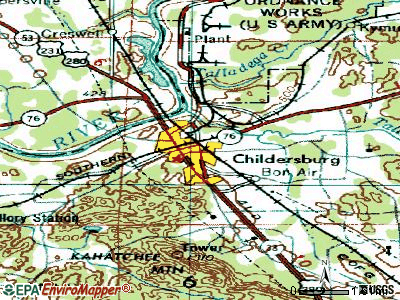
Points of interest:
Notable locations in Childersburg: Childersburg State Penal Camp (A), Curtis Camp (B), Childersburg Fire and Rescue (C). Display/hide their locations on the map
Shopping Center: Childersburg Shopping Center (1). Display/hide its location on the map
Churches in Childersburg include: Calvary Baptist Church (A), First Baptist Church (B), First Presbyterian Church (C), First United Methodist Church (D). Display/hide their locations on the map
Cemetery: Childersburg City Cemetery (1). Display/hide its location on the map
Streams, rivers, and creeks: Griffin Branch (A), Fourmile Creek (B). Display/hide their locations on the map
Tourist attraction: Desoto Caverns Park (Recreation Areas; Highway 76).
Hotels: Key West Inn Childersburg (32210 U South Highway 280), Lamplighter Inn (33888 Us Highway 280), Childersburg-Days Inn (33669 Us Highway 280), Days Inn (33669 US Highway 280).
Court: Childersburg City - Court Clerk Magistrate (118 6th Avenue Southwest).
Birthplace of: Joshua B. Lee - Politician, Walton Cruise - Major League Baseball outfielder.
Drinking water stations with addresses in Childersburg and their reported violations in the past:
CHILDERSBURG WATER & SEWER BOARD (Address: 117 6TH AVENUE, SW , Population served: 9,693, Groundwater):Past monitoring violations:
- 21 regular monitoring violations
| This city: | 2.5 people |
| Alabama: | 2.5 people |
| This city: | 68.0% |
| Whole state: | 67.8% |
| This city: | 5.0% |
| Whole state: | 4.7% |
Likely homosexual households (counted as self-reported same-sex unmarried-partner households)
- Lesbian couples: 0.2% of all households
- Gay men: 0.2% of all households
Banks with branches in Childersburg (2011 data):
- Cadence Bank, N.A.: Childersburg Branch at 33327 Highway 280, branch established on 1996/11/03. Info updated 2011/12/14: Bank assets: $3,909.7 mil, Deposits: $3,124.0 mil, headquarters in Birmingham, AL, positive income, Commercial Lending Specialization, 112 total offices, Holding Company: Cadence Bancorp Llc
- Frontier Bank: Childersburg Branch at 120 8th Avenue, branch established on 1974/02/04. Info updated 2012/03/01: Bank assets: $297.8 mil, Deposits: $253.4 mil, headquarters in Lagrange, GA, negative income in the last year, Commercial Lending Specialization, 10 total offices, Holding Company: Frontier National Corporation
For population 15 years and over in Childersburg:
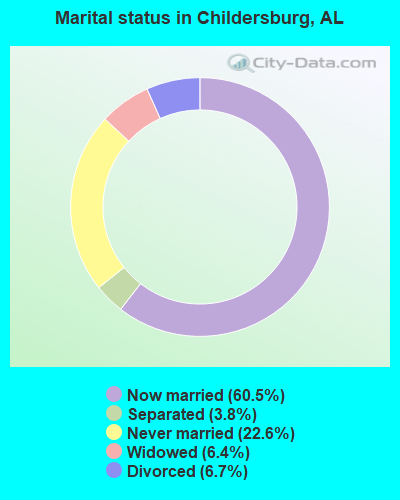
- Never married: 22.6%
- Now married: 60.5%
- Separated: 3.8%
- Widowed: 6.4%
- Divorced: 6.7%
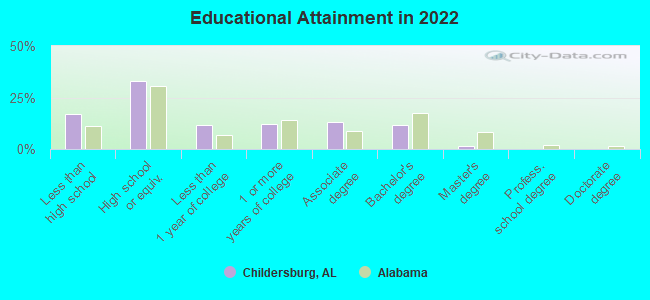
For population 25 years and over in Childersburg:
- High school or higher: 80.1%
- Bachelor's degree or higher: 12.1%
- Graduate or professional degree: 1.5%
- Unemployed: 10.3%
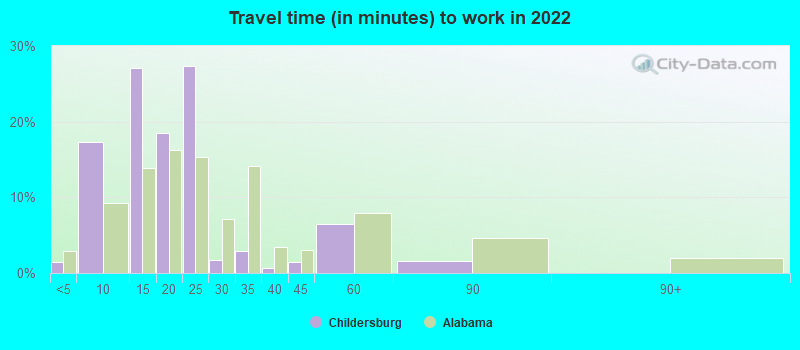
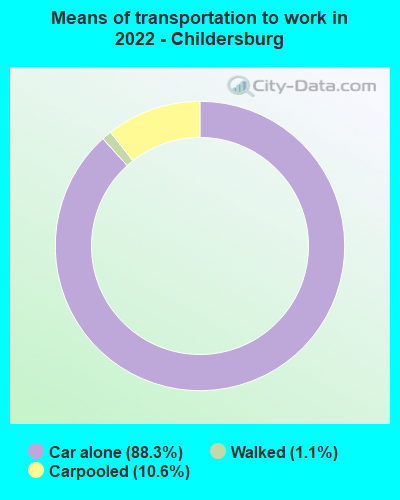
- Mean travel time to work (commute): 21.2 minutes
| Here: | 10.9 |
| Alabama average: | 11.5 |
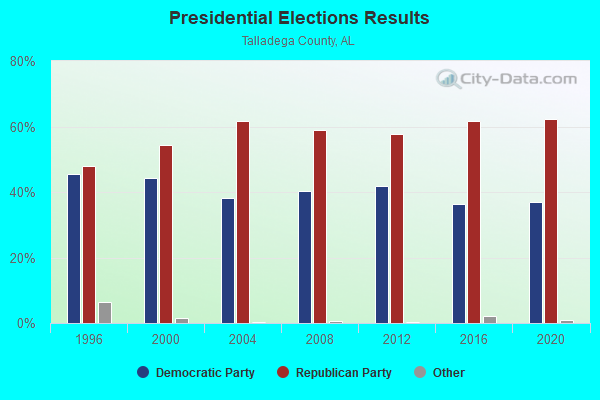
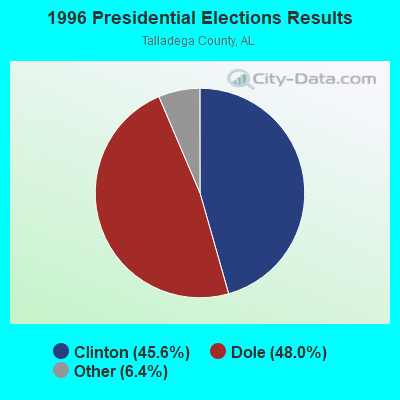
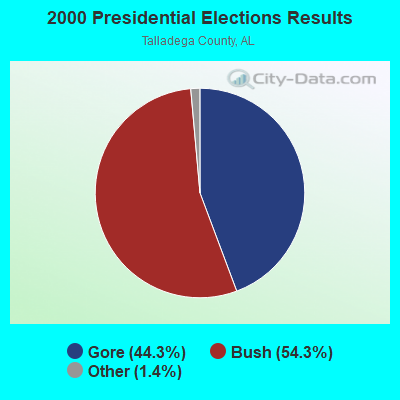
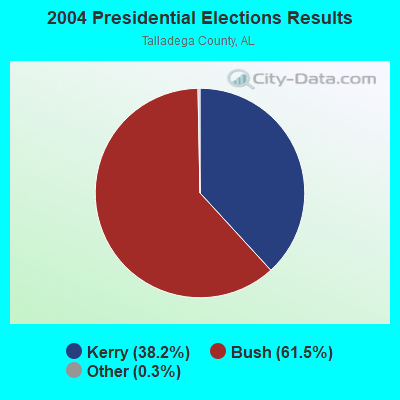
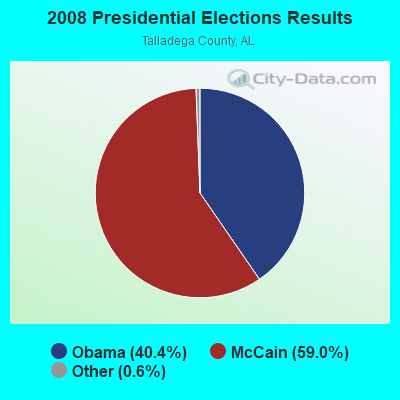
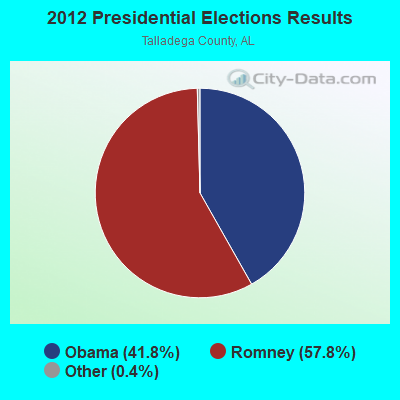
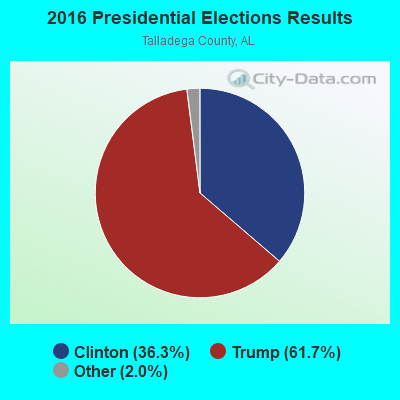
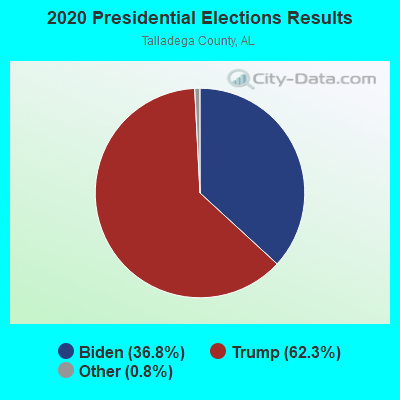
Graphs represent county-level data. Detailed 2008 Election Results
Religion statistics for Childersburg, AL (based on Talladega County data)
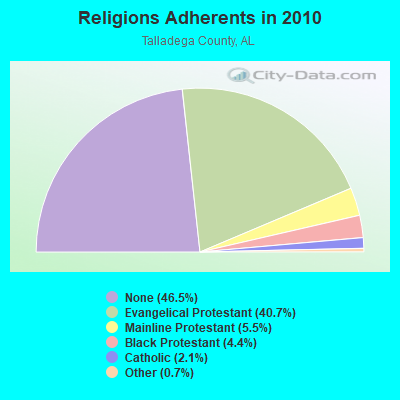
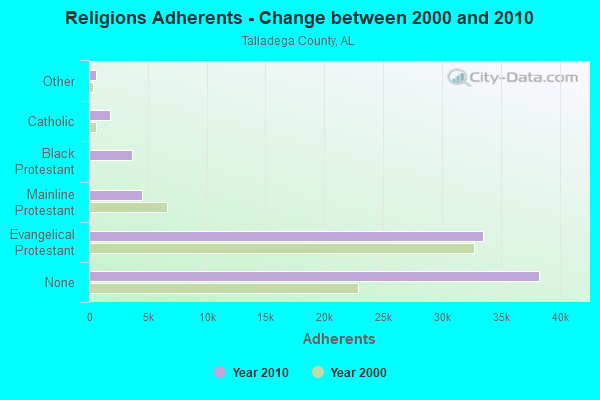
| Religion | Adherents | Congregations |
|---|---|---|
| Evangelical Protestant | 33,499 | 139 |
| Mainline Protestant | 4,538 | 37 |
| Black Protestant | 3,645 | 25 |
| Catholic | 1,769 | 4 |
| Other | 554 | 4 |
| None | 38,286 | - |
Food Environment Statistics:
| Here: | 1.00 / 10,000 pop. |
| Alabama: | 1.89 / 10,000 pop. |
| Talladega County: | 0.12 / 10,000 pop. |
| Alabama: | 0.20 / 10,000 pop. |
| This county: | 1.12 / 10,000 pop. |
| State: | 0.65 / 10,000 pop. |
| Here: | 8.73 / 10,000 pop. |
| Alabama: | 6.32 / 10,000 pop. |
| Talladega County: | 4.99 / 10,000 pop. |
| Alabama: | 5.75 / 10,000 pop. |
| Talladega County: | 12.8% |
| Alabama: | 11.8% |
| Here: | 32.8% |
| State: | 31.7% |
| Talladega County: | 6.9% |
| Alabama: | 13.5% |
Health and Nutrition:
| Here: | 44.7% |
| Alabama: | 49.0% |
| This city: | 38.1% |
| Alabama: | 45.7% |
| Childersburg: | 29.0 |
| Alabama: | 28.9 |
| This city: | 23.8% |
| Alabama: | 20.7% |
| Childersburg: | 12.0% |
| Alabama: | 11.0% |
| This city: | 6.8 |
| Alabama: | 6.8 |
| Childersburg: | 34.0% |
| Alabama: | 34.4% |
| Here: | 48.8% |
| Alabama: | 55.2% |
| Childersburg: | 76.4% |
| Alabama: | 79.3% |
More about Health and Nutrition of Childersburg, AL Residents
| Local government employment and payroll (March 2022) | |||||
| Function | Full-time employees | Monthly full-time payroll | Average yearly full-time wage | Part-time employees | Monthly part-time payroll |
|---|---|---|---|---|---|
| Police Protection - Officers | 15 | $46,916 | $37,533 | 3 | $7,679 |
| Firefighters | 13 | $59,710 | $55,117 | 8 | $5,610 |
| Other Government Administration | 7 | $11,750 | $20,143 | 0 | $0 |
| Solid Waste Management | 4 | $9,099 | $27,297 | 3 | $5,485 |
| Welfare | 4 | $15,921 | $47,763 | 3 | $5,485 |
| Local Libraries | 4 | $7,108 | $21,324 | 1 | $1,829 |
| Streets and Highways | 3 | $14,216 | $56,864 | 3 | $5,485 |
| Financial Administration | 2 | $7,108 | $42,648 | 0 | $0 |
| Parks and Recreation | 2 | $5,117 | $30,702 | 8 | $2,020 |
| Police - Other | 2 | $5,403 | $32,418 | 0 | $0 |
| Judicial and Legal | 2 | $8,246 | $49,476 | 0 | $0 |
| Totals for Government | 58 | $190,593 | $39,433 | 29 | $33,592 |
Childersburg government finances - Expenditure in 2017 (per resident):
- Construction - General - Other: $1,367,000 ($293.60)
- Current Operations - Central Staff Services: $1,412,000 ($303.26)
Police Protection: $1,192,000 ($256.01)
Local Fire Protection: $823,000 ($176.76)
Regular Highways: $506,000 ($108.68)
Health - Other: $257,000 ($55.20)
Parks and Recreation: $255,000 ($54.77)
Solid Waste Management: $219,000 ($47.04)
Libraries: $155,000 ($33.29)
General - Other: $123,000 ($26.42)
Transit Utilities: $81,000 ($17.40)
- General - Interest on Debt: $32,000 ($6.87)
- Other Capital Outlay - Health - Other: $71,000 ($15.25)
Childersburg government finances - Revenue in 2017 (per resident):
- Charges - Other: $694,000 ($149.05)
Parks and Recreation: $69,000 ($14.82)
- Miscellaneous - General Revenue - Other: $435,000 ($93.43)
Fines and Forfeits: $242,000 ($51.98)
Interest Earnings: $7,000 ($1.50)
- State Intergovernmental - Other: $485,000 ($104.17)
Health and Hospitals: $193,000 ($41.45)
General Local Government Support: $79,000 ($16.97)
- Tax - General Sales and Gross Receipts: $1,936,000 ($415.81)
Public Utilities Sales: $617,000 ($132.52)
Property: $459,000 ($98.58)
Other: $437,000 ($93.86)
Other License: $395,000 ($84.84)
Childersburg government finances - Debt in 2017 (per resident):
- Long Term Debt - Beginning Outstanding - Unspecified Public Purpose: $545,000 ($117.05)
Outstanding Unspecified Public Purpose: $535,000 ($114.91)
Retired Unspecified Public Purpose: $10,000 ($2.15)
Childersburg government finances - Cash and Securities in 2017 (per resident):
- Other Funds - Cash and Securities: $2,725,000 ($585.27)
| Businesses in Childersburg, AL | ||||
| Name | Count | Name | Count | |
|---|---|---|---|---|
| AutoZone | 1 | KFC | 1 | |
| Burger King | 1 | McDonald's | 1 | |
| CVS | 1 | Pizza Hut | 1 | |
| Church's Chicken | 1 | Subway | 1 | |
| Days Inn | 1 | Taco Bell | 1 | |
| FedEx | 1 | Waffle House | 1 | |
| H&R Block | 1 | |||
Strongest AM radio stations in Childersburg:
- WJOX (690 AM; 50 kW; BIRMINGHAM, AL; Owner: CITADEL BROADCASTING COMPANY)
- WDJC (850 AM; 50 kW; BIRMINGHAM, AL; Owner: KIMTRON, INC.)
- WAPI (1070 AM; 50 kW; BIRMINGHAM, AL; Owner: CITADEL BROADCASTING COMPANY)
- WNSI (810 AM; 50 kW; JACKSONVILLE, AL; Owner: UNITED BROADCASTING NETWORK, INC.)
- WYEA (1290 AM; 1 kW; SYLACAUGA, AL; Owner: SPIRIT BROADCASTING CO., INC.)
- WKNG (1060 AM; daytime; 50 kW; TALLAPOOSA, GA; Owner: WKNG, INC.)
- WFHK (1430 AM; 5 kW; PELL CITY, AL; Owner: STOCKS BROADCASTING, INC.)
- WFEB (1340 AM; 1 kW; SYLACAUGA, AL; Owner: ALABAMA BROADCASTING COMPANY, INC.)
- WZZX (780 AM; daytime; 5 kW; LINEVILLE, AL; Owner: ROBERT A. PERRY)
- WGST (640 AM; 50 kW; ATLANTA, GA; Owner: CITICASTERS LICENSES, L.P.)
- WLPH (1480 AM; daytime; 5 kW; IRONDALE, AL; Owner: BIRMINGHAM CHRISTIAN RADIO, INC.)
- WERC (960 AM; 5 kW; BIRMINGHAM, AL; Owner: CAPSTAR TX LIMITED PARTNERSHIP)
- WYDE (1260 AM; 5 kW; BIRMINGHAM, AL; Owner: KIMTRON, INC.)
Strongest FM radio stations in Childersburg:
- WTRB-FM (98.3 FM; SYLACAUGA, AL; Owner: WILLIAMS COMMUNICATIONS, INC.)
- WTDR (92.7 FM; TALLADEGA, AL; Owner: JACOBS BROADCAST GROUP, INC.)
- WGIB (91.9 FM; BIRMINGHAM, AL; Owner: GLEN IRIS BAPTIST SCHOOL)
- WTBJ (91.3 FM; OXFORD, AL; Owner: TRINITY CHRISTIAN ACADEMY)
- WBPT (106.9 FM; BIRMINGHAM, AL; Owner: CXR HOLDINGS, INC.)
- WBHK (98.7 FM; WARRIOR, AL; Owner: CXR HOLDINGS, INC.)
- WZZK-FM (104.7 FM; BIRMINGHAM, AL; Owner: CXR HOLDINGS, INC.)
- WODL (97.3 FM; HOMEWOOD, AL; Owner: CXR HOLDINGS, INC.)
- WBHM (90.3 FM; BIRMINGHAM, AL; Owner: BD OF TRUSTEES/U OF AL AT BIRMINGHAM)
- WYSF (94.5 FM; BIRMINGHAM, AL; Owner: CITADEL BROADCASTING COMPANY)
- WSSY-FM (97.5 FM; TALLADEGA, AL; Owner: GREAT SOUTH RFDC, LLC)
- WLJR (88.5 FM; BIRMINGHAM, AL; Owner: BRIARWOOD PRESBYTERIAN CHURCH)
- WRAX (107.7 FM; BIRMINGHAM, AL; Owner: CITADEL BROADCASTING COMPANY)
- WMJJ (96.5 FM; BIRMINGHAM, AL; Owner: CAPSTAR TX LIMITED PARTNERSHIP)
- WQEM (101.5 FM; COLUMBIANA, AL; Owner: GLEN IRIS BAPTIST SCHOOL)
- WQEN (103.7 FM; GADSDEN, AL; Owner: CAPSTAR TX LIMITED PARTNERSHIP)
- WZRR (99.5 FM; BIRMINGHAM, AL; Owner: CITADEL BROADCASTING COMPANY)
- WDJC-FM (93.7 FM; BIRMINGHAM, AL; Owner: KIMTRON, INC.)
- WVOK-FM (97.9 FM; OXFORD, AL; Owner: WOODARD BROADCASTING CO. INC.)
- WDXB (102.5 FM; JASPER, AL; Owner: CAPSTAR TX LIMITED PARTNERSHIP)
TV broadcast stations around Childersburg:
- WIAT (Channel 42; BIRMINGHAM, AL; Owner: MEDIA GENERAL COMMUNICATIONS, INC.)
- WBIQ (Channel 10; BIRMINGHAM, AL; Owner: ALABAMA EDUCATIONAL TELEVISION COMMISSION)
- WTTO (Channel 21; HOMEWOOD, AL; Owner: WTTO LICENSEE, LLC)
- WBRC (Channel 6; BIRMINGHAM, AL; Owner: WBRC LICENSE, INC.)
- WVTM-TV (Channel 13; BIRMINGHAM, AL; Owner: BIRMINGHAM BROADCASTING (WVTM-TV), LLC)
- WABM (Channel 68; BIRMINGHAM, AL; Owner: BIRMINGHAM (WABM-TV) LICENSEE, INC.)
- WJSU-TV (Channel 40; ANNISTON, AL; Owner: TV ALABAMA, INC.)
- WDBB (Channel 17; BESSEMER, AL; Owner: WDBB-TV, INC.)
- WBXA-CA (Channel 2; BIRMINGHAM, AL; Owner: THE BOX WORLDWIDE LLC)
- W27CM (Channel 27; BIRMINGHAM, AL; Owner: EQUITY BROADCASTING CORPORATION)
- W46DK (Channel 46; BIRMINGHAM, AL; Owner: TRINITY BROADCASTING NETWORK)
- WOIL-LP (Channel 47; TALLADEGA, AL; Owner: BOWLIN BROADCAST NETWORK, INC.)
- W04CB (Channel 4; SYLACAUGA, AL; Owner: MEDIA GENERAL COMMUNICATIONS, INC.)
- National Bridge Inventory (NBI) Statistics
- 28Number of bridges
- 535ft / 163mTotal length
- $64,473,000Total costs
- 146,605Total average daily traffic
- 14,584Total average daily truck traffic
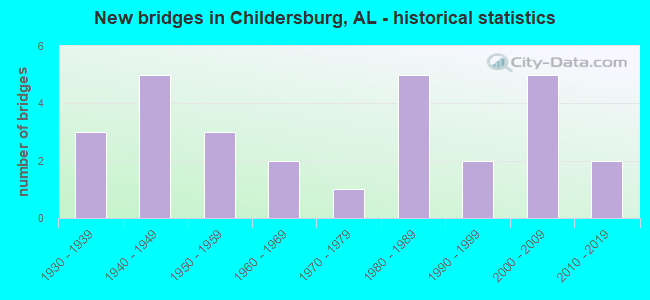
- New bridges - historical statistics
- 31930-1939
- 51940-1949
- 31950-1959
- 21960-1969
- 11970-1979
- 51980-1989
- 21990-1999
- 52000-2009
- 22010-2019
FCC Registered Cell Phone Towers:
2 (See the full list of FCC Registered Cell Phone Towers in Childersburg)FCC Registered Antenna Towers:
54 (See the full list of FCC Registered Antenna Towers)FCC Registered Private Land Mobile Towers:
1 (See the full list of FCC Registered Private Land Mobile Towers in Childersburg, AL)FCC Registered Broadcast Land Mobile Towers:
11 (See the full list of FCC Registered Broadcast Land Mobile Towers)FCC Registered Microwave Towers:
1- KAHATCHEE MOUNTAIN, Kahatchee Mountain 5 Km S (Lat: 33.226917 Lon: -86.359694), Overall height: 60.4 m, Call Sign: WPNJ729,
Assigned Frequencies: 6795.00 MHz, 6865.00 MHz, 6197.24 MHz, 6286.19 MHz, Grant Date: 02/06/2018, Expiration Date: 04/01/2028, Certifier: Kevin Jenkins, Registrant: Apco International, Inc., 351 N. Williamson Blvd., Daytona Beach, FL 32114, Phone: (386) 944-2469, Email:
FCC Registered Amateur Radio Licenses:
31 (See the full list of FCC Registered Amateur Radio Licenses in Childersburg)FAA Registered Aircraft:
2- Aircraft: QUAD CITY CHALLENGER II (Category: Land, Seats: 2, Weight: Up to 12,499 Pounds), Engine: ROTAX 503 DCDI (52 HP) (2 Cycle)
N-Number: 363DL, N363DL, N-363DL, Serial Number: CH2-0100-1927, Year manufactured: 2007, Airworthiness Date: 07/15/2007, Certificate Issue Date: 06/22/2007
Registrant (Individual): David H Cunningham, 462 Blairs Pl, Childersburg, AL 35044 - Aircraft: CESSNA 210B (Category: Land, Seats: 4, Weight: Up to 12,499 Pounds, Speed: 141 mph), Engine: CONT MOTOR I0-470 SERIES (260 HP) (Reciprocating)
N-Number: 9611X, N9611X, N-9611X, Serial Number: 21057911, Year manufactured: 1962, Airworthiness Date: 02/21/1962, Certificate Issue Date: 08/25/2016
Registrant (Individual): Robert C Vinson, 108 8th Ave Sw, Childersburg, AL 35044
Deregistered: Cancel Date: 12/02/2019
2002 - 2018 National Fire Incident Reporting System (NFIRS) incidents
- Fire incident types reported to NFIRS in Childersburg, AL
- 7737.9%Structure Fires
- 5225.6%Outside Fires
- 4823.6%Other
- 2612.8%Mobile Property/Vehicle Fires
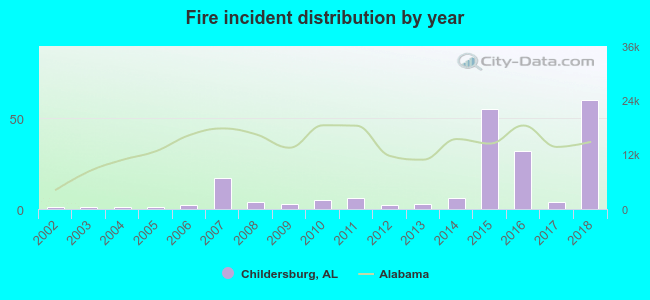 According to the data from the years 2002 - 2018 the average number of fires per year is 12. The highest number of reported fire incidents - 60 took place in 2018, and the least - 1 in 2002. The data has an increasing trend.
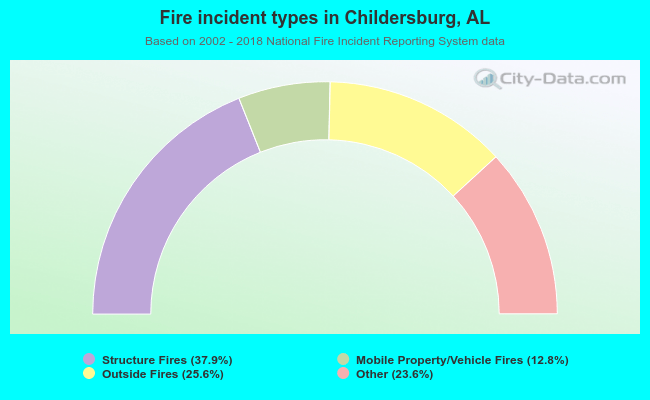 When looking into fire subcategories, the most reports belonged to: Structure Fires (37.9%), and Outside Fires (25.6%).
| Most common first names in Childersburg, AL among deceased individuals | ||
| Name | Count | Lived (average) |
|---|---|---|
| James | 78 | 70.7 years |
| John | 58 | 72.6 years |
| William | 46 | 70.7 years |
| Robert | 43 | 72.0 years |
| Mary | 43 | 71.4 years |
| Willie | 28 | 71.3 years |
| Annie | 25 | 75.7 years |
| George | 20 | 77.3 years |
| Charles | 16 | 71.5 years |
| Walter | 14 | 70.0 years |
| Most common last names in Childersburg, AL among deceased individuals | ||
| Last name | Count | Lived (average) |
|---|---|---|
| Garrett | 22 | 68.4 years |
| Swain | 21 | 71.3 years |
| Taylor | 21 | 72.1 years |
| Smith | 19 | 72.7 years |
| Jones | 18 | 70.9 years |
| Davis | 18 | 69.8 years |
| Coleman | 17 | 73.3 years |
| Wilson | 16 | 76.9 years |
| Baker | 15 | 64.2 years |
| Nix | 13 | 80.4 years |
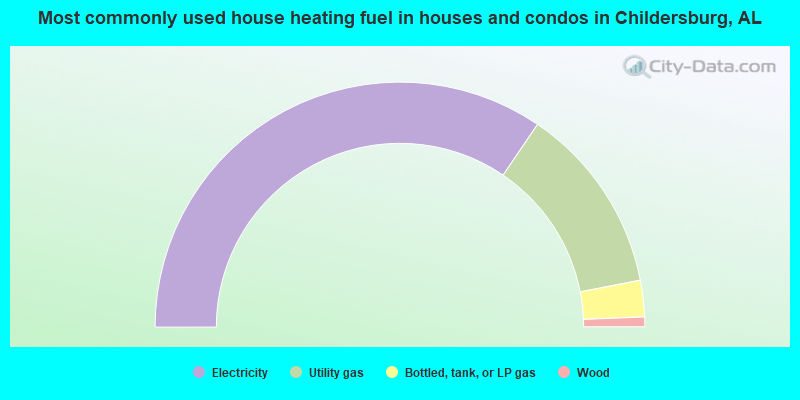
- 69.0%Electricity
- 24.9%Utility gas
- 4.8%Bottled, tank, or LP gas
- 1.3%Wood
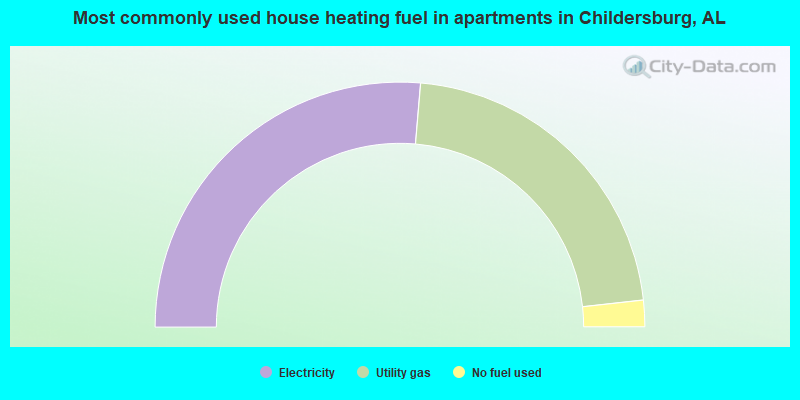
- 52.7%Electricity
- 43.8%Utility gas
- 3.5%No fuel used
Childersburg compared to Alabama state average:
- Median house value below state average.
- Hispanic race population percentage significantly below state average.
- Median age below state average.
- Foreign-born population percentage significantly below state average.
- Length of stay since moving in significantly above state average.
- House age above state average.
- Percentage of population with a bachelor's degree or higher below state average.
Childersburg on our top lists:
- #10 on the list of "Top 101 cities with largest percentage of females in industries: information (population 5,000+)"
- #16 on the list of "Top 101 cities with largest percentage of males in industries: real estate and rental and leasing (population 5,000+)"
- #31 on the list of "Top 101 cities with the largest city-data.com crime index decrease from 2002 to 2012 (population 5,000+)"
- #60 on the list of "Top 101 cities with the most people born in the same U.S. state as the city (population 5,000+)"
- #30 (35151) on the list of "Top 101 zip codes with the largest percentage of United States first ancestries (pop 5,000+)"
- #80 on the list of "Top 101 counties with the smallest number of people without health insurance coverage in 2000"
- #87 on the list of "Top 101 counties with the highest number of deaths per 1000 residents 2007-2013 (pop. 50,000+)"
- #93 on the list of "Top 101 counties with the smallest number of children under 18 without health insurance coverage in 2000"

|
Total of 5 patent applications in 2008-2024.