Cloquet, Minnesota Submit your own pictures of this city and show them to the world
OSM Map
General Map
Google Map
MSN Map
OSM Map
General Map
Google Map
MSN Map
OSM Map
General Map
Google Map
MSN Map
OSM Map
General Map
Google Map
MSN Map
Please wait while loading the map...
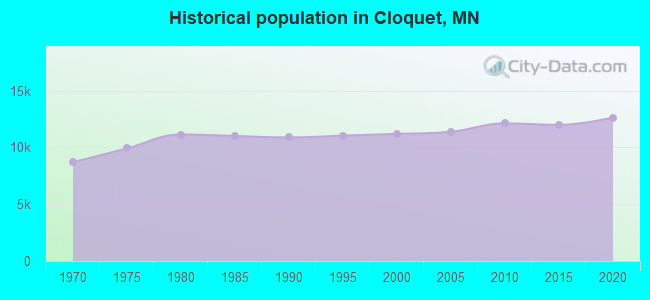
Population in 2022: 12,603 (84% urban, 16% rural). Population change since 2000: +12.5%Males: 5,901 Females: 6,702
March 2022 cost of living index in Cloquet: 97.0 (near average, U.S. average is 100) Percentage of residents living in poverty in 2022: 16.5%for White Non-Hispanic residents , 2.5% for Black residents , 40.9% for Hispanic or Latino residents , 24.2% for American Indian residents , 19.0% for other race residents , 11.6% for two or more races residents )Business Search - 14 Million verified businesses
Data:
Median household income ($)
Median household income (% change since 2000)
Household income diversity
Ratio of average income to average house value (%)
Ratio of average income to average rent
Median household income ($) - White
Median household income ($) - Black or African American
Median household income ($) - Asian
Median household income ($) - Hispanic or Latino
Median household income ($) - American Indian and Alaska Native
Median household income ($) - Multirace
Median household income ($) - Other Race
Median household income for houses/condos with a mortgage ($)
Median household income for apartments without a mortgage ($)
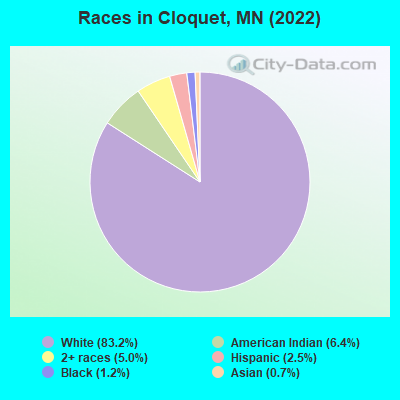
Races - White alone (%)
Races - White alone (% change since 2000)
Races - Black alone (%)
Races - Black alone (% change since 2000)
Races - American Indian alone (%)
Races - American Indian alone (% change since 2000)
Races - Asian alone (%)
Races - Asian alone (% change since 2000)
Races - Hispanic (%)
Races - Hispanic (% change since 2000)
Races - Native Hawaiian and Other Pacific Islander alone (%)
Races - Native Hawaiian and Other Pacific Islander alone (% change since 2000)
Races - Two or more races (%)
Races - Two or more races (% change since 2000)
Races - Other race alone (%)
Races - Other race alone (% change since 2000)
Racial diversity
Unemployment (%)
Unemployment (% change since 2000)
Unemployment (%) - White
Unemployment (%) - Black or African American
Unemployment (%) - Asian
Unemployment (%) - Hispanic or Latino
Unemployment (%) - American Indian and Alaska Native
Unemployment (%) - Multirace
Unemployment (%) - Other Race
Population density (people per square mile)
Population - Males (%)
Population - Females (%)
Population - Males (%) - White
Population - Males (%) - Black or African American
Population - Males (%) - Asian
Population - Males (%) - Hispanic or Latino
Population - Males (%) - American Indian and Alaska Native
Population - Males (%) - Multirace
Population - Males (%) - Other Race
Population - Females (%) - White
Population - Females (%) - Black or African American
Population - Females (%) - Asian
Population - Females (%) - Hispanic or Latino
Population - Females (%) - American Indian and Alaska Native
Population - Females (%) - Multirace
Population - Females (%) - Other Race
Coronavirus confirmed cases (Jun 15, 2024)
Deaths caused by coronavirus (Jun 15, 2024)
Coronavirus confirmed cases (per 100k population) (Jun 15, 2024)
Deaths caused by coronavirus (per 100k population) (Jun 15, 2024)
Daily increase in number of cases (Jun 15, 2024)
Weekly increase in number of cases (Jun 15, 2024)
Cases doubled (in days) (Jun 15, 2024)
Hospitalized patients (Apr 18, 2022)
Negative test results (Apr 18, 2022)
Total test results (Apr 18, 2022)
COVID Vaccine doses distributed (per 100k population) (Sep 19, 2023)
COVID Vaccine doses administered (per 100k population) (Sep 19, 2023)
COVID Vaccine doses distributed (Sep 19, 2023)
COVID Vaccine doses administered (Sep 19, 2023)
Likely homosexual households (%)
Likely homosexual households (% change since 2000)
Likely homosexual households - Lesbian couples (%)
Likely homosexual households - Lesbian couples (% change since 2000)
Likely homosexual households - Gay men (%)
Likely homosexual households - Gay men (% change since 2000)
Cost of living index
Median gross rent ($)
Median contract rent ($)
Median monthly housing costs ($)
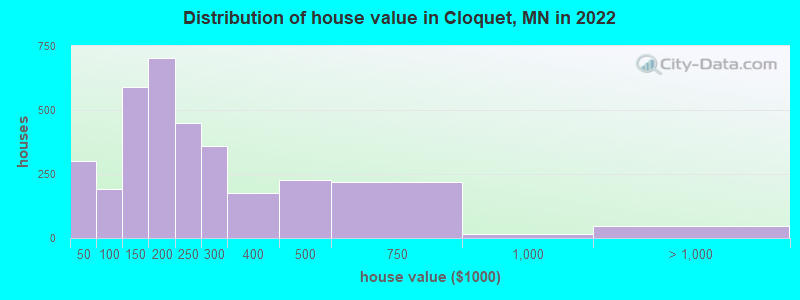
Median house or condo value ($)
Median house or condo value ($ change since 2000)
Mean house or condo value by units in structure - 1, detached ($)
Mean house or condo value by units in structure - 1, attached ($)
Mean house or condo value by units in structure - 2 ($)
Mean house or condo value by units in structure by units in structure - 3 or 4 ($)
Mean house or condo value by units in structure - 5 or more ($)
Mean house or condo value by units in structure - Boat, RV, van, etc. ($)
Mean house or condo value by units in structure - Mobile home ($)
Median house or condo value ($) - White
Median house or condo value ($) - Black or African American
Median house or condo value ($) - Asian
Median house or condo value ($) - Hispanic or Latino
Median house or condo value ($) - American Indian and Alaska Native
Median house or condo value ($) - Multirace
Median house or condo value ($) - Other Race
Median resident age
Resident age diversity
Median resident age - Males
Median resident age - Females
Median resident age - White
Median resident age - Black or African American
Median resident age - Asian
Median resident age - Hispanic or Latino
Median resident age - American Indian and Alaska Native
Median resident age - Multirace
Median resident age - Other Race
Median resident age - Males - White
Median resident age - Males - Black or African American
Median resident age - Males - Asian
Median resident age - Males - Hispanic or Latino
Median resident age - Males - American Indian and Alaska Native
Median resident age - Males - Multirace
Median resident age - Males - Other Race
Median resident age - Females - White
Median resident age - Females - Black or African American
Median resident age - Females - Asian
Median resident age - Females - Hispanic or Latino
Median resident age - Females - American Indian and Alaska Native
Median resident age - Females - Multirace
Median resident age - Females - Other Race
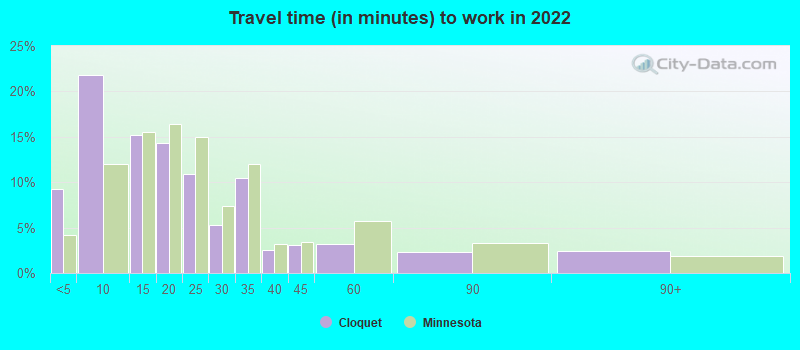
Commute - mean travel time to work (minutes)
Travel time to work - Less than 5 minutes (%)
Travel time to work - Less than 5 minutes (% change since 2000)
Travel time to work - 5 to 9 minutes (%)
Travel time to work - 5 to 9 minutes (% change since 2000)
Travel time to work - 10 to 19 minutes (%)
Travel time to work - 10 to 19 minutes (% change since 2000)
Travel time to work - 20 to 29 minutes (%)
Travel time to work - 20 to 29 minutes (% change since 2000)
Travel time to work - 30 to 39 minutes (%)
Travel time to work - 30 to 39 minutes (% change since 2000)
Travel time to work - 40 to 59 minutes (%)
Travel time to work - 40 to 59 minutes (% change since 2000)
Travel time to work - 60 to 89 minutes (%)
Travel time to work - 60 to 89 minutes (% change since 2000)
Travel time to work - 90 or more minutes (%)
Travel time to work - 90 or more minutes (% change since 2000)
Marital status - Never married (%)
Marital status - Now married (%)
Marital status - Separated (%)
Marital status - Widowed (%)
Marital status - Divorced (%)
Median family income ($)
Median family income (% change since 2000)
Median non-family income ($)
Median non-family income (% change since 2000)
Median per capita income ($)
Median per capita income (% change since 2000)
Median family income ($) - White
Median family income ($) - Black or African American
Median family income ($) - Asian
Median family income ($) - Hispanic or Latino
Median family income ($) - American Indian and Alaska Native
Median family income ($) - Multirace
Median family income ($) - Other Race
Median year house/condo built
Median year apartment built
Year house built - Built 2005 or later (%)
Year house built - Built 2000 to 2004 (%)
Year house built - Built 1990 to 1999 (%)
Year house built - Built 1980 to 1989 (%)
Year house built - Built 1970 to 1979 (%)
Year house built - Built 1960 to 1969 (%)
Year house built - Built 1950 to 1959 (%)
Year house built - Built 1940 to 1949 (%)
Year house built - Built 1939 or earlier (%)
Average household size
Household density (households per square mile)
Average household size - White
Average household size - Black or African American
Average household size - Asian
Average household size - Hispanic or Latino
Average household size - American Indian and Alaska Native
Average household size - Multirace
Average household size - Other Race
Occupied housing units (%)
Vacant housing units (%)
Owner occupied housing units (%)
Renter occupied housing units (%)
Vacancy status - For rent (%)
Vacancy status - For sale only (%)
Vacancy status - Rented or sold, not occupied (%)
Vacancy status - For seasonal, recreational, or occasional use (%)
Vacancy status - For migrant workers (%)
Vacancy status - Other vacant (%)
Residents with income below the poverty level (%)
Residents with income below 50% of the poverty level (%)
Children below poverty level (%)
Poor families by family type - Married-couple family (%)
Poor families by family type - Male, no wife present (%)
Poor families by family type - Female, no husband present (%)
Poverty status for native-born residents (%)
Poverty status for foreign-born residents (%)
Poverty among high school graduates not in families (%)
Poverty among people who did not graduate high school not in families (%)
Residents with income below the poverty level (%) - White
Residents with income below the poverty level (%) - Black or African American
Residents with income below the poverty level (%) - Asian
Residents with income below the poverty level (%) - Hispanic or Latino
Residents with income below the poverty level (%) - American Indian and Alaska Native
Residents with income below the poverty level (%) - Multirace
Residents with income below the poverty level (%) - Other Race
Air pollution - Air Quality Index (AQI)
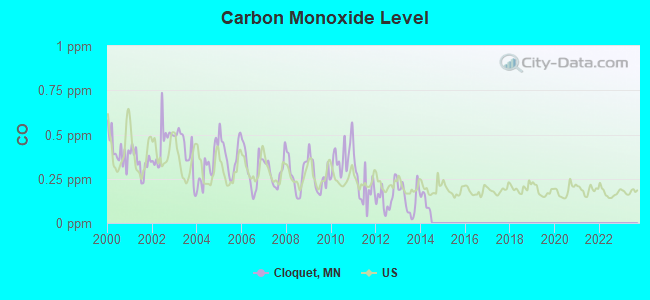
Air pollution - CO
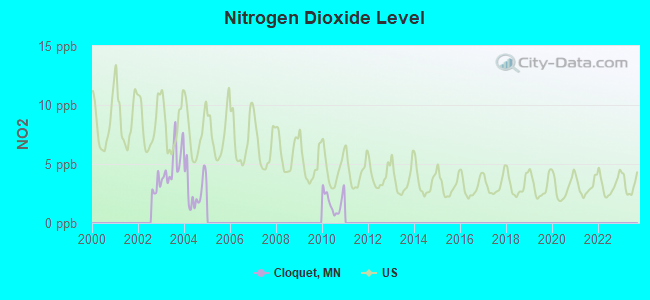
Air pollution - NO2
Air pollution - SO2
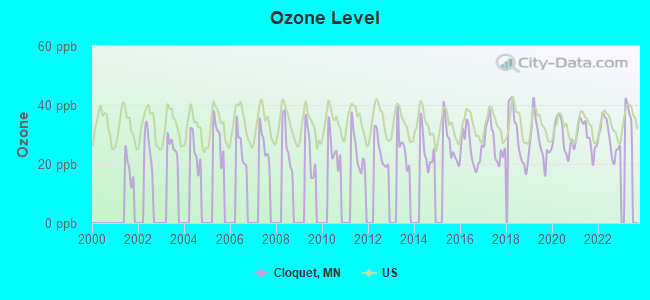
Air pollution - Ozone
Air pollution - PM10
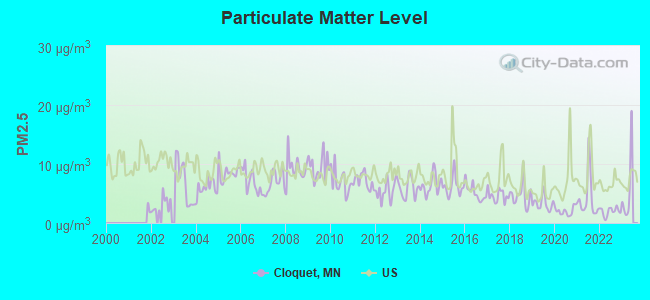
Air pollution - PM25
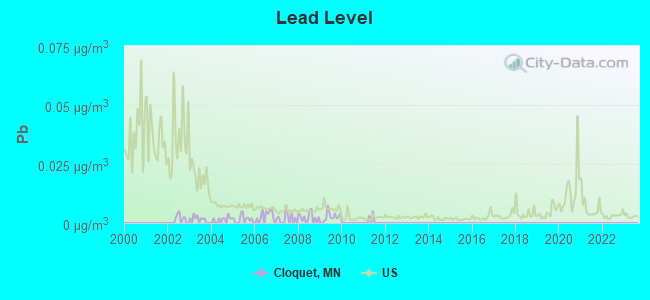
Air pollution - Pb
Crime - Murders per 100,000 population
Crime - Rapes per 100,000 population
Crime - Robberies per 100,000 population
Crime - Assaults per 100,000 population
Crime - Burglaries per 100,000 population
Crime - Thefts per 100,000 population
Crime - Auto thefts per 100,000 population
Crime - Arson per 100,000 population
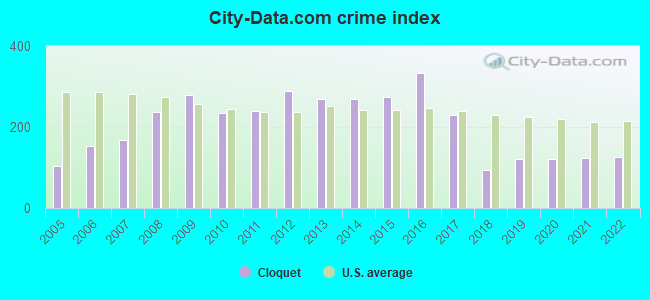
Crime - City-data.com crime index
Crime - Violent crime index
Crime - Property crime index
Crime - Murders per 100,000 population (5 year average)
Crime - Rapes per 100,000 population (5 year average)
Crime - Robberies per 100,000 population (5 year average)
Crime - Assaults per 100,000 population (5 year average)
Crime - Burglaries per 100,000 population (5 year average)
Crime - Thefts per 100,000 population (5 year average)
Crime - Auto thefts per 100,000 population (5 year average)
Crime - Arson per 100,000 population (5 year average)
Crime - City-data.com crime index (5 year average)
Crime - Violent crime index (5 year average)
Crime - Property crime index (5 year average)
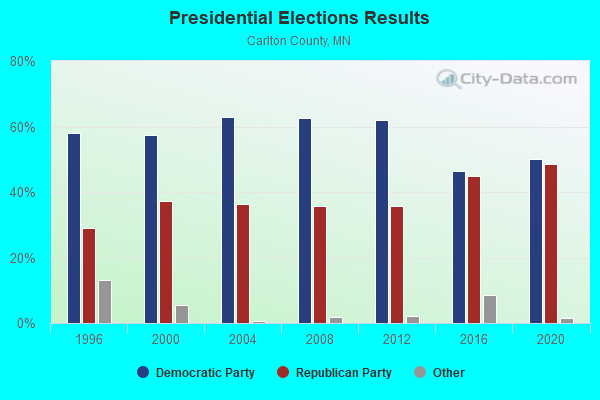
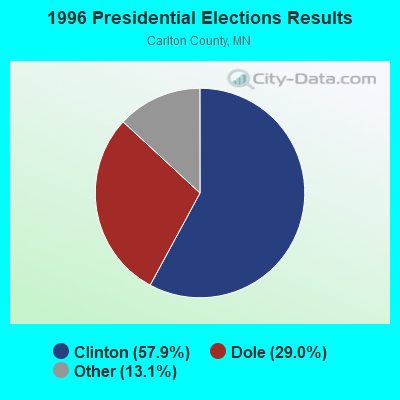
1996 Presidential Elections Results (%) - Democratic Party (Clinton)
1996 Presidential Elections Results (%) - Republican Party (Dole)
1996 Presidential Elections Results (%) - Other
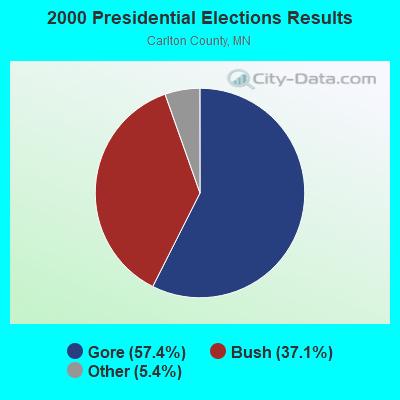
2000 Presidential Elections Results (%) - Democratic Party (Gore)
2000 Presidential Elections Results (%) - Republican Party (Bush)
2000 Presidential Elections Results (%) - Other
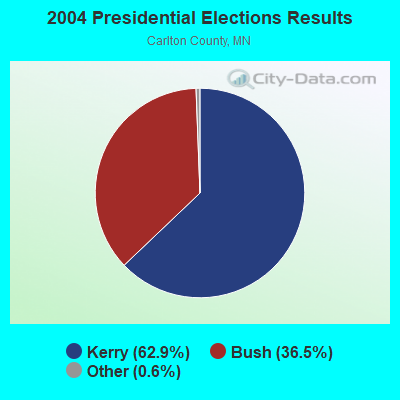
2004 Presidential Elections Results (%) - Democratic Party (Kerry)
2004 Presidential Elections Results (%) - Republican Party (Bush)
2004 Presidential Elections Results (%) - Other
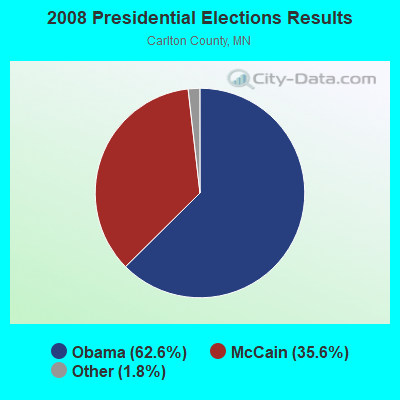
2008 Presidential Elections Results (%) - Democratic Party (Obama)
2008 Presidential Elections Results (%) - Republican Party (McCain)
2008 Presidential Elections Results (%) - Other
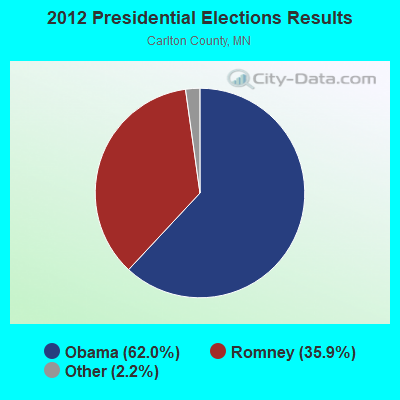
2012 Presidential Elections Results (%) - Democratic Party (Obama)
2012 Presidential Elections Results (%) - Republican Party (Romney)
2012 Presidential Elections Results (%) - Other
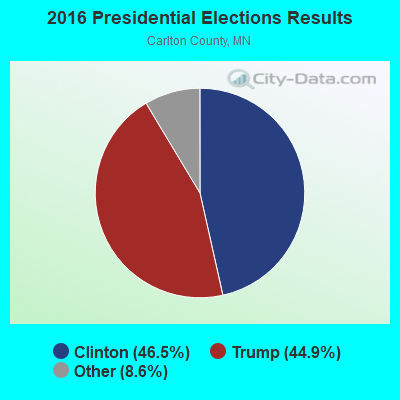
2016 Presidential Elections Results (%) - Democratic Party (Clinton)
2016 Presidential Elections Results (%) - Republican Party (Trump)
2016 Presidential Elections Results (%) - Other
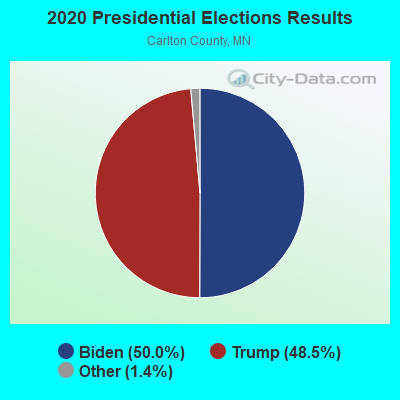
2020 Presidential Elections Results (%) - Democratic Party (Biden)
2020 Presidential Elections Results (%) - Republican Party (Trump)
2020 Presidential Elections Results (%) - Other
Ancestries Reported - Arab (%)
Ancestries Reported - Czech (%)
Ancestries Reported - Danish (%)
Ancestries Reported - Dutch (%)
Ancestries Reported - English (%)
Ancestries Reported - French (%)
Ancestries Reported - French Canadian (%)
Ancestries Reported - German (%)
Ancestries Reported - Greek (%)
Ancestries Reported - Hungarian (%)
Ancestries Reported - Irish (%)
Ancestries Reported - Italian (%)
Ancestries Reported - Lithuanian (%)
Ancestries Reported - Norwegian (%)
Ancestries Reported - Polish (%)
Ancestries Reported - Portuguese (%)
Ancestries Reported - Russian (%)
Ancestries Reported - Scotch-Irish (%)
Ancestries Reported - Scottish (%)
Ancestries Reported - Slovak (%)
Ancestries Reported - Subsaharan African (%)
Ancestries Reported - Swedish (%)
Ancestries Reported - Swiss (%)
Ancestries Reported - Ukrainian (%)
Ancestries Reported - United States (%)
Ancestries Reported - Welsh (%)
Ancestries Reported - West Indian (%)
Ancestries Reported - Other (%)
Educational Attainment - No schooling completed (%)
Educational Attainment - Less than high school (%)
Educational Attainment - High school or equivalent (%)
Educational Attainment - Less than 1 year of college (%)
Educational Attainment - 1 or more years of college (%)
Educational Attainment - Associate degree (%)
Educational Attainment - Bachelor's degree (%)
Educational Attainment - Master's degree (%)
Educational Attainment - Professional school degree (%)
Educational Attainment - Doctorate degree (%)
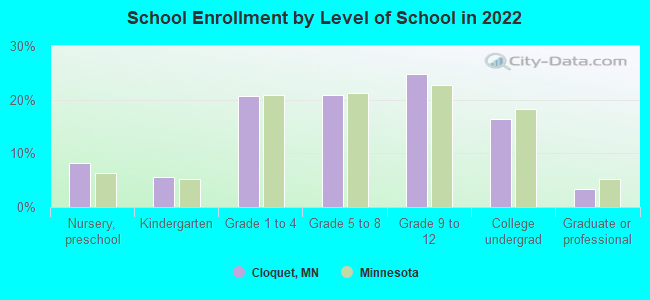
School Enrollment - Nursery, preschool (%)
School Enrollment - Kindergarten (%)
School Enrollment - Grade 1 to 4 (%)
School Enrollment - Grade 5 to 8 (%)
School Enrollment - Grade 9 to 12 (%)
School Enrollment - College undergrad (%)
School Enrollment - Graduate or professional (%)
School Enrollment - Not enrolled in school (%)
School enrollment - Public schools (%)
School enrollment - Private schools (%)
School enrollment - Not enrolled (%)
Median number of rooms in houses and condos
Median number of rooms in apartments
Housing units lacking complete plumbing facilities (%)
Housing units lacking complete kitchen facilities (%)
Density of houses
Urban houses (%)
Rural houses (%)
Households with people 60 years and over (%)
Households with people 65 years and over (%)
Households with people 75 years and over (%)
Households with one or more nonrelatives (%)
Households with no nonrelatives (%)
Population in households (%)
Family households (%)
Nonfamily households (%)
Population in families (%)
Family households with own children (%)
Median number of bedrooms in owner occupied houses
Mean number of bedrooms in owner occupied houses
Median number of bedrooms in renter occupied houses
Mean number of bedrooms in renter occupied houses
Median number of vehichles in owner occupied houses
Mean number of vehichles in owner occupied houses
Median number of vehichles in renter occupied houses
Mean number of vehichles in renter occupied houses
Mortgage status - with mortgage (%)
Mortgage status - with second mortgage (%)
Mortgage status - with home equity loan (%)
Mortgage status - with both second mortgage and home equity loan (%)
Mortgage status - without a mortgage (%)
Average family size
Average family size - White
Average family size - Black or African American
Average family size - Asian
Average family size - Hispanic or Latino
Average family size - American Indian and Alaska Native
Average family size - Multirace
Average family size - Other Race
Geographical mobility - Same house 1 year ago (%)
Geographical mobility - Moved within same county (%)
Geographical mobility - Moved from different county within same state (%)
Geographical mobility - Moved from different state (%)
Geographical mobility - Moved from abroad (%)
Place of birth - Born in state of residence (%)
Place of birth - Born in other state (%)
Place of birth - Native, outside of US (%)
Place of birth - Foreign born (%)
Housing units in structures - 1, detached (%)
Housing units in structures - 1, attached (%)
Housing units in structures - 2 (%)
Housing units in structures - 3 or 4 (%)
Housing units in structures - 5 to 9 (%)
Housing units in structures - 10 to 19 (%)
Housing units in structures - 20 to 49 (%)
Housing units in structures - 50 or more (%)
Housing units in structures - Mobile home (%)
Housing units in structures - Boat, RV, van, etc. (%)
House/condo owner moved in on average (years ago)
Renter moved in on average (years ago)
Year householder moved into unit - Moved in 1999 to March 2000 (%)
Year householder moved into unit - Moved in 1995 to 1998 (%)
Year householder moved into unit - Moved in 1990 to 1994 (%)
Year householder moved into unit - Moved in 1980 to 1989 (%)
Year householder moved into unit - Moved in 1970 to 1979 (%)
Year householder moved into unit - Moved in 1969 or earlier (%)
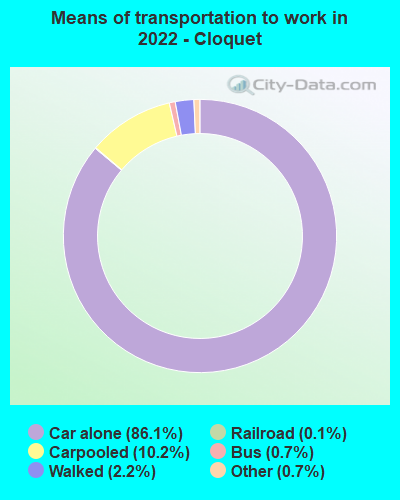
Means of transportation to work - Drove car alone (%)
Means of transportation to work - Carpooled (%)
Means of transportation to work - Public transportation (%)
Means of transportation to work - Bus or trolley bus (%)
Means of transportation to work - Streetcar or trolley car (%)
Means of transportation to work - Subway or elevated (%)
Means of transportation to work - Railroad (%)
Means of transportation to work - Ferryboat (%)
Means of transportation to work - Taxicab (%)
Means of transportation to work - Motorcycle (%)
Means of transportation to work - Bicycle (%)
Means of transportation to work - Walked (%)
Means of transportation to work - Other means (%)
Working at home (%)
Industry diversity
Most Common Industries - Agriculture, forestry, fishing and hunting, and mining (%)
Most Common Industries - Agriculture, forestry, fishing and hunting (%)
Most Common Industries - Mining, quarrying, and oil and gas extraction (%)
Most Common Industries - Construction (%)
Most Common Industries - Manufacturing (%)
Most Common Industries - Wholesale trade (%)
Most Common Industries - Retail trade (%)
Most Common Industries - Transportation and warehousing, and utilities (%)
Most Common Industries - Transportation and warehousing (%)
Most Common Industries - Utilities (%)
Most Common Industries - Information (%)
Most Common Industries - Finance and insurance, and real estate and rental and leasing (%)
Most Common Industries - Finance and insurance (%)
Most Common Industries - Real estate and rental and leasing (%)
Most Common Industries - Professional, scientific, and management, and administrative and waste management services (%)
Most Common Industries - Professional, scientific, and technical services (%)
Most Common Industries - Management of companies and enterprises (%)
Most Common Industries - Administrative and support and waste management services (%)
Most Common Industries - Educational services, and health care and social assistance (%)
Most Common Industries - Educational services (%)
Most Common Industries - Health care and social assistance (%)
Most Common Industries - Arts, entertainment, and recreation, and accommodation and food services (%)
Most Common Industries - Arts, entertainment, and recreation (%)
Most Common Industries - Accommodation and food services (%)
Most Common Industries - Other services, except public administration (%)
Most Common Industries - Public administration (%)
Occupation diversity
Most Common Occupations - Management, business, science, and arts occupations (%)
Most Common Occupations - Management, business, and financial occupations (%)
Most Common Occupations - Management occupations (%)
Most Common Occupations - Business and financial operations occupations (%)
Most Common Occupations - Computer, engineering, and science occupations (%)
Most Common Occupations - Computer and mathematical occupations (%)
Most Common Occupations - Architecture and engineering occupations (%)
Most Common Occupations - Life, physical, and social science occupations (%)
Most Common Occupations - Education, legal, community service, arts, and media occupations (%)
Most Common Occupations - Community and social service occupations (%)
Most Common Occupations - Legal occupations (%)
Most Common Occupations - Education, training, and library occupations (%)
Most Common Occupations - Arts, design, entertainment, sports, and media occupations (%)
Most Common Occupations - Healthcare practitioners and technical occupations (%)
Most Common Occupations - Health diagnosing and treating practitioners and other technical occupations (%)
Most Common Occupations - Health technologists and technicians (%)
Most Common Occupations - Service occupations (%)
Most Common Occupations - Healthcare support occupations (%)
Most Common Occupations - Protective service occupations (%)
Most Common Occupations - Fire fighting and prevention, and other protective service workers including supervisors (%)
Most Common Occupations - Law enforcement workers including supervisors (%)
Most Common Occupations - Food preparation and serving related occupations (%)
Most Common Occupations - Building and grounds cleaning and maintenance occupations (%)
Most Common Occupations - Personal care and service occupations (%)
Most Common Occupations - Sales and office occupations (%)
Most Common Occupations - Sales and related occupations (%)
Most Common Occupations - Office and administrative support occupations (%)
Most Common Occupations - Natural resources, construction, and maintenance occupations (%)
Most Common Occupations - Farming, fishing, and forestry occupations (%)
Most Common Occupations - Construction and extraction occupations (%)
Most Common Occupations - Installation, maintenance, and repair occupations (%)
Most Common Occupations - Production, transportation, and material moving occupations (%)
Most Common Occupations - Production occupations (%)
Most Common Occupations - Transportation occupations (%)
Most Common Occupations - Material moving occupations (%)
People in Group quarters - Institutionalized population (%)
People in Group quarters - Correctional institutions (%)
People in Group quarters - Federal prisons and detention centers (%)
People in Group quarters - Halfway houses (%)
People in Group quarters - Local jails and other confinement facilities (including police lockups) (%)
People in Group quarters - Military disciplinary barracks (%)
People in Group quarters - State prisons (%)
People in Group quarters - Other types of correctional institutions (%)
People in Group quarters - Nursing homes (%)
People in Group quarters - Hospitals/wards, hospices, and schools for the handicapped (%)
People in Group quarters - Hospitals/wards and hospices for chronically ill (%)
People in Group quarters - Hospices or homes for chronically ill (%)
People in Group quarters - Military hospitals or wards for chronically ill (%)
People in Group quarters - Other hospitals or wards for chronically ill (%)
People in Group quarters - Hospitals or wards for drug/alcohol abuse (%)
People in Group quarters - Mental (Psychiatric) hospitals or wards (%)
People in Group quarters - Schools, hospitals, or wards for the mentally retarded (%)
People in Group quarters - Schools, hospitals, or wards for the physically handicapped (%)
People in Group quarters - Institutions for the deaf (%)
People in Group quarters - Institutions for the blind (%)
People in Group quarters - Orthopedic wards and institutions for the physically handicapped (%)
People in Group quarters - Wards in general hospitals for patients who have no usual home elsewhere (%)
People in Group quarters - Wards in military hospitals for patients who have no usual home elsewhere (%)
People in Group quarters - Juvenile institutions (%)
People in Group quarters - Long-term care (%)
People in Group quarters - Homes for abused, dependent, and neglected children (%)
People in Group quarters - Residential treatment centers for emotionally disturbed children (%)
People in Group quarters - Training schools for juvenile delinquents (%)
People in Group quarters - Short-term care, detention or diagnostic centers for delinquent children (%)
People in Group quarters - Type of juvenile institution unknown (%)
People in Group quarters - Noninstitutionalized population (%)
People in Group quarters - College dormitories (includes college quarters off campus) (%)
People in Group quarters - Military quarters (%)
People in Group quarters - On base (%)
People in Group quarters - Barracks, unaccompanied personnel housing (UPH), (Enlisted/Officer), ;and similar group living quarters for military personnel (%)
People in Group quarters - Transient quarters for temporary residents (%)
People in Group quarters - Military ships (%)
People in Group quarters - Group homes (%)
People in Group quarters - Homes or halfway houses for drug/alcohol abuse (%)
People in Group quarters - Homes for the mentally ill (%)
People in Group quarters - Homes for the mentally retarded (%)
People in Group quarters - Homes for the physically handicapped (%)
People in Group quarters - Other group homes (%)
People in Group quarters - Religious group quarters (%)
People in Group quarters - Dormitories (%)
People in Group quarters - Agriculture workers' dormitories on farms (%)
People in Group quarters - Job Corps and vocational training facilities (%)
People in Group quarters - Other workers' dormitories (%)
People in Group quarters - Crews of maritime vessels (%)
People in Group quarters - Other nonhousehold living situations (%)
People in Group quarters - Other noninstitutional group quarters (%)
Residents speaking English at home (%)
Residents speaking English at home - Born in the United States (%)
Residents speaking English at home - Native, born elsewhere (%)
Residents speaking English at home - Foreign born (%)
Residents speaking Spanish at home (%)
Residents speaking Spanish at home - Born in the United States (%)
Residents speaking Spanish at home - Native, born elsewhere (%)
Residents speaking Spanish at home - Foreign born (%)
Residents speaking other language at home (%)
Residents speaking other language at home - Born in the United States (%)
Residents speaking other language at home - Native, born elsewhere (%)
Residents speaking other language at home - Foreign born (%)
Class of Workers - Employee of private company (%)
Class of Workers - Self-employed in own incorporated business (%)
Class of Workers - Private not-for-profit wage and salary workers (%)
Class of Workers - Local government workers (%)
Class of Workers - State government workers (%)
Class of Workers - Federal government workers (%)
Class of Workers - Self-employed workers in own not incorporated business and Unpaid family workers (%)
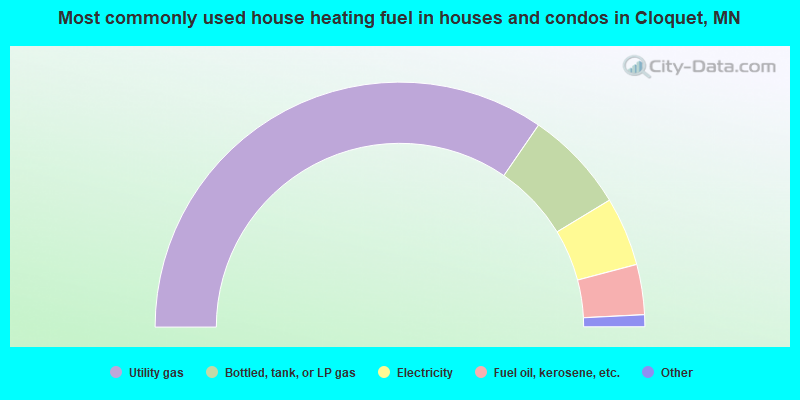
House heating fuel used in houses and condos - Utility gas (%)
House heating fuel used in houses and condos - Bottled, tank, or LP gas (%)
House heating fuel used in houses and condos - Electricity (%)
House heating fuel used in houses and condos - Fuel oil, kerosene, etc. (%)
House heating fuel used in houses and condos - Coal or coke (%)
House heating fuel used in houses and condos - Wood (%)
House heating fuel used in houses and condos - Solar energy (%)
House heating fuel used in houses and condos - Other fuel (%)
House heating fuel used in houses and condos - No fuel used (%)
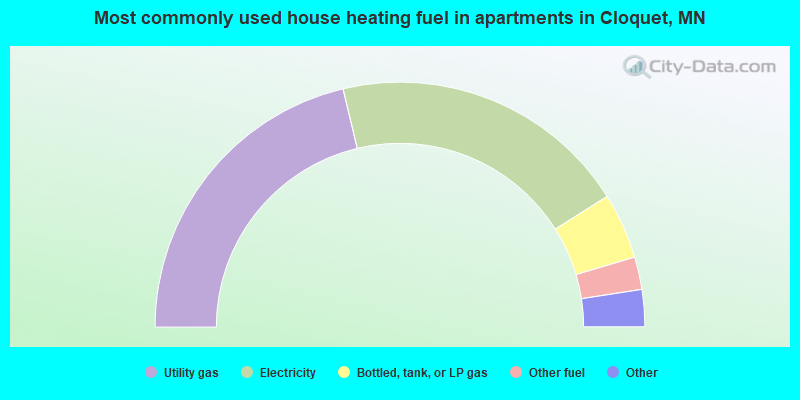
House heating fuel used in apartments - Utility gas (%)
House heating fuel used in apartments - Bottled, tank, or LP gas (%)
House heating fuel used in apartments - Electricity (%)
House heating fuel used in apartments - Fuel oil, kerosene, etc. (%)
House heating fuel used in apartments - Coal or coke (%)
House heating fuel used in apartments - Wood (%)
House heating fuel used in apartments - Solar energy (%)
House heating fuel used in apartments - Other fuel (%)
House heating fuel used in apartments - No fuel used (%)
Armed forces status - In Armed Forces (%)
Armed forces status - Civilian (%)
Armed forces status - Civilian - Veteran (%)
Armed forces status - Civilian - Nonveteran (%)
Fatal accidents locations in years 2005-2021
Fatal accidents locations in 2005
Fatal accidents locations in 2006
Fatal accidents locations in 2007
Fatal accidents locations in 2008
Fatal accidents locations in 2009
Fatal accidents locations in 2010
Fatal accidents locations in 2011
Fatal accidents locations in 2012
Fatal accidents locations in 2013
Fatal accidents locations in 2014
Fatal accidents locations in 2015
Fatal accidents locations in 2016
Fatal accidents locations in 2017
Fatal accidents locations in 2018
Fatal accidents locations in 2019
Fatal accidents locations in 2020
Fatal accidents locations in 2021
Alcohol use - People drinking some alcohol every month (%)
Alcohol use - People not drinking at all (%)
Alcohol use - Average days/month drinking alcohol
Alcohol use - Average drinks/week
Alcohol use - Average days/year people drink much
Audiometry - Average condition of hearing (%)
Audiometry - People that can hear a whisper from across a quiet room (%)
Audiometry - People that can hear normal voice from across a quiet room (%)
Audiometry - Ears ringing, roaring, buzzing (%)
Audiometry - Had a job exposure to loud noise (%)
Audiometry - Had off-work exposure to loud noise (%)
Blood Pressure & Cholesterol - Has high blood pressure (%)
Blood Pressure & Cholesterol - Checking blood pressure at home (%)
Blood Pressure & Cholesterol - Frequently checking blood cholesterol (%)
Blood Pressure & Cholesterol - Has high cholesterol level (%)
Consumer Behavior - Money monthly spent on food at supermarket/grocery store
Consumer Behavior - Money monthly spent on food at other stores
Consumer Behavior - Money monthly spent on eating out
Consumer Behavior - Money monthly spent on carryout/delivered foods
Consumer Behavior - Income spent on food at supermarket/grocery store (%)
Consumer Behavior - Income spent on food at other stores (%)
Consumer Behavior - Income spent on eating out (%)
Consumer Behavior - Income spent on carryout/delivered foods (%)
Current Health Status - General health condition (%)
Current Health Status - Blood donors (%)
Current Health Status - Has blood ever tested for HIV virus (%)
Current Health Status - Left-handed people (%)
Dermatology - People using sunscreen (%)
Diabetes - Diabetics (%)
Diabetes - Had a blood test for high blood sugar (%)
Diabetes - People taking insulin (%)
Diet Behavior & Nutrition - Diet health (%)
Diet Behavior & Nutrition - Milk product consumption (# of products/month)
Diet Behavior & Nutrition - Meals not home prepared (#/week)
Diet Behavior & Nutrition - Meals from fast food or pizza place (#/week)
Diet Behavior & Nutrition - Ready-to-eat foods (#/month)
Diet Behavior & Nutrition - Frozen meals/pizza (#/month)
Drug Use - People that ever used marijuana or hashish (%)
Drug Use - Ever used hard drugs (%)
Drug Use - Ever used any form of cocaine (%)
Drug Use - Ever used heroin (%)
Drug Use - Ever used methamphetamine (%)
Health Insurance - People covered by health insurance (%)
Kidney Conditions-Urology - Avg. # of times urinating at night
Medical Conditions - People with asthma (%)
Medical Conditions - People with anemia (%)
Medical Conditions - People with psoriasis (%)
Medical Conditions - People with overweight (%)
Medical Conditions - Elderly people having difficulties in thinking or remembering (%)
Medical Conditions - People who ever received blood transfusion (%)
Medical Conditions - People having trouble seeing even with glass/contacts (%)
Medical Conditions - People with arthritis (%)
Medical Conditions - People with gout (%)
Medical Conditions - People with congestive heart failure (%)
Medical Conditions - People with coronary heart disease (%)
Medical Conditions - People with angina pectoris (%)
Medical Conditions - People who ever had heart attack (%)
Medical Conditions - People who ever had stroke (%)
Medical Conditions - People with emphysema (%)
Medical Conditions - People with thyroid problem (%)
Medical Conditions - People with chronic bronchitis (%)
Medical Conditions - People with any liver condition (%)
Medical Conditions - People who ever had cancer or malignancy (%)
Mental Health - People who have little interest in doing things (%)
Mental Health - People feeling down, depressed, or hopeless (%)
Mental Health - People who have trouble sleeping or sleeping too much (%)
Mental Health - People feeling tired or having little energy (%)
Mental Health - People with poor appetite or overeating (%)
Mental Health - People feeling bad about themself (%)
Mental Health - People who have trouble concentrating on things (%)
Mental Health - People moving or speaking slowly or too fast (%)
Mental Health - People having thoughts they would be better off dead (%)
Oral Health - Average years since last visit a dentist
Oral Health - People embarrassed because of mouth (%)
Oral Health - People with gum disease (%)
Oral Health - General health of teeth and gums (%)
Oral Health - Average days a week using dental floss/device
Oral Health - Average days a week using mouthwash for dental problem
Oral Health - Average number of teeth
Pesticide Use - Households using pesticides to control insects (%)
Pesticide Use - Households using pesticides to kill weeds (%)
Physical Activity - People doing vigorous-intensity work activities (%)
Physical Activity - People doing moderate-intensity work activities (%)
Physical Activity - People walking or bicycling (%)
Physical Activity - People doing vigorous-intensity recreational activities (%)
Physical Activity - People doing moderate-intensity recreational activities (%)
Physical Activity - Average hours a day doing sedentary activities
Physical Activity - Average hours a day watching TV or videos
Physical Activity - Average hours a day using computer
Physical Functioning - People having limitations keeping them from working (%)
Physical Functioning - People limited in amount of work they can do (%)
Physical Functioning - People that need special equipment to walk (%)
Physical Functioning - People experiencing confusion/memory problems (%)
Physical Functioning - People requiring special healthcare equipment (%)
Prescription Medications - Average number of prescription medicines taking
Preventive Aspirin Use - Adults 40+ taking low-dose aspirin (%)
Reproductive Health - Vaginal deliveries (%)
Reproductive Health - Cesarean deliveries (%)
Reproductive Health - Deliveries resulted in a live birth (%)
Reproductive Health - Pregnancies resulted in a delivery (%)
Reproductive Health - Women breastfeeding newborns (%)
Reproductive Health - Women that had a hysterectomy (%)
Reproductive Health - Women that had both ovaries removed (%)
Reproductive Health - Women that have ever taken birth control pills (%)
Reproductive Health - Women taking birth control pills (%)
Reproductive Health - Women that have ever used Depo-Provera or injectables (%)
Reproductive Health - Women that have ever used female hormones (%)
Sexual Behavior - People 18+ that ever had sex (vaginal, anal, or oral) (%)
Sexual Behavior - Males 18+ that ever had vaginal sex with a woman (%)
Sexual Behavior - Males 18+ that ever performed oral sex on a woman (%)
Sexual Behavior - Males 18+ that ever had anal sex with a woman (%)
Sexual Behavior - Males 18+ that ever had any sex with a man (%)
Sexual Behavior - Females 18+ that ever had vaginal sex with a man (%)
Sexual Behavior - Females 18+ that ever performed oral sex on a man (%)
Sexual Behavior - Females 18+ that ever had anal sex with a man (%)
Sexual Behavior - Females 18+ that ever had any kind of sex with a woman (%)
Sexual Behavior - Average age people first had sex
Sexual Behavior - Average number of female sex partners in lifetime (males 18+)
Sexual Behavior - Average number of female vaginal sex partners in lifetime (males 18+)
Sexual Behavior - Average age people first performed oral sex on a woman (18+)
Sexual Behavior - Average number of woman performed oral sex on in lifetime (18+)
Sexual Behavior - Average number of male sex partners in lifetime (males 18+)
Sexual Behavior - Average number of male anal sex partners in lifetime (males 18+)
Sexual Behavior - Average age people first performed oral sex on a man (18+)
Sexual Behavior - Average number of male oral sex partners in lifetime (18+)
Sexual Behavior - People using protection when performing oral sex (%)
Sexual Behavior - Average number of times people have vaginal or anal sex a year
Sexual Behavior - People having sex without condom (%)
Sexual Behavior - Average number of male sex partners in lifetime (females 18+)
Sexual Behavior - Average number of male vaginal sex partners in lifetime (females 18+)
Sexual Behavior - Average number of female sex partners in lifetime (females 18+)
Sexual Behavior - Circumcised males 18+ (%)
Sleep Disorders - Average hours sleeping at night
Sleep Disorders - People that has trouble sleeping (%)
Smoking-Cigarette Use - People smoking cigarettes (%)
Taste & Smell - People 40+ having problems with smell (%)
Taste & Smell - People 40+ having problems with taste (%)
Taste & Smell - People 40+ that ever had wisdom teeth removed (%)
Taste & Smell - People 40+ that ever had tonsils teeth removed (%)
Taste & Smell - People 40+ that ever had a loss of consciousness because of a head injury (%)
Taste & Smell - People 40+ that ever had a broken nose or other serious injury to face or skull (%)
Taste & Smell - People 40+ that ever had two or more sinus infections (%)
Weight - Average height (inches)
Weight - Average weight (pounds)
Weight - Average BMI
Weight - People that are obese (%)
Weight - People that ever were obese (%)
Weight - People trying to lose weight (%)
Officers per 1,000 residents here:
1.83Minnesota average:
1.76
Latest news from Cloquet, MN collected exclusively by city-data.com from local newspapers, TV, and radio stations
Ancestries: German (14.1%), Finnish (8.5%), Norwegian (8.5%), American (7.1%), Irish (6.7%), English (6.0%).
Current Local Time:
Land area: 35.2 square miles.
Population density: 358 people per square mile (very low).
134 residents are foreign born
This city:
1.1%Minnesota:
8.5%
Median real estate property taxes paid for housing units with mortgages in 2022: $2,741 (1.3%)Median real estate property taxes paid for housing units with no mortgage in 2022: $2,530 (1.4%)
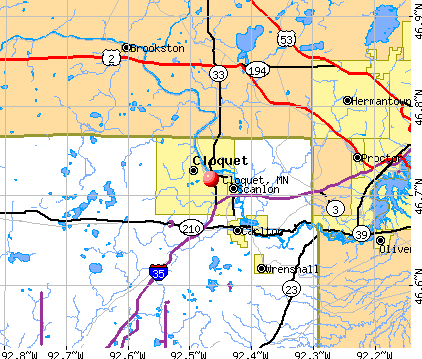
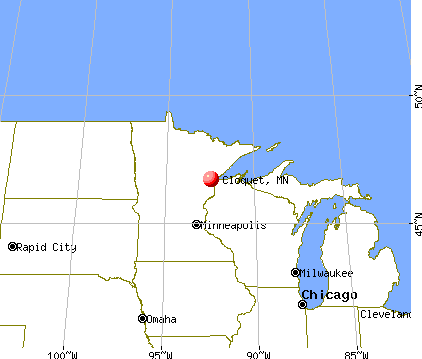
Nearest city with pop. 50,000+: Duluth, MN
Nearest city with pop. 200,000+: St. Paul, MN
Nearest city with pop. 1,000,000+: Chicago, IL
Nearest cities:
Thomson, MN (2.2 miles),
Brookston, MN (3.5 miles),
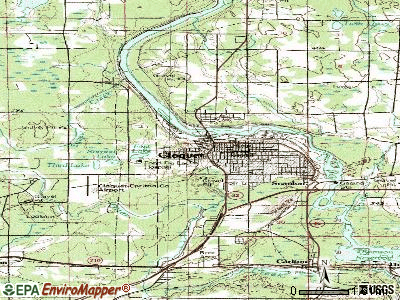
Latitude: 46.72 N, Longitude: 92.47 W
Daytime population change due to commuting: +905 (+7.2%)Workers who live and work in this city: 2,895 (47.9%)
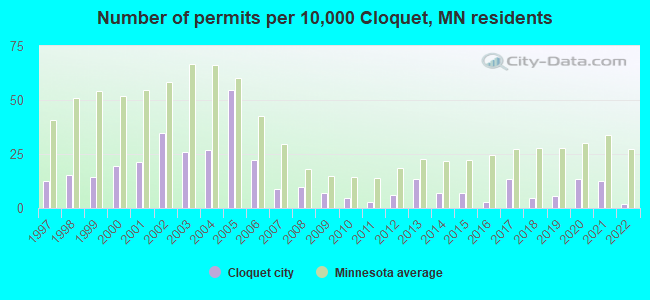
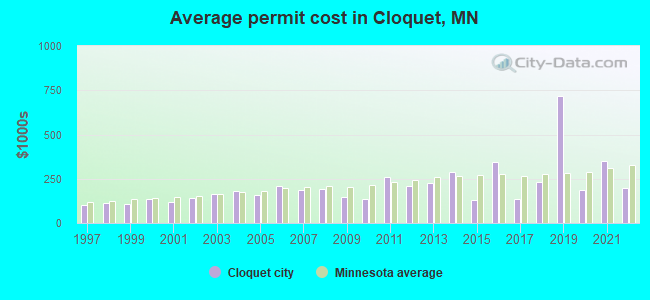
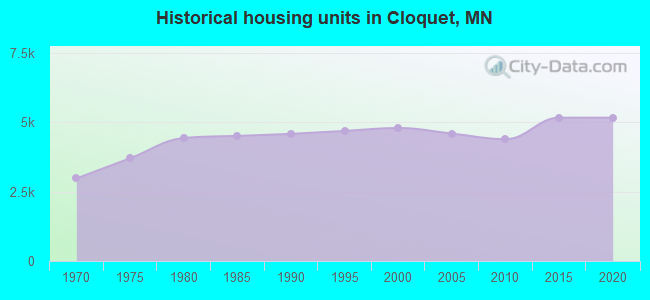
Single-family new house construction building permits:
2022: 2 buildings , average cost: $195,2002021: 14 buildings , average cost: $350,0002020: 15 buildings , average cost: $187,5002019: 6 buildings , average cost: $720,2002018: 5 buildings , average cost: $234,0002017: 15 buildings , average cost: $133,3002016: 3 buildings , average cost: $346,3002015: 8 buildings , average cost: $131,9002014: 8 buildings , average cost: $285,9002013: 15 buildings , average cost: $225,1002012: 7 buildings , average cost: $210,6002011: 3 buildings , average cost: $260,7002010: 5 buildings , average cost: $137,1002009: 8 buildings , average cost: $147,8002008: 11 buildings , average cost: $191,8002007: 10 buildings , average cost: $184,1002006: 25 buildings , average cost: $210,0002005: 61 buildings , average cost: $160,8002004: 30 buildings , average cost: $179,8002003: 29 buildings , average cost: $166,2002002: 39 buildings , average cost: $141,1002001: 24 buildings , average cost: $119,4002000: 22 buildings , average cost: $134,4001999: 16 buildings , average cost: $105,1001998: 17 buildings , average cost: $112,7001997: 14 buildings , average cost: $100,100Unemployment in December 2023:
Population change in the 1990s: +34 (+0.3%).
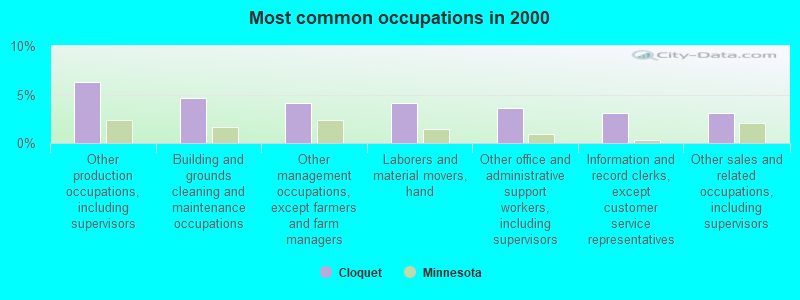
Most common occupations in Cloquet, MN (%)
Both Males Females
Other production occupations, including supervisors (6.3%)
Building and grounds cleaning and maintenance occupations (4.6%)
Other management occupations, except farmers and farm managers (4.1%)
Laborers and material movers, hand (4.1%)
Other office and administrative support workers, including supervisors (3.6%)
Information and record clerks, except customer service representatives (3.1%)
Other sales and related occupations, including supervisors (3.1%)
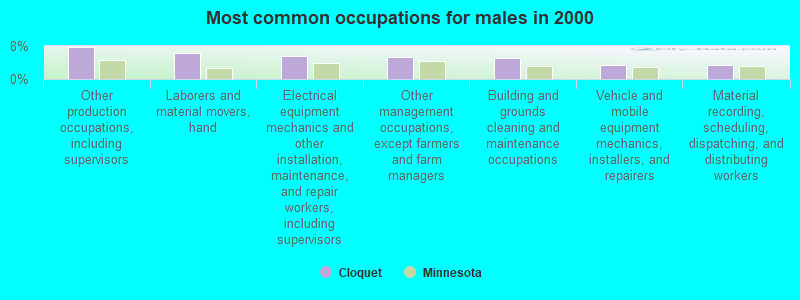
Other production occupations, including supervisors (7.7%)
Laborers and material movers, hand (6.4%)
Electrical equipment mechanics and other installation, maintenance, and repair workers, including supervisors (5.5%)
Other management occupations, except farmers and farm managers (5.3%)
Building and grounds cleaning and maintenance occupations (5.2%)
Vehicle and mobile equipment mechanics, installers, and repairers (3.4%)
Material recording, scheduling, dispatching, and distributing workers (3.4%)
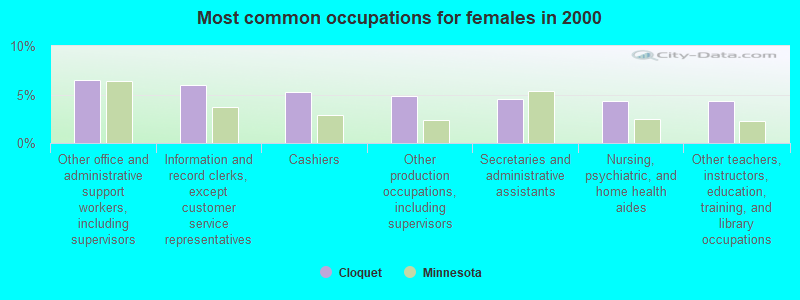
Other office and administrative support workers, including supervisors (6.5%)
Information and record clerks, except customer service representatives (6.0%)
Cashiers (5.3%)
Other production occupations, including supervisors (4.9%)
Secretaries and administrative assistants (4.6%)
Nursing, psychiatric, and home health aides (4.3%)
Other teachers, instructors, education, training, and library occupations (4.3%)
Tornado activity:
Cloquet-area historical tornado activity is significantly below Minnesota state average. It is 68% smaller than the overall U.S. average.
On 6/11/1966, a category F4 (max. wind speeds 207-260 mph) tornado 18.9 miles away from the Cloquet city center caused between $50,000 and $500,000 in damages.
On 8/6/1969, a category F3 (max. wind speeds 158-206 mph) tornado 21.8 miles away from the city center injured 20 people and caused between $500,000 and $5,000,000 in damages.
Earthquake activity:
Cloquet-area historical earthquake activity is significantly above Minnesota state average. It is 63% smaller than the overall U.S. average. On 7/9/1975 at 14:54:15, a magnitude 4.6 (4.6 MB, Class: Light, Intensity: IV - V) earthquake occurred 185.9 miles away from Cloquet center On 6/5/1993 at 01:24:53, a magnitude 4.1 (4.1 LG, Depth: 6.2 mi) earthquake occurred 196.9 miles away from the city center On 2/7/2020 at 18:30:28, a magnitude 3.3 (3.3 ML, Class: Light, Intensity: II - III) earthquake occurred 54.0 miles away from Cloquet center On 1/9/2020 at 18:16:48, a magnitude 3.3 (3.3 MB) earthquake occurred 58.3 miles away from Cloquet center On 4/8/2020 at 17:14:33, a magnitude 3.3 (3.3 ML) earthquake occurred 59.4 miles away from Cloquet center On 4/21/2020 at 17:12:46, a magnitude 3.2 (3.2 ML) earthquake occurred 56.9 miles away from Cloquet center Magnitude types: regional Lg-wave magnitude (LG), body-wave magnitude (MB), local magnitude (ML) Natural disasters: The number of natural disasters in Carlton County (8) is smaller than the US average (15).Major Disasters (Presidential) Declared: 4Emergencies Declared: 2Floods: 5, Storms: 4, Drought: 1, Hurricane: 1, Tornado: 1, Wind: 1, Other: 1 (Note: some incidents may be assigned to more than one category). Hospitals and medical centers in Cloquet: COMMUNITY MEMORIAL HOSPITAL (Voluntary non-profit - Private, provides emergency services, 512 SKYLINE BOULEVARD) CARLTON COUNTY HEALTH SERVICES (30 TENTH STREET NORTH)
SUNNYSIDE HEALTH CARE CENTER (512 SKYLINE BOULEVARD)
Amtrak station near Cloquet: 17 miles: DULUTH (2122 W. SUPERIOR ST.) - Bus Station Services: enclosed waiting area, public restrooms, public payphones, call for taxi service.
College/University in Cloquet: Fond du Lac Tribal and Community College Full-time enrollment: 1,301; Location: 2101 14th St; Public; Website: www.fdltcc.edu)
Colleges/universities with over 2000 students nearest to Cloquet:
Lake Superior College (about 16 miles; Duluth, MN ; Full-time enrollment: 3,768)
University of Wisconsin-Superior (about 18 miles; Superior, WI ; FT enrollment: 2,302)
The College of Saint Scholastica (about 19 miles; Duluth, MN ; FT enrollment: 3,762)
University of Minnesota-Duluth (about 20 miles; Duluth, MN ; FT enrollment: 10,612)
Wisconsin Indianhead Technical College (about 73 miles; Shell Lake, WI ; FT enrollment: 2,414)
Central Lakes College-Brainerd (about 88 miles; Brainerd, MN ; FT enrollment: 3,371)
St Cloud Technical and Community College (about 114 miles; Saint Cloud, MN ; FT enrollment: 3,493)
Public high schools in Cloquet:
Public elementary/middle schools in Cloquet:
Private elementary/middle school in Cloquet: QUEEN OF PEACE SCHOOL Students: 101, Location: 102 4TH ST, Grades: PK-6)
See full list of schools located in Cloquet Library in Cloquet: CLOQUET PUBLIC LIBRARY Operating income: $491,807; Location: 320 14TH ST; 47,565 books ; 15,555 e-books ; 2,119 audio materials ; 1,989 video materials ; 1 local licensed databases ; 14 state licensed databases ; 4 other licensed databases ; 173 print serial subscriptions ; 9 electronic serial subscriptions )
Notable locations in Cloquet: (A) , Cloquet Golf Club (B) , Cloquet Forest Experiment Station (C) , Cloquet - Duluth KOA Campground (D) , Cloquet (E) , Pine Tree Plaza (F) , Spafford Park Campground (G) , Fond du Lac Tribal and Community Center (H) , Pine Valley Ski Chalet (I) , Cloquet Police Department (J) , Cloquet Fire Department (K) , Cloquet County History and Heritage Center (L) , Cloquet Public Library (M) . Display/hide their locations on the map
Churches in Cloquet include: (A) , Saint Paul's Lutheran Church (B) , Queen of Peace Parish (C) , Zion Lutheran Church (D) , Cloquet Assembly of God Church (E) , Bethany Covenant Church (F) , Saint Andrew's Episcopal Church (G) , River of Life Church (H) , Presbyterian Church of Cloquet (I) . Display/hide their locations on the map
Cemeteries: (1) , Calvary Cemetery (2) , Maple Grove Cemetery (3) , Hillcrest Cemetery (4) , Holy Family Cemeteries (5) . Display/hide their locations on the map
Lakes: (A) , Second Lake (B) , First Lake (C) . Display/hide their locations on the map
Creek: (A) . Display/hide its location on the map
Parks in Cloquet include: (1) , Wentworth Park (2) , Veterans Park (3) , Fauley Park (4) , Athletic Park (5) , Spafford Park (6) , Sunnyside Park (7) , Pine Valley Park (8) , Hilltop Park (9) . Display/hide their locations on the map
Tourist attractions: (1) , Kendahl Miniature Golf (Amusement & Theme Parks; 812 Sunnyside Drive) (2) , LCS Coaches Inc (Tours & Charters; 1203 Avenue B) (3) . Display/hide their approximate locations on the map
Hotels: (1) , Driftwood Motel (1413 Highway 33 South) (2) , Americinn Motel (111 Big Lake Road) (3) , Sunnyside Motel (807 Sunnyside Drive) (4) . Display/hide their approximate locations on the map
Birthplace of: Barbara Payton - Actress, Jessica Lange - (born 1949), actor, Derek Plante - Ice hockey player, Dick Hanley (American football) - Football player and coach, Chief Chouneau - Baseball player, Corey Millen - Ice hockey player.
Carlton County has a predicted average indoor radon screening level between 2 and 4 pCi/L (pico curies per liter) - Moderate Potential Drinking water stations with addresses in Cloquet that have no violations reported:
CLOQUET (Address: 1307 Cloquet Avenue Population served: 11,499, Primary Water Source Type: Groundwater)
Average household size: This city:
2.4 peopleMinnesota:
2.5 people
Percentage of family households: This city:
63.0%Whole state:
64.6%
Percentage of households with unmarried partners: This city:
10.0%Whole state:
6.9%
Likely homosexual households (counted as self-reported same-sex unmarried-partner households)
Lesbian couples: 0.4% of all households Gay men: 0.2% of all households
People in group quarters in Cloquet in 2010:
83 people in nursing facilities/skilled-nursing facilities
55 people in college/university student housing
49 people in group homes intended for adults
11 people in group homes for juveniles (non-correctional)
People in group quarters in Cloquet in 2000:
84 people in nursing homes
44 people in college dormitories (includes college quarters off campus)
25 people in hospitals or wards for drug/alcohol abuse
16 people in homes for the physically handicapped
7 people in other noninstitutional group quarters
6 people in homes for the mentally retarded
Banks with branches in Cloquet (2011 data):
Cornerstone State Bank: 1516 Cloquet Avenue Branch at 1516 Cloquet Avenue, branch established on 1958/01/01. Info updated 2010/08/30: Bank assets: $116.7 mil, Deposits: $104.4 mil, headquarters in Montgomery, MN, positive income , Commercial Lending Specialization, 5 total offices , Holding Company: Cornerstone Bancorporation, Inc.
Woodlands National Bank: Cloquet Branch at 240 North Road, branch established on 2005/12/07. Info updated 2010/05/27: Bank assets: $137.8 mil, Deposits: $110.5 mil, headquarters in Hinckley, MN, positive income , Commercial Lending Specialization, 7 total offices , Holding Company: Mille Lacs Bancorporation, Inc.
North Shore Bank of Commerce: Cloquet Office at 902 Stanley Avenue, branch established on 2004/11/04. Info updated 2006/11/03: Bank assets: $226.4 mil, Deposits: $210.3 mil, headquarters in Duluth, MN, positive income , Commercial Lending Specialization, 8 total offices , Holding Company: North Shore Financial Corporation
Frandsen Bank & Trust: Cloquet Branch at 712 Hwy 33 S., branch established on 1996/10/21. Info updated 2012/03/26: Bank assets: $1,439.6 mil, Deposits: $1,194.5 mil, headquarters in Lonsdale, MN, positive income , Commercial Lending Specialization, 38 total offices , Holding Company: Frandsen Financial Corporation
U.S. Bank National Association: Cloquet Branch at 715 Cloquet Avenue, branch established on 1900/01/01. Info updated 2012/01/30: Bank assets: $330,470.8 mil, Deposits: $236,091.5 mil, headquarters in Cincinnati, OH, positive income , 3121 total offices , Holding Company: U.S. Bancorp
Wells Fargo Bank, National Association: Cloquet Branch at 1502 Highway 33 South, branch established on 1964/01/02. Info updated 2011/04/05: Bank assets: $1,161,490.0 mil, Deposits: $905,653.0 mil, headquarters in Sioux Falls, SD, positive income , 6395 total offices , Holding Company: Wells Fargo & Company
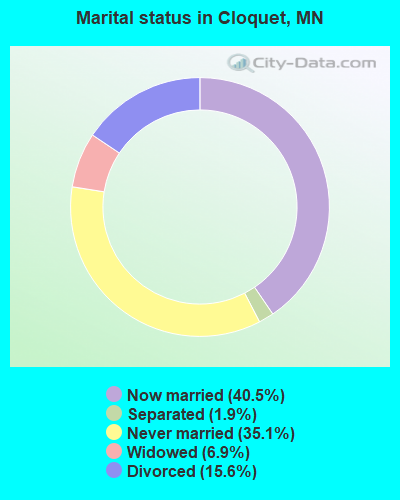
For population 15 years and over in Cloquet:
Never married: 35.1%Now married: 40.5%Separated: 1.9%Widowed: 6.9%Divorced: 15.6% For population 25 years and over in Cloquet:
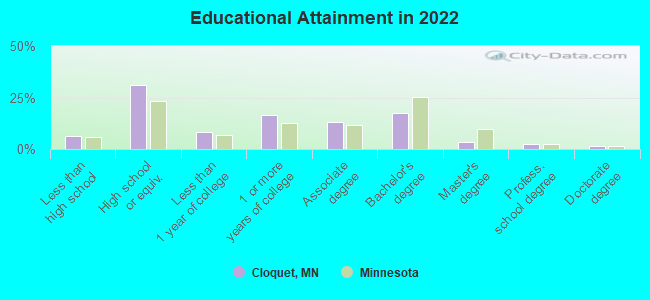
High school or higher: 93.0%Bachelor's degree or higher: 24.3%Graduate or professional degree: 7.1%Unemployed: 7.4%Mean travel time to work (commute): 14.6 minutes
Education Gini index (Inequality in education) Here:
9.5Minnesota average:
10.9
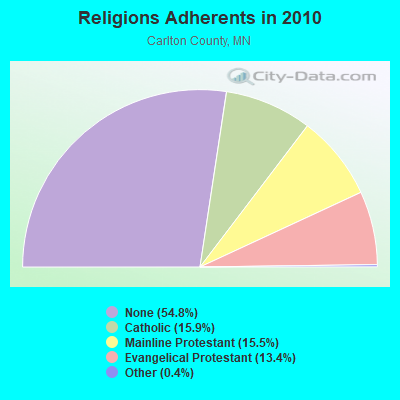
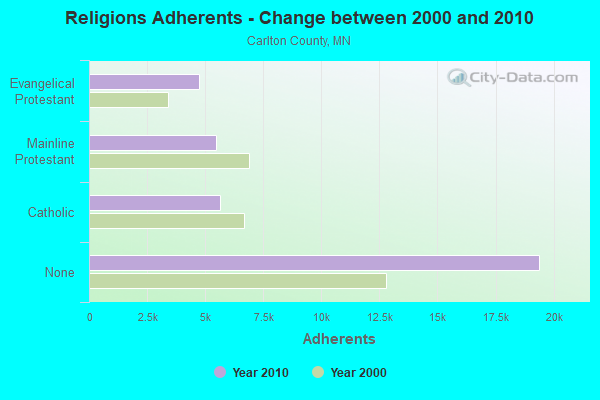
Religion statistics for Cloquet, MN (based on Carlton County data)
Religion Adherents Congregations Catholic 5,632 6 Mainline Protestant 5,485 18 Evangelical Protestant 4,740 30 Other 138 3 None 19,391 -
Source: Clifford Grammich, Kirk Hadaway, Richard Houseal, Dale E.Jones, Alexei Krindatch, Richie Stanley and Richard H.Taylor. 2012. 2010 U.S.Religion Census: Religious Congregations & Membership Study. Association of Statisticians of American Religious Bodies. Jones, Dale E., et al. 2002. Congregations and Membership in the United States 2000. Nashville, TN: Glenmary Research Center. Graphs represent county-level data
Food Environment Statistics: Number of grocery stores : 4Carlton County :
1.19 / 10,000 pop.Minnesota :
1.83 / 10,000 pop.
Number of supercenters and club stores : 1This county :
0.30 / 10,000 pop.Minnesota :
0.13 / 10,000 pop.
Number of convenience stores (no gas) : 1Here :
0.30 / 10,000 pop.Minnesota :
0.49 / 10,000 pop.
Number of convenience stores (with gas) : 22Carlton County :
6.54 / 10,000 pop.Minnesota :
3.90 / 10,000 pop.
Number of full-service restaurants : 24This county :
7.14 / 10,000 pop.State :
6.98 / 10,000 pop.
Adult diabetes rate : Carlton County :
7.3%State :
6.5%
Adult obesity rate : Carlton County :
27.2%Minnesota :
25.9%
Low-income preschool obesity rate : This county :
10.3%Minnesota :
13.0%
Health and Nutrition: Healthy diet rate : Cloquet:
57.9%Minnesota:
50.6%
Average overall health of teeth and gums : Cloquet:
58.0%Minnesota:
48.4%
People feeling badly about themselves : Cloquet:
17.5%Minnesota:
21.0%
People not drinking alcohol at all : Cloquet:
7.6%Minnesota:
9.8%
Average hours sleeping at night : This city:
7.0Minnesota:
6.8
Overweight people : Here:
32.3%Minnesota:
33.5%
General health condition : Cloquet:
63.6%Minnesota:
57.7%
Average condition of hearing : This city:
81.0%State:
79.3%
More about Health and Nutrition of Cloquet, MN Residents
Local government employment and payroll (March 2022)
Function
Full-time employees
Monthly full-time payroll
Average yearly full-time wage
Part-time employees
Monthly part-time payroll
Police Protection - Officers
24 $154,950 $77,475 0 $0 Streets and Highways
15 $89,363 $71,490 0 $0 Water Supply
9 $50,786 $67,715 0 $0 Local Libraries
6 $29,227 $58,454 7 $7,633 Other Government Administration
6 $42,804 $85,608 7 $4,400 Financial Administration
3 $19,275 $77,100 0 $0 Sewerage
2 $13,281 $79,686 0 $0 Other and Unallocable
2 $11,420 $68,520 0 $0 Parks and Recreation
2 $8,758 $52,548 4 $3,230 Police - Other
1 $4,722 $56,664 0 $0 Housing and Community Development (Local)
1 $8,963 $107,556 0 $0
Totals for Government
71 $433,550 $73,276 18 $15,263
Cloquet government finances - Expenditure in 2017 (per resident):
Construction - Regular Highways: $3,546,000 ($281.36)
Current Operations - Water Utilities: $3,743,000 ($296.99)
Police Protection: $2,507,000 ($198.92)Sewerage: $1,546,000 ($122.67)Regular Highways: $1,512,000 ($119.97)General - Other: $869,000 ($68.95)Parks and Recreation: $662,000 ($52.53)Libraries: $535,000 ($42.45)Financial Administration: $417,000 ($33.09)Central Staff Services: $105,000 ($8.33)Housing and Community Development: $69,000 ($5.47)Protective Inspection and Regulation - Other: $32,000 ($2.54)Solid Waste Management: $9,000 ($0.71)General - Interest on Debt: $153,000 ($12.14)
Other Capital Outlay - Parks and Recreation: $1,852,000 ($146.95)
Sewerage: $571,000 ($45.31)Water Utilities: $531,000 ($42.13)Regular Highways: $441,000 ($34.99)General - Other: $65,000 ($5.16)Police Protection: $15,000 ($1.19)Water Utilities - Interest on Debt: $27,000 ($2.14)
Cloquet government finances - Revenue in 2017 (per resident):
Charges - Sewerage: $1,553,000 ($123.22)
Regular Highways: $364,000 ($28.88)Other: $285,000 ($22.61)Parks and Recreation: $182,000 ($14.44)Solid Waste Management: $41,000 ($3.25)Federal Intergovernmental - Housing and Community Development: $60,000 ($4.76)
Other: $3,000 ($0.24)Local Intergovernmental - Other: $7,000 ($0.56)
Highways: $2,000 ($0.16)Miscellaneous - General Revenue - Other: $2,205,000 ($174.96)
Special Assessments: $127,000 ($10.08)Interest Earnings: $60,000 ($4.76)Fines and Forfeits: $57,000 ($4.52)Revenue - Water Utilities: $3,727,000 ($295.72)
State Intergovernmental - General Local Government Support: $2,357,000 ($187.02)
Other: $1,489,000 ($118.15)Tax - Property: $2,813,000 ($223.20)
General Sales and Gross Receipts: $921,000 ($73.08)Other License: $127,000 ($10.08)Public Utilities Sales: $108,000 ($8.57)Other Selective Sales: $58,000 ($4.60)
Cloquet government finances - Debt in 2017 (per resident):
Long Term Debt - Beginning Outstanding - Public Debt for Private Purpose: $69,719,000 ($5531.94)
Outstanding Nonguaranteed - Industrial Revenue: $67,543,000 ($5359.28)Outstanding Unspecified Public Purpose: $3,580,000 ($284.06)Beginning Outstanding - Unspecified Public Purpose: $3,126,000 ($248.04)Retired Nonguaranteed - Public Debt for Private Purpose: $2,176,000 ($172.66)Issue, Unspecified Public Purpose: $1,095,000 ($86.88)Retired Unspecified Public Purpose: $641,000 ($50.86)
Cloquet government finances - Cash and Securities in 2017 (per resident):
Other Funds - Cash and Securities: $4,691,000 ($372.21)
Sinking Funds - Cash and Securities: $67,973,000 ($5393.40)
Businesses in Cloquet, MN
Name Count Name Count
AT&T 1 Lane Furniture 1 AmericInn 1 Little Caesars Pizza 1 Applebee's 1 Maurices 1 Arby's 1 McDonald's 1 Blockbuster 1 Pizza Hut 1 Curves 1 Subway 2 Dairy Queen 1 Super 8 1 FedEx 1 True Value 1 Ford 1 U-Haul 2 Goodwill 1 UPS 1 H&R Block 1 Walmart 1 La-Z-Boy 1 Wendy's 1
Strongest AM radio stations in Cloquet:
WEBC (560 AM; 50 kW; DULUTH, MN)
WWJC (850 AM; daytime; 10 kW; DULUTH, MN; Owner: WWJC, INC.)
WKLK (1230 AM; 1 kW; CLOQUET, MN; Owner: QB BROADCASTING, LTD.)
WDSM (710 AM; 10 kW; SUPERIOR, WI; Owner: MIDWEST COMMUNICATIONS, INC.)
KDAL (610 AM; 5 kW; DULUTH, MN; Owner: MIDWEST COMMUNICATIONS, INC.)
WNMT (650 AM; 10 kW; NASHWAUK, MN; Owner: MIDWEST RADIO NETWORK, L.L.C.)
WCCO (830 AM; 50 kW; MINNEAPOLIS, MN; Owner: INFINITY MEDIA CORPORATION)
WGEE (970 AM; 1 kW; SUPERIOR, WI; Owner: MIDWEST COMMUNICATIONS, INC.)
WCTS (1030 AM; 50 kW; MAPLEWOOD, MN; Owner: CNTL. BAPT. THEO/AL SEMI MINNEAPOLIS)
KSTP (1500 AM; 50 kW; ST. PAUL, MN; Owner: KSTP-AM, LLC (DELAWARE))
KQDS (1490 AM; 1 kW; DULUTH, MN; Owner: RED ROCK RADIO CORP.)
KFAN (1130 AM; 50 kW; MINNEAPOLIS, MN; Owner: AMFM RADIO LICENSES, L.L.C.)
KPRM (870 AM; 25 kW; PARK RAPIDS, MN; Owner: DE LA HUNT BROADCASTING CORP.)
Strongest FM radio stations in Cloquet:
WKLK-FM (96.5 FM; CLOQUET, MN; Owner: QB BROADCASTING, LTD.)
KBMX (107.7 FM; PROCTOR, MN; Owner: REGENT BROADCASTING OF DULUTH, INC.)
WWAX (92.1 FM; HERMANTOWN, MN; Owner: RED ROCK RADIO CORP.)
WSCN (100.5 FM; CLOQUET, MN; Owner: MINNESOTA PUBLIC RADIO)
KQDS-FM (94.9 FM; DULUTH, MN; Owner: RED ROCK RADIO CORP.)
KDNI (90.5 FM; DULUTH, MN; Owner: NORTHWESTERN COLLEGE)
KLDJ (101.7 FM; DULUTH, MN; Owner: REGENT BROADCASTING OF DULUTH, INC.)
KUMD-FM (103.3 FM; DULUTH, MN; Owner: REGENTS OF UNIVERSITY OF MINNESOTA)
KDAL-FM (95.7 FM; DULUTH, MN; Owner: MIDWEST COMMUNICATIONS, INC.)
KKCB (105.1 FM; DULUTH, MN; Owner: REGENT BROADCASTING OF DULUTH, INC.)
KUWS (91.3 FM; SUPERIOR, WI; Owner: BD. OF REGENTS, UNIV. OF WISC. SYS.)
WSCD-FM (92.9 FM; DULUTH, MN; Owner: MINNESOTA PUBLIC RADIO)
KRBR-FM (102.5 FM; SUPERIOR, WI; Owner: MIDWEST COMMUNICATIONS, INC.)
KTCO (98.9 FM; DULUTH, MN; Owner: MIDWEST COMMUNICATIONS, INC.)
KDNW (97.3 FM; DULUTH, MN; Owner: NORTHWESTERN COLLEGE)
WNCB (89.5 FM; DULUTH, MN; Owner: REFUGE MEDIA GROUP)
W203AL (88.5 FM; DULUTH, MN; Owner: FAMILY STATIONS, INC.)
KZIO (104.3 FM; TWO HARBORS, MN; Owner: RED ROCK RADIO CORP.)
TV broadcast stations around Cloquet:
WDIO-TV (Channel 10; DULUTH, MN; Owner: WDIO-TV, LLC)
KDLH (Channel 3; DULUTH, MN; Owner: CHELSEY BROADCASTING COMPANY OF DULUTH, LLC)
KBJR-TV (Channel 6; SUPERIOR, WI; Owner: KBJR LICENSE, INC.)
KQDS-TV (Channel 21; DULUTH, MN; Owner: KQDS ACQUISITION CORP.)
WDSE-TV (Channel 8; DULUTH, MN; Owner: DULUTH-SUPERIOR AREA EDUCATIONAL TV CORPORATION)
K58CM (Channel 58; DULUTH, MN; Owner: TRINITY BROADCASTING NETWORK)
K38DS (Channel 38; DULUTH, MN; Owner: STEVEN R. ZUKERBERG)
K62EP (Channel 62; DULUTH, MN; Owner: DAN BLECHMAN)
K64EF (Channel 64; DULUTH, MN; Owner: STEVEN R. ZUKERBERG)
K68EA (Channel 68; DULUTH, MN; Owner: MS COMMUNICATIONS, LLC)
KWMN-LP (Channel 56; DULUTH, MN; Owner: DULUTH DATACASTING PARTNERS, G.P.)
KDUL-LP (Channel 60; DULUTH, MN; Owner: DULUTH TV PARTNERS, GP)
K15DU (Channel 15; DULUTH, MN; Owner: DAN BLECHMAN)
K66EO (Channel 66; DULUTH, MN; Owner: HAROLD AND/ OR SUE KROGMAN)
National Bridge Inventory (NBI) Statistics 45 Number of bridges594ft / 181m Total length $2,920,000,000 Total costs339,247 Total average daily traffic19,561 Total average daily truck traffic
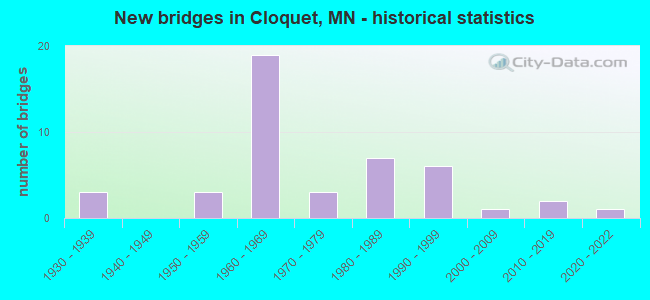
New bridges - historical statistics
3 1930-1939 3 1950-1959 19 1960-1969 3 1970-1979 7 1980-1989 6 1990-1999 1 2000-2009 2 2010-2019 1 2020-2022
See full National Bridge Inventory statistics for Cloquet, MN
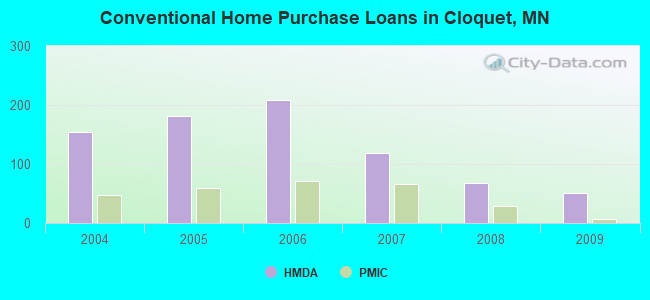
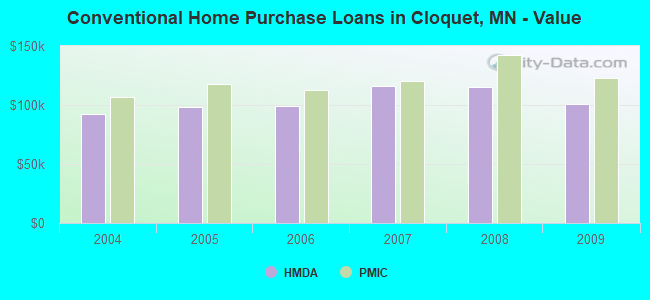
Home Mortgage Disclosure Act Aggregated Statistics For Year 2009(Based on 1 full and 2 partial tracts) A) FHA, FSA/RHS & VA B) Conventional C) Refinancings D) Home Improvement Loans F) Non-occupant Loans on G) Loans On Manufactured Number Average Value Number Average Value Number Average Value Number Average Value Number Average Value Number Average Value
LOANS ORIGINATED 54 $119,540 51 $101,132 197 $126,211 26 $35,703 23 $88,517 1 $88,850 APPLICATIONS APPROVED, NOT ACCEPTED 1 $62,940 2 $54,685 22 $124,705 4 $44,378 0 $0 1 $235,590 APPLICATIONS DENIED 9 $67,256 8 $75,939 51 $133,346 9 $31,832 5 $40,438 2 $239,600 APPLICATIONS WITHDRAWN 3 $107,017 2 $75,200 23 $151,119 2 $3,825 1 $165,470 0 $0 FILES CLOSED FOR INCOMPLETENESS 1 $95,670 1 $94,980 11 $96,750 2 $87,060 2 $84,945 2 $87,160
Aggregated Statistics For Year 2008(Based on 1 full and 2 partial tracts) A) FHA, FSA/RHS & VA B) Conventional C) Refinancings D) Home Improvement Loans E) Loans on Dwellings For 5+ Families F) Non-occupant Loans on G) Loans On Manufactured Number Average Value Number Average Value Number Average Value Number Average Value Number Average Value Number Average Value Number Average Value
LOANS ORIGINATED 31 $132,431 68 $114,912 107 $112,657 30 $28,642 1 $227,570 22 $85,083 7 $72,204 APPLICATIONS APPROVED, NOT ACCEPTED 2 $188,590 8 $123,310 17 $101,505 4 $125,578 0 $0 0 $0 0 $0 APPLICATIONS DENIED 4 $91,415 16 $133,522 75 $111,544 13 $27,353 0 $0 7 $106,057 4 $71,062 APPLICATIONS WITHDRAWN 4 $142,728 3 $124,540 23 $119,634 5 $118,962 1 $1,219,540 2 $67,250 0 $0 FILES CLOSED FOR INCOMPLETENESS 1 $198,340 2 $105,565 10 $112,497 1 $33,120 0 $0 1 $23,920 0 $0
Aggregated Statistics For Year 2007(Based on 1 full and 2 partial tracts) A) FHA, FSA/RHS & VA B) Conventional C) Refinancings D) Home Improvement Loans E) Loans on Dwellings For 5+ Families F) Non-occupant Loans on G) Loans On Manufactured Number Average Value Number Average Value Number Average Value Number Average Value Number Average Value Number Average Value Number Average Value
LOANS ORIGINATED 14 $148,980 119 $115,799 173 $109,960 39 $31,590 2 $2,296,070 23 $136,563 3 $99,357 APPLICATIONS APPROVED, NOT ACCEPTED 0 $0 12 $128,457 32 $114,876 4 $54,638 0 $0 2 $94,250 0 $0 APPLICATIONS DENIED 4 $124,850 17 $104,434 109 $121,775 17 $62,482 1 $71,750 20 $151,272 2 $92,420 APPLICATIONS WITHDRAWN 0 $0 12 $112,048 41 $119,086 2 $44,550 0 $0 2 $182,530 0 $0 FILES CLOSED FOR INCOMPLETENESS 0 $0 5 $76,774 14 $140,336 1 $113,230 0 $0 0 $0 0 $0
Aggregated Statistics For Year 2006(Based on 1 full and 2 partial tracts) A) FHA, FSA/RHS & VA B) Conventional C) Refinancings D) Home Improvement Loans E) Loans on Dwellings For 5+ Families F) Non-occupant Loans on G) Loans On Manufactured Number Average Value Number Average Value Number Average Value Number Average Value Number Average Value Number Average Value Number Average Value
LOANS ORIGINATED 9 $148,326 209 $98,742 174 $111,077 39 $31,443 2 $283,070 22 $121,547 5 $72,764 APPLICATIONS APPROVED, NOT ACCEPTED 0 $0 26 $98,029 18 $113,340 7 $49,269 0 $0 3 $86,140 0 $0 APPLICATIONS DENIED 0 $0 33 $101,563 100 $124,622 29 $49,584 0 $0 13 $133,350 4 $63,000 APPLICATIONS WITHDRAWN 2 $112,610 5 $126,838 69 $123,491 10 $121,442 0 $0 2 $120,900 0 $0 FILES CLOSED FOR INCOMPLETENESS 0 $0 10 $117,383 25 $113,779 1 $23,920 0 $0 2 $155,085 0 $0
Aggregated Statistics For Year 2005(Based on 1 full and 2 partial tracts) A) FHA, FSA/RHS & VA B) Conventional C) Refinancings D) Home Improvement Loans E) Loans on Dwellings For 5+ Families F) Non-occupant Loans on G) Loans On Manufactured Number Average Value Number Average Value Number Average Value Number Average Value Number Average Value Number Average Value Number Average Value
LOANS ORIGINATED 15 $114,038 182 $98,206 233 $95,336 51 $40,545 1 $2,168,860 40 $93,031 11 $34,241 APPLICATIONS APPROVED, NOT ACCEPTED 0 $0 17 $70,165 25 $95,374 7 $34,871 0 $0 5 $48,792 0 $0 APPLICATIONS DENIED 1 $96,630 34 $81,119 101 $115,579 24 $35,284 0 $0 11 $100,198 4 $42,888 APPLICATIONS WITHDRAWN 0 $0 29 $117,370 69 $121,771 4 $59,465 0 $0 6 $93,577 1 $66,090 FILES CLOSED FOR INCOMPLETENESS 0 $0 8 $108,915 20 $113,042 0 $0 0 $0 1 $153,730 0 $0
Aggregated Statistics For Year 2004(Based on 1 full and 2 partial tracts) A) FHA, FSA/RHS & VA B) Conventional C) Refinancings D) Home Improvement Loans E) Loans on Dwellings For 5+ Families F) Non-occupant Loans on G) Loans On Manufactured Number Average Value Number Average Value Number Average Value Number Average Value Number Average Value Number Average Value Number Average Value
LOANS ORIGINATED 20 $108,936 154 $92,712 219 $103,886 60 $35,331 1 $48,780 24 $95,332 5 $65,866 APPLICATIONS APPROVED, NOT ACCEPTED 1 $75,530 19 $111,952 30 $96,405 5 $80,406 0 $0 0 $0 1 $43,100 APPLICATIONS DENIED 1 $69,240 23 $82,850 95 $104,975 16 $40,478 1 $88,970 9 $66,674 12 $65,709 APPLICATIONS WITHDRAWN 0 $0 13 $103,168 73 $129,844 9 $34,026 0 $0 3 $87,200 0 $0 FILES CLOSED FOR INCOMPLETENESS 0 $0 2 $103,575 16 $105,546 2 $69,450 0 $0 0 $0 0 $0
Detailed HMDA statistics for the following Tracts:
9701.00
, 9702.00 , 9707.00
Private Mortgage Insurance Companies Aggregated Statistics For Year 2009(Based on 1 full and 2 partial tracts) A) Conventional B) Refinancings Number Average Value Number Average Value
LOANS ORIGINATED 7 $122,973 10 $154,105 APPLICATIONS APPROVED, NOT ACCEPTED 2 $84,670 2 $100,265 APPLICATIONS DENIED 0 $0 1 $137,760 APPLICATIONS WITHDRAWN 0 $0 0 $0 FILES CLOSED FOR INCOMPLETENESS 0 $0 0 $0
Aggregated Statistics For Year 2008(Based on 1 full and 2 partial tracts) A) Conventional B) Refinancings C) Non-occupant Loans on Number Average Value Number Average Value Number Average Value
LOANS ORIGINATED 28 $142,150 6 $216,203 1 $127,920 APPLICATIONS APPROVED, NOT ACCEPTED 12 $120,752 9 $146,380 0 $0 APPLICATIONS DENIED 0 $0 0 $0 0 $0 APPLICATIONS WITHDRAWN 0 $0 1 $111,930 0 $0 FILES CLOSED FOR INCOMPLETENESS 1 $66,880 0 $0 0 $0
Aggregated Statistics For Year 2007(Based on 1 full and 2 partial tracts) A) Conventional B) Refinancings C) Non-occupant Loans on Number Average Value Number Average Value Number Average Value
LOANS ORIGINATED 66 $120,131 18 $138,178 2 $127,240 APPLICATIONS APPROVED, NOT ACCEPTED 9 $109,933 8 $132,370 0 $0 APPLICATIONS DENIED 0 $0 0 $0 0 $0 APPLICATIONS WITHDRAWN 1 $79,410 2 $132,715 1 $107,150 FILES CLOSED FOR INCOMPLETENESS 1 $123,410 2 $141,590 0 $0
Aggregated Statistics For Year 2006(Based on 1 full and 2 partial tracts) A) Conventional B) Refinancings C) Non-occupant Loans on Number Average Value Number Average Value Number Average Value
LOANS ORIGINATED 72 $112,793 11 $161,694 3 $137,897 APPLICATIONS APPROVED, NOT ACCEPTED 4 $125,308 3 $152,017 0 $0 APPLICATIONS DENIED 0 $0 0 $0 0 $0 APPLICATIONS WITHDRAWN 2 $117,195 0 $0 0 $0 FILES CLOSED FOR INCOMPLETENESS 0 $0 0 $0 0 $0
Aggregated Statistics For Year 2005(Based on 1 full and 2 partial tracts) A) Conventional B) Refinancings C) Non-occupant Loans on D) Loans On Manufactured Number Average Value Number Average Value Number Average Value Number Average Value
LOANS ORIGINATED 60 $118,018 23 $145,858 4 $64,688 2 $98,350 APPLICATIONS APPROVED, NOT ACCEPTED 4 $135,128 2 $182,145 0 $0 1 $99,140 APPLICATIONS DENIED 0 $0 0 $0 0 $0 0 $0 APPLICATIONS WITHDRAWN 3 $109,080 1 $108,110 1 $30,610 0 $0 FILES CLOSED FOR INCOMPLETENESS 0 $0 0 $0 0 $0 0 $0
Aggregated Statistics For Year 2004(Based on 1 full and 2 partial tracts) A) Conventional B) Refinancings C) Non-occupant Loans on D) Loans On Manufactured Number Average Value Number Average Value Number Average Value Number Average Value
LOANS ORIGINATED 47 $106,698 17 $115,781 5 $63,574 0 $0 APPLICATIONS APPROVED, NOT ACCEPTED 3 $108,157 6 $138,993 0 $0 1 $95,990 APPLICATIONS DENIED 0 $0 1 $77,890 0 $0 0 $0 APPLICATIONS WITHDRAWN 3 $109,080 1 $55,860 1 $55,860 0 $0 FILES CLOSED FOR INCOMPLETENESS 0 $0 3 $107,633 0 $0 0 $0
Detailed PMIC statistics for the following Tracts:
9701.00
, 9702.00 , 9707.00 Cloquet compared to Minnesota state average:
Median house value below state average. Unemployed percentage below state average. Black race population percentage significantly below state average. Hispanic race population percentage below state average. Median age below state average. Foreign-born population percentage significantly below state average. Length of stay since moving in above state average.
#61 on the list of "Top 101 cities with largest percentage of females in occupations: community and social service occupations (population 5,000+)"
#75 on the list of "Top 101 cities with largest percentage of males in industries: arts, entertainment, and recreation (population 5,000+)"
#77 on the list of "Top 101 cities with the largest percentage of people in hospitals or wards for drug/alcohol abuse (population 1,000+)"
#50 (55720) on the list of "Top 101 zip codes with the largest percentage of Swedish first ancestries (pop 5,000+)"
#79 on the list of "Top 101 counties with the lowest Ozone (1-hour) air pollution readings in 2012 (ppm)"
Top Patent Applicants
Joseph P. Erickson (4)
Joseph Phillip Erickson (4)
Jon Arthur Syverson (3)
Joseph Erickson (3)
Larry R. Pulkrabek (2)
Brian Krohn (1)
Luke Richard-Ivar Heine (1)
Matthew Langdon (1)
Jon A. Syverson (1)
Total of 20 patent applications in 2008-2024.


 Recent articles from our blog. Our writers, many of them Ph.D. graduates or candidates, create easy-to-read articles on a wide variety of topics.

 (17.1 miles
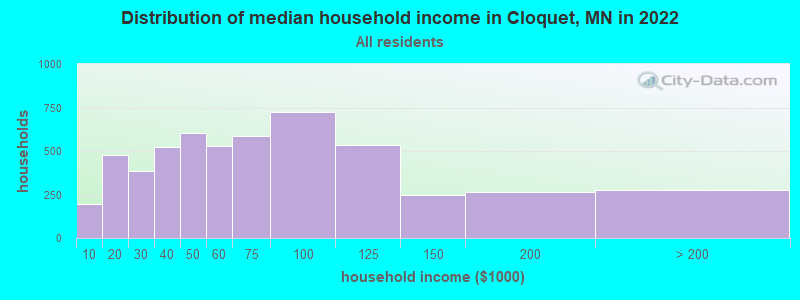


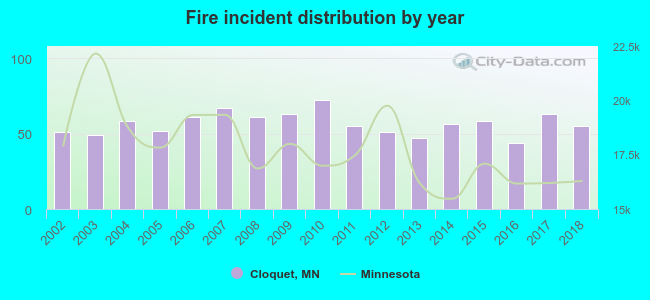 According to the data from the years 2002 - 2018 the average number of fire incidents per year is 57. The highest number of fire incidents - 72 took place in 2010, and the least - 44 in 2016. The data has an increasing trend.
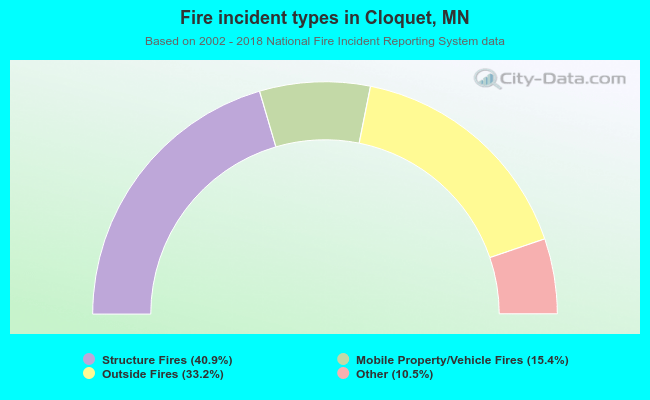 When looking into fire subcategories, the most incidents belonged to: Structure Fires (40.9%), and Outside Fires (33.2%).