Percentage of residents living in poverty in 2022: 3.8%
(4.0% for White Non-Hispanic residents, 4.7% for Black residents, 0.4% for two or more races residents)
According to our research of Indiana and other state lists, there were 2 registered sex offenders living in Cumberland, Indiana as of June 16, 2024. The ratio of all residents to sex offenders in Cumberland is 2,737 to 1. The ratio of registered sex offenders to all residents in this city is much lower than the state average.
Crime rates in Cumberland by year
Type
2011
2012
2013
2014
2015
2016
2017
2018
2019
2020
2021
2022
Murders (per 100,000)
2 (38.5)
1 (19.1)
0 (0.0)
0 (0.0)
1 (18.5)
2 (36.4)
0 (0.0)
1 (17.4)
0 (0.0)
2 (32.8)
0 (0.0)
1 (15.7)
Rapes (per 100,000)
1 (19.2)
2 (38.3)
0 (0.0)
1 (18.6)
2 (36.9)
0 (0.0)
2 (35.4)
0 (0.0)
0 (0.0)
3 (49.2)
1 (16.1)
1 (15.7)
Robberies (per 100,000)
5 (96.2)
6 (114.8)
12 (230.0)
7 (130.0)
9 (166.2)
7 (127.3)
8 (141.6)
18 (313.6)
8 (135.7)
5 (82.0)
5 (80.7)
5 (78.3)
Assaults (per 100,000)
13 (250.2)
18 (344.4)
8 (153.3)
9 (167.1)
8 (147.7)
16 (291.0)
6 (106.2)
4 (69.7)
3 (50.9)
7 (114.8)
11 (177.5)
3 (47.0)
Burglaries (per 100,000)
38 (731.5)
34 (650.5)
26 (498.3)
40 (742.7)
27 (498.5)
40 (727.4)
18 (318.6)
15 (261.4)
18 (305.4)
26 (426.4)
11 (177.5)
31 (485.3)
Thefts (per 100,000)
142 (2,733)
145 (2,774)
158 (3,028)
126 (2,339)
139 (2,566)
135 (2,455)
127 (2,248)
80 (1,394)
194 (3,291)
219 (3,592)
154 (2,485)
185 (2,896)
Auto thefts (per 100,000)
9 (173.2)
8 (153.1)
8 (153.3)
35 (649.8)
14 (258.5)
19 (345.5)
11 (194.7)
9 (156.8)
11 (186.6)
15 (246.0)
24 (387.3)
16 (250.5)
Arson (per 100,000)
0 (0.0)
3 (57.4)
3 (57.5)
0 (0.0)
0 (0.0)
0 (0.0)
0 (0.0)
0 (0.0)
0 (0.0)
0 (0.0)
3 (48.4)
0 (0.0)
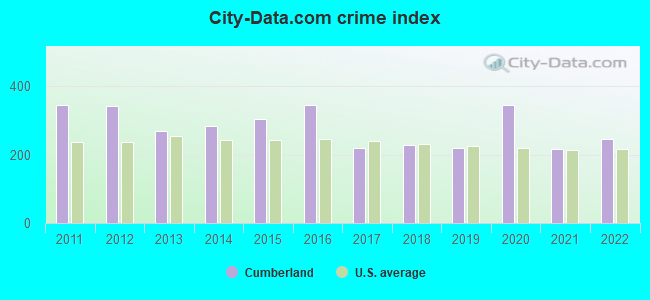
City-Data.com crime index
345.7
340.9
267.9
284.8
304.1
345.9
219.9
229.5
218.9
345.7
215.4
246.6
The City-Data.com crime index weighs serious crimes and violent crimes more heavily. Higher means more crime, U.S. average is 246.1. It adjusts for the number of visitors and daily workers commuting into cities.
Latest news from Cumberland, IN collected exclusively by city-data.com from local newspapers, TV, and radio stations
Ancestries: German (33.9%), Irish (10.7%), American (7.5%), English (4.8%), Polish (3.5%), Italian (2.5%).
Current Local Time: EST time zone
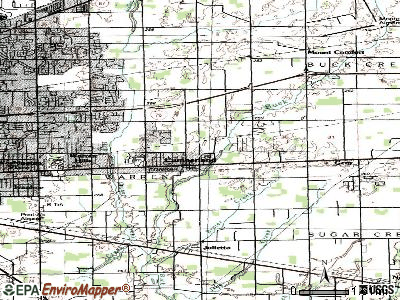
Elevation: 856 feet
Land area: 1.89 square miles.
Population density: 3,319 people per square mile (average).
83 residents are foreign born
This town:
1.4%
Indiana:
5.6%
Median real estate property taxes paid for housing units with mortgages in 2022: $2,048 (1.0%) Median real estate property taxes paid for housing units with no mortgage in 2022: $2,117 (0.9%)
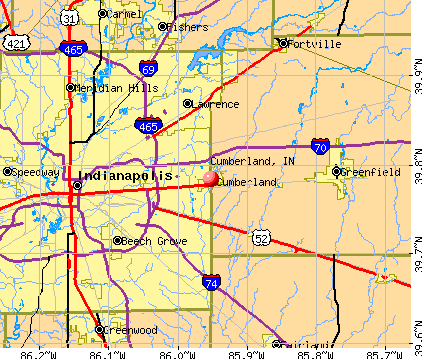
Nearest city with pop. 50,000+: Indianapolis, IN (10.4 miles , pop. 781,870).
Nearest city with pop. 1,000,000+: Chicago, IL (168.6 miles , pop. 2,896,016).
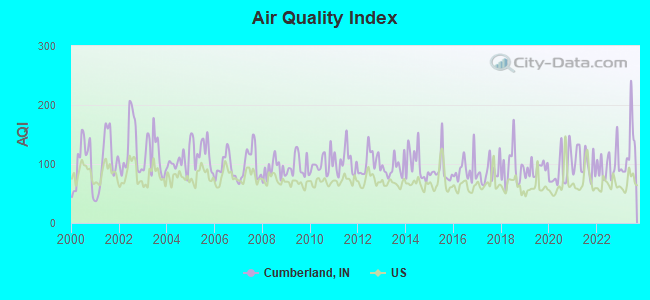
Air Quality Index (AQI) level in 2023 was 125. This is significantly worse than average.
City:
125
U.S.:
73
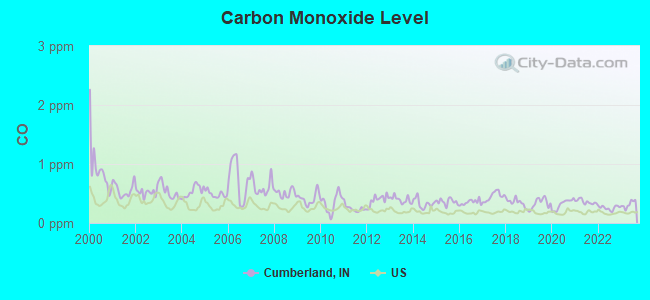
Carbon Monoxide (CO) [ppm] level in 2023 was 0.316. This is worse than average.Closest monitor was 5.8 miles away from the city center.
City:
0.316
U.S.:
0.251
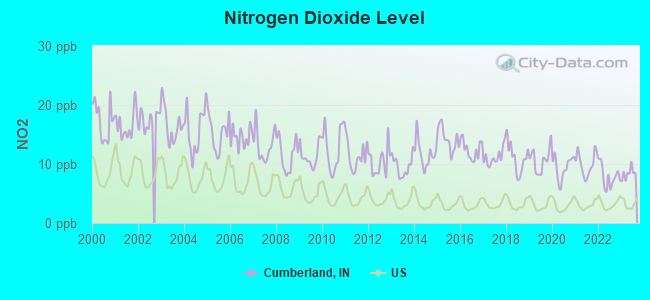
Nitrogen Dioxide (NO2) [ppb] level in 2023 was 8.39. This is significantly worse than average.Closest monitor was 5.8 miles away from the city center.
City:
8.39
U.S.:
5.11
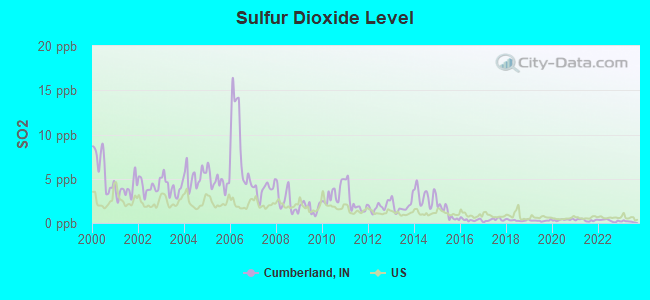
Sulfur Dioxide (SO2) [ppb] level in 2023 was 0.165. This is significantly better than average.Closest monitor was 5.8 miles away from the city center.
City:
0.165
U.S.:
1.515
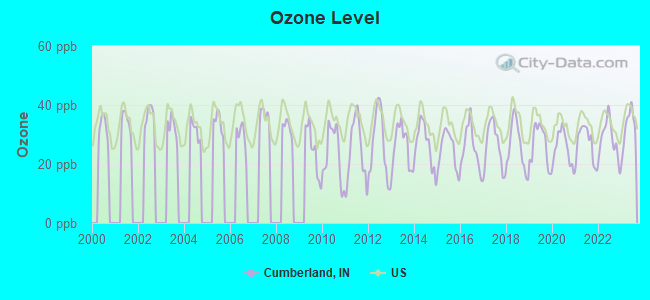
Ozone [ppb] level in 2023 was 32.5. This is about average.Closest monitor was 5.8 miles away from the city center.
City:
32.5
U.S.:
33.3
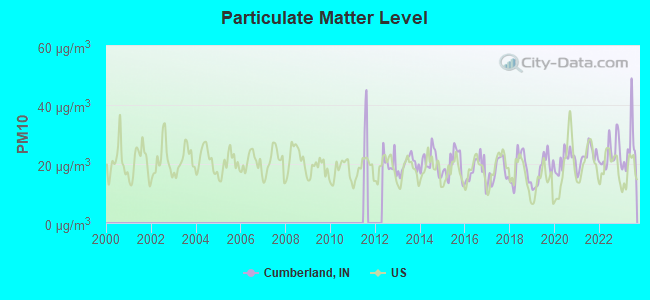
Particulate Matter (PM10) [µg/m3] level in 2023 was 25.4. This is worse than average.Closest monitor was 5.8 miles away from the city center.
City:
25.4
U.S.:
19.2
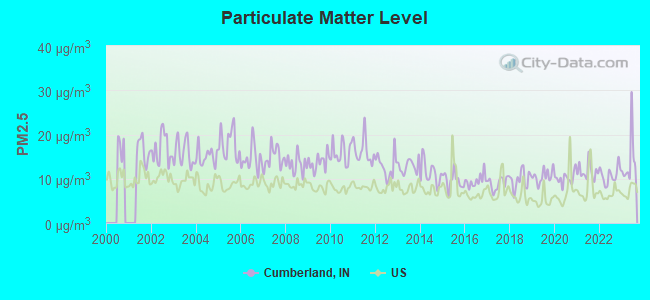
Particulate Matter (PM2.5) [µg/m3] level in 2023 was 14.0. This is significantly worse than average.Closest monitor was 8.5 miles away from the city center.
City:
14.0
U.S.:
8.1
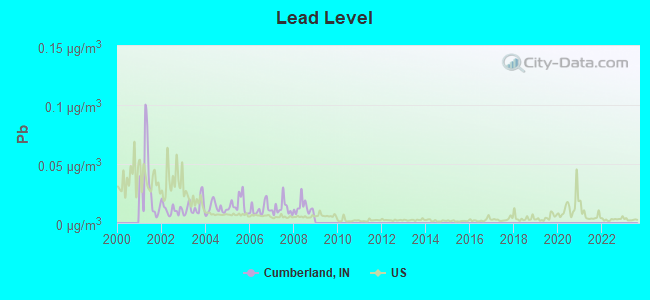
Lead (Pb) [µg/m3] level in 2008 was 0.0129. This is worse than average.Closest monitor was 5.8 miles away from the city center.
City:
0.0129
U.S.:
0.0093
Tornado activity:
Cumberland-area historical tornado activity is slightly above Indiana state average. It is 130% greater than the overall U.S. average.
On 6/11/1998, a category F4 (max. wind speeds 207-260 mph) tornado 0.3 miles away from the Cumberland town center injured 4 peopleand caused $2 million in damages.
On 5/14/1972, a category F4 tornado 6.9 miles away from the town center injured 20 peopleand causedbetween $50,000 and $500,000 in damages.
Earthquake activity:
Cumberland-area historical earthquake activity is significantly above Indiana state average. It is 74% greater than the overall U.S. average.
On 4/18/2008 at 09:36:59, a magnitude 5.4 (5.1 MB, 4.8 MS, 5.4 MW, 5.2 MW, Class: Moderate, Intensity: VI - VII) earthquake occurred 138.7 miles away from Cumberland center On 4/18/2008 at 09:36:59, a magnitude 5.2 (5.2 MW, Depth: 8.9 mi) earthquake occurred 138.8 miles away from the city center On 6/10/1987 at 23:48:54, a magnitude 5.1 (4.9 MB, 4.4 MS, 4.6 MS, 5.1 LG) earthquake occurred 123.0 miles away from the city center On 7/27/1980 at 18:52:21, a magnitude 5.2 (5.1 MB, 4.7 MS, 5.0 UK, 5.2 UK) earthquake occurred 153.6 miles away from Cumberland center On 6/18/2002 at 17:37:15, a magnitude 5.0 (4.3 MB, 4.6 MW, 5.0 LG) earthquake occurred 158.5 miles away from the city center On 4/18/2008 at 15:14:16, a magnitude 4.8 (4.5 MB, 4.8 MW, 4.6 MW, Class: Light, Intensity: IV - V) earthquake occurred 136.1 miles away from Cumberland center Magnitude types: regional Lg-wave magnitude (LG), body-wave magnitude (MB), surface-wave magnitude (MS), moment magnitude (MW)
Natural disasters:
The number of natural disasters in Marion County (16) is near the US average (15). Major Disasters (Presidential) Declared: 11 Emergencies Declared: 4
Causes of natural disasters: Floods: 8, Storms: 8, Tornadoes: 6, Winter Storms: 3, Snows: 2, Blizzard: 1, Hurricane: 1, Snowstorm: 1, Other: 1 (Note: some incidents may be assigned to more than one category).
Hospitals and medical centers in Cumberland:
DEVELOPMENTAL SERVICE ALTERNAT (12110 BECKLEY DR)
DEVELOPMENTAL SERVICE ALTERNAT (902 N MUESSING RD)
AMERICAN HOME HEALTH AND HOSPICE CARE INC (79 S CR 700 W)
Amtrak station near Cumberland:
12 miles: INDIANAPOLIS (350 S. ILLINOIS ST.) . Services: ticket office, partially wheelchair accessible, public payphones, full-service food facilities, free short-term parking, paid long-term parking, call for car rental service, taxi stand, intercity bus service.
Cemeteries: Fish Cemetery (1), Cumberland Cemetery (2), German Church Road Cemetery (3), Saint John's Evangeline Cemetery (4). Display/hide their locations on the map
Marion County has a predicted average indoor radon screening level greater than 4 pCi/L (pico curies per liter) - Highest Potential
Average household size:
This town:
2.6 people
Indiana:
2.5 people
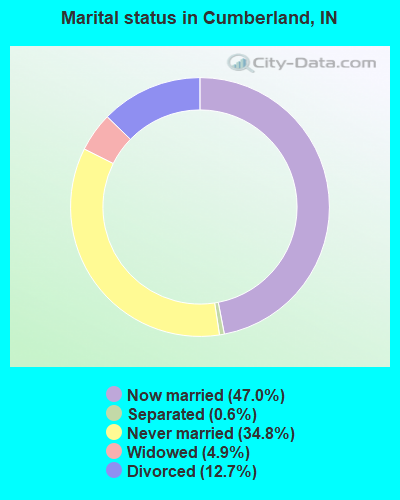
Percentage of family households:
This town:
72.1%
Whole state:
66.9%
Percentage of households with unmarried partners:
This town:
7.8%
Whole state:
6.9%
Likely homosexual households (counted as self-reported same-sex unmarried-partner households)
Lesbian couples: 0.7% of all households
Gay men: 0.1% of all households
13 people in group homes intended for adults in 2010
14 people in homes for the mentally retarded in 2000
Banks with branches in Cumberland (2011 data):
Greenfield Banking Company: Cumberland Branch at 12140 East Washington Street, branch established on 1974/02/25. Info updated 2006/11/03: Bank assets: $397.1 mil, Deposits: $349.8 mil, headquarters in Greenfield, IN, positive income, 7 total offices, Holding Company: Greenfield Bancshares, Inc.
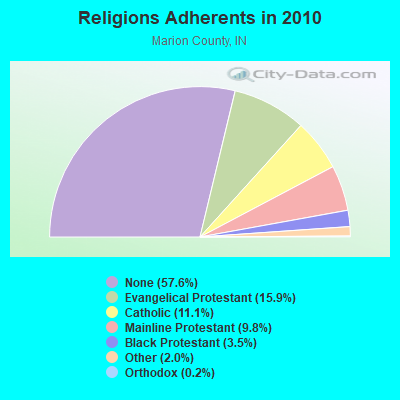
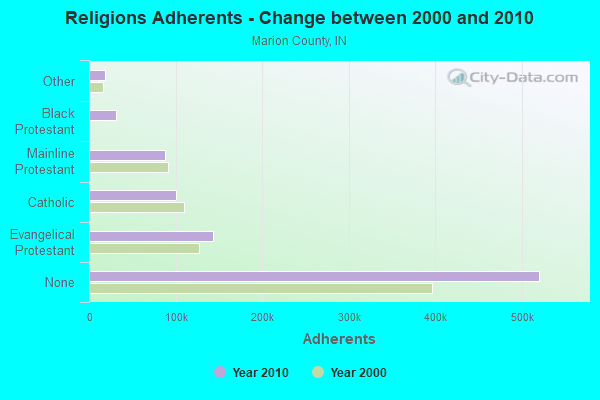
Religion statistics for Cumberland, IN (based on Marion County data)
Religion
Adherents
Congregations
Evangelical Protestant
143,339
488
Catholic
99,990
40
Mainline Protestant
88,116
182
Black Protestant
31,445
93
Other
18,087
62
Orthodox
2,199
11
None
520,217
-
Source: Clifford Grammich, Kirk Hadaway, Richard Houseal, Dale E.Jones, Alexei Krindatch, Richie Stanley and Richard H.Taylor. 2012. 2010 U.S.Religion Census: Religious Congregations & Membership Study. Association of Statisticians of American Religious Bodies. Jones, Dale E., et al. 2002. Congregations and Membership in the United States 2000. Nashville, TN: Glenmary Research Center. Graphs represent county-level data
11501 E. Washington Street (Lat: 39.776222 Lon: -85.960889), Type: Bant, Structure height: 13 m, Overall height: 15 m, Call Sign: KNCJ397, Assigned Frequencies: 154.100 MHz, Grant Date: 01/19/2022, Expiration Date: 02/01/2032, Registrant: Town Of Cumberland, 11501 E Washington St,, Indianapolis, IN 46229, Phone: (317) 403-2694, Email:
FCC Registered Microwave Towers:
1
CUMBERLAND, 525' W Of County Line Rd, South Side Of Cumberland Utility Dr (Lat: 39.771972 Lon: -85.954417), Overall height: 50 m, Call Sign: WLL683, Licensee ID: L00005929, Assigned Frequencies: 2165.20 MHz, Grant Date: 04/01/1991, Expiration Date: 02/01/2001, Cancellation Date: 03/05/1999, Registrant: Gte Mobilnet Of Indiana LP, One Gte Pl, Alpharetta, GA 30004-8511
FCC Registered Amateur Radio Licenses:
5
Call Sign: KB9MJU, Grant Date: 01/12/1996, Expiration Date: 01/12/2006, Cancellation Date: 01/15/2008, Registrant: Tony R Browning, 7165 W Us 40, Cumberland, IN 46229
Call Sign: KB9RAG, Grant Date: 06/25/1997, Expiration Date: 06/25/2007, Cancellation Date: 06/26/2009, Registrant: Chad C Browning, 7165 W Us 40, Cumberland, IN 46229
Call Sign: N9WVU, Licensee ID: L00999073, Grant Date: 02/17/2015, Expiration Date: 04/02/2025, Certifier: Edward H Moorman, Registrant: Edward H Moorman, 1546 Mutz Dr, Cumberland, IN 46229
Call Sign: KD9ILF, Licensee ID: L02091939, Grant Date: 04/19/2017, Expiration Date: 04/19/2027, Cancellation Date: 03/02/2018, Certifier: Jeffrey E Ferrell, Registrant: Jeffrey E Ferrell, 1209 Hopkins Road, Cumberland, IN 46229
Call Sign: K9HCA, Previous Call Sign: KD9ILF, Licensee ID: L02091939, Grant Date: 03/02/2018, Expiration Date: 03/02/2028, Certifier: Jeffrey E Ferrell, Registrant: Jeffrey E Ferrell, 1209 Hopkins Road, Cumberland, IN 46229
Home Mortgage Disclosure Act Aggregated Statistics For Year 2009 (Based on 2 partial tracts)
A) FHA, FSA/RHS & VA Home Purchase Loans
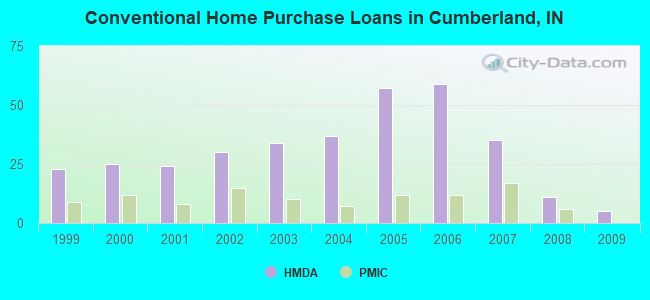
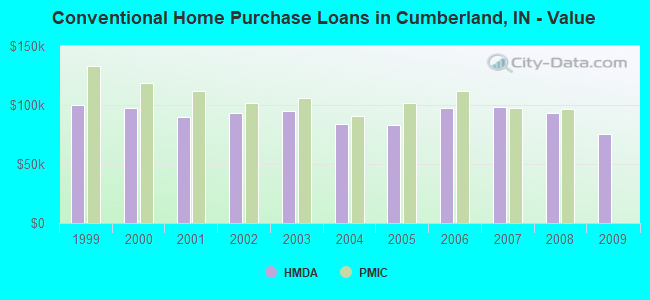
B) Conventional Home Purchase Loans
C) Refinancings
D) Home Improvement Loans
F) Non-occupant Loans on < 5 Family Dwellings (A B C & D)
Number
Average Value
Number
Average Value
Number
Average Value
Number
Average Value
Number
Average Value
LOANS ORIGINATED
22
$96,413
5
$75,154
39
$100,623
1
$47,400
5
$52,102
APPLICATIONS APPROVED, NOT ACCEPTED
1
$70,080
0
$0
5
$94,554
0
$0
1
$69,050
APPLICATIONS DENIED
5
$93,490
2
$62,550
27
$109,275
3
$15,447
1
$66,950
APPLICATIONS WITHDRAWN
3
$103,520
0
$0
16
$107,654
0
$0
1
$83,730
FILES CLOSED FOR INCOMPLETENESS
1
$87,250
0
$0
5
$118,672
0
$0
1
$61,610
Aggregated Statistics For Year 2008 (Based on 2 partial tracts)
A) FHA, FSA/RHS & VA Home Purchase Loans
B) Conventional Home Purchase Loans
C) Refinancings
D) Home Improvement Loans
E) Loans on Dwellings For 5+ Families
F) Non-occupant Loans on < 5 Family Dwellings (A B C & D)
Number
Average Value
Number
Average Value
Number
Average Value
Number
Average Value
Number
Average Value
Number
Average Value
LOANS ORIGINATED
25
$101,681
11
$93,156
23
$102,774
2
$6,375
1
$570,630
3
$81,557
APPLICATIONS APPROVED, NOT ACCEPTED
2
$85,940
0
$0
5
$106,888
1
$66,310
0
$0
2
$90,145
APPLICATIONS DENIED
3
$99,110
3
$56,660
46
$109,714
14
$45,556
0
$0
6
$65,955
APPLICATIONS WITHDRAWN
1
$130,720
2
$54,320
13
$112,423
0
$0
0
$0
1
$95,520
FILES CLOSED FOR INCOMPLETENESS
0
$0
0
$0
4
$116,278
0
$0
0
$0
0
$0
Aggregated Statistics For Year 2007 (Based on 2 partial tracts)
A) FHA, FSA/RHS & VA Home Purchase Loans
B) Conventional Home Purchase Loans
C) Refinancings
D) Home Improvement Loans
E) Loans on Dwellings For 5+ Families
F) Non-occupant Loans on < 5 Family Dwellings (A B C & D)
G) Loans On Manufactured Home Dwelling (A B C & D)
Number
Average Value
Number
Average Value
Number
Average Value
Number
Average Value
Number
Average Value
Number
Average Value
Number
Average Value
LOANS ORIGINATED
10
$113,568
35
$98,429
31
$98,855
3
$35,093
1
$2,511,190
8
$93,969
0
$0
APPLICATIONS APPROVED, NOT ACCEPTED
0
$0
5
$79,554
10
$94,379
3
$32,260
0
$0
1
$48,270
0
$0
APPLICATIONS DENIED
4
$113,740
18
$97,267
47
$109,999
22
$31,904
0
$0
7
$84,851
2
$49,000
APPLICATIONS WITHDRAWN
1
$102,320
3
$108,753
21
$116,660
1
$55,980
0
$0
1
$140,590
0
$0
FILES CLOSED FOR INCOMPLETENESS
0
$0
1
$116,800
5
$95,454
0
$0
0
$0
0
$0
0
$0
Aggregated Statistics For Year 2006 (Based on 2 partial tracts)
A) FHA, FSA/RHS & VA Home Purchase Loans
B) Conventional Home Purchase Loans
C) Refinancings
D) Home Improvement Loans
F) Non-occupant Loans on < 5 Family Dwellings (A B C & D)
G) Loans On Manufactured Home Dwelling (A B C & D)
Number
Average Value
Number
Average Value
Number
Average Value
Number
Average Value
Number
Average Value
Number
Average Value
LOANS ORIGINATED
18
$117,911
59
$97,481
37
$91,967
9
$42,024
16
$103,608
0
$0
APPLICATIONS APPROVED, NOT ACCEPTED
5
$105,552
9
$97,740
14
$96,063
2
$9,995
2
$103,490
1
$32,670
APPLICATIONS DENIED
5
$129,986
21
$102,633
59
$112,759
15
$51,549
7
$89,639
1
$10,750
APPLICATIONS WITHDRAWN
7
$134,131
15
$77,891
34
$105,441
1
$120,470
2
$81,350
0
$0
FILES CLOSED FOR INCOMPLETENESS
0
$0
3
$131,820
11
$128,464
0
$0
1
$81,310
0
$0
Aggregated Statistics For Year 2005 (Based on 2 partial tracts)
A) FHA, FSA/RHS & VA Home Purchase Loans
B) Conventional Home Purchase Loans
C) Refinancings
D) Home Improvement Loans
F) Non-occupant Loans on < 5 Family Dwellings (A B C & D)
Number
Average Value
Number
Average Value
Number
Average Value
Number
Average Value
Number
Average Value
LOANS ORIGINATED
16
$119,363
57
$82,943
69
$90,423
4
$25,898
17
$73,394
APPLICATIONS APPROVED, NOT ACCEPTED
1
$163,850
5
$87,216
8
$96,370
3
$12,300
0
$0
APPLICATIONS DENIED
2
$121,670
24
$90,680
62
$110,658
15
$27,544
8
$68,658
APPLICATIONS WITHDRAWN
2
$106,260
14
$91,456
26
$107,265
3
$101,197
5
$70,744
FILES CLOSED FOR INCOMPLETENESS
1
$81,870
5
$105,428
18
$109,468
0
$0
1
$114,130
Aggregated Statistics For Year 2004 (Based on 2 partial tracts)
A) FHA, FSA/RHS & VA Home Purchase Loans
B) Conventional Home Purchase Loans
C) Refinancings
D) Home Improvement Loans
F) Non-occupant Loans on < 5 Family Dwellings (A B C & D)
G) Loans On Manufactured Home Dwelling (A B C & D)
Number
Average Value
Number
Average Value
Number
Average Value
Number
Average Value
Number
Average Value
Number
Average Value
LOANS ORIGINATED
20
$116,688
37
$83,848
76
$93,710
5
$38,944
9
$83,813
0
$0
APPLICATIONS APPROVED, NOT ACCEPTED
0
$0
7
$87,944
18
$84,759
1
$21,280
2
$98,825
1
$76,500
APPLICATIONS DENIED
3
$92,150
12
$101,090
59
$102,719
14
$26,792
3
$59,300
1
$22,390
APPLICATIONS WITHDRAWN
2
$107,530
6
$125,860
25
$102,832
1
$66,490
1
$59,600
0
$0
FILES CLOSED FOR INCOMPLETENESS
0
$0
1
$54,060
13
$108,034
2
$43,495
1
$146,380
0
$0
Aggregated Statistics For Year 2003 (Based on 2 partial tracts)
A) FHA, FSA/RHS & VA Home Purchase Loans
B) Conventional Home Purchase Loans
C) Refinancings
D) Home Improvement Loans
F) Non-occupant Loans on < 5 Family Dwellings (A B C & D)
Number
Average Value
Number
Average Value
Number
Average Value
Number
Average Value
Number
Average Value
LOANS ORIGINATED
31
$114,311
34
$94,602
148
$92,875
6
$26,167
13
$65,930
APPLICATIONS APPROVED, NOT ACCEPTED
2
$108,300
5
$79,338
24
$96,028
0
$0
2
$65,360
APPLICATIONS DENIED
5
$116,424
7
$94,746
72
$94,827
8
$20,049
4
$80,458
APPLICATIONS WITHDRAWN
3
$112,357
7
$97,739
30
$110,889
1
$25,860
1
$80,510
FILES CLOSED FOR INCOMPLETENESS
1
$147,210
1
$117,100
10
$112,511
0
$0
0
$0
Aggregated Statistics For Year 2002 (Based on 1 partial tract)
A) FHA, FSA/RHS & VA Home Purchase Loans
B) Conventional Home Purchase Loans
C) Refinancings
D) Home Improvement Loans
E) Loans on Dwellings For 5+ Families
F) Non-occupant Loans on < 5 Family Dwellings (A B C & D)
Number
Average Value
Number
Average Value
Number
Average Value
Number
Average Value
Number
Average Value
Number
Average Value
LOANS ORIGINATED
45
$117,664
30
$93,520
95
$93,830
10
$16,044
1
$578,900
5
$77,986
APPLICATIONS APPROVED, NOT ACCEPTED
1
$129,430
2
$118,880
20
$99,881
4
$11,992
0
$0
0
$0
APPLICATIONS DENIED
6
$116,813
3
$93,177
48
$92,236
10
$17,863
0
$0
2
$67,815
APPLICATIONS WITHDRAWN
3
$112,060
3
$85,870
15
$108,144
2
$14,885
0
$0
0
$0
FILES CLOSED FOR INCOMPLETENESS
1
$102,960
2
$91,795
10
$104,202
0
$0
0
$0
1
$58,720
Aggregated Statistics For Year 2001 (Based on 1 partial tract)
A) FHA, FSA/RHS & VA Home Purchase Loans
B) Conventional Home Purchase Loans
C) Refinancings
D) Home Improvement Loans
F) Non-occupant Loans on < 5 Family Dwellings (A B C & D)
Number
Average Value
Number
Average Value
Number
Average Value
Number
Average Value
Number
Average Value
LOANS ORIGINATED
37
$112,807
24
$89,919
81
$91,368
8
$14,421
2
$95,520
APPLICATIONS APPROVED, NOT ACCEPTED
0
$0
2
$131,285
17
$70,441
4
$13,645
0
$0
APPLICATIONS DENIED
6
$122,465
7
$95,873
50
$78,788
14
$17,426
0
$0
APPLICATIONS WITHDRAWN
1
$135,210
3
$104,753
17
$93,865
0
$0
0
$0
FILES CLOSED FOR INCOMPLETENESS
0
$0
2
$43,830
7
$96,404
0
$0
0
$0
Aggregated Statistics For Year 2000 (Based on 1 partial tract)
A) FHA, FSA/RHS & VA Home Purchase Loans
B) Conventional Home Purchase Loans
C) Refinancings
D) Home Improvement Loans
F) Non-occupant Loans on < 5 Family Dwellings (A B C & D)
Number
Average Value
Number
Average Value
Number
Average Value
Number
Average Value
Number
Average Value
LOANS ORIGINATED
38
$108,968
25
$97,189
23
$67,221
7
$12,406
4
$62,128
APPLICATIONS APPROVED, NOT ACCEPTED
1
$107,100
6
$101,928
10
$59,255
9
$16,357
0
$0
APPLICATIONS DENIED
2
$141,005
10
$113,547
41
$60,532
15
$15,603
0
$0
APPLICATIONS WITHDRAWN
2
$124,875
6
$88,765
14
$71,359
1
$68,230
0
$0
FILES CLOSED FOR INCOMPLETENESS
0
$0
1
$140,590
5
$78,648
0
$0
0
$0
Aggregated Statistics For Year 1999 (Based on 2 partial tracts)
A) FHA, FSA/RHS & VA Home Purchase Loans
B) Conventional Home Purchase Loans
C) Refinancings
D) Home Improvement Loans
F) Non-occupant Loans on < 5 Family Dwellings (A B C & D)


 Recent articles from our blog. Our writers, many of them Ph.D. graduates or candidates, create easy-to-read articles on a wide variety of topics.

 (10.4 miles