Dade City, Florida Submit your own pictures of this city and show them to the world
OSM Map
General Map
Google Map
MSN Map
OSM Map
General Map
Google Map
MSN Map
OSM Map
General Map
Google Map
MSN Map
OSM Map
General Map
Google Map
MSN Map
Please wait while loading the map...
Population in 2022: 7,670 (98% urban, 2% rural). Population change since 2000: +23.9%Males: 3,540 Females: 4,130
March 2022 cost of living index in Dade City: 96.5 (near average, U.S. average is 100) Percentage of residents living in poverty in 2022: 12.8%for White Non-Hispanic residents , 23.3% for Black residents , 19.9% for Hispanic or Latino residents , 30.9% for other race residents , 5.0% for two or more races residents )
Profiles of local businesses
Business Search - 14 Million verified businesses
Data:
Median household income ($)
Median household income (% change since 2000)
Household income diversity
Ratio of average income to average house value (%)
Ratio of average income to average rent
Median household income ($) - White
Median household income ($) - Black or African American
Median household income ($) - Asian
Median household income ($) - Hispanic or Latino
Median household income ($) - American Indian and Alaska Native
Median household income ($) - Multirace
Median household income ($) - Other Race
Median household income for houses/condos with a mortgage ($)
Median household income for apartments without a mortgage ($)
Races - White alone (%)
Races - White alone (% change since 2000)
Races - Black alone (%)
Races - Black alone (% change since 2000)
Races - American Indian alone (%)
Races - American Indian alone (% change since 2000)
Races - Asian alone (%)
Races - Asian alone (% change since 2000)
Races - Hispanic (%)
Races - Hispanic (% change since 2000)
Races - Native Hawaiian and Other Pacific Islander alone (%)
Races - Native Hawaiian and Other Pacific Islander alone (% change since 2000)
Races - Two or more races (%)
Races - Two or more races (% change since 2000)
Races - Other race alone (%)
Races - Other race alone (% change since 2000)
Racial diversity
Unemployment (%)
Unemployment (% change since 2000)
Unemployment (%) - White
Unemployment (%) - Black or African American
Unemployment (%) - Asian
Unemployment (%) - Hispanic or Latino
Unemployment (%) - American Indian and Alaska Native
Unemployment (%) - Multirace
Unemployment (%) - Other Race
Population density (people per square mile)
Population - Males (%)
Population - Females (%)
Population - Males (%) - White
Population - Males (%) - Black or African American
Population - Males (%) - Asian
Population - Males (%) - Hispanic or Latino
Population - Males (%) - American Indian and Alaska Native
Population - Males (%) - Multirace
Population - Males (%) - Other Race
Population - Females (%) - White
Population - Females (%) - Black or African American
Population - Females (%) - Asian
Population - Females (%) - Hispanic or Latino
Population - Females (%) - American Indian and Alaska Native
Population - Females (%) - Multirace
Population - Females (%) - Other Race
Coronavirus confirmed cases (Jun 16, 2024)
Deaths caused by coronavirus (Jun 16, 2024)
Coronavirus confirmed cases (per 100k population) (Jun 16, 2024)
Deaths caused by coronavirus (per 100k population) (Jun 16, 2024)
Daily increase in number of cases (Jun 16, 2024)
Weekly increase in number of cases (Jun 16, 2024)
Cases doubled (in days) (Jun 16, 2024)
Hospitalized patients (Apr 18, 2022)
Negative test results (Apr 18, 2022)
Total test results (Apr 18, 2022)
COVID Vaccine doses distributed (per 100k population) (Sep 19, 2023)
COVID Vaccine doses administered (per 100k population) (Sep 19, 2023)
COVID Vaccine doses distributed (Sep 19, 2023)
COVID Vaccine doses administered (Sep 19, 2023)
Likely homosexual households (%)
Likely homosexual households (% change since 2000)
Likely homosexual households - Lesbian couples (%)
Likely homosexual households - Lesbian couples (% change since 2000)
Likely homosexual households - Gay men (%)
Likely homosexual households - Gay men (% change since 2000)
Cost of living index
Median gross rent ($)
Median contract rent ($)
Median monthly housing costs ($)
Median house or condo value ($)
Median house or condo value ($ change since 2000)
Mean house or condo value by units in structure - 1, detached ($)
Mean house or condo value by units in structure - 1, attached ($)
Mean house or condo value by units in structure - 2 ($)
Mean house or condo value by units in structure by units in structure - 3 or 4 ($)
Mean house or condo value by units in structure - 5 or more ($)
Mean house or condo value by units in structure - Boat, RV, van, etc. ($)
Mean house or condo value by units in structure - Mobile home ($)
Median house or condo value ($) - White
Median house or condo value ($) - Black or African American
Median house or condo value ($) - Asian
Median house or condo value ($) - Hispanic or Latino
Median house or condo value ($) - American Indian and Alaska Native
Median house or condo value ($) - Multirace
Median house or condo value ($) - Other Race
Median resident age
Resident age diversity
Median resident age - Males
Median resident age - Females
Median resident age - White
Median resident age - Black or African American
Median resident age - Asian
Median resident age - Hispanic or Latino
Median resident age - American Indian and Alaska Native
Median resident age - Multirace
Median resident age - Other Race
Median resident age - Males - White
Median resident age - Males - Black or African American
Median resident age - Males - Asian
Median resident age - Males - Hispanic or Latino
Median resident age - Males - American Indian and Alaska Native
Median resident age - Males - Multirace
Median resident age - Males - Other Race
Median resident age - Females - White
Median resident age - Females - Black or African American
Median resident age - Females - Asian
Median resident age - Females - Hispanic or Latino
Median resident age - Females - American Indian and Alaska Native
Median resident age - Females - Multirace
Median resident age - Females - Other Race
Commute - mean travel time to work (minutes)
Travel time to work - Less than 5 minutes (%)
Travel time to work - Less than 5 minutes (% change since 2000)
Travel time to work - 5 to 9 minutes (%)
Travel time to work - 5 to 9 minutes (% change since 2000)
Travel time to work - 10 to 19 minutes (%)
Travel time to work - 10 to 19 minutes (% change since 2000)
Travel time to work - 20 to 29 minutes (%)
Travel time to work - 20 to 29 minutes (% change since 2000)
Travel time to work - 30 to 39 minutes (%)
Travel time to work - 30 to 39 minutes (% change since 2000)
Travel time to work - 40 to 59 minutes (%)
Travel time to work - 40 to 59 minutes (% change since 2000)
Travel time to work - 60 to 89 minutes (%)
Travel time to work - 60 to 89 minutes (% change since 2000)
Travel time to work - 90 or more minutes (%)
Travel time to work - 90 or more minutes (% change since 2000)
Marital status - Never married (%)
Marital status - Now married (%)
Marital status - Separated (%)
Marital status - Widowed (%)
Marital status - Divorced (%)
Median family income ($)
Median family income (% change since 2000)
Median non-family income ($)
Median non-family income (% change since 2000)
Median per capita income ($)
Median per capita income (% change since 2000)
Median family income ($) - White
Median family income ($) - Black or African American
Median family income ($) - Asian
Median family income ($) - Hispanic or Latino
Median family income ($) - American Indian and Alaska Native
Median family income ($) - Multirace
Median family income ($) - Other Race
Median year house/condo built
Median year apartment built
Year house built - Built 2005 or later (%)
Year house built - Built 2000 to 2004 (%)
Year house built - Built 1990 to 1999 (%)
Year house built - Built 1980 to 1989 (%)
Year house built - Built 1970 to 1979 (%)
Year house built - Built 1960 to 1969 (%)
Year house built - Built 1950 to 1959 (%)
Year house built - Built 1940 to 1949 (%)
Year house built - Built 1939 or earlier (%)
Average household size
Household density (households per square mile)
Average household size - White
Average household size - Black or African American
Average household size - Asian
Average household size - Hispanic or Latino
Average household size - American Indian and Alaska Native
Average household size - Multirace
Average household size - Other Race
Occupied housing units (%)
Vacant housing units (%)
Owner occupied housing units (%)
Renter occupied housing units (%)
Vacancy status - For rent (%)
Vacancy status - For sale only (%)
Vacancy status - Rented or sold, not occupied (%)
Vacancy status - For seasonal, recreational, or occasional use (%)
Vacancy status - For migrant workers (%)
Vacancy status - Other vacant (%)
Residents with income below the poverty level (%)
Residents with income below 50% of the poverty level (%)
Children below poverty level (%)
Poor families by family type - Married-couple family (%)
Poor families by family type - Male, no wife present (%)
Poor families by family type - Female, no husband present (%)
Poverty status for native-born residents (%)
Poverty status for foreign-born residents (%)
Poverty among high school graduates not in families (%)
Poverty among people who did not graduate high school not in families (%)
Residents with income below the poverty level (%) - White
Residents with income below the poverty level (%) - Black or African American
Residents with income below the poverty level (%) - Asian
Residents with income below the poverty level (%) - Hispanic or Latino
Residents with income below the poverty level (%) - American Indian and Alaska Native
Residents with income below the poverty level (%) - Multirace
Residents with income below the poverty level (%) - Other Race
Air pollution - Air Quality Index (AQI)
Air pollution - CO
Air pollution - NO2
Air pollution - SO2
Air pollution - Ozone
Air pollution - PM10
Air pollution - PM25
Air pollution - Pb
Crime - Murders per 100,000 population
Crime - Rapes per 100,000 population
Crime - Robberies per 100,000 population
Crime - Assaults per 100,000 population
Crime - Burglaries per 100,000 population
Crime - Thefts per 100,000 population
Crime - Auto thefts per 100,000 population
Crime - Arson per 100,000 population
Crime - City-data.com crime index
Crime - Violent crime index
Crime - Property crime index
Crime - Murders per 100,000 population (5 year average)
Crime - Rapes per 100,000 population (5 year average)
Crime - Robberies per 100,000 population (5 year average)
Crime - Assaults per 100,000 population (5 year average)
Crime - Burglaries per 100,000 population (5 year average)
Crime - Thefts per 100,000 population (5 year average)
Crime - Auto thefts per 100,000 population (5 year average)
Crime - Arson per 100,000 population (5 year average)
Crime - City-data.com crime index (5 year average)
Crime - Violent crime index (5 year average)
Crime - Property crime index (5 year average)
1996 Presidential Elections Results (%) - Democratic Party (Clinton)
1996 Presidential Elections Results (%) - Republican Party (Dole)
1996 Presidential Elections Results (%) - Other
2000 Presidential Elections Results (%) - Democratic Party (Gore)
2000 Presidential Elections Results (%) - Republican Party (Bush)
2000 Presidential Elections Results (%) - Other
2004 Presidential Elections Results (%) - Democratic Party (Kerry)
2004 Presidential Elections Results (%) - Republican Party (Bush)
2004 Presidential Elections Results (%) - Other
2008 Presidential Elections Results (%) - Democratic Party (Obama)
2008 Presidential Elections Results (%) - Republican Party (McCain)
2008 Presidential Elections Results (%) - Other
2012 Presidential Elections Results (%) - Democratic Party (Obama)
2012 Presidential Elections Results (%) - Republican Party (Romney)
2012 Presidential Elections Results (%) - Other
2016 Presidential Elections Results (%) - Democratic Party (Clinton)
2016 Presidential Elections Results (%) - Republican Party (Trump)
2016 Presidential Elections Results (%) - Other
2020 Presidential Elections Results (%) - Democratic Party (Biden)
2020 Presidential Elections Results (%) - Republican Party (Trump)
2020 Presidential Elections Results (%) - Other
Ancestries Reported - Arab (%)
Ancestries Reported - Czech (%)
Ancestries Reported - Danish (%)
Ancestries Reported - Dutch (%)
Ancestries Reported - English (%)
Ancestries Reported - French (%)
Ancestries Reported - French Canadian (%)
Ancestries Reported - German (%)
Ancestries Reported - Greek (%)
Ancestries Reported - Hungarian (%)
Ancestries Reported - Irish (%)
Ancestries Reported - Italian (%)
Ancestries Reported - Lithuanian (%)
Ancestries Reported - Norwegian (%)
Ancestries Reported - Polish (%)
Ancestries Reported - Portuguese (%)
Ancestries Reported - Russian (%)
Ancestries Reported - Scotch-Irish (%)
Ancestries Reported - Scottish (%)
Ancestries Reported - Slovak (%)
Ancestries Reported - Subsaharan African (%)
Ancestries Reported - Swedish (%)
Ancestries Reported - Swiss (%)
Ancestries Reported - Ukrainian (%)
Ancestries Reported - United States (%)
Ancestries Reported - Welsh (%)
Ancestries Reported - West Indian (%)
Ancestries Reported - Other (%)
Educational Attainment - No schooling completed (%)
Educational Attainment - Less than high school (%)
Educational Attainment - High school or equivalent (%)
Educational Attainment - Less than 1 year of college (%)
Educational Attainment - 1 or more years of college (%)
Educational Attainment - Associate degree (%)
Educational Attainment - Bachelor's degree (%)
Educational Attainment - Master's degree (%)
Educational Attainment - Professional school degree (%)
Educational Attainment - Doctorate degree (%)
School Enrollment - Nursery, preschool (%)
School Enrollment - Kindergarten (%)
School Enrollment - Grade 1 to 4 (%)
School Enrollment - Grade 5 to 8 (%)
School Enrollment - Grade 9 to 12 (%)
School Enrollment - College undergrad (%)
School Enrollment - Graduate or professional (%)
School Enrollment - Not enrolled in school (%)
School enrollment - Public schools (%)
School enrollment - Private schools (%)
School enrollment - Not enrolled (%)
Median number of rooms in houses and condos
Median number of rooms in apartments
Housing units lacking complete plumbing facilities (%)
Housing units lacking complete kitchen facilities (%)
Density of houses
Urban houses (%)
Rural houses (%)
Households with people 60 years and over (%)
Households with people 65 years and over (%)
Households with people 75 years and over (%)
Households with one or more nonrelatives (%)
Households with no nonrelatives (%)
Population in households (%)
Family households (%)
Nonfamily households (%)
Population in families (%)
Family households with own children (%)
Median number of bedrooms in owner occupied houses
Mean number of bedrooms in owner occupied houses
Median number of bedrooms in renter occupied houses
Mean number of bedrooms in renter occupied houses
Median number of vehichles in owner occupied houses
Mean number of vehichles in owner occupied houses
Median number of vehichles in renter occupied houses
Mean number of vehichles in renter occupied houses
Mortgage status - with mortgage (%)
Mortgage status - with second mortgage (%)
Mortgage status - with home equity loan (%)
Mortgage status - with both second mortgage and home equity loan (%)
Mortgage status - without a mortgage (%)
Average family size
Average family size - White
Average family size - Black or African American
Average family size - Asian
Average family size - Hispanic or Latino
Average family size - American Indian and Alaska Native
Average family size - Multirace
Average family size - Other Race
Geographical mobility - Same house 1 year ago (%)
Geographical mobility - Moved within same county (%)
Geographical mobility - Moved from different county within same state (%)
Geographical mobility - Moved from different state (%)
Geographical mobility - Moved from abroad (%)
Place of birth - Born in state of residence (%)
Place of birth - Born in other state (%)
Place of birth - Native, outside of US (%)
Place of birth - Foreign born (%)
Housing units in structures - 1, detached (%)
Housing units in structures - 1, attached (%)
Housing units in structures - 2 (%)
Housing units in structures - 3 or 4 (%)
Housing units in structures - 5 to 9 (%)
Housing units in structures - 10 to 19 (%)
Housing units in structures - 20 to 49 (%)
Housing units in structures - 50 or more (%)
Housing units in structures - Mobile home (%)
Housing units in structures - Boat, RV, van, etc. (%)
House/condo owner moved in on average (years ago)
Renter moved in on average (years ago)
Year householder moved into unit - Moved in 1999 to March 2000 (%)
Year householder moved into unit - Moved in 1995 to 1998 (%)
Year householder moved into unit - Moved in 1990 to 1994 (%)
Year householder moved into unit - Moved in 1980 to 1989 (%)
Year householder moved into unit - Moved in 1970 to 1979 (%)
Year householder moved into unit - Moved in 1969 or earlier (%)
Means of transportation to work - Drove car alone (%)
Means of transportation to work - Carpooled (%)
Means of transportation to work - Public transportation (%)
Means of transportation to work - Bus or trolley bus (%)
Means of transportation to work - Streetcar or trolley car (%)
Means of transportation to work - Subway or elevated (%)
Means of transportation to work - Railroad (%)
Means of transportation to work - Ferryboat (%)
Means of transportation to work - Taxicab (%)
Means of transportation to work - Motorcycle (%)
Means of transportation to work - Bicycle (%)
Means of transportation to work - Walked (%)
Means of transportation to work - Other means (%)
Working at home (%)
Industry diversity
Most Common Industries - Agriculture, forestry, fishing and hunting, and mining (%)
Most Common Industries - Agriculture, forestry, fishing and hunting (%)
Most Common Industries - Mining, quarrying, and oil and gas extraction (%)
Most Common Industries - Construction (%)
Most Common Industries - Manufacturing (%)
Most Common Industries - Wholesale trade (%)
Most Common Industries - Retail trade (%)
Most Common Industries - Transportation and warehousing, and utilities (%)
Most Common Industries - Transportation and warehousing (%)
Most Common Industries - Utilities (%)
Most Common Industries - Information (%)
Most Common Industries - Finance and insurance, and real estate and rental and leasing (%)
Most Common Industries - Finance and insurance (%)
Most Common Industries - Real estate and rental and leasing (%)
Most Common Industries - Professional, scientific, and management, and administrative and waste management services (%)
Most Common Industries - Professional, scientific, and technical services (%)
Most Common Industries - Management of companies and enterprises (%)
Most Common Industries - Administrative and support and waste management services (%)
Most Common Industries - Educational services, and health care and social assistance (%)
Most Common Industries - Educational services (%)
Most Common Industries - Health care and social assistance (%)
Most Common Industries - Arts, entertainment, and recreation, and accommodation and food services (%)
Most Common Industries - Arts, entertainment, and recreation (%)
Most Common Industries - Accommodation and food services (%)
Most Common Industries - Other services, except public administration (%)
Most Common Industries - Public administration (%)
Occupation diversity
Most Common Occupations - Management, business, science, and arts occupations (%)
Most Common Occupations - Management, business, and financial occupations (%)
Most Common Occupations - Management occupations (%)
Most Common Occupations - Business and financial operations occupations (%)
Most Common Occupations - Computer, engineering, and science occupations (%)
Most Common Occupations - Computer and mathematical occupations (%)
Most Common Occupations - Architecture and engineering occupations (%)
Most Common Occupations - Life, physical, and social science occupations (%)
Most Common Occupations - Education, legal, community service, arts, and media occupations (%)
Most Common Occupations - Community and social service occupations (%)
Most Common Occupations - Legal occupations (%)
Most Common Occupations - Education, training, and library occupations (%)
Most Common Occupations - Arts, design, entertainment, sports, and media occupations (%)
Most Common Occupations - Healthcare practitioners and technical occupations (%)
Most Common Occupations - Health diagnosing and treating practitioners and other technical occupations (%)
Most Common Occupations - Health technologists and technicians (%)
Most Common Occupations - Service occupations (%)
Most Common Occupations - Healthcare support occupations (%)
Most Common Occupations - Protective service occupations (%)
Most Common Occupations - Fire fighting and prevention, and other protective service workers including supervisors (%)
Most Common Occupations - Law enforcement workers including supervisors (%)
Most Common Occupations - Food preparation and serving related occupations (%)
Most Common Occupations - Building and grounds cleaning and maintenance occupations (%)
Most Common Occupations - Personal care and service occupations (%)
Most Common Occupations - Sales and office occupations (%)
Most Common Occupations - Sales and related occupations (%)
Most Common Occupations - Office and administrative support occupations (%)
Most Common Occupations - Natural resources, construction, and maintenance occupations (%)
Most Common Occupations - Farming, fishing, and forestry occupations (%)
Most Common Occupations - Construction and extraction occupations (%)
Most Common Occupations - Installation, maintenance, and repair occupations (%)
Most Common Occupations - Production, transportation, and material moving occupations (%)
Most Common Occupations - Production occupations (%)
Most Common Occupations - Transportation occupations (%)
Most Common Occupations - Material moving occupations (%)
People in Group quarters - Institutionalized population (%)
People in Group quarters - Correctional institutions (%)
People in Group quarters - Federal prisons and detention centers (%)
People in Group quarters - Halfway houses (%)
People in Group quarters - Local jails and other confinement facilities (including police lockups) (%)
People in Group quarters - Military disciplinary barracks (%)
People in Group quarters - State prisons (%)
People in Group quarters - Other types of correctional institutions (%)
People in Group quarters - Nursing homes (%)
People in Group quarters - Hospitals/wards, hospices, and schools for the handicapped (%)
People in Group quarters - Hospitals/wards and hospices for chronically ill (%)
People in Group quarters - Hospices or homes for chronically ill (%)
People in Group quarters - Military hospitals or wards for chronically ill (%)
People in Group quarters - Other hospitals or wards for chronically ill (%)
People in Group quarters - Hospitals or wards for drug/alcohol abuse (%)
People in Group quarters - Mental (Psychiatric) hospitals or wards (%)
People in Group quarters - Schools, hospitals, or wards for the mentally retarded (%)
People in Group quarters - Schools, hospitals, or wards for the physically handicapped (%)
People in Group quarters - Institutions for the deaf (%)
People in Group quarters - Institutions for the blind (%)
People in Group quarters - Orthopedic wards and institutions for the physically handicapped (%)
People in Group quarters - Wards in general hospitals for patients who have no usual home elsewhere (%)
People in Group quarters - Wards in military hospitals for patients who have no usual home elsewhere (%)
People in Group quarters - Juvenile institutions (%)
People in Group quarters - Long-term care (%)
People in Group quarters - Homes for abused, dependent, and neglected children (%)
People in Group quarters - Residential treatment centers for emotionally disturbed children (%)
People in Group quarters - Training schools for juvenile delinquents (%)
People in Group quarters - Short-term care, detention or diagnostic centers for delinquent children (%)
People in Group quarters - Type of juvenile institution unknown (%)
People in Group quarters - Noninstitutionalized population (%)
People in Group quarters - College dormitories (includes college quarters off campus) (%)
People in Group quarters - Military quarters (%)
People in Group quarters - On base (%)
People in Group quarters - Barracks, unaccompanied personnel housing (UPH), (Enlisted/Officer), ;and similar group living quarters for military personnel (%)
People in Group quarters - Transient quarters for temporary residents (%)
People in Group quarters - Military ships (%)
People in Group quarters - Group homes (%)
People in Group quarters - Homes or halfway houses for drug/alcohol abuse (%)
People in Group quarters - Homes for the mentally ill (%)
People in Group quarters - Homes for the mentally retarded (%)
People in Group quarters - Homes for the physically handicapped (%)
People in Group quarters - Other group homes (%)
People in Group quarters - Religious group quarters (%)
People in Group quarters - Dormitories (%)
People in Group quarters - Agriculture workers' dormitories on farms (%)
People in Group quarters - Job Corps and vocational training facilities (%)
People in Group quarters - Other workers' dormitories (%)
People in Group quarters - Crews of maritime vessels (%)
People in Group quarters - Other nonhousehold living situations (%)
People in Group quarters - Other noninstitutional group quarters (%)
Residents speaking English at home (%)
Residents speaking English at home - Born in the United States (%)
Residents speaking English at home - Native, born elsewhere (%)
Residents speaking English at home - Foreign born (%)
Residents speaking Spanish at home (%)
Residents speaking Spanish at home - Born in the United States (%)
Residents speaking Spanish at home - Native, born elsewhere (%)
Residents speaking Spanish at home - Foreign born (%)
Residents speaking other language at home (%)
Residents speaking other language at home - Born in the United States (%)
Residents speaking other language at home - Native, born elsewhere (%)
Residents speaking other language at home - Foreign born (%)
Class of Workers - Employee of private company (%)
Class of Workers - Self-employed in own incorporated business (%)
Class of Workers - Private not-for-profit wage and salary workers (%)
Class of Workers - Local government workers (%)
Class of Workers - State government workers (%)
Class of Workers - Federal government workers (%)
Class of Workers - Self-employed workers in own not incorporated business and Unpaid family workers (%)
House heating fuel used in houses and condos - Utility gas (%)
House heating fuel used in houses and condos - Bottled, tank, or LP gas (%)
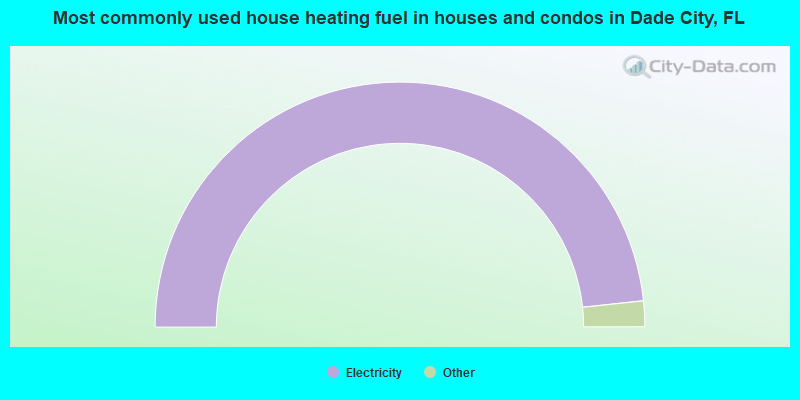
House heating fuel used in houses and condos - Electricity (%)
House heating fuel used in houses and condos - Fuel oil, kerosene, etc. (%)
House heating fuel used in houses and condos - Coal or coke (%)
House heating fuel used in houses and condos - Wood (%)
House heating fuel used in houses and condos - Solar energy (%)
House heating fuel used in houses and condos - Other fuel (%)
House heating fuel used in houses and condos - No fuel used (%)
House heating fuel used in apartments - Utility gas (%)
House heating fuel used in apartments - Bottled, tank, or LP gas (%)
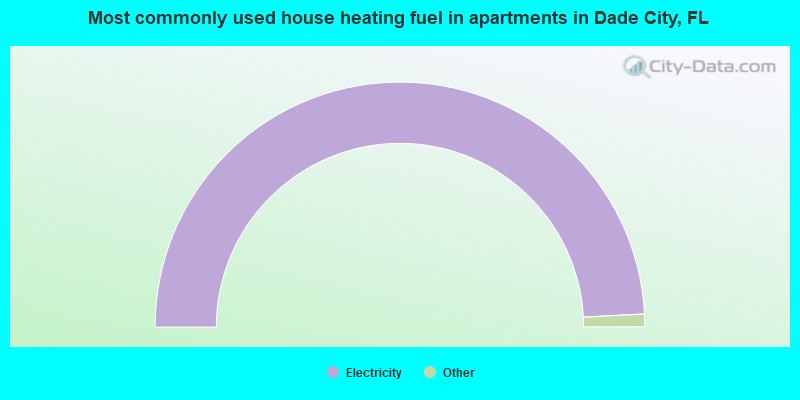
House heating fuel used in apartments - Electricity (%)
House heating fuel used in apartments - Fuel oil, kerosene, etc. (%)
House heating fuel used in apartments - Coal or coke (%)
House heating fuel used in apartments - Wood (%)
House heating fuel used in apartments - Solar energy (%)
House heating fuel used in apartments - Other fuel (%)
House heating fuel used in apartments - No fuel used (%)
Armed forces status - In Armed Forces (%)
Armed forces status - Civilian (%)
Armed forces status - Civilian - Veteran (%)
Armed forces status - Civilian - Nonveteran (%)
Fatal accidents locations in years 2005-2021
Fatal accidents locations in 2005
Fatal accidents locations in 2006
Fatal accidents locations in 2007
Fatal accidents locations in 2008
Fatal accidents locations in 2009
Fatal accidents locations in 2010
Fatal accidents locations in 2011
Fatal accidents locations in 2012
Fatal accidents locations in 2013
Fatal accidents locations in 2014
Fatal accidents locations in 2015
Fatal accidents locations in 2016
Fatal accidents locations in 2017
Fatal accidents locations in 2018
Fatal accidents locations in 2019
Fatal accidents locations in 2020
Fatal accidents locations in 2021
Alcohol use - People drinking some alcohol every month (%)
Alcohol use - People not drinking at all (%)
Alcohol use - Average days/month drinking alcohol
Alcohol use - Average drinks/week
Alcohol use - Average days/year people drink much
Audiometry - Average condition of hearing (%)
Audiometry - People that can hear a whisper from across a quiet room (%)
Audiometry - People that can hear normal voice from across a quiet room (%)
Audiometry - Ears ringing, roaring, buzzing (%)
Audiometry - Had a job exposure to loud noise (%)
Audiometry - Had off-work exposure to loud noise (%)
Blood Pressure & Cholesterol - Has high blood pressure (%)
Blood Pressure & Cholesterol - Checking blood pressure at home (%)
Blood Pressure & Cholesterol - Frequently checking blood cholesterol (%)
Blood Pressure & Cholesterol - Has high cholesterol level (%)
Consumer Behavior - Money monthly spent on food at supermarket/grocery store
Consumer Behavior - Money monthly spent on food at other stores
Consumer Behavior - Money monthly spent on eating out
Consumer Behavior - Money monthly spent on carryout/delivered foods
Consumer Behavior - Income spent on food at supermarket/grocery store (%)
Consumer Behavior - Income spent on food at other stores (%)
Consumer Behavior - Income spent on eating out (%)
Consumer Behavior - Income spent on carryout/delivered foods (%)
Current Health Status - General health condition (%)
Current Health Status - Blood donors (%)
Current Health Status - Has blood ever tested for HIV virus (%)
Current Health Status - Left-handed people (%)
Dermatology - People using sunscreen (%)
Diabetes - Diabetics (%)
Diabetes - Had a blood test for high blood sugar (%)
Diabetes - People taking insulin (%)
Diet Behavior & Nutrition - Diet health (%)
Diet Behavior & Nutrition - Milk product consumption (# of products/month)
Diet Behavior & Nutrition - Meals not home prepared (#/week)
Diet Behavior & Nutrition - Meals from fast food or pizza place (#/week)
Diet Behavior & Nutrition - Ready-to-eat foods (#/month)
Diet Behavior & Nutrition - Frozen meals/pizza (#/month)
Drug Use - People that ever used marijuana or hashish (%)
Drug Use - Ever used hard drugs (%)
Drug Use - Ever used any form of cocaine (%)
Drug Use - Ever used heroin (%)
Drug Use - Ever used methamphetamine (%)
Health Insurance - People covered by health insurance (%)
Kidney Conditions-Urology - Avg. # of times urinating at night
Medical Conditions - People with asthma (%)
Medical Conditions - People with anemia (%)
Medical Conditions - People with psoriasis (%)
Medical Conditions - People with overweight (%)
Medical Conditions - Elderly people having difficulties in thinking or remembering (%)
Medical Conditions - People who ever received blood transfusion (%)
Medical Conditions - People having trouble seeing even with glass/contacts (%)
Medical Conditions - People with arthritis (%)
Medical Conditions - People with gout (%)
Medical Conditions - People with congestive heart failure (%)
Medical Conditions - People with coronary heart disease (%)
Medical Conditions - People with angina pectoris (%)
Medical Conditions - People who ever had heart attack (%)
Medical Conditions - People who ever had stroke (%)
Medical Conditions - People with emphysema (%)
Medical Conditions - People with thyroid problem (%)
Medical Conditions - People with chronic bronchitis (%)
Medical Conditions - People with any liver condition (%)
Medical Conditions - People who ever had cancer or malignancy (%)
Mental Health - People who have little interest in doing things (%)
Mental Health - People feeling down, depressed, or hopeless (%)
Mental Health - People who have trouble sleeping or sleeping too much (%)
Mental Health - People feeling tired or having little energy (%)
Mental Health - People with poor appetite or overeating (%)
Mental Health - People feeling bad about themself (%)
Mental Health - People who have trouble concentrating on things (%)
Mental Health - People moving or speaking slowly or too fast (%)
Mental Health - People having thoughts they would be better off dead (%)
Oral Health - Average years since last visit a dentist
Oral Health - People embarrassed because of mouth (%)
Oral Health - People with gum disease (%)
Oral Health - General health of teeth and gums (%)
Oral Health - Average days a week using dental floss/device
Oral Health - Average days a week using mouthwash for dental problem
Oral Health - Average number of teeth
Pesticide Use - Households using pesticides to control insects (%)
Pesticide Use - Households using pesticides to kill weeds (%)
Physical Activity - People doing vigorous-intensity work activities (%)
Physical Activity - People doing moderate-intensity work activities (%)
Physical Activity - People walking or bicycling (%)
Physical Activity - People doing vigorous-intensity recreational activities (%)
Physical Activity - People doing moderate-intensity recreational activities (%)
Physical Activity - Average hours a day doing sedentary activities
Physical Activity - Average hours a day watching TV or videos
Physical Activity - Average hours a day using computer
Physical Functioning - People having limitations keeping them from working (%)
Physical Functioning - People limited in amount of work they can do (%)
Physical Functioning - People that need special equipment to walk (%)
Physical Functioning - People experiencing confusion/memory problems (%)
Physical Functioning - People requiring special healthcare equipment (%)
Prescription Medications - Average number of prescription medicines taking
Preventive Aspirin Use - Adults 40+ taking low-dose aspirin (%)
Reproductive Health - Vaginal deliveries (%)
Reproductive Health - Cesarean deliveries (%)
Reproductive Health - Deliveries resulted in a live birth (%)
Reproductive Health - Pregnancies resulted in a delivery (%)
Reproductive Health - Women breastfeeding newborns (%)
Reproductive Health - Women that had a hysterectomy (%)
Reproductive Health - Women that had both ovaries removed (%)
Reproductive Health - Women that have ever taken birth control pills (%)
Reproductive Health - Women taking birth control pills (%)
Reproductive Health - Women that have ever used Depo-Provera or injectables (%)
Reproductive Health - Women that have ever used female hormones (%)
Sexual Behavior - People 18+ that ever had sex (vaginal, anal, or oral) (%)
Sexual Behavior - Males 18+ that ever had vaginal sex with a woman (%)
Sexual Behavior - Males 18+ that ever performed oral sex on a woman (%)
Sexual Behavior - Males 18+ that ever had anal sex with a woman (%)
Sexual Behavior - Males 18+ that ever had any sex with a man (%)
Sexual Behavior - Females 18+ that ever had vaginal sex with a man (%)
Sexual Behavior - Females 18+ that ever performed oral sex on a man (%)
Sexual Behavior - Females 18+ that ever had anal sex with a man (%)
Sexual Behavior - Females 18+ that ever had any kind of sex with a woman (%)
Sexual Behavior - Average age people first had sex
Sexual Behavior - Average number of female sex partners in lifetime (males 18+)
Sexual Behavior - Average number of female vaginal sex partners in lifetime (males 18+)
Sexual Behavior - Average age people first performed oral sex on a woman (18+)
Sexual Behavior - Average number of woman performed oral sex on in lifetime (18+)
Sexual Behavior - Average number of male sex partners in lifetime (males 18+)
Sexual Behavior - Average number of male anal sex partners in lifetime (males 18+)
Sexual Behavior - Average age people first performed oral sex on a man (18+)
Sexual Behavior - Average number of male oral sex partners in lifetime (18+)
Sexual Behavior - People using protection when performing oral sex (%)
Sexual Behavior - Average number of times people have vaginal or anal sex a year
Sexual Behavior - People having sex without condom (%)
Sexual Behavior - Average number of male sex partners in lifetime (females 18+)
Sexual Behavior - Average number of male vaginal sex partners in lifetime (females 18+)
Sexual Behavior - Average number of female sex partners in lifetime (females 18+)
Sexual Behavior - Circumcised males 18+ (%)
Sleep Disorders - Average hours sleeping at night
Sleep Disorders - People that has trouble sleeping (%)
Smoking-Cigarette Use - People smoking cigarettes (%)
Taste & Smell - People 40+ having problems with smell (%)
Taste & Smell - People 40+ having problems with taste (%)
Taste & Smell - People 40+ that ever had wisdom teeth removed (%)
Taste & Smell - People 40+ that ever had tonsils teeth removed (%)
Taste & Smell - People 40+ that ever had a loss of consciousness because of a head injury (%)
Taste & Smell - People 40+ that ever had a broken nose or other serious injury to face or skull (%)
Taste & Smell - People 40+ that ever had two or more sinus infections (%)
Weight - Average height (inches)
Weight - Average weight (pounds)
Weight - Average BMI
Weight - People that are obese (%)
Weight - People that ever were obese (%)
Weight - People trying to lose weight (%)
Officers per 1,000 residents here:
3.07Florida average:
2.33
Latest news from Dade City, FL collected exclusively by city-data.com from local newspapers, TV, and radio stations
Ancestries: American (18.0%), German (5.1%), African (4.9%), Irish (4.9%), English (4.4%), European (2.9%).
Current Local Time:
Land area: 3.28 square miles.
Population density: 2,337 people per square mile (low).
656 residents are foreign born (6.6% Latin America , 1.3% North America ).
This city:
8.5%Florida:
21.1%
Median real estate property taxes paid for housing units with mortgages in 2022: $2,231 (0.7%)Median real estate property taxes paid for housing units with no mortgage in 2022: $931 (0.7%)
Nearest city with pop. 50,000+: Central Pasco, FL (12.2 miles
Nearest city with pop. 200,000+: Tampa, FL
Nearest city with pop. 1,000,000+: Houston, TX
Nearest cities:
Latitude: 28.36 N, Longitude: 82.19 W
Daytime population change due to commuting: +3,980 (+51.5%)Workers who live and work in this city: 1,391 (48.5%)
Single-family new house construction building permits:
2022: 399 buildings , average cost: $226,1002021: 144 buildings , average cost: $196,3002020: 14 buildings , average cost: $125,2002019: 8 buildings , average cost: $143,9002018: 15 buildings , average cost: $163,1002017: 16 buildings , average cost: $169,1002016: 30 buildings , average cost: $203,8002015: 10 buildings , average cost: $155,7002014: 52 buildings , average cost: $135,9002013: 46 buildings , average cost: $165,1002012: 9 buildings , average cost: $137,5002011: 12 buildings , average cost: $92,6002010: 19 buildings , average cost: $204,9002009: 17 buildings , average cost: $142,5002008: 23 buildings , average cost: $115,1002007: 26 buildings , average cost: $101,2002006: 37 buildings , average cost: $100,7002005: 43 buildings , average cost: $107,6002004: 56 buildings , average cost: $72,8002003: 13 buildings , average cost: $64,1002002: 10 buildings , average cost: $48,5002001: 7 buildings , average cost: $82,4002000: 3 buildings , average cost: $83,3001999: 9 buildings , average cost: $80,4001998: 11 buildings , average cost: $64,2001997: 16 buildings , average cost: $50,400Unemployment in December 2023:
Population change in the 1990s: +572 (+10.2%).
Most common occupations in Dade City, FL (%)
Both Males Females
Agricultural workers, including supervisors (5.0%)
Electrical equipment mechanics and other installation, maintenance, and repair workers, including supervisors (4.7%)
Preschool, kindergarten, elementary, and middle school teachers (4.1%)
Other office and administrative support workers, including supervisors (4.1%)
Laborers and material movers, hand (3.9%)
Building and grounds cleaning and maintenance occupations (3.6%)
Other management occupations, except farmers and farm managers (3.5%)
Electrical equipment mechanics and other installation, maintenance, and repair workers, including supervisors (7.9%)
Laborers and material movers, hand (7.6%)
Agricultural workers, including supervisors (7.1%)
Driver/sales workers and truck drivers (6.4%)
Building and grounds cleaning and maintenance occupations (5.1%)
Other sales and related occupations, including supervisors (3.9%)
Cooks and food preparation workers (3.8%)
Preschool, kindergarten, elementary, and middle school teachers (6.3%)
Waiters and waitresses (5.7%)
Child care workers (5.7%)
Other office and administrative support workers, including supervisors (5.7%)
Secretaries and administrative assistants (5.2%)
Other production occupations, including supervisors (4.7%)
Other management occupations, except farmers and farm managers (4.0%)
Air pollution and air quality trends(lower is better)
AQI Ozone Pb
Tornado activity:
Dade City-area historical tornado activity is above Florida state average. It is 59% greater than the overall U.S. average.
On 2/22/1998, a category F3 (max. wind speeds 158-206 mph) tornado 29.9 miles away from the Dade City city center killed 3 people and injured 70 people and caused $15 million in damages.
On 4/4/1966, a category F4 (max. wind speeds 207-260 mph) tornado 48.0 miles away from the city center killed 11 people and injured 530 people and caused between $5,000,000 and $50,000,000 in damages.
Earthquake activity:
Dade City-area historical earthquake activity is significantly above Florida state average. It is 88% smaller than the overall U.S. average. On 9/10/2006 at 14:56:08, a magnitude 5.9 (5.9 MB, 5.5 MS, 5.8 MW, Class: Moderate, Intensity: VI - VII) earthquake occurred 309.3 miles away from Dade City center On 10/24/1997 at 08:35:17, a magnitude 4.9 (4.8 MB, 4.2 MS, 4.9 LG, Depth: 6.2 mi, Class: Light, Intensity: IV - V) earthquake occurred 359.8 miles away from the city center On 11/22/1974 at 05:25:55, a magnitude 4.7 (4.7 MB) earthquake occurred 336.7 miles away from Dade City center On 8/2/1974 at 08:52:09, a magnitude 4.9 (4.3 MB, 4.9 LG) earthquake occurred 381.5 miles away from Dade City center On 9/4/2016 at 18:29:29, a magnitude 3.8 (3.8 ML, Class: Light, Intensity: II - III) earthquake occurred 200.0 miles away from Dade City center On 6/23/2016 at 17:20:29, a magnitude 3.8 (3.8 ML) earthquake occurred 200.5 miles away from Dade City center Magnitude types: regional Lg-wave magnitude (LG), body-wave magnitude (MB), local magnitude (ML), surface-wave magnitude (MS), moment magnitude (MW) Natural disasters: The number of natural disasters in Pasco County (21) is greater than the US average (15).Major Disasters (Presidential) Declared: 14Emergencies Declared: 4Hurricanes: 10, Floods: 4, Tropical Storms: 4, Storms: 3, Fires: 2, Tornadoes: 2, Freeze: 1, Wind: 1, Other: 1 (Note: some incidents may be assigned to more than one category). Hospitals and medical centers in Dade City: PASCO REGIONAL MEDICAL CENTER (Proprietary, 13100 FT KING ROAD) HERITAGE PARK (37135 COLEMAN AVE)
PASCO NURSING AND REHAB CENTER (14433 5TH STREET)
PASCO NURSING CENTER (447 N FIFTH ST)
ROYAL OAK NURSING CENTER (37300 ROYAL OAK LANE)
Amtrak station: DADE CITY (E. MERIDIAN AVE. AT HWY 98 BYP.)
.
Services: public payphones, free short-term parking, free long-term parking, call for taxi service.
Colleges/universities with over 2000 students nearest to Dade City:
Saint Leo University (about 5 miles; Saint Leo, FL ; Full-time enrollment: 14,572)
University of South Florida-Main Campus (about 26 miles; Tampa, FL ; FT enrollment: 35,920)
Florida Southern College (about 28 miles; Lakeland, FL ; FT enrollment: 2,460)
Ultimate Medical Academy-Tampa (about 28 miles; Tampa, FL ; FT enrollment: 16,672)
Everest University-Brandon (about 29 miles; Tampa, FL ; FT enrollment: 7,702)
Pasco-Hernando Community College (about 29 miles; New Port Richey, FL ; FT enrollment: 7,030)
Southeastern University (about 29 miles; Lakeland, FL ; FT enrollment: 2,407)
Public high schools in Dade City:
Private high school in Dade City: GOSPEL ASSEMBLY CHRISTIAN SCHOOL Students: 64, Location: 12747 HAPPY HILL RD, Grades: PK-12)
Public elementary/middle schools in Dade City: LACOOCHEE ELEMENTARY SCHOOL Students: 975, Location: 38815 CUMMER RD, Grades: PK-5)PASCO MIDDLE SCHOOL Students: 609, Location: 13925 14TH ST, Grades: 6-8)CENTENNIAL MIDDLE SCHOOL Students: 426, Location: 38505 CENTENNIAL RD, Grades: 6-8)CENTENNIAL ELEMENTARY SCHOOL Students: 382, Location: 38501 CENTENNIAL RD, Grades: PK-5)SAN ANTONIO ELEMENTARY SCHOOL Students: 319, Location: 32416 DARBY RD, Grades: PK-5)PASCO ELEMENTARY SCHOOL Students: 303, Location: 37350 FLORIDA AVE, Grades: PK-5)RODNEY B. COX ELEMENTARY SCHOOL Students: 281, Location: 37615 MARTIN LUTHER KING BLVD, Grades: PK-5)ACADEMY AT THE FARM Students: 259, Location: 9500 ALEX LANGE WAY, Grades: KG-8, Charter school )Private elementary/middle school in Dade City: EAST PASCO ADVENTIST ACADEMY Students: 61, Location: 38434 CENTENNIAL RD, Grades: PK-8)
See full list of schools located in Dade City
Notable locations in Dade City: (A) , Higate Square (B) , Dade City Shopping Plaza (C) , Pasco County Fire Marshal's Office (D) , Pasco County Fire Rescue Station 24 (E) , Pasco County Circuit Criminal (F) , Pasco County Sheriff's Office Records (G) , Dade City Police Department (H) , Hugh Embry Branch Library Pasco County Public Library (I) . Display/hide their locations on the map
Shopping Centers: (1) , Interplaza Shopping Center (2) , Dade Village Shopping Center (3) . Display/hide their locations on the map
Churches in Dade City include: (A) , Westside Mission (B) . Display/hide their locations on the map
Cemeteries: (1) , Floral Memory Gardens (2) . Display/hide their locations on the map
Lake: (A) . Display/hide its location on the map
Hotels:
Courts:
Birthplace of: Clinton Hart - 2005 NFL player (San Diego Chargers, born : Jul 20, 1977), Dallas Eakins - Ice hockey player, Dave Eiland - College baseball player, Roy Roberts - Film actor, Martha Barnett - Lawyer.
Pasco County has a predicted average indoor radon screening level less than 2 pCi/L (pico curies per liter) - Low Potential Drinking water stations with addresses in Dade City and their reported violations in the past:
DADE CITY WATER DEPT (Address: 38008 MERIDIAN AVE Population served: 13,018, Groundwater):
Past health violations:
MCL, Monthly (TCR) - In JUL-2010, Contaminant: Coliform. Follow-up actions: St Public Notif received (AUG-10-2010), St Compliance achieved (JAN-31-2011)
Past monitoring violations:
Monitoring, Source Water (GWR) - In JAN-01-2013, Contaminant: E. COLI
2 minor monitoring violations
Population served: 300, Groundwater):
Past monitoring violations:
One minor monitoring violation
Population served: 80, Groundwater):
Past monitoring violations:
Monitoring and Reporting (DBP) - Between JUL-2012 and SEP-2012, Contaminant: Total Haloacetic Acids (HAA5). Follow-up actions: St Public Notif received (OCT-30-2012)
Monitoring and Reporting (DBP) - Between JUL-2012 and SEP-2012, Contaminant: TTHM. Follow-up actions: St Public Notif received (OCT-30-2012)
Population served: 42, Groundwater):
Past monitoring violations:
One routine major monitoring violation
One regular monitoring violation
Population served: 25, Groundwater):
Past monitoring violations:
One routine major monitoring violation
Population served: 25, Groundwater):
Past health violations:
MCL, Monthly (TCR) - In JUN-2006, Contaminant: Coliform
Population served: 25, Groundwater):
Past health violations:
MCL, Monthly (TCR) - In APR-2014, Contaminant: Coliform
Past monitoring violations:
Failure to Conduct Assessment Monitoring - Between JAN-2013 and MAR-2013, Contaminant: E. COLI
4 routine major monitoring violations
2 minor monitoring violations
Population served: 25, Groundwater):
Past monitoring violations:
2 routine major monitoring violations
Drinking water stations with addresses in Dade City that have no violations reported:
SAFARI WILD WELCOME BARN (Population served: 500, Primary Water Source Type: Groundwater)
KOZY ACRES (Population served: 125, Primary Water Source Type: Groundwater)
LANGE FARM (Population served: 25, Primary Water Source Type: Groundwater)
VAUGHANS COUNTRY STORE (Population served: 25, Primary Water Source Type: Groundwater)
Average household size: This city:
2.5 peopleFlorida:
2.5 people
Percentage of family households: This city:
61.1%Whole state:
65.2%
Percentage of households with unmarried partners: This city:
7.2%Whole state:
7.3%
Likely homosexual households (counted as self-reported same-sex unmarried-partner households)
Lesbian couples: 0.3% of all households Gay men: 0.3% of all households
People in group quarters in Dade City in 2010:
210 people in nursing facilities/skilled-nursing facilities
42 people in other noninstitutional facilities
5 people in group homes intended for adults
People in group quarters in Dade City in 2000:
221 people in nursing homes
130 people in agriculture workers' dormitories on farms
5 people in homes for the mentally retarded
2 people in religious group quarters
Banks with branches in Dade City (2011 data):
CenterState Bank of Florida, National Association: Dade City Branch at 14045 7th Street, branch established on 2000/03/16. Info updated 2012/01/30: Bank assets: $2,082.6 mil, Deposits: $1,779.8 mil, headquarters in Winter Haven, FL, positive income , Commercial Lending Specialization, 65 total offices , Holding Company: Centerstate Banks, Inc.
Wells Fargo Bank, National Association: Dade City Branch at 14210 Seventh Street, branch established on 1889/01/01. Info updated 2011/04/05: Bank assets: $1,161,490.0 mil, Deposits: $905,653.0 mil, headquarters in Sioux Falls, SD, positive income , 6395 total offices , Holding Company: Wells Fargo & Company
Bank of America, National Association: Dade City Branch at 37939 Church Avenue, branch established on 1960/01/09. Info updated 2009/11/18: Bank assets: $1,451,969.3 mil, Deposits: $1,077,176.8 mil, headquarters in Charlotte, NC, positive income , 5782 total offices , Holding Company: Bank Of America Corporation
Florida Traditions Bank: at 14033 8th Street, branch established on 2007/12/10. Info updated 2009/06/08: Bank assets: $241.0 mil, Deposits: $205.4 mil, local headquarters , positive income , Commercial Lending Specialization, 5 total offices
Community Bank & Company: Dade City Branch at 13839 Us 98 Bypass, branch established on 2006/09/05. Info updated 2011/06/10: Bank assets: $729.3 mil, Deposits: $557.7 mil, headquarters in Lakewood Ranch, FL, positive income , Commercial Lending Specialization, 18 total offices , Holding Company: Cbm Florida Holding Company
First National Bank of Pasco: First National Bank Of Pasco at 13315 Ushwy 301 South, branch established on 1986/11/03. Info updated 2007/09/13: Bank assets: $159.6 mil, Deposits: $141.4 mil, local headquarters , negative income in the last year , 3 total offices , Holding Company: Florida Bancshares, Inc.
SunTrust Bank: Clinton Avenue Branch at 11704 South Highway 301, branch established on 1985/12/02. Info updated 2010/05/27: Bank assets: $171,291.7 mil, Deposits: $129,833.2 mil, headquarters in Atlanta, GA, positive income , Commercial Lending Specialization, 1716 total offices , Holding Company: Suntrust Banks, Inc.
For population 15 years and over in Dade City:
Never married: 31.8%Now married: 43.3%Separated: 1.5%Widowed: 7.3%Divorced: 16.1% For population 25 years and over in Dade City:
High school or higher: 83.6%Bachelor's degree or higher: 23.3%Graduate or professional degree: 2.5%Unemployed: 6.8%Mean travel time to work (commute): 29.0 minutes
Education Gini index (Inequality in education) Here:
11.5Florida average:
12.2
Religion statistics for Dade City, FL (based on Pasco County data)
Religion Adherents Congregations Evangelical Protestant 42,599 194 Catholic 41,497 13 Mainline Protestant 12,376 36 Other 2,979 22 Orthodox 1,350 3 Black Protestant 623 5 None 363,273 -
Source: Clifford Grammich, Kirk Hadaway, Richard Houseal, Dale E.Jones, Alexei Krindatch, Richie Stanley and Richard H.Taylor. 2012. 2010 U.S.Religion Census: Religious Congregations & Membership Study. Association of Statisticians of American Religious Bodies. Jones, Dale E., et al. 2002. Congregations and Membership in the United States 2000. Nashville, TN: Glenmary Research Center. Graphs represent county-level data
Food Environment Statistics: Number of grocery stores : 64This county :
1.39 / 10,000 pop.Florida :
2.04 / 10,000 pop.
Number of supercenters and club stores : 6Pasco County :
0.13 / 10,000 pop.State :
0.11 / 10,000 pop.
Number of convenience stores (no gas) : 49Here :
1.06 / 10,000 pop.Florida :
1.28 / 10,000 pop.
Number of convenience stores (with gas) : 117This county :
2.54 / 10,000 pop.Florida :
3.04 / 10,000 pop.
Number of full-service restaurants : 219Here :
4.75 / 10,000 pop.Florida :
7.45 / 10,000 pop.
Adult diabetes rate : Pasco County :
9.9%Florida :
9.2%
Adult obesity rate : Pasco County :
23.9%Florida :
23.7%
Low-income preschool obesity rate : Health and Nutrition:
Average overall health of teeth and gums : Dade City:
46.7%State:
49.4%
People feeling badly about themselves : This city:
20.7%Florida:
19.5%
People not drinking alcohol at all : Average hours sleeping at night : Overweight people : Dade City:
33.3%Florida:
34.7%
General health condition : This city:
54.8%Florida:
57.0%
Average condition of hearing : More about Health and Nutrition of Dade City, FL Residents
Local government employment and payroll (March 2022)
Function
Full-time employees
Monthly full-time payroll
Average yearly full-time wage
Part-time employees
Monthly part-time payroll
Police Protection - Officers
22 $107,229 $58,489 1 $1,614 Other and Unallocable
11 $43,633 $47,600 1 $1,309 Sewerage
10 $32,776 $39,331 0 $0 Water Supply
10 $38,309 $45,971 1 $1,794 Other Government Administration
8 $41,035 $61,553 5 $561 Financial Administration
8 $25,630 $38,445 0 $0 Police - Other
8 $28,296 $42,444 3 $3,521 Streets and Highways
7 $21,919 $37,575 0 $0 Parks and Recreation
6 $18,066 $36,132 0 $0 Solid Waste Management
1 $5,722 $68,664 0 $0
Totals for Government
91 $362,616 $47,817 11 $8,798
Dade City government finances - Expenditure in 2017 (per resident):
Construction - Regular Highways: $12,000 ($1.56)
Current Operations - Police Protection: $2,318,000 ($302.22)
Solid Waste Management: $1,531,000 ($199.61)General - Other: $1,047,000 ($136.51)Sewerage: $692,000 ($90.22)Regular Highways: $642,000 ($83.70)Financial Administration: $605,000 ($78.88)Central Staff Services: $525,000 ($68.45)Water Utilities: $490,000 ($63.89)Local Fire Protection: $309,000 ($40.29)Parks and Recreation: $272,000 ($35.46)Protective Inspection and Regulation - Other: $133,000 ($17.34)Natural Resources - Other: $63,000 ($8.21)Judicial and Legal Services: $57,000 ($7.43)General - Interest on Debt: $5,000 ($0.65)
Other Capital Outlay - General - Other: $2,871,000 ($374.32)
Natural Resources - Other: $1,144,000 ($149.15)Local Fire Protection: $21,000 ($2.74)Police Protection: $14,000 ($1.83)Parks and Recreation: $9,000 ($1.17)Financial Administration: $3,000 ($0.39)Central Staff Services: $1,000 ($0.13)Protective Inspection and Regulation - Other: $1,000 ($0.13)Water Utilities - Interest on Debt: $257,000 ($33.51)
Dade City government finances - Revenue in 2017 (per resident):
Charges - Sewerage: $1,586,000 ($206.78)
Natural Resources - Other: $277,000 ($36.11)Solid Waste Management: $254,000 ($33.12)Other: $94,000 ($12.26)Miscellaneous Commercial Activities: $26,000 ($3.39)Regular Highways: $20,000 ($2.61)Federal Intergovernmental - Public Welfare: $12,000 ($1.56)
Other: $2,000 ($0.26)Local Intergovernmental - Other: $122,000 ($15.91)
General Local Government Support: $6,000 ($0.78)Miscellaneous - Interest Earnings: $327,000 ($42.63)
Special Assessments: $100,000 ($13.04)Fines and Forfeits: $79,000 ($10.30)General Revenue - Other: $41,000 ($5.35)Donations From Private Sources: $8,000 ($1.04)Rents: $5,000 ($0.65)Revenue - Water Utilities: $1,559,000 ($203.26)
State Intergovernmental - General Local Government Support: $757,000 ($98.70)
Other: $273,000 ($35.59)Highways: $30,000 ($3.91)Tax - Property: $1,943,000 ($253.32)
Other Selective Sales: $939,000 ($122.43)Public Utilities Sales: $843,000 ($109.91)Occupation and Business License - Other: $663,000 ($86.44)Motor Fuels Sales: $245,000 ($31.94)Insurance Premiums Sales: $110,000 ($14.34)Other License: $75,000 ($9.78)
Dade City government finances - Debt in 2017 (per resident):
Long Term Debt - Outstanding Unspecified Public Purpose: $10,403,000 ($1356.32)
Beginning Outstanding - Unspecified Public Purpose: $7,853,000 ($1023.86)Issue, Unspecified Public Purpose: $2,782,000 ($362.71)Retired Unspecified Public Purpose: $311,000 ($40.55)
Dade City government finances - Cash and Securities in 2017 (per resident):
Other Funds - Cash and Securities: $12,560,000 ($1637.55)
Sinking Funds - Cash and Securities: $1,221,000 ($159.19)
12.35% of this county's 2021 resident taxpayers lived in other counties in 2020 ($65,952 average adjusted gross income )
Here:
12.35%Florida average:
8.80%
0.04% of residents moved from foreign countries ($174 average AGI )Pasco County:
0.04%Florida average:
0.05%
Top counties from which taxpayers relocated into this county between 2020 and 2021:
8.37% of this county's 2020 resident taxpayers moved to other counties in 2021 ($54,340 average adjusted gross income )
Here:
8.37%Florida average:
7.45%
0.03% of residents moved to foreign countries ($207 average AGI )Pasco County:
0.03%Florida average:
0.04%
Top counties to which taxpayers relocated from this county between 2020 and 2021:
Businesses in Dade City, FL
Name Count Name Count
AT&T 1 La-Z-Boy 1 Advance Auto Parts 1 Lane Furniture 1 AutoZone 1 Little Caesars Pizza 1 CVS 1 MasterBrand Cabinets 4 Chevrolet 1 McDonald's 1 Circle K 2 Nike 1 Decora Cabinetry 2 Penske 1 Domino's Pizza 1 Pizza Hut 1 FedEx 4 Taco Bell 1 Ford 1 True Value 1 H&R Block 1 U-Haul 5 Hilton 1 UPS 3 IHOP 1 Village Inn 1 Jimmy Jazz 1 Walgreens 1 Jones New York 2 Walmart 1 KFC 1
Strongest AM radio stations in Dade City:
WDCF (1350 AM; 1 kW; DADE CITY, FL; Owner: WAGENVOORD ADVERTISING GROUP, INC.)
WFLF (540 AM; 50 kW; PINE HILLS, FL; Owner: CLEAR CHANNEL BROADCASTING LICENSES, INC.)
WQYK (1010 AM; 50 kW; SEFFNER, FL; Owner: INFINITY BROADCASTING CORPORATION OF TAMPA)
WQTM (740 AM; 50 kW; ORLANDO, FL; Owner: CLEAR CHANNEL BROADCASTING LICENSES, INC.)
WMGG (820 AM; 50 kW; LARGO, FL; Owner: MEGA COMMUNICATIONS OF ST. PETERSBURG LICENSEE)
WZHR (1400 AM; 1 kW; ZEPHYRHILLS, FL; Owner: WAGENVOORD ADVERTISING GROUP, INC.)
WDYZ (990 AM; 50 kW; ORLANDO, FL; Owner: ABC, INC.)
WLCC (760 AM; 10 kW; BRANDON, FL; Owner: MEGA COMMUNICATIONS OF TAMPA LICENSEE)
WFLA (970 AM; 25 kW; TAMPA, FL; Owner: CITICASTERS LICENSES, L.P.)
WHNZ (1250 AM; 25 kW; TAMPA, FL; Owner: CITICASTERS LICENSES, L.P.)
WTBN (570 AM; 5 kW; PINELLAS PARK, FL; Owner: COMMON GROUND BROADCASTING, INC.)
WHOO (1080 AM; daytime; 35 kW; KISSIMMEE, FL; Owner: GENESIS COMMUNICATIONS I, INC.)
WONQ (1030 AM; 45 kW; OVIEDO, FL; Owner: FLORIDA BROADCASTERS)
Strongest FM radio stations in Dade City:
WTMP-FM (96.1 FM; DADE CITY, FL; Owner: TAMA GROUP, L.C.)
WRBQ-FM (104.7 FM; TAMPA, FL; Owner: INFINITY RADIO OPERATIONS INC.)
WDUV (105.5 FM; NEW PORT RICHEY, FL; Owner: CXR HOLDINGS, INC.)
WWRM (94.9 FM; TAMPA, FL; Owner: COX RADIO, INC.)
WPOI (101.5 FM; ST. PETERSBURG, FL; Owner: CXR HOLDINGS, INC.)
WXXL (106.7 FM; TAVARES, FL; Owner: AMFM RADIO LICENSES, L.L.C.)
WFLZ-FM (93.3 FM; TAMPA, FL; Owner: CITICASTERS LICENSES, L.P.)
WMTX (100.7 FM; TAMPA, FL; Owner: CITICASTERS LICENSES, L.P.)
WQYK-FM (99.5 FM; ST. PETERSBURG, FL; Owner: INFINITY BROADCASTING CORPORATION OF FLORIDA)
WTBT (103.5 FM; BRADENTON, FL; Owner: CITICASTERS LICENSES, L.P.)
WXTB (97.9 FM; CLEARWATER, FL; Owner: CITICASTERS LICENSES, L.P.)
WPCV (97.5 FM; WINTER HAVEN, FL; Owner: HALL COMMUNICATIONS, INC.)
WSJT (94.1 FM; LAKELAND, FL; Owner: INFINITY RADIO OPERATIONS INC.)
WGUL-FM (106.3 FM; BEVERLY HILLS, FL; Owner: WGUL-FM, INC.)
WUSF (89.7 FM; TAMPA, FL; Owner: UNIVERSITY OF S. FLORIDA)
WKES (91.1 FM; LAKELAND, FL; Owner: THE MOODY BIBLE INSTITUTE OF CHICAGO)
WBVM (90.5 FM; TAMPA, FL; Owner: BISHOP OF THE DIOCESE/ST. PETERSBURG)
WBBY (107.3 FM; ST. PETERSBURG, FL; Owner: COX RADIO, INC.)
WSUN-FM (97.1 FM; HOLIDAY, FL; Owner: COX RADIO, INC)
WYFE (88.9 FM; TARPON SPRINGS, FL; Owner: BIBLE BROADCASTING NETWORK, INC.)
TV broadcast stations around Dade City:
WEDU (Channel 3; TAMPA, FL; Owner: FLORIDA WEST COAST PUBLIC BROADCASTING, INC.)
WFLA-TV (Channel 8; TAMPA, FL; Owner: MEDIA GENERAL COMMUNICATIONS, INC.)
WFTS-TV (Channel 28; TAMPA, FL; Owner: TAMPA BAY TELEVISION, INC.)
WUSF-TV (Channel 16; TAMPA, FL; Owner: UNIVERSITY OF SOUTH FLORIDA)
WTOG (Channel 44; ST. PETERSBURG, FL; Owner: VIACOM INTERNATIONAL INC.)
WXPX (Channel 66; BRADENTON, FL; Owner: PAXSON COMMUNICATION LICENSE COMPANY, LLC)
WTSP (Channel 10; ST. PETERSBURG, FL; Owner: PACIFIC AND SOUTHERN COMPANY, INC.)
WTTA (Channel 38; ST. PETERSBURG, FL; Owner: BAY TELEVISION, INC.)
WFTT (Channel 50; TAMPA, FL; Owner: TELEFUTURA TAMPA LLC)
WZXZ-CA (Channel 11; ORLANDO, ETC., FL; Owner: THE BOX WORLDWIDE LLC)
WMOR-TV (Channel 32; LAKELAND, FL; Owner: WMOR-TV COMPANY)
WTVT (Channel 13; TAMPA, FL; Owner: TVT LICENSE, INC.)
WCLF (Channel 22; CLEARWATER, FL; Owner: CHRISTIAN TELEVISION CORPORATION, INC.)
WTAM-LP (Channel 6; TAMPA, FL; Owner: U.S. INTERACTIVE, L.L.C.)
WRMD-LP (Channel 57; TAMPA, FL; Owner: ZGS TELEVISION OF TAMPA, INC.)
Home Mortgage Disclosure Act Aggregated Statistics For Year 2009(Based on 1 partial tract) A) FHA, FSA/RHS & VA B) Conventional C) Refinancings D) Home Improvement Loans F) Non-occupant Loans on G) Loans On Manufactured Number Average Value Number Average Value Number Average Value Number Average Value Number Average Value Number Average Value
LOANS ORIGINATED 7 $101,909 4 $113,845 18 $118,703 4 $3,910 2 $99,920 0 $0 APPLICATIONS APPROVED, NOT ACCEPTED 0 $0 2 $99,675 0 $0 0 $0 1 $90,390 0 $0 APPLICATIONS DENIED 4 $125,815 1 $119,220 18 $123,887 4 $19,300 1 $77,200 1 $137,790 APPLICATIONS WITHDRAWN 2 $99,185 1 $88,930 7 $142,880 1 $174,430 0 $0 0 $0 FILES CLOSED FOR INCOMPLETENESS 0 $0 0 $0 1 $221,340 0 $0 0 $0 0 $0
Aggregated Statistics For Year 2008(Based on 1 partial tract) A) FHA, FSA/RHS & VA B) Conventional C) Refinancings D) Home Improvement Loans F) Non-occupant Loans on G) Loans On Manufactured Number Average Value Number Average Value Number Average Value Number Average Value Number Average Value Number Average Value
LOANS ORIGINATED 7 $145,533 4 $139,008 22 $130,479 3 $36,647 2 $71,580 0 $0 APPLICATIONS APPROVED, NOT ACCEPTED 1 $153,420 1 $63,520 6 $125,245 1 $41,530 0 $0 0 $0 APPLICATIONS DENIED 4 $131,678 4 $138,395 31 $138,747 6 $79,478 3 $103,257 1 $148,050 APPLICATIONS WITHDRAWN 1 $134,850 1 $250,160 9 $138,328 0 $0 0 $0 0 $0 FILES CLOSED FOR INCOMPLETENESS 0 $0 0 $0 3 $232,410 0 $0 0 $0 0 $0
Aggregated Statistics For Year 2007(Based on 1 partial tract) A) FHA, FSA/RHS & VA B) Conventional C) Refinancings D) Home Improvement Loans F) Non-occupant Loans on G) Loans On Manufactured Number Average Value Number Average Value Number Average Value Number Average Value Number Average Value Number Average Value
LOANS ORIGINATED 2 $204,970 19 $137,451 56 $114,289 13 $66,375 14 $122,255 0 $0 APPLICATIONS APPROVED, NOT ACCEPTED 0 $0 6 $137,297 11 $157,906 2 $64,005 3 $113,680 1 $100,160 APPLICATIONS DENIED 1 $234,040 14 $170,172 54 $125,760 10 $46,808 6 $105,782 5 $73,486 APPLICATIONS WITHDRAWN 0 $0 3 $288,437 29 $121,358 2 $125,325 3 $101,953 0 $0 FILES CLOSED FOR INCOMPLETENESS 0 $0 0 $0 11 $155,996 1 $64,500 0 $0 0 $0
Aggregated Statistics For Year 2006(Based on 1 partial tract) A) FHA, FSA/RHS & VA B) Conventional C) Refinancings D) Home Improvement Loans E) Loans on Dwellings For 5+ Families F) Non-occupant Loans on G) Loans On Manufactured Number Average Value Number Average Value Number Average Value Number Average Value Number Average Value Number Average Value Number Average Value
LOANS ORIGINATED 2 $116,285 58 $115,529 76 $120,376 16 $50,539 1 $503,750 30 $108,713 4 $70,115 APPLICATIONS APPROVED, NOT ACCEPTED 0 $0 10 $101,629 20 $150,953 1 $246,740 0 $0 6 $91,775 2 $91,370 APPLICATIONS DENIED 1 $197,880 32 $122,807 65 $115,317 8 $63,762 0 $0 13 $149,812 1 $134,850 APPLICATIONS WITHDRAWN 1 $115,800 10 $128,795 39 $126,936 5 $117,654 0 $0 5 $78,860 0 $0 FILES CLOSED FOR INCOMPLETENESS 0 $0 4 $130,090 7 $139,041 1 $82,080 0 $0 3 $105,863 0 $0
Aggregated Statistics For Year 2005(Based on 1 partial tract) A) FHA, FSA/RHS & VA B) Conventional C) Refinancings D) Home Improvement Loans F) Non-occupant Loans on G) Loans On Manufactured Number Average Value Number Average Value Number Average Value Number Average Value Number Average Value Number Average Value
LOANS ORIGINATED 3 $119,220 88 $117,292 65 $102,365 9 $69,870 29 $105,150 1 $201,300 APPLICATIONS APPROVED, NOT ACCEPTED 0 $0 16 $108,622 12 $74,063 0 $0 5 $96,742 0 $0 APPLICATIONS DENIED 0 $0 28 $102,536 56 $127,490 18 $52,959 8 $115,615 4 $92,590 APPLICATIONS WITHDRAWN 1 $87,950 15 $132,378 43 $98,481 3 $145,277 5 $109,544 1 $142,180 FILES CLOSED FOR INCOMPLETENESS 0 $0 4 $72,680 22 $148,201 0 $0 4 $85,992 0 $0
Aggregated Statistics For Year 2004(Based on 1 partial tract) A) FHA, FSA/RHS & VA B) Conventional C) Refinancings D) Home Improvement Loans E) Loans on Dwellings For 5+ Families F) Non-occupant Loans on G) Loans On Manufactured Number Average Value Number Average Value Number Average Value Number Average Value Number Average Value Number Average Value Number Average Value
LOANS ORIGINATED 7 $93,671 43 $107,799 55 $85,567 5 $41,726 1 $172,480 10 $74,023 3 $105,537 APPLICATIONS APPROVED, NOT ACCEPTED 0 $0 11 $83,551 11 $77,555 0 $0 0 $0 2 $91,610 2 $74,025 APPLICATIONS DENIED 1 $144,140 17 $106,486 41 $79,284 11 $22,386 0 $0 5 $113,258 5 $41,726 APPLICATIONS WITHDRAWN 1 $143,650 13 $126,885 22 $107,248 0 $0 0 $0 1 $107,490 2 $79,885 FILES CLOSED FOR INCOMPLETENESS 0 $0 4 $116,288 15 $130,261 0 $0 0 $0 0 $0 0 $0
Aggregated Statistics For Year 2003(Based on 1 partial tract) A) FHA, FSA/RHS & VA B) Conventional C) Refinancings D) Home Improvement Loans F) Non-occupant Loans on Number Average Value Number Average Value Number Average Value Number Average Value Number Average Value
LOANS ORIGINATED 9 $92,346 34 $104,431 79 $91,925 8 $13,254 10 $89,902 APPLICATIONS APPROVED, NOT ACCEPTED 0 $0 6 $117,102 16 $58,418 2 $42,020 4 $93,932 APPLICATIONS DENIED 1 $87,460 10 $63,860 51 $91,809 4 $14,048 4 $55,335 APPLICATIONS WITHDRAWN 2 $98,455 5 $124,496 19 $100,034 0 $0 1 $73,290 FILES CLOSED FOR INCOMPLETENESS 0 $0 2 $122,150 3 $98,860 0 $0 0 $0
Aggregated Statistics For Year 2002(Based on 1 partial tract) A) FHA, FSA/RHS & VA B) Conventional C) Refinancings D) Home Improvement Loans F) Non-occupant Loans on Number Average Value Number Average Value Number Average Value Number Average Value Number Average Value
LOANS ORIGINATED 1 $76,220 40 $87,178 60 $81,873 15 $17,687 10 $62,687 APPLICATIONS APPROVED, NOT ACCEPTED 0 $0 7 $69,870 12 $65,309 0 $0 4 $80,620 APPLICATIONS DENIED 3 $81,923 13 $52,017 38 $63,569 8 $16,490 5 $41,824 APPLICATIONS WITHDRAWN 0 $0 5 $131,824 19 $75,038 2 $24,675 0 $0 FILES CLOSED FOR INCOMPLETENESS 0 $0 1 $34,200 6 $60,993 0 $0 0 $0
Aggregated Statistics For Year 2001(Based on 1 partial tract) A) FHA, FSA/RHS & VA B) Conventional C) Refinancings D) Home Improvement Loans F) Non-occupant Loans on Number Average Value Number Average Value Number Average Value Number Average Value Number Average Value
LOANS ORIGINATED 9 $82,899 48 $98,056 50 $66,244 10 $12,655 12 $55,741 APPLICATIONS APPROVED, NOT ACCEPTED 0 $0 7 $67,846 6 $49,105 0 $0 2 $91,125 APPLICATIONS DENIED 1 $88,930 21 $39,460 46 $59,184 5 $14,462 4 $76,100 APPLICATIONS WITHDRAWN 1 $108,470 4 $48,492 27 $70,340 4 $18,200 1 $46,420 FILES CLOSED FOR INCOMPLETENESS 1 $21,500 0 $0 4 $47,272 0 $0 1 $34,200
Aggregated Statistics For Year 2000(Based on 1 partial tract) A) FHA, FSA/RHS & VA B) Conventional C) Refinancings D) Home Improvement Loans F) Non-occupant Loans on Number Average Value Number Average Value Number Average Value Number Average Value Number Average Value
LOANS ORIGINATED 8 $78,115 33 $88,022 21 $53,258 10 $8,893 7 $58,213 APPLICATIONS APPROVED, NOT ACCEPTED 0 $0 7 $60,726 6 $54,642 5 $23,356 0 $0 APPLICATIONS DENIED 1 $92,830 29 $54,386 39 $41,468 12 $21,091 5 $58,046 APPLICATIONS WITHDRAWN 1 $114,820 6 $45,603 29 $49,433 3 $57,003 1 $92,830 FILES CLOSED FOR INCOMPLETENESS 0 $0 1 $106,510 14 $59,539 1 $49,840 1 $64,500
Aggregated Statistics For Year 1999(Based on 1 partial tract) A) FHA, FSA/RHS & VA B) Conventional C) Refinancings D) Home Improvement Loans F) Non-occupant Loans on Number Average Value Number Average Value Number Average Value Number Average Value Number Average Value
LOANS ORIGINATED 6 $63,092 40 $68,744 42 $53,743 14 $11,206 10 $41,315 APPLICATIONS APPROVED, NOT ACCEPTED 0 $0 9 $59,384 14 $54,114 5 $15,396 1 $25,330 APPLICATIONS DENIED 1 $95,490 21 $56,492 30 $48,834 14 $14,859 2 $56,270 APPLICATIONS WITHDRAWN 0 $0 4 $69,182 21 $131,706 5 $34,298 1 $29,230 FILES CLOSED FOR INCOMPLETENESS 0 $0 1 $149,080 15 $65,382 0 $0 0 $0
Detailed HMDA statistics for the following Tracts:
0326.00
Private Mortgage Insurance Companies Aggregated Statistics For Year 2008(Based on 1 partial tract) A) Conventional B) Refinancings Number Average Value Number Average Value
LOANS ORIGINATED 3 $155,213 1 $100,160 APPLICATIONS APPROVED, NOT ACCEPTED 1 $244,300 1 $121,170 APPLICATIONS DENIED 0 $0 0 $0 APPLICATIONS WITHDRAWN 0 $0 0 $0 FILES CLOSED FOR INCOMPLETENESS 0 $0 0 $0
Aggregated Statistics For Year 2007(Based on 1 partial tract) A) Conventional B) Refinancings C) Non-occupant Loans on Number Average Value Number Average Value Number Average Value
LOANS ORIGINATED 6 $136,075 3 $164,333 3 $121,173 APPLICATIONS APPROVED, NOT ACCEPTED 2 $191,530 1 $247,230 0 $0 APPLICATIONS DENIED 0 $0 0 $0 0 $0 APPLICATIONS WITHDRAWN 1 $104,560 0 $0 0 $0 FILES CLOSED FOR INCOMPLETENESS 0 $0 0 $0 0 $0
Aggregated Statistics For Year 2006(Based on 1 partial tract) A) Conventional B) Refinancings C) Non-occupant Loans on Number Average Value Number Average Value Number Average Value
LOANS ORIGINATED 14 $127,490 2 $134,610 7 $122,360 APPLICATIONS APPROVED, NOT ACCEPTED 3 $248,860 2 $142,185 1 $397,720 APPLICATIONS DENIED 2 $153,175 0 $0 2 $128,015 APPLICATIONS WITHDRAWN 0 $0 0 $0 0 $0 FILES CLOSED FOR INCOMPLETENESS 0 $0 0 $0 0 $0
Aggregated Statistics For Year 2005(Based on 1 partial tract) A) Conventional B) Refinancings C) Non-occupant Loans on Number Average Value Number Average Value Number Average Value
LOANS ORIGINATED 11 $113,666 3 $145,277 3 $104,723 APPLICATIONS APPROVED, NOT ACCEPTED 1 $95,280 0 $0 0 $0 APPLICATIONS DENIED 0 $0 0 $0 0 $0 APPLICATIONS WITHDRAWN 0 $0 0 $0 0 $0 FILES CLOSED FOR INCOMPLETENESS 0 $0 0 $0 0 $0
Aggregated Statistics For Year 2004(Based on 1 partial tract) A) Conventional B) Refinancings C) Non-occupant Loans on Number Average Value Number Average Value Number Average Value
LOANS ORIGINATED 10 $94,642 7 $97,091 3 $69,870 APPLICATIONS APPROVED, NOT ACCEPTED 2 $127,280 1 $109,940 0 $0 APPLICATIONS DENIED 0 $0 0 $0 0 $0 APPLICATIONS WITHDRAWN 0 $0 2 $88,680 0 $0 FILES CLOSED FOR INCOMPLETENESS 0 $0 0 $0 0 $0
Aggregated Statistics For Year 2003(Based on 1 partial tract) A) Conventional B) Refinancings Number Average Value Number Average Value
LOANS ORIGINATED 10 $103,974 2 $155,620 APPLICATIONS APPROVED, NOT ACCEPTED 1 $67,920 1 $104,560 APPLICATIONS DENIED 0 $0 0 $0 APPLICATIONS WITHDRAWN 0 $0 0 $0 FILES CLOSED FOR INCOMPLETENESS 0 $0 0 $0
Aggregated Statistics For Year 2002(Based on 1 partial tract) A) Conventional B) Refinancings C) Non-occupant Loans on Number Average Value Number Average Value Number Average Value
LOANS ORIGINATED 11 $82,351 3 $115,637 1 $36,640 APPLICATIONS APPROVED, NOT ACCEPTED 0 $0 1 $64,980 0 $0 APPLICATIONS DENIED 0 $0 0 $0 0 $0 APPLICATIONS WITHDRAWN 1 $86,970 0 $0 0 $0 FILES CLOSED FOR INCOMPLETENESS 0 $0 0 $0 0 $0
Aggregated Statistics For Year 2001(Based on 1 partial tract) A) Conventional B) Refinancings C) Non-occupant Loans on Number Average Value Number Average Value Number Average Value
LOANS ORIGINATED 9 $81,813 6 $91,042 1 $31,270 APPLICATIONS APPROVED, NOT ACCEPTED 0 $0 0 $0 0 $0 APPLICATIONS DENIED 0 $0 0 $0 0 $0 APPLICATIONS WITHDRAWN 0 $0 0 $0 0 $0 FILES CLOSED FOR INCOMPLETENESS 0 $0 0 $0 0 $0
Aggregated Statistics For Year 2000(Based on 1 partial tract) A) Conventional B) Refinancings C) Non-occupant Loans on Number Average Value Number Average Value Number Average Value
LOANS ORIGINATED 6 $87,297 1 $67,920 1 $80,130 APPLICATIONS APPROVED, NOT ACCEPTED 1 $49,350 0 $0 0 $0 APPLICATIONS DENIED 0 $0 0 $0 0 $0 APPLICATIONS WITHDRAWN 0 $0 0 $0 0 $0 FILES CLOSED FOR INCOMPLETENESS 0 $0 0 $0 0 $0
Aggregated Statistics For Year 1999(Based on 1 partial tract) A) Conventional B) Refinancings Number Average Value Number Average Value
LOANS ORIGINATED 6 $87,697 1 $81,360 APPLICATIONS APPROVED, NOT ACCEPTED 0 $0 0 $0 APPLICATIONS DENIED 0 $0 0 $0 APPLICATIONS WITHDRAWN 0 $0 0 $0 FILES CLOSED FOR INCOMPLETENESS 0 $0 0 $0
Detailed PMIC statistics for the following Tracts:
0326.00
Fire-safe hotels and motels in Dade City, Florida:
L Motel Room House, 517 N 5TH St, Dade City, Florida 33525
Crowther Palms Motel, 505 S 7TH St, Dade City, Florida 33525
Hampton Inn Dade City/Zephyrhills, 13215 Us Hwy 301, Dade City, Florida 33525 Phone: (352) 567-5277, Fax: (352) 567-5776
All 3 fire-safe hotels and motels in Dade City, Florida
Most common first names in Dade City, FL among deceased individuals Name Count Lived (average)
John 344 74.2 years James 318 70.8 years William 318 74.1 years Robert 259 70.5 years Mary 250 77.9 years Charles 183 73.1 years George 172 73.9 years Joseph 156 74.1 years Dorothy 125 73.6 years Frank 121 75.3 years
Most common last names in Dade City, FL among deceased individuals Last name Count Lived (average)
Smith 157 74.3 years Johnson 99 74.6 years Williams 82 68.5 years Brown 72 72.4 years Miller 72 73.4 years Wilson 63 71.5 years Jones 60 77.0 years Davis 52 76.6 years Thomas 46 76.6 years Anderson 40 78.8 years
Dade City compared to Florida state average:
Median house value below state average. Unemployed percentage below state average. Black race population percentage above state average. Foreign-born population percentage below state average. Length of stay since moving in significantly above state average. Institutionalized population percentage above state average.
#41 on the list of "Top 101 cities with the most residents born in Other Caribbean (population 500+)"
#44 on the list of "Top 101 cities with the largest percentage of people in agriculture workers' dormitories on farms (population 1,000+)"
#12 on the list of "Top 101 counties with the largest decrease in the number of deaths per 1000 residents 2000-2006 to 2007-2013 (pop. 50,000+)"
#24 on the list of "Top 101 counties with the highest ground withdrawal of fresh water for public supply"
#72 on the list of "Top 101 counties with the highest number of deaths per 1000 residents 2007-2013 (pop. 50,000+)"
#82 on the list of "Top 101 counties with the highest total withdrawal of fresh water for public supply"
#91 on the list of "Top 101 counties with the lowest number of births per 1000 residents 2007-2013"
Top Patent Applicants
Lisa A. Caputo (10)
Jill Castellenti (4)
Karl Hayward (2)
Paul R. Gandolfi (2)
John Michael Cotter (2)
Robert Wayne Boucher (2)
David P. Teichman (2)
Jill Castillenti (1)
Mary Quinn (1)
John Bridenstine (1)
Total of 41 patent applications in 2008-2024.
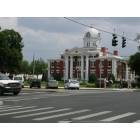
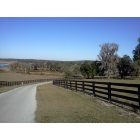


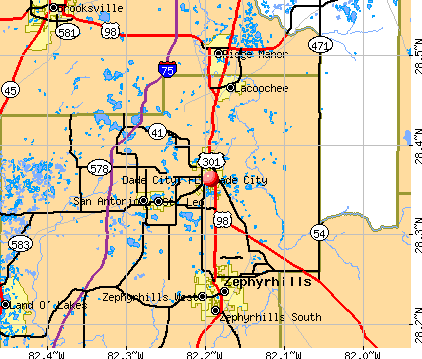


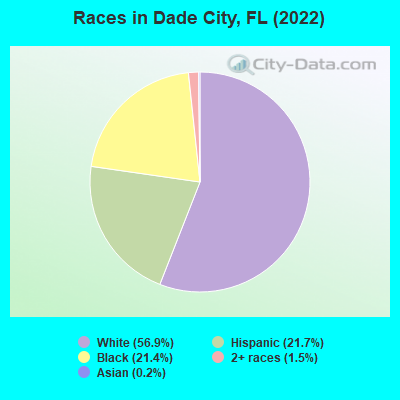
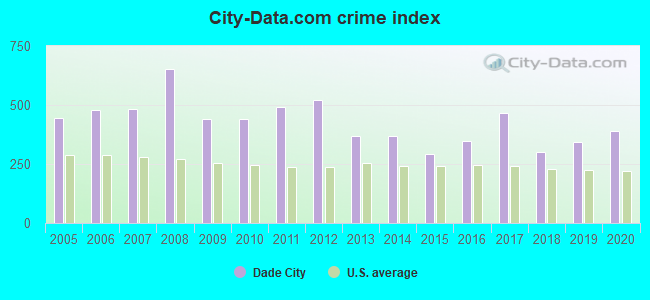
 Recent articles from our blog. Our writers, many of them Ph.D. graduates or candidates, create easy-to-read articles on a wide variety of topics.


 , pop. 52,899).
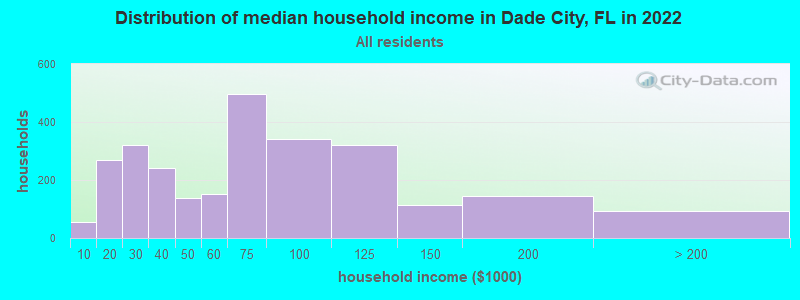
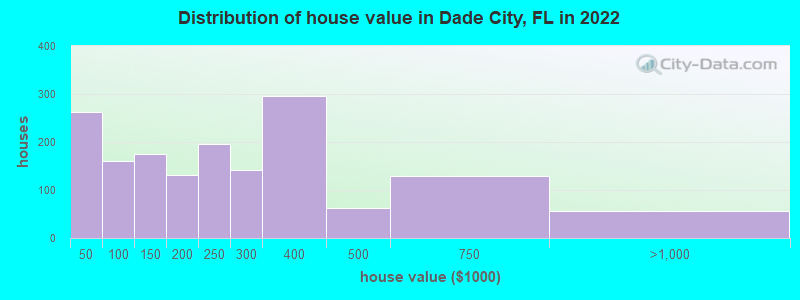

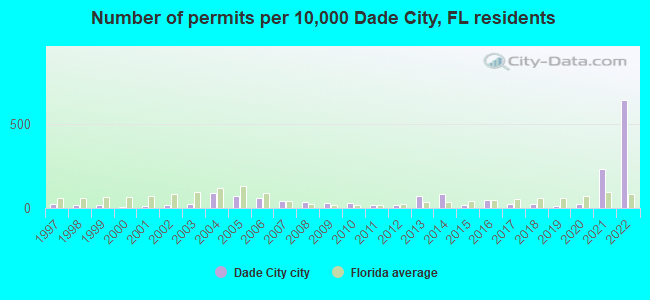
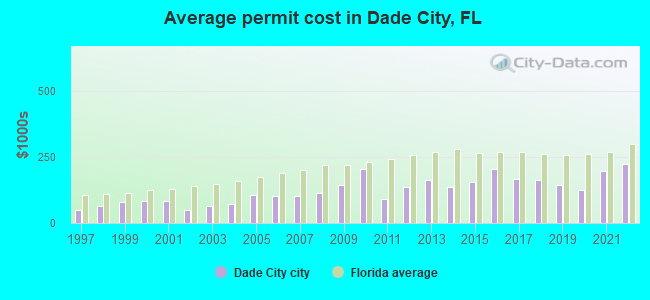
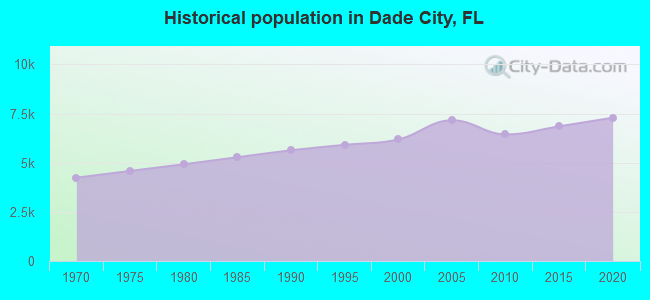
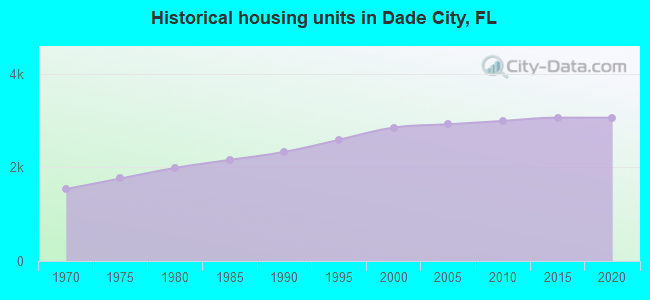
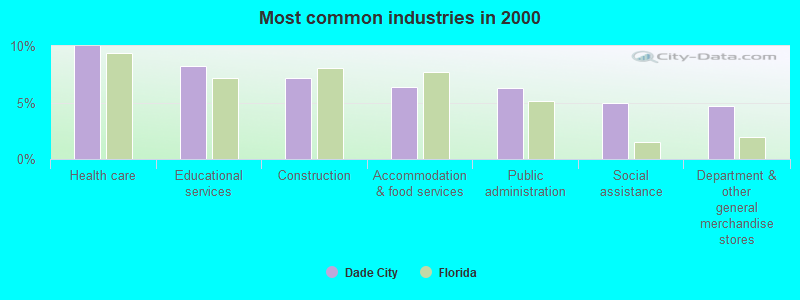
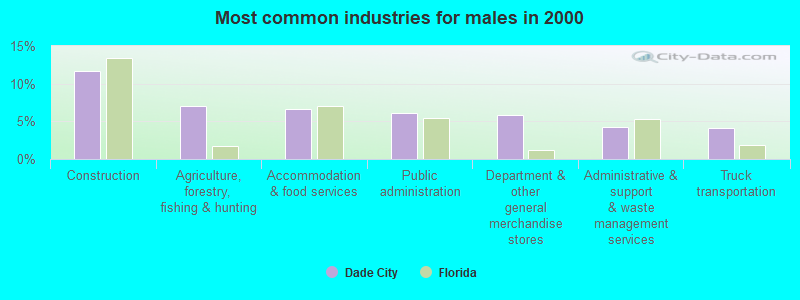
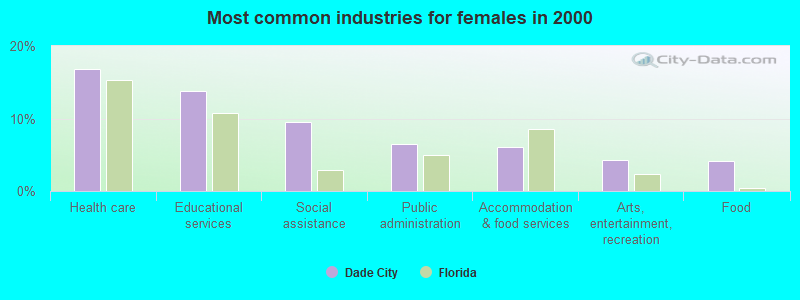
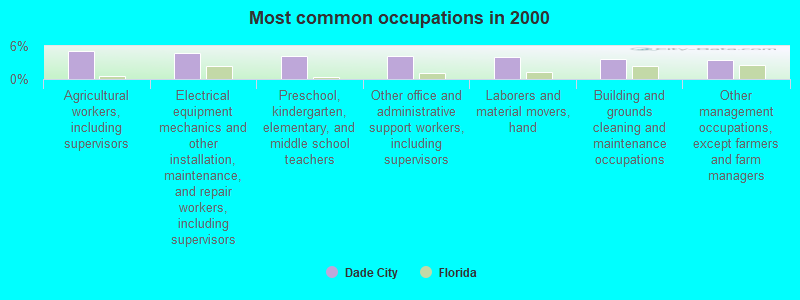
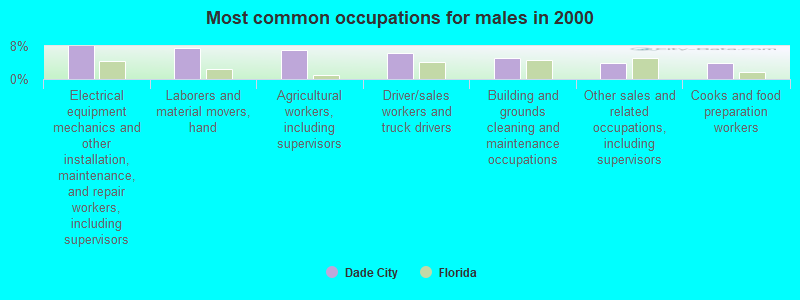
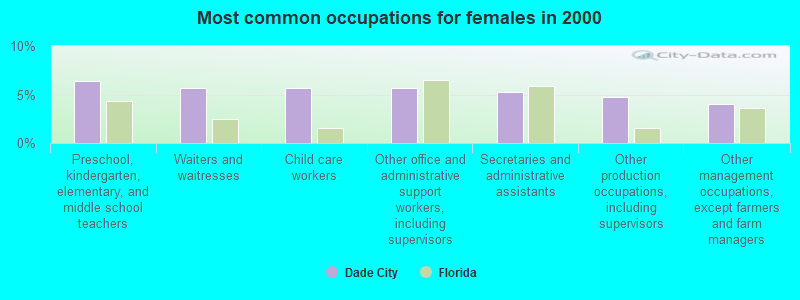


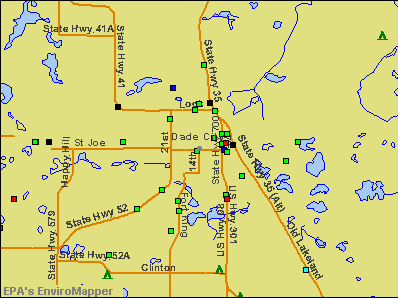

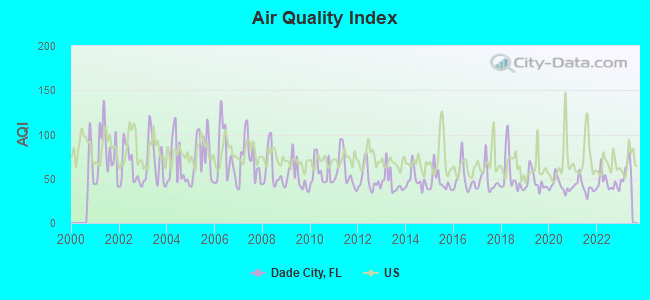
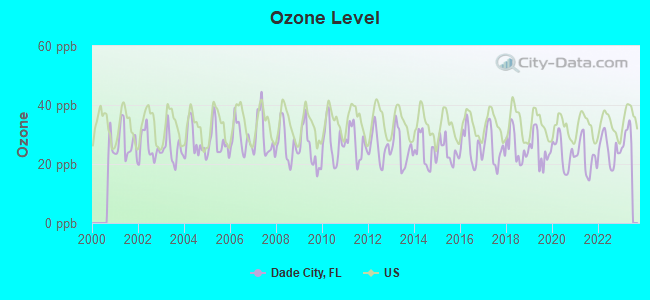
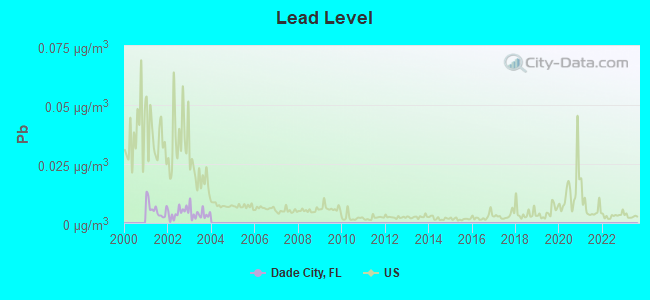

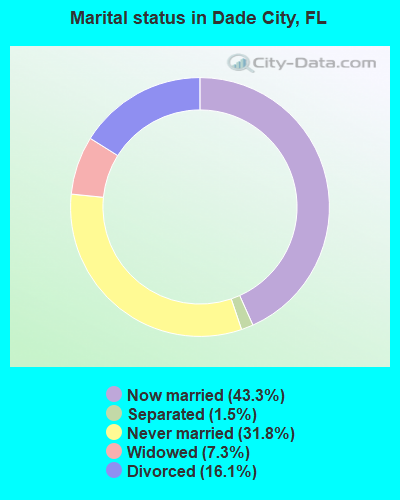
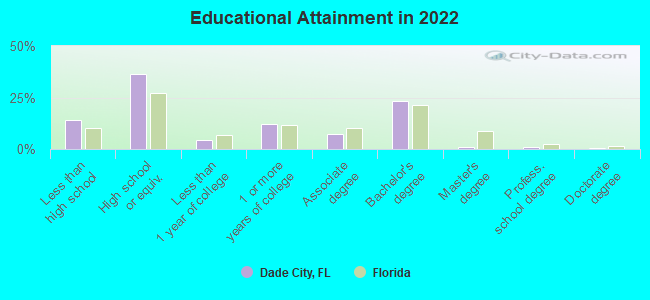
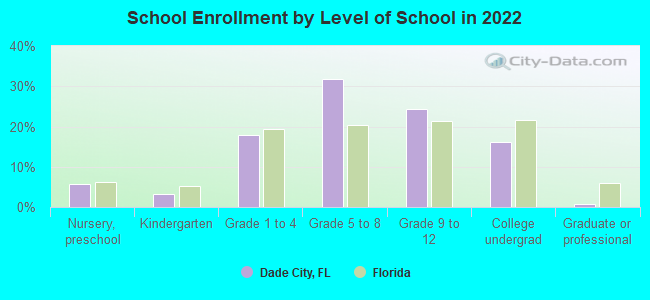
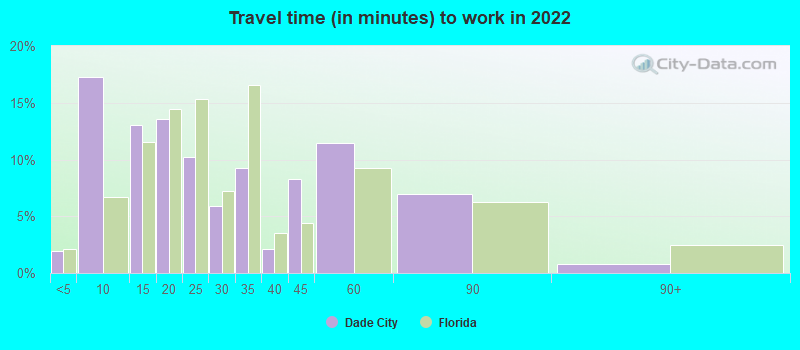
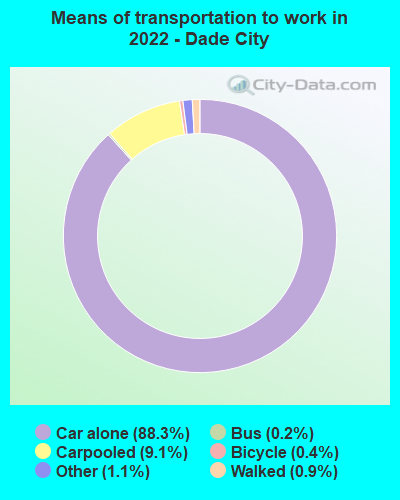
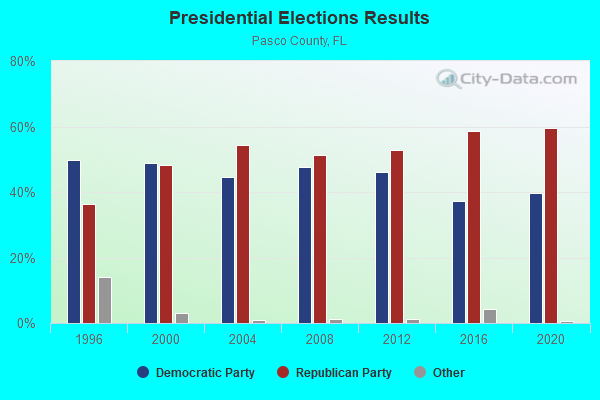
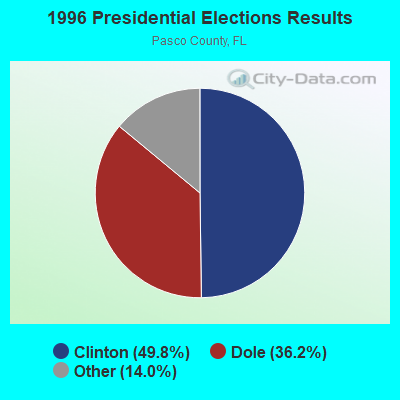
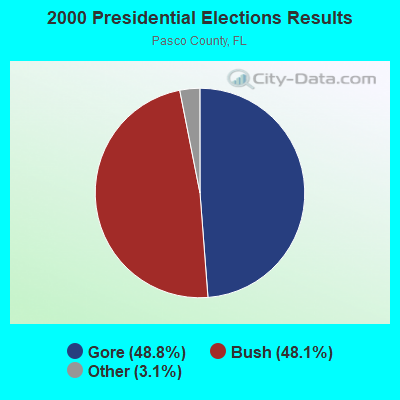
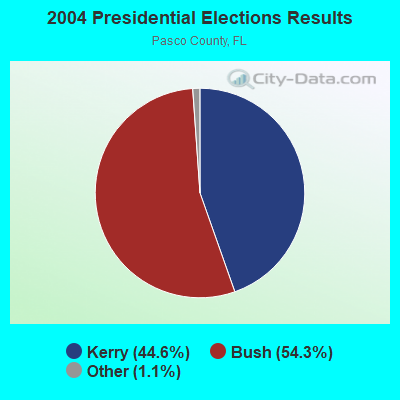
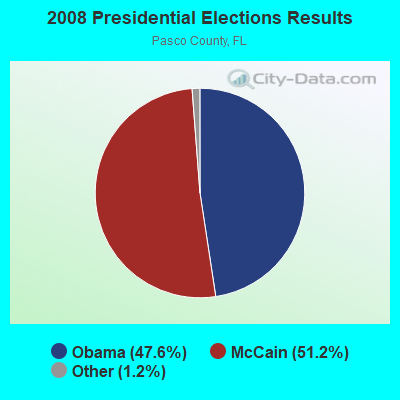
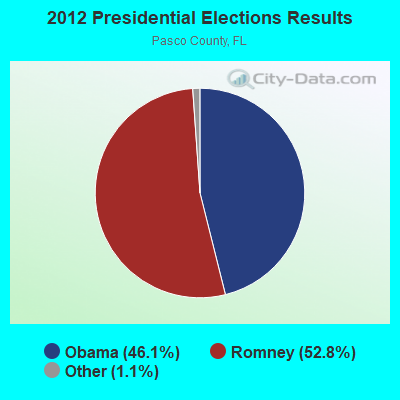
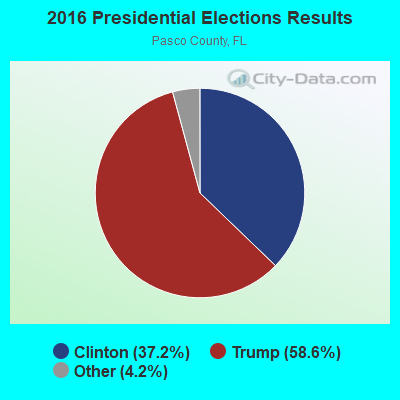
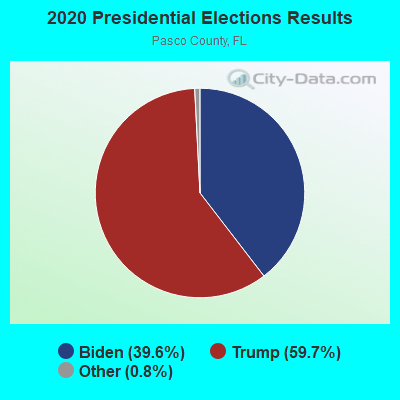
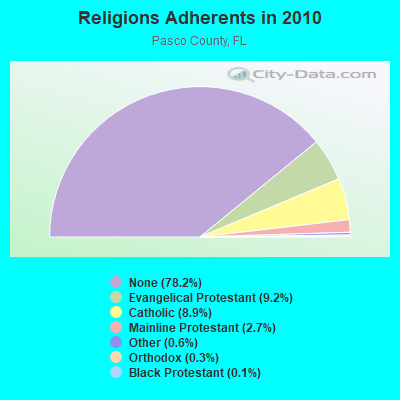
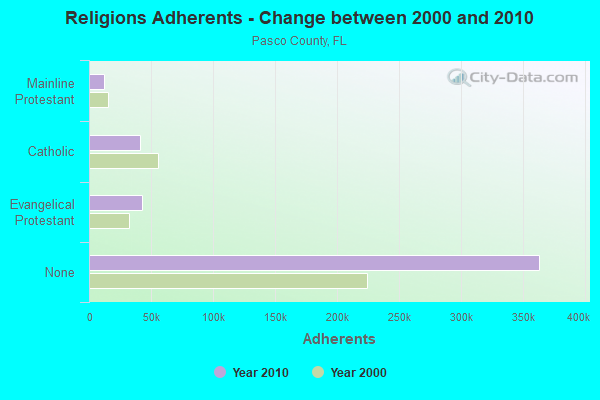
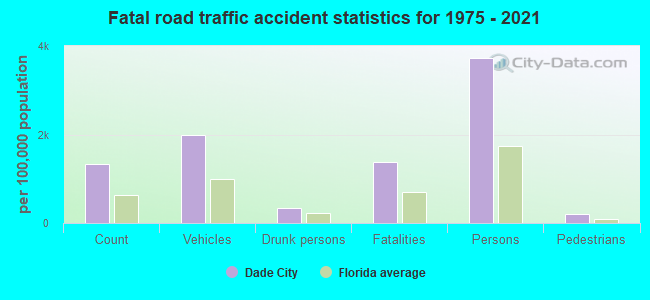
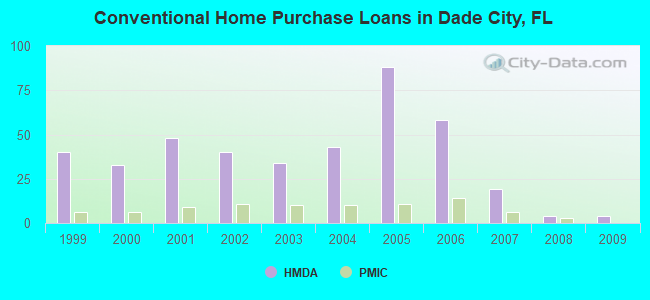
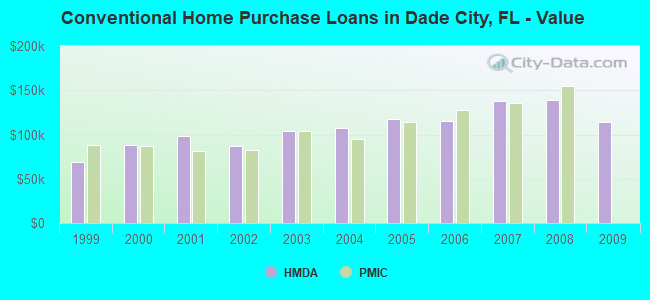
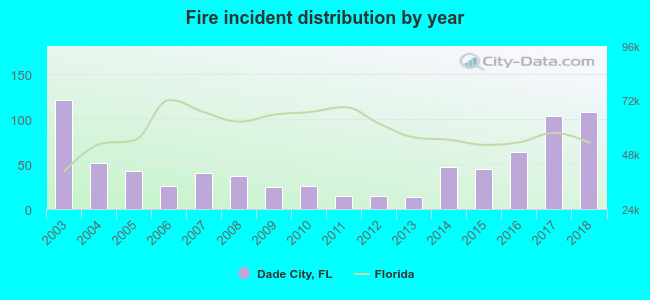 Based on the data from the years 2003 - 2018 the average number of fires per year is 49. The highest number of fires - 121 took place in 2003, and the least - 13 in 2013. The data has a decreasing trend.
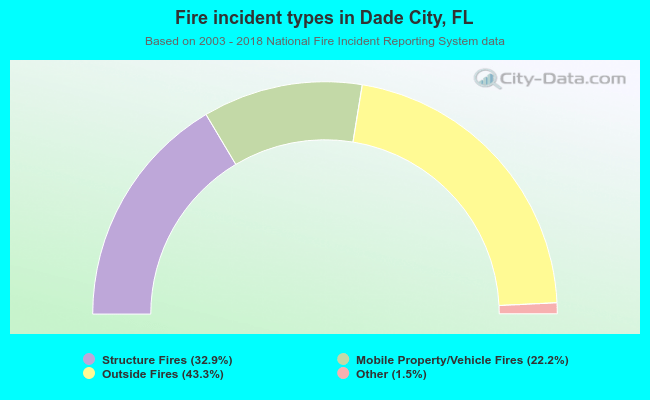 When looking into fire subcategories, the most reports belonged to: Outside Fires (43.3%), and Structure Fires (32.9%).