Dardenne Prairie, Missouri Submit your own pictures of this town and show them to the world
OSM Map
General Map
Google Map
MSN Map
OSM Map
General Map
Google Map
MSN Map
OSM Map
General Map
Google Map
MSN Map
OSM Map
General Map
Google Map
MSN Map
Please wait while loading the map...
Population in 2022: 13,564 (100% urban, 0% rural). Population change since 2000: +209.4%Males: 6,773 Females: 6,791
March 2022 cost of living index in Dardenne Prairie: 96.3 (near average, U.S. average is 100) Percentage of residents living in poverty in 2022: 1.6%for White Non-Hispanic residents , 4.8% for Black residents )Business Search - 14 Million verified businesses
Data:
Median household income ($)
Median household income (% change since 2000)
Household income diversity
Ratio of average income to average house value (%)
Ratio of average income to average rent
Median household income ($) - White
Median household income ($) - Black or African American
Median household income ($) - Asian
Median household income ($) - Hispanic or Latino
Median household income ($) - American Indian and Alaska Native
Median household income ($) - Multirace
Median household income ($) - Other Race
Median household income for houses/condos with a mortgage ($)
Median household income for apartments without a mortgage ($)
Races - White alone (%)
Races - White alone (% change since 2000)
Races - Black alone (%)
Races - Black alone (% change since 2000)
Races - American Indian alone (%)
Races - American Indian alone (% change since 2000)
Races - Asian alone (%)
Races - Asian alone (% change since 2000)
Races - Hispanic (%)
Races - Hispanic (% change since 2000)
Races - Native Hawaiian and Other Pacific Islander alone (%)
Races - Native Hawaiian and Other Pacific Islander alone (% change since 2000)
Races - Two or more races (%)
Races - Two or more races (% change since 2000)
Races - Other race alone (%)
Races - Other race alone (% change since 2000)
Racial diversity
Unemployment (%)
Unemployment (% change since 2000)
Unemployment (%) - White
Unemployment (%) - Black or African American
Unemployment (%) - Asian
Unemployment (%) - Hispanic or Latino
Unemployment (%) - American Indian and Alaska Native
Unemployment (%) - Multirace
Unemployment (%) - Other Race
Population density (people per square mile)
Population - Males (%)
Population - Females (%)
Population - Males (%) - White
Population - Males (%) - Black or African American
Population - Males (%) - Asian
Population - Males (%) - Hispanic or Latino
Population - Males (%) - American Indian and Alaska Native
Population - Males (%) - Multirace
Population - Males (%) - Other Race
Population - Females (%) - White
Population - Females (%) - Black or African American
Population - Females (%) - Asian
Population - Females (%) - Hispanic or Latino
Population - Females (%) - American Indian and Alaska Native
Population - Females (%) - Multirace
Population - Females (%) - Other Race
Coronavirus confirmed cases (Jun 15, 2024)
Deaths caused by coronavirus (Jun 15, 2024)
Coronavirus confirmed cases (per 100k population) (Jun 15, 2024)
Deaths caused by coronavirus (per 100k population) (Jun 15, 2024)
Daily increase in number of cases (Jun 15, 2024)
Weekly increase in number of cases (Jun 15, 2024)
Cases doubled (in days) (Jun 15, 2024)
Hospitalized patients (Apr 18, 2022)
Negative test results (Apr 18, 2022)
Total test results (Apr 18, 2022)
COVID Vaccine doses distributed (per 100k population) (Sep 19, 2023)
COVID Vaccine doses administered (per 100k population) (Sep 19, 2023)
COVID Vaccine doses distributed (Sep 19, 2023)
COVID Vaccine doses administered (Sep 19, 2023)
Likely homosexual households (%)
Likely homosexual households (% change since 2000)
Likely homosexual households - Lesbian couples (%)
Likely homosexual households - Lesbian couples (% change since 2000)
Likely homosexual households - Gay men (%)
Likely homosexual households - Gay men (% change since 2000)
Cost of living index
Median gross rent ($)
Median contract rent ($)
Median monthly housing costs ($)
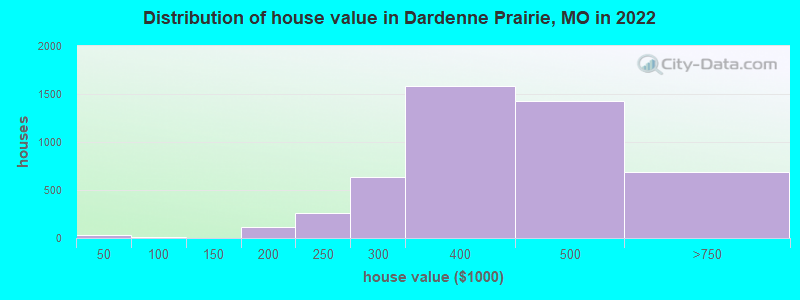
Median house or condo value ($)
Median house or condo value ($ change since 2000)
Mean house or condo value by units in structure - 1, detached ($)
Mean house or condo value by units in structure - 1, attached ($)
Mean house or condo value by units in structure - 2 ($)
Mean house or condo value by units in structure by units in structure - 3 or 4 ($)
Mean house or condo value by units in structure - 5 or more ($)
Mean house or condo value by units in structure - Boat, RV, van, etc. ($)
Mean house or condo value by units in structure - Mobile home ($)
Median house or condo value ($) - White
Median house or condo value ($) - Black or African American
Median house or condo value ($) - Asian
Median house or condo value ($) - Hispanic or Latino
Median house or condo value ($) - American Indian and Alaska Native
Median house or condo value ($) - Multirace
Median house or condo value ($) - Other Race
Median resident age
Resident age diversity
Median resident age - Males
Median resident age - Females
Median resident age - White
Median resident age - Black or African American
Median resident age - Asian
Median resident age - Hispanic or Latino
Median resident age - American Indian and Alaska Native
Median resident age - Multirace
Median resident age - Other Race
Median resident age - Males - White
Median resident age - Males - Black or African American
Median resident age - Males - Asian
Median resident age - Males - Hispanic or Latino
Median resident age - Males - American Indian and Alaska Native
Median resident age - Males - Multirace
Median resident age - Males - Other Race
Median resident age - Females - White
Median resident age - Females - Black or African American
Median resident age - Females - Asian
Median resident age - Females - Hispanic or Latino
Median resident age - Females - American Indian and Alaska Native
Median resident age - Females - Multirace
Median resident age - Females - Other Race
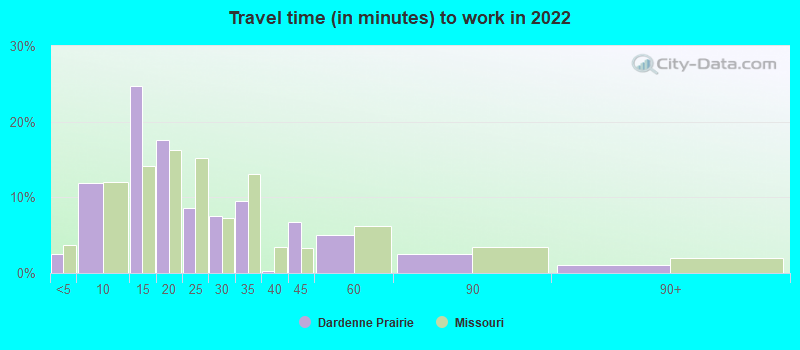
Commute - mean travel time to work (minutes)
Travel time to work - Less than 5 minutes (%)
Travel time to work - Less than 5 minutes (% change since 2000)
Travel time to work - 5 to 9 minutes (%)
Travel time to work - 5 to 9 minutes (% change since 2000)
Travel time to work - 10 to 19 minutes (%)
Travel time to work - 10 to 19 minutes (% change since 2000)
Travel time to work - 20 to 29 minutes (%)
Travel time to work - 20 to 29 minutes (% change since 2000)
Travel time to work - 30 to 39 minutes (%)
Travel time to work - 30 to 39 minutes (% change since 2000)
Travel time to work - 40 to 59 minutes (%)
Travel time to work - 40 to 59 minutes (% change since 2000)
Travel time to work - 60 to 89 minutes (%)
Travel time to work - 60 to 89 minutes (% change since 2000)
Travel time to work - 90 or more minutes (%)
Travel time to work - 90 or more minutes (% change since 2000)
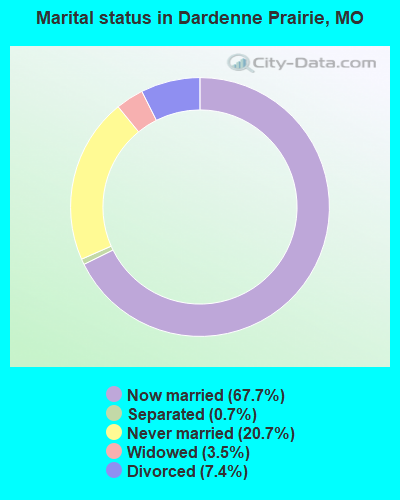
Marital status - Never married (%)
Marital status - Now married (%)
Marital status - Separated (%)
Marital status - Widowed (%)
Marital status - Divorced (%)
Median family income ($)
Median family income (% change since 2000)
Median non-family income ($)
Median non-family income (% change since 2000)
Median per capita income ($)
Median per capita income (% change since 2000)
Median family income ($) - White
Median family income ($) - Black or African American
Median family income ($) - Asian
Median family income ($) - Hispanic or Latino
Median family income ($) - American Indian and Alaska Native
Median family income ($) - Multirace
Median family income ($) - Other Race
Median year house/condo built
Median year apartment built
Year house built - Built 2005 or later (%)
Year house built - Built 2000 to 2004 (%)
Year house built - Built 1990 to 1999 (%)
Year house built - Built 1980 to 1989 (%)
Year house built - Built 1970 to 1979 (%)
Year house built - Built 1960 to 1969 (%)
Year house built - Built 1950 to 1959 (%)
Year house built - Built 1940 to 1949 (%)
Year house built - Built 1939 or earlier (%)
Average household size
Household density (households per square mile)
Average household size - White
Average household size - Black or African American
Average household size - Asian
Average household size - Hispanic or Latino
Average household size - American Indian and Alaska Native
Average household size - Multirace
Average household size - Other Race
Occupied housing units (%)
Vacant housing units (%)
Owner occupied housing units (%)
Renter occupied housing units (%)
Vacancy status - For rent (%)
Vacancy status - For sale only (%)
Vacancy status - Rented or sold, not occupied (%)
Vacancy status - For seasonal, recreational, or occasional use (%)
Vacancy status - For migrant workers (%)
Vacancy status - Other vacant (%)
Residents with income below the poverty level (%)
Residents with income below 50% of the poverty level (%)
Children below poverty level (%)
Poor families by family type - Married-couple family (%)
Poor families by family type - Male, no wife present (%)
Poor families by family type - Female, no husband present (%)
Poverty status for native-born residents (%)
Poverty status for foreign-born residents (%)
Poverty among high school graduates not in families (%)
Poverty among people who did not graduate high school not in families (%)
Residents with income below the poverty level (%) - White
Residents with income below the poverty level (%) - Black or African American
Residents with income below the poverty level (%) - Asian
Residents with income below the poverty level (%) - Hispanic or Latino
Residents with income below the poverty level (%) - American Indian and Alaska Native
Residents with income below the poverty level (%) - Multirace
Residents with income below the poverty level (%) - Other Race
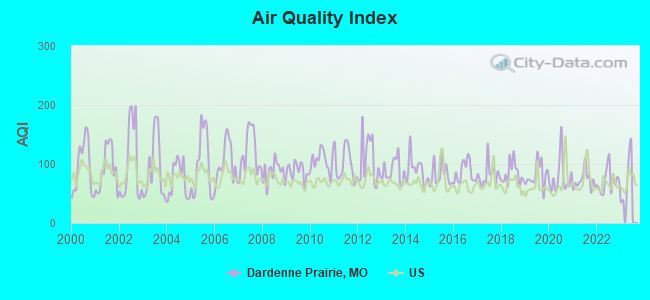
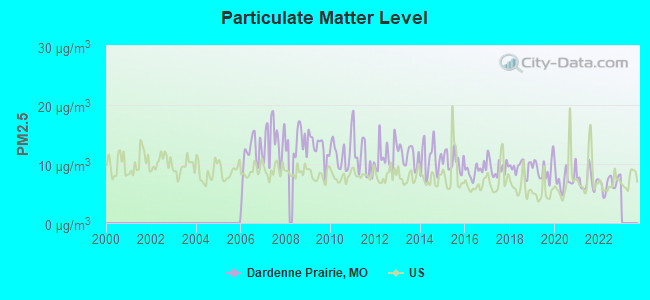
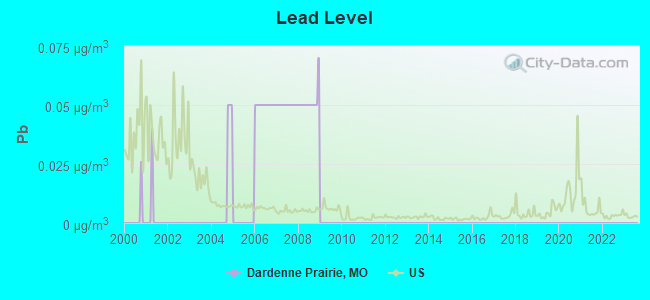
Air pollution - Air Quality Index (AQI)
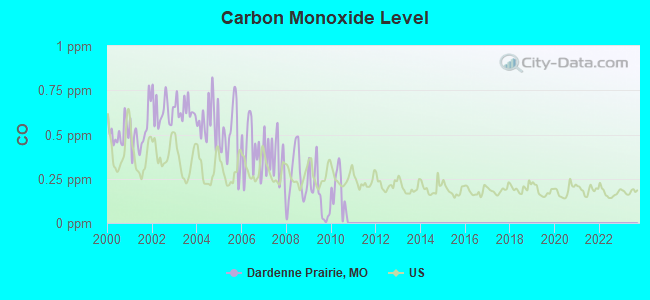
Air pollution - CO
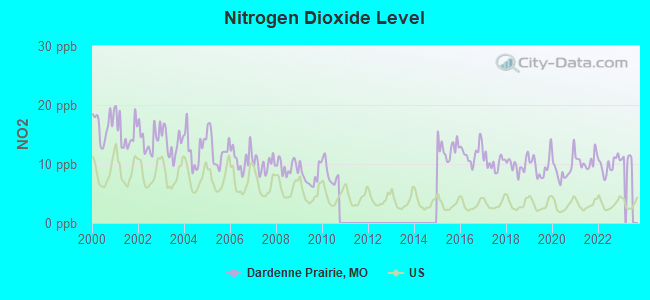
Air pollution - NO2
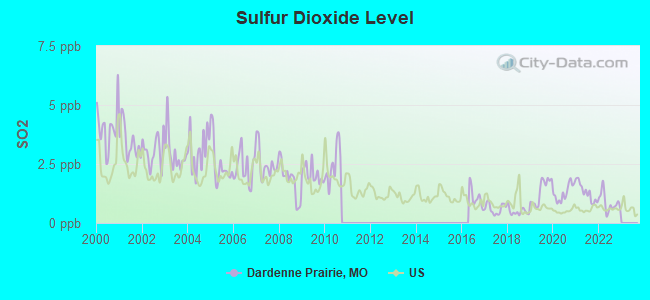
Air pollution - SO2
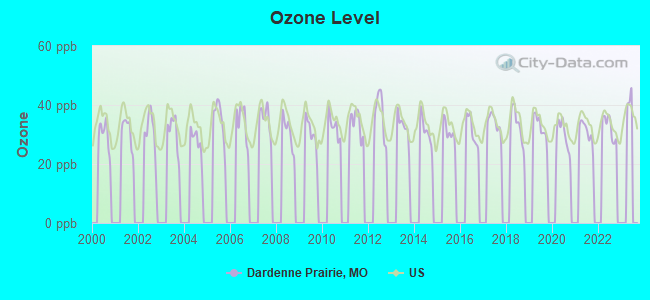
Air pollution - Ozone
Air pollution - PM10
Air pollution - PM25
Air pollution - Pb
Crime - Murders per 100,000 population
Crime - Rapes per 100,000 population
Crime - Robberies per 100,000 population
Crime - Assaults per 100,000 population
Crime - Burglaries per 100,000 population
Crime - Thefts per 100,000 population
Crime - Auto thefts per 100,000 population
Crime - Arson per 100,000 population
Crime - City-data.com crime index
Crime - Violent crime index
Crime - Property crime index
Crime - Murders per 100,000 population (5 year average)
Crime - Rapes per 100,000 population (5 year average)
Crime - Robberies per 100,000 population (5 year average)
Crime - Assaults per 100,000 population (5 year average)
Crime - Burglaries per 100,000 population (5 year average)
Crime - Thefts per 100,000 population (5 year average)
Crime - Auto thefts per 100,000 population (5 year average)
Crime - Arson per 100,000 population (5 year average)
Crime - City-data.com crime index (5 year average)
Crime - Violent crime index (5 year average)
Crime - Property crime index (5 year average)
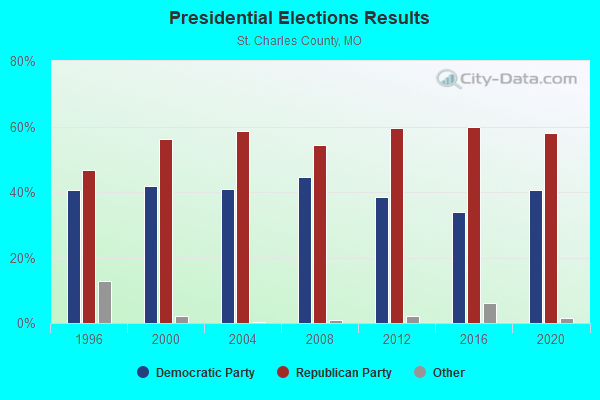
1996 Presidential Elections Results (%) - Democratic Party (Clinton)
1996 Presidential Elections Results (%) - Republican Party (Dole)
1996 Presidential Elections Results (%) - Other
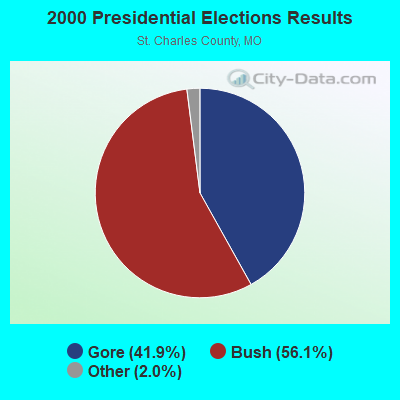
2000 Presidential Elections Results (%) - Democratic Party (Gore)
2000 Presidential Elections Results (%) - Republican Party (Bush)
2000 Presidential Elections Results (%) - Other
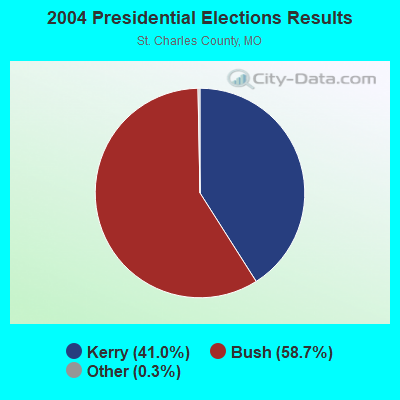
2004 Presidential Elections Results (%) - Democratic Party (Kerry)
2004 Presidential Elections Results (%) - Republican Party (Bush)
2004 Presidential Elections Results (%) - Other
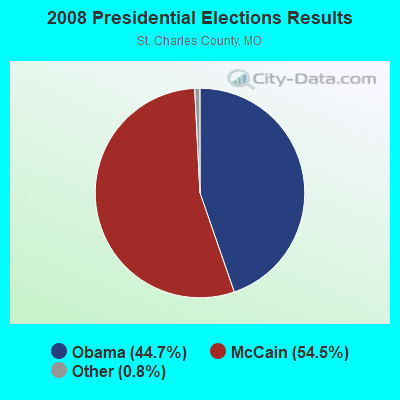
2008 Presidential Elections Results (%) - Democratic Party (Obama)
2008 Presidential Elections Results (%) - Republican Party (McCain)
2008 Presidential Elections Results (%) - Other
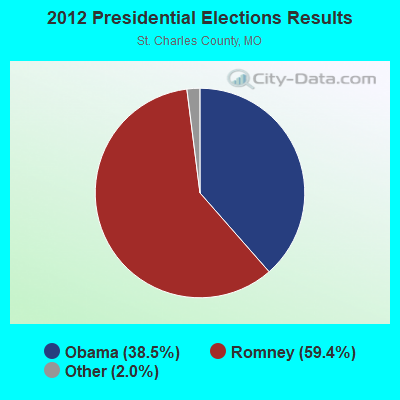
2012 Presidential Elections Results (%) - Democratic Party (Obama)
2012 Presidential Elections Results (%) - Republican Party (Romney)
2012 Presidential Elections Results (%) - Other
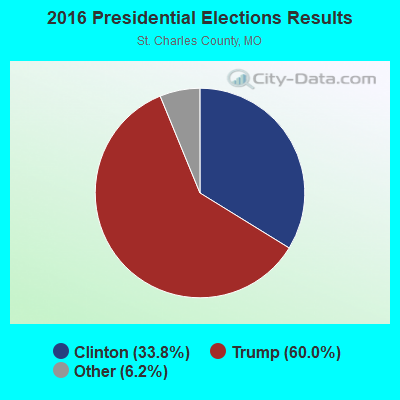
2016 Presidential Elections Results (%) - Democratic Party (Clinton)
2016 Presidential Elections Results (%) - Republican Party (Trump)
2016 Presidential Elections Results (%) - Other
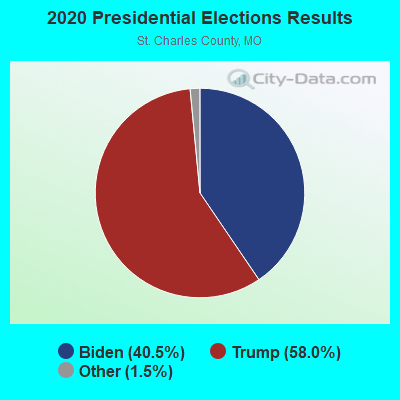
2020 Presidential Elections Results (%) - Democratic Party (Biden)
2020 Presidential Elections Results (%) - Republican Party (Trump)
2020 Presidential Elections Results (%) - Other
Ancestries Reported - Arab (%)
Ancestries Reported - Czech (%)
Ancestries Reported - Danish (%)
Ancestries Reported - Dutch (%)
Ancestries Reported - English (%)
Ancestries Reported - French (%)
Ancestries Reported - French Canadian (%)
Ancestries Reported - German (%)
Ancestries Reported - Greek (%)
Ancestries Reported - Hungarian (%)
Ancestries Reported - Irish (%)
Ancestries Reported - Italian (%)
Ancestries Reported - Lithuanian (%)
Ancestries Reported - Norwegian (%)
Ancestries Reported - Polish (%)
Ancestries Reported - Portuguese (%)
Ancestries Reported - Russian (%)
Ancestries Reported - Scotch-Irish (%)
Ancestries Reported - Scottish (%)
Ancestries Reported - Slovak (%)
Ancestries Reported - Subsaharan African (%)
Ancestries Reported - Swedish (%)
Ancestries Reported - Swiss (%)
Ancestries Reported - Ukrainian (%)
Ancestries Reported - United States (%)
Ancestries Reported - Welsh (%)
Ancestries Reported - West Indian (%)
Ancestries Reported - Other (%)
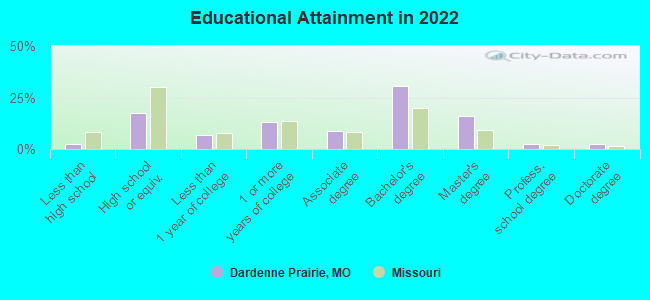
Educational Attainment - No schooling completed (%)
Educational Attainment - Less than high school (%)
Educational Attainment - High school or equivalent (%)
Educational Attainment - Less than 1 year of college (%)
Educational Attainment - 1 or more years of college (%)
Educational Attainment - Associate degree (%)
Educational Attainment - Bachelor's degree (%)
Educational Attainment - Master's degree (%)
Educational Attainment - Professional school degree (%)
Educational Attainment - Doctorate degree (%)
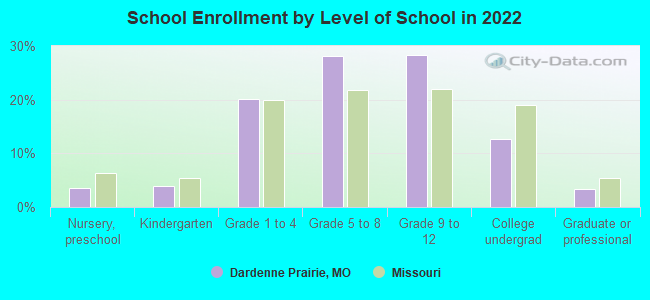
School Enrollment - Nursery, preschool (%)
School Enrollment - Kindergarten (%)
School Enrollment - Grade 1 to 4 (%)
School Enrollment - Grade 5 to 8 (%)
School Enrollment - Grade 9 to 12 (%)
School Enrollment - College undergrad (%)
School Enrollment - Graduate or professional (%)
School Enrollment - Not enrolled in school (%)
School enrollment - Public schools (%)
School enrollment - Private schools (%)
School enrollment - Not enrolled (%)
Median number of rooms in houses and condos
Median number of rooms in apartments
Housing units lacking complete plumbing facilities (%)
Housing units lacking complete kitchen facilities (%)
Density of houses
Urban houses (%)
Rural houses (%)
Households with people 60 years and over (%)
Households with people 65 years and over (%)
Households with people 75 years and over (%)
Households with one or more nonrelatives (%)
Households with no nonrelatives (%)
Population in households (%)
Family households (%)
Nonfamily households (%)
Population in families (%)
Family households with own children (%)
Median number of bedrooms in owner occupied houses
Mean number of bedrooms in owner occupied houses
Median number of bedrooms in renter occupied houses
Mean number of bedrooms in renter occupied houses
Median number of vehichles in owner occupied houses
Mean number of vehichles in owner occupied houses
Median number of vehichles in renter occupied houses
Mean number of vehichles in renter occupied houses
Mortgage status - with mortgage (%)
Mortgage status - with second mortgage (%)
Mortgage status - with home equity loan (%)
Mortgage status - with both second mortgage and home equity loan (%)
Mortgage status - without a mortgage (%)
Average family size
Average family size - White
Average family size - Black or African American
Average family size - Asian
Average family size - Hispanic or Latino
Average family size - American Indian and Alaska Native
Average family size - Multirace
Average family size - Other Race
Geographical mobility - Same house 1 year ago (%)
Geographical mobility - Moved within same county (%)
Geographical mobility - Moved from different county within same state (%)
Geographical mobility - Moved from different state (%)
Geographical mobility - Moved from abroad (%)
Place of birth - Born in state of residence (%)
Place of birth - Born in other state (%)
Place of birth - Native, outside of US (%)
Place of birth - Foreign born (%)
Housing units in structures - 1, detached (%)
Housing units in structures - 1, attached (%)
Housing units in structures - 2 (%)
Housing units in structures - 3 or 4 (%)
Housing units in structures - 5 to 9 (%)
Housing units in structures - 10 to 19 (%)
Housing units in structures - 20 to 49 (%)
Housing units in structures - 50 or more (%)
Housing units in structures - Mobile home (%)
Housing units in structures - Boat, RV, van, etc. (%)
House/condo owner moved in on average (years ago)
Renter moved in on average (years ago)
Year householder moved into unit - Moved in 1999 to March 2000 (%)
Year householder moved into unit - Moved in 1995 to 1998 (%)
Year householder moved into unit - Moved in 1990 to 1994 (%)
Year householder moved into unit - Moved in 1980 to 1989 (%)
Year householder moved into unit - Moved in 1970 to 1979 (%)
Year householder moved into unit - Moved in 1969 or earlier (%)
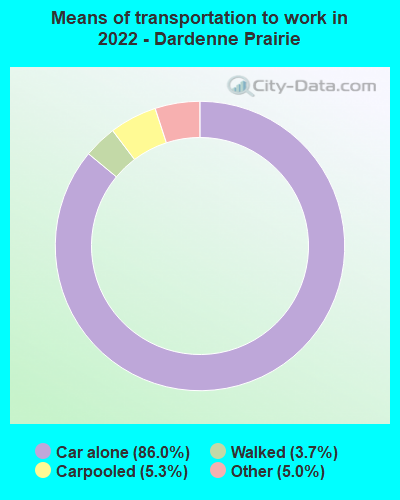
Means of transportation to work - Drove car alone (%)
Means of transportation to work - Carpooled (%)
Means of transportation to work - Public transportation (%)
Means of transportation to work - Bus or trolley bus (%)
Means of transportation to work - Streetcar or trolley car (%)
Means of transportation to work - Subway or elevated (%)
Means of transportation to work - Railroad (%)
Means of transportation to work - Ferryboat (%)
Means of transportation to work - Taxicab (%)
Means of transportation to work - Motorcycle (%)
Means of transportation to work - Bicycle (%)
Means of transportation to work - Walked (%)
Means of transportation to work - Other means (%)
Working at home (%)
Industry diversity
Most Common Industries - Agriculture, forestry, fishing and hunting, and mining (%)
Most Common Industries - Agriculture, forestry, fishing and hunting (%)
Most Common Industries - Mining, quarrying, and oil and gas extraction (%)
Most Common Industries - Construction (%)
Most Common Industries - Manufacturing (%)
Most Common Industries - Wholesale trade (%)
Most Common Industries - Retail trade (%)
Most Common Industries - Transportation and warehousing, and utilities (%)
Most Common Industries - Transportation and warehousing (%)
Most Common Industries - Utilities (%)
Most Common Industries - Information (%)
Most Common Industries - Finance and insurance, and real estate and rental and leasing (%)
Most Common Industries - Finance and insurance (%)
Most Common Industries - Real estate and rental and leasing (%)
Most Common Industries - Professional, scientific, and management, and administrative and waste management services (%)
Most Common Industries - Professional, scientific, and technical services (%)
Most Common Industries - Management of companies and enterprises (%)
Most Common Industries - Administrative and support and waste management services (%)
Most Common Industries - Educational services, and health care and social assistance (%)
Most Common Industries - Educational services (%)
Most Common Industries - Health care and social assistance (%)
Most Common Industries - Arts, entertainment, and recreation, and accommodation and food services (%)
Most Common Industries - Arts, entertainment, and recreation (%)
Most Common Industries - Accommodation and food services (%)
Most Common Industries - Other services, except public administration (%)
Most Common Industries - Public administration (%)
Occupation diversity
Most Common Occupations - Management, business, science, and arts occupations (%)
Most Common Occupations - Management, business, and financial occupations (%)
Most Common Occupations - Management occupations (%)
Most Common Occupations - Business and financial operations occupations (%)
Most Common Occupations - Computer, engineering, and science occupations (%)
Most Common Occupations - Computer and mathematical occupations (%)
Most Common Occupations - Architecture and engineering occupations (%)
Most Common Occupations - Life, physical, and social science occupations (%)
Most Common Occupations - Education, legal, community service, arts, and media occupations (%)
Most Common Occupations - Community and social service occupations (%)
Most Common Occupations - Legal occupations (%)
Most Common Occupations - Education, training, and library occupations (%)
Most Common Occupations - Arts, design, entertainment, sports, and media occupations (%)
Most Common Occupations - Healthcare practitioners and technical occupations (%)
Most Common Occupations - Health diagnosing and treating practitioners and other technical occupations (%)
Most Common Occupations - Health technologists and technicians (%)
Most Common Occupations - Service occupations (%)
Most Common Occupations - Healthcare support occupations (%)
Most Common Occupations - Protective service occupations (%)
Most Common Occupations - Fire fighting and prevention, and other protective service workers including supervisors (%)
Most Common Occupations - Law enforcement workers including supervisors (%)
Most Common Occupations - Food preparation and serving related occupations (%)
Most Common Occupations - Building and grounds cleaning and maintenance occupations (%)
Most Common Occupations - Personal care and service occupations (%)
Most Common Occupations - Sales and office occupations (%)
Most Common Occupations - Sales and related occupations (%)
Most Common Occupations - Office and administrative support occupations (%)
Most Common Occupations - Natural resources, construction, and maintenance occupations (%)
Most Common Occupations - Farming, fishing, and forestry occupations (%)
Most Common Occupations - Construction and extraction occupations (%)
Most Common Occupations - Installation, maintenance, and repair occupations (%)
Most Common Occupations - Production, transportation, and material moving occupations (%)
Most Common Occupations - Production occupations (%)
Most Common Occupations - Transportation occupations (%)
Most Common Occupations - Material moving occupations (%)
People in Group quarters - Institutionalized population (%)
People in Group quarters - Correctional institutions (%)
People in Group quarters - Federal prisons and detention centers (%)
People in Group quarters - Halfway houses (%)
People in Group quarters - Local jails and other confinement facilities (including police lockups) (%)
People in Group quarters - Military disciplinary barracks (%)
People in Group quarters - State prisons (%)
People in Group quarters - Other types of correctional institutions (%)
People in Group quarters - Nursing homes (%)
People in Group quarters - Hospitals/wards, hospices, and schools for the handicapped (%)
People in Group quarters - Hospitals/wards and hospices for chronically ill (%)
People in Group quarters - Hospices or homes for chronically ill (%)
People in Group quarters - Military hospitals or wards for chronically ill (%)
People in Group quarters - Other hospitals or wards for chronically ill (%)
People in Group quarters - Hospitals or wards for drug/alcohol abuse (%)
People in Group quarters - Mental (Psychiatric) hospitals or wards (%)
People in Group quarters - Schools, hospitals, or wards for the mentally retarded (%)
People in Group quarters - Schools, hospitals, or wards for the physically handicapped (%)
People in Group quarters - Institutions for the deaf (%)
People in Group quarters - Institutions for the blind (%)
People in Group quarters - Orthopedic wards and institutions for the physically handicapped (%)
People in Group quarters - Wards in general hospitals for patients who have no usual home elsewhere (%)
People in Group quarters - Wards in military hospitals for patients who have no usual home elsewhere (%)
People in Group quarters - Juvenile institutions (%)
People in Group quarters - Long-term care (%)
People in Group quarters - Homes for abused, dependent, and neglected children (%)
People in Group quarters - Residential treatment centers for emotionally disturbed children (%)
People in Group quarters - Training schools for juvenile delinquents (%)
People in Group quarters - Short-term care, detention or diagnostic centers for delinquent children (%)
People in Group quarters - Type of juvenile institution unknown (%)
People in Group quarters - Noninstitutionalized population (%)
People in Group quarters - College dormitories (includes college quarters off campus) (%)
People in Group quarters - Military quarters (%)
People in Group quarters - On base (%)
People in Group quarters - Barracks, unaccompanied personnel housing (UPH), (Enlisted/Officer), ;and similar group living quarters for military personnel (%)
People in Group quarters - Transient quarters for temporary residents (%)
People in Group quarters - Military ships (%)
People in Group quarters - Group homes (%)
People in Group quarters - Homes or halfway houses for drug/alcohol abuse (%)
People in Group quarters - Homes for the mentally ill (%)
People in Group quarters - Homes for the mentally retarded (%)
People in Group quarters - Homes for the physically handicapped (%)
People in Group quarters - Other group homes (%)
People in Group quarters - Religious group quarters (%)
People in Group quarters - Dormitories (%)
People in Group quarters - Agriculture workers' dormitories on farms (%)
People in Group quarters - Job Corps and vocational training facilities (%)
People in Group quarters - Other workers' dormitories (%)
People in Group quarters - Crews of maritime vessels (%)
People in Group quarters - Other nonhousehold living situations (%)
People in Group quarters - Other noninstitutional group quarters (%)
Residents speaking English at home (%)
Residents speaking English at home - Born in the United States (%)
Residents speaking English at home - Native, born elsewhere (%)
Residents speaking English at home - Foreign born (%)
Residents speaking Spanish at home (%)
Residents speaking Spanish at home - Born in the United States (%)
Residents speaking Spanish at home - Native, born elsewhere (%)
Residents speaking Spanish at home - Foreign born (%)
Residents speaking other language at home (%)
Residents speaking other language at home - Born in the United States (%)
Residents speaking other language at home - Native, born elsewhere (%)
Residents speaking other language at home - Foreign born (%)
Class of Workers - Employee of private company (%)
Class of Workers - Self-employed in own incorporated business (%)
Class of Workers - Private not-for-profit wage and salary workers (%)
Class of Workers - Local government workers (%)
Class of Workers - State government workers (%)
Class of Workers - Federal government workers (%)
Class of Workers - Self-employed workers in own not incorporated business and Unpaid family workers (%)
House heating fuel used in houses and condos - Utility gas (%)
House heating fuel used in houses and condos - Bottled, tank, or LP gas (%)
House heating fuel used in houses and condos - Electricity (%)
House heating fuel used in houses and condos - Fuel oil, kerosene, etc. (%)
House heating fuel used in houses and condos - Coal or coke (%)
House heating fuel used in houses and condos - Wood (%)
House heating fuel used in houses and condos - Solar energy (%)
House heating fuel used in houses and condos - Other fuel (%)
House heating fuel used in houses and condos - No fuel used (%)
House heating fuel used in apartments - Utility gas (%)
House heating fuel used in apartments - Bottled, tank, or LP gas (%)
House heating fuel used in apartments - Electricity (%)
House heating fuel used in apartments - Fuel oil, kerosene, etc. (%)
House heating fuel used in apartments - Coal or coke (%)
House heating fuel used in apartments - Wood (%)
House heating fuel used in apartments - Solar energy (%)
House heating fuel used in apartments - Other fuel (%)
House heating fuel used in apartments - No fuel used (%)
Armed forces status - In Armed Forces (%)
Armed forces status - Civilian (%)
Armed forces status - Civilian - Veteran (%)
Armed forces status - Civilian - Nonveteran (%)
Fatal accidents locations in years 2005-2021
Fatal accidents locations in 2005
Fatal accidents locations in 2006
Fatal accidents locations in 2007
Fatal accidents locations in 2008
Fatal accidents locations in 2009
Fatal accidents locations in 2010
Fatal accidents locations in 2011
Fatal accidents locations in 2012
Fatal accidents locations in 2013
Fatal accidents locations in 2014
Fatal accidents locations in 2015
Fatal accidents locations in 2016
Fatal accidents locations in 2017
Fatal accidents locations in 2018
Fatal accidents locations in 2019
Fatal accidents locations in 2020
Fatal accidents locations in 2021
Alcohol use - People drinking some alcohol every month (%)
Alcohol use - People not drinking at all (%)
Alcohol use - Average days/month drinking alcohol
Alcohol use - Average drinks/week
Alcohol use - Average days/year people drink much
Audiometry - Average condition of hearing (%)
Audiometry - People that can hear a whisper from across a quiet room (%)
Audiometry - People that can hear normal voice from across a quiet room (%)
Audiometry - Ears ringing, roaring, buzzing (%)
Audiometry - Had a job exposure to loud noise (%)
Audiometry - Had off-work exposure to loud noise (%)
Blood Pressure & Cholesterol - Has high blood pressure (%)
Blood Pressure & Cholesterol - Checking blood pressure at home (%)
Blood Pressure & Cholesterol - Frequently checking blood cholesterol (%)
Blood Pressure & Cholesterol - Has high cholesterol level (%)
Consumer Behavior - Money monthly spent on food at supermarket/grocery store
Consumer Behavior - Money monthly spent on food at other stores
Consumer Behavior - Money monthly spent on eating out
Consumer Behavior - Money monthly spent on carryout/delivered foods
Consumer Behavior - Income spent on food at supermarket/grocery store (%)
Consumer Behavior - Income spent on food at other stores (%)
Consumer Behavior - Income spent on eating out (%)
Consumer Behavior - Income spent on carryout/delivered foods (%)
Current Health Status - General health condition (%)
Current Health Status - Blood donors (%)
Current Health Status - Has blood ever tested for HIV virus (%)
Current Health Status - Left-handed people (%)
Dermatology - People using sunscreen (%)
Diabetes - Diabetics (%)
Diabetes - Had a blood test for high blood sugar (%)
Diabetes - People taking insulin (%)
Diet Behavior & Nutrition - Diet health (%)
Diet Behavior & Nutrition - Milk product consumption (# of products/month)
Diet Behavior & Nutrition - Meals not home prepared (#/week)
Diet Behavior & Nutrition - Meals from fast food or pizza place (#/week)
Diet Behavior & Nutrition - Ready-to-eat foods (#/month)
Diet Behavior & Nutrition - Frozen meals/pizza (#/month)
Drug Use - People that ever used marijuana or hashish (%)
Drug Use - Ever used hard drugs (%)
Drug Use - Ever used any form of cocaine (%)
Drug Use - Ever used heroin (%)
Drug Use - Ever used methamphetamine (%)
Health Insurance - People covered by health insurance (%)
Kidney Conditions-Urology - Avg. # of times urinating at night
Medical Conditions - People with asthma (%)
Medical Conditions - People with anemia (%)
Medical Conditions - People with psoriasis (%)
Medical Conditions - People with overweight (%)
Medical Conditions - Elderly people having difficulties in thinking or remembering (%)
Medical Conditions - People who ever received blood transfusion (%)
Medical Conditions - People having trouble seeing even with glass/contacts (%)
Medical Conditions - People with arthritis (%)
Medical Conditions - People with gout (%)
Medical Conditions - People with congestive heart failure (%)
Medical Conditions - People with coronary heart disease (%)
Medical Conditions - People with angina pectoris (%)
Medical Conditions - People who ever had heart attack (%)
Medical Conditions - People who ever had stroke (%)
Medical Conditions - People with emphysema (%)
Medical Conditions - People with thyroid problem (%)
Medical Conditions - People with chronic bronchitis (%)
Medical Conditions - People with any liver condition (%)
Medical Conditions - People who ever had cancer or malignancy (%)
Mental Health - People who have little interest in doing things (%)
Mental Health - People feeling down, depressed, or hopeless (%)
Mental Health - People who have trouble sleeping or sleeping too much (%)
Mental Health - People feeling tired or having little energy (%)
Mental Health - People with poor appetite or overeating (%)
Mental Health - People feeling bad about themself (%)
Mental Health - People who have trouble concentrating on things (%)
Mental Health - People moving or speaking slowly or too fast (%)
Mental Health - People having thoughts they would be better off dead (%)
Oral Health - Average years since last visit a dentist
Oral Health - People embarrassed because of mouth (%)
Oral Health - People with gum disease (%)
Oral Health - General health of teeth and gums (%)
Oral Health - Average days a week using dental floss/device
Oral Health - Average days a week using mouthwash for dental problem
Oral Health - Average number of teeth
Pesticide Use - Households using pesticides to control insects (%)
Pesticide Use - Households using pesticides to kill weeds (%)
Physical Activity - People doing vigorous-intensity work activities (%)
Physical Activity - People doing moderate-intensity work activities (%)
Physical Activity - People walking or bicycling (%)
Physical Activity - People doing vigorous-intensity recreational activities (%)
Physical Activity - People doing moderate-intensity recreational activities (%)
Physical Activity - Average hours a day doing sedentary activities
Physical Activity - Average hours a day watching TV or videos
Physical Activity - Average hours a day using computer
Physical Functioning - People having limitations keeping them from working (%)
Physical Functioning - People limited in amount of work they can do (%)
Physical Functioning - People that need special equipment to walk (%)
Physical Functioning - People experiencing confusion/memory problems (%)
Physical Functioning - People requiring special healthcare equipment (%)
Prescription Medications - Average number of prescription medicines taking
Preventive Aspirin Use - Adults 40+ taking low-dose aspirin (%)
Reproductive Health - Vaginal deliveries (%)
Reproductive Health - Cesarean deliveries (%)
Reproductive Health - Deliveries resulted in a live birth (%)
Reproductive Health - Pregnancies resulted in a delivery (%)
Reproductive Health - Women breastfeeding newborns (%)
Reproductive Health - Women that had a hysterectomy (%)
Reproductive Health - Women that had both ovaries removed (%)
Reproductive Health - Women that have ever taken birth control pills (%)
Reproductive Health - Women taking birth control pills (%)
Reproductive Health - Women that have ever used Depo-Provera or injectables (%)
Reproductive Health - Women that have ever used female hormones (%)
Sexual Behavior - People 18+ that ever had sex (vaginal, anal, or oral) (%)
Sexual Behavior - Males 18+ that ever had vaginal sex with a woman (%)
Sexual Behavior - Males 18+ that ever performed oral sex on a woman (%)
Sexual Behavior - Males 18+ that ever had anal sex with a woman (%)
Sexual Behavior - Males 18+ that ever had any sex with a man (%)
Sexual Behavior - Females 18+ that ever had vaginal sex with a man (%)
Sexual Behavior - Females 18+ that ever performed oral sex on a man (%)
Sexual Behavior - Females 18+ that ever had anal sex with a man (%)
Sexual Behavior - Females 18+ that ever had any kind of sex with a woman (%)
Sexual Behavior - Average age people first had sex
Sexual Behavior - Average number of female sex partners in lifetime (males 18+)
Sexual Behavior - Average number of female vaginal sex partners in lifetime (males 18+)
Sexual Behavior - Average age people first performed oral sex on a woman (18+)
Sexual Behavior - Average number of woman performed oral sex on in lifetime (18+)
Sexual Behavior - Average number of male sex partners in lifetime (males 18+)
Sexual Behavior - Average number of male anal sex partners in lifetime (males 18+)
Sexual Behavior - Average age people first performed oral sex on a man (18+)
Sexual Behavior - Average number of male oral sex partners in lifetime (18+)
Sexual Behavior - People using protection when performing oral sex (%)
Sexual Behavior - Average number of times people have vaginal or anal sex a year
Sexual Behavior - People having sex without condom (%)
Sexual Behavior - Average number of male sex partners in lifetime (females 18+)
Sexual Behavior - Average number of male vaginal sex partners in lifetime (females 18+)
Sexual Behavior - Average number of female sex partners in lifetime (females 18+)
Sexual Behavior - Circumcised males 18+ (%)
Sleep Disorders - Average hours sleeping at night
Sleep Disorders - People that has trouble sleeping (%)
Smoking-Cigarette Use - People smoking cigarettes (%)
Taste & Smell - People 40+ having problems with smell (%)
Taste & Smell - People 40+ having problems with taste (%)
Taste & Smell - People 40+ that ever had wisdom teeth removed (%)
Taste & Smell - People 40+ that ever had tonsils teeth removed (%)
Taste & Smell - People 40+ that ever had a loss of consciousness because of a head injury (%)
Taste & Smell - People 40+ that ever had a broken nose or other serious injury to face or skull (%)
Taste & Smell - People 40+ that ever had two or more sinus infections (%)
Weight - Average height (inches)
Weight - Average weight (pounds)
Weight - Average BMI
Weight - People that are obese (%)
Weight - People that ever were obese (%)
Weight - People trying to lose weight (%)
Latest news from Dardenne Prairie, MO collected exclusively by city-data.com from local newspapers, TV, and radio stations
Ancestries: German (30.6%), English (10.2%), American (9.5%), Irish (6.3%), Italian (3.9%), European (3.7%).
Current Local Time:
Land area: 4.37 square miles.
Population density: 3,107 people per square mile (average).
467 residents are foreign born (1.9% Asia , 0.7% Latin America , 0.5% Europe ).
This town:
3.6%Missouri:
4.2%
Median real estate property taxes paid for housing units with mortgages in 2022: $4,267 (1.0%)Median real estate property taxes paid for housing units with no mortgage in 2022: $3,889 (1.1%)
Nearest city with pop. 50,000+: St. Peters, MO
Nearest city with pop. 200,000+: St. Louis, MO
Nearest city with pop. 1,000,000+: Chicago, IL
Nearest cities:
Weldon Spring Heights, MO (2.0 miles),
Latitude: 38.75 N, Longitude: 90.73 W
Single-family new house construction building permits:
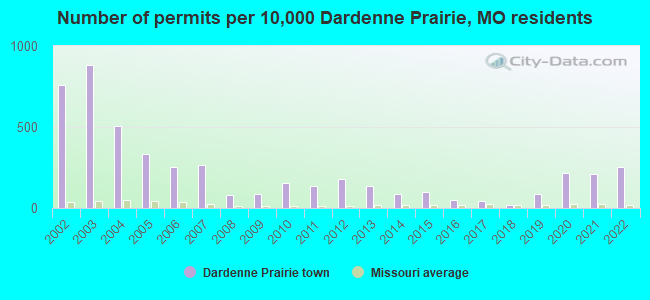
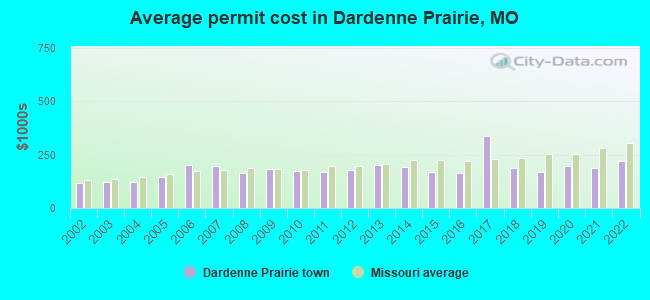
2022: 112 buildings , average cost: $219,0002021: 91 buildings , average cost: $186,3002020: 96 buildings , average cost: $194,7002019: 38 buildings , average cost: $169,1002018: 9 buildings , average cost: $188,8002017: 19 buildings , average cost: $337,6002016: 22 buildings , average cost: $166,4002015: 43 buildings , average cost: $169,5002014: 39 buildings , average cost: $193,4002013: 60 buildings , average cost: $200,4002012: 80 buildings , average cost: $177,8002011: 60 buildings , average cost: $167,9002010: 68 buildings , average cost: $170,9002009: 37 buildings , average cost: $182,3002008: 36 buildings , average cost: $162,8002007: 116 buildings , average cost: $196,6002006: 111 buildings , average cost: $202,0002005: 146 buildings , average cost: $144,1002004: 223 buildings , average cost: $121,5002003: 386 buildings , average cost: $123,7002002: 333 buildings , average cost: $114,500Unemployment in December 2023: Population change in the 1990s: +3,717 (+557.3%).
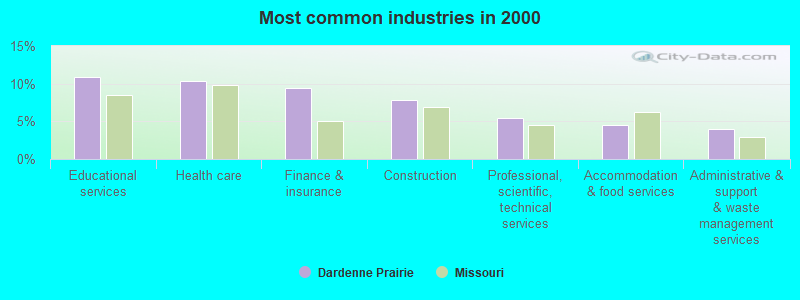
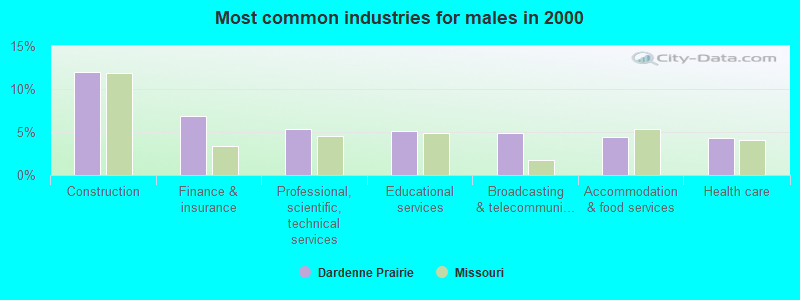
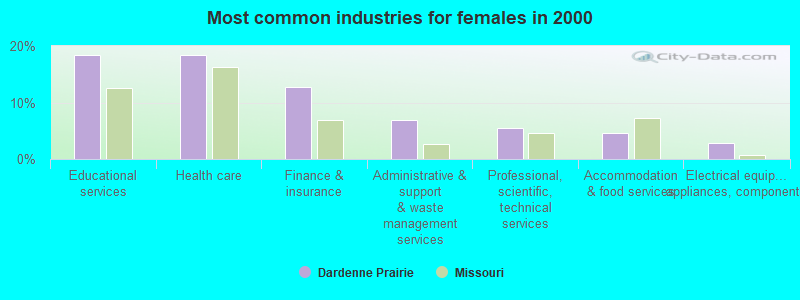
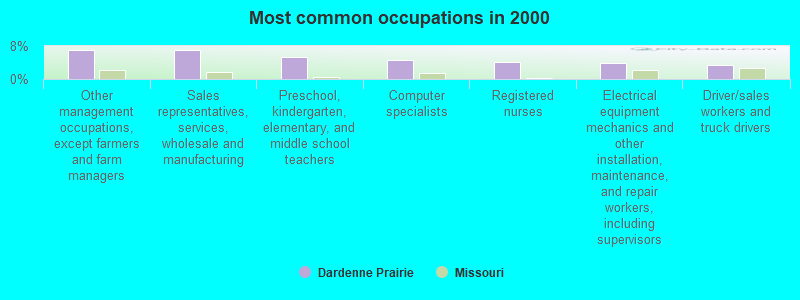
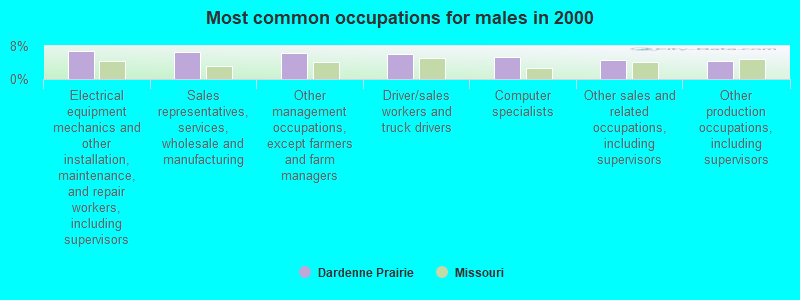
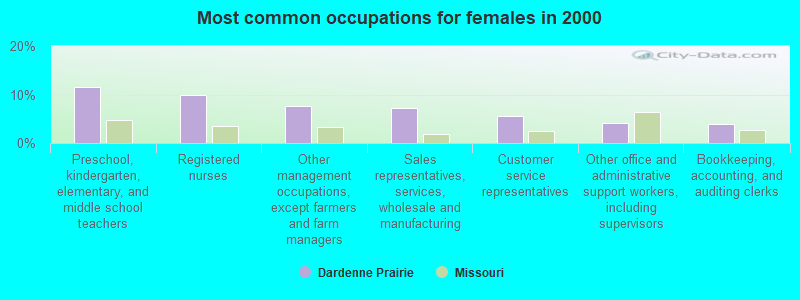
Most common occupations in Dardenne Prairie, MO (%)
Both Males Females
Other management occupations, except farmers and farm managers (7.0%)
Sales representatives, services, wholesale and manufacturing (6.9%)
Preschool, kindergarten, elementary, and middle school teachers (5.3%)
Computer specialists (4.5%)
Registered nurses (4.2%)
Electrical equipment mechanics and other installation, maintenance, and repair workers, including supervisors (3.9%)
Driver/sales workers and truck drivers (3.4%)
Electrical equipment mechanics and other installation, maintenance, and repair workers, including supervisors (6.8%)
Sales representatives, services, wholesale and manufacturing (6.7%)
Other management occupations, except farmers and farm managers (6.4%)
Driver/sales workers and truck drivers (6.0%)
Computer specialists (5.4%)
Other sales and related occupations, including supervisors (4.7%)
Other production occupations, including supervisors (4.5%)
Preschool, kindergarten, elementary, and middle school teachers (11.6%)
Registered nurses (9.8%)
Other management occupations, except farmers and farm managers (7.7%)
Sales representatives, services, wholesale and manufacturing (7.3%)
Customer service representatives (5.6%)
Other office and administrative support workers, including supervisors (4.1%)
Bookkeeping, accounting, and auditing clerks (3.8%)
Tornado activity:
Dardenne Prairie-area historical tornado activity is near Missouri state average. It is 60% greater than the overall U.S. average.
On 1/24/1967, a category F4 (max. wind speeds 207-260 mph) tornado 11.0 miles away from the Dardenne Prairie town center killed 3 people and injured 216 people and caused between $5,000,000 and $50,000,000 in damages.
On 2/10/1959, a category F4 tornado 17.0 miles away from the town center killed 21 people and injured 345 people and caused between $5,000,000 and $50,000,000 in damages.
Earthquake activity:
Dardenne Prairie-area historical earthquake activity is significantly above Missouri state average. It is 328% greater than the overall U.S. average. On 4/18/2008 at 09:36:59, a magnitude 5.4 (5.1 MB, 4.8 MS, 5.4 MW, 5.2 MW, Class: Moderate, Intensity: VI - VII) earthquake occurred 155.2 miles away from the city center On 4/18/2008 at 09:36:59, a magnitude 5.2 (5.2 MW, Depth: 8.9 mi) earthquake occurred 155.2 miles away from the city center On 9/26/1990 at 13:18:51, a magnitude 5.0 (4.7 MB, 4.8 LG, 5.0 LG, Depth: 7.7 mi) earthquake occurred 127.7 miles away from the city center On 6/10/1987 at 23:48:54, a magnitude 5.1 (4.9 MB, 4.4 MS, 4.6 MS, 5.1 LG) earthquake occurred 153.5 miles away from Dardenne Prairie center On 5/4/1991 at 01:18:54, a magnitude 5.0 (4.4 MB, 4.6 LG, 5.0 LG, Depth: 3.1 mi) earthquake occurred 159.4 miles away from the city center On 6/18/2002 at 17:37:15, a magnitude 5.0 (4.3 MB, 4.6 MW, 5.0 LG) earthquake occurred 168.6 miles away from Dardenne Prairie center Magnitude types: regional Lg-wave magnitude (LG), body-wave magnitude (MB), surface-wave magnitude (MS), moment magnitude (MW) Natural disasters: The number of natural disasters in St. Charles County (4) is a lot smaller than the US average (15).Major Disasters (Presidential) Declared: 1Emergencies Declared: 1Floods: 3, Storms: 3, Tornadoes: 3, Winds: 2, Other: 1 (Note: some incidents may be assigned to more than one category). Hospitals and medical centers near Dardenne Prairie: GARDEN VIEW CARE CENTER-O'FALLON (Nursing Home, about 4 miles away; O FALLON, MO)
SSM HOSPICE (Hospital, about 5 miles away; LAKE SAINT LOUIS, MO)
VILLA THERESA HAVEN (Nursing Home, about 5 miles away; O FALLON, MO)
LAKE ST LOUIS AT HOME (Dialysis Facility, about 5 miles away; LAKE SAINT LOUIS, MO)
LAKE ST LOUIS DIALYSIS (Dialysis Facility, about 5 miles away; LAKE SAINT LOUIS, MO)
LUTHERAN SENIOR SERVICES AT BREEZE PARK (Nursing Home, about 5 miles away; SAINT CHARLES, MO)
SAINT CHARLES COUNTY DIALYSIS (Dialysis Facility, about 7 miles away; SAINT PETERS, MO)
Colleges/universities with over 2000 students nearest to Dardenne Prairie:
St Charles Community College (about 5 miles; Cottleville, MO ; Full-time enrollment: 5,302)
Lindenwood University (about 13 miles; Saint Charles, MO ; FT enrollment: 11,117)
Maryville University of Saint Louis (about 15 miles; Saint Louis, MO ; FT enrollment: 3,651)
Missouri Baptist University (about 17 miles; Saint Louis, MO ; FT enrollment: 2,898)
University of Missouri-St Louis (about 23 miles; Saint Louis, MO ; FT enrollment: 10,322)
Webster University (about 24 miles; Saint Louis, MO ; FT enrollment: 12,406)
Washington University in St Louis (about 24 miles; Saint Louis, MO ; FT enrollment: 10,823)
Public elementary/middle school in Dardenne Prairie:
Private elementary/middle school in Dardenne Prairie: IMMACULATE CONCEPTION SCHOOL Students: 804, Location: 2089 HANLEY RD, Grades: KG-8)
See full list of schools located in Dardenne Prairie User-submitted facts and corrections:
ZIP was changed last summer from 63366 to 63368
St. Charles County has a predicted average indoor radon screening level between 2 and 4 pCi/L (pico curies per liter) - Moderate Potential Average household size: This town:
3.1 peopleMissouri:
2.5 people
Percentage of family households: This town:
87.4%Whole state:
65.3%
Percentage of households with unmarried partners: This town:
2.6%Whole state:
6.7%
Likely homosexual households (counted as self-reported same-sex unmarried-partner households)
Lesbian couples: 0.3% of all households Gay men: 0.2% of all households
22 people in other noninstitutional group quarters in 2000people in religious group quarters in 2000
Banks with branches in Dardenne Prairie (2011 data):
First Bank: Dardenne Crossing at 7833 Highway N, branch established on 2007/05/09. Info updated 2007/12/04: Bank assets: $6,579.8 mil, Deposits: $5,800.6 mil, headquarters in Creve Coeur, MO, negative income in the last year , Commercial Lending Specialization, 148 total offices , Holding Company: First Banks, Inc.
For population 15 years and over in Dardenne Prairie:
Never married: 20.7%Now married: 67.7%Separated: 0.7%Widowed: 3.5%Divorced: 7.4% For population 25 years and over in Dardenne Prairie:
High school or higher: 97.9%Bachelor's degree or higher: 52.9%Graduate or professional degree: 21.0%Unemployed: 2.3%Mean travel time to work (commute): 21.8 minutes
Education Gini index (Inequality in education) Here:
9.6Missouri average:
11.1
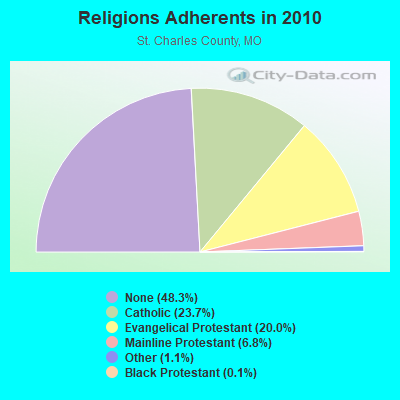
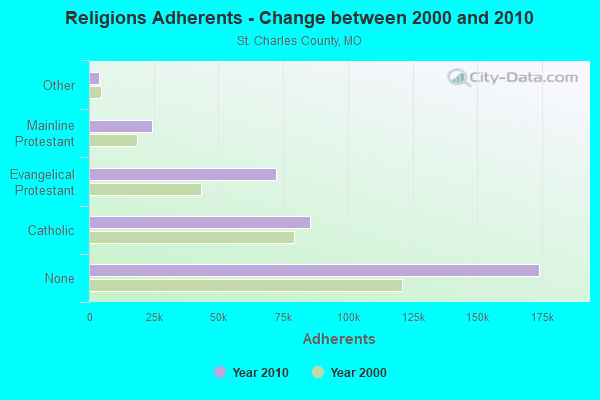
Religion statistics for Dardenne Prairie, MO (based on St. Charles County data)
Religion Adherents Congregations Catholic 85,536 20 Evangelical Protestant 72,210 141 Mainline Protestant 24,412 38 Other 3,929 22 Black Protestant 406 3 None 173,992 -
Source: Clifford Grammich, Kirk Hadaway, Richard Houseal, Dale E.Jones, Alexei Krindatch, Richie Stanley and Richard H.Taylor. 2012. 2010 U.S.Religion Census: Religious Congregations & Membership Study. Association of Statisticians of American Religious Bodies. Jones, Dale E., et al. 2002. Congregations and Membership in the United States 2000. Nashville, TN: Glenmary Research Center. Graphs represent county-level data
Food Environment Statistics: Number of grocery stores : 35St. Charles County :
1.02 / 10,000 pop.State :
1.88 / 10,000 pop.
Number of supercenters and club stores : 2This county :
0.06 / 10,000 pop.Missouri :
0.18 / 10,000 pop.
Number of convenience stores (no gas) : 10St. Charles County :
0.29 / 10,000 pop.Missouri :
0.60 / 10,000 pop.
Number of convenience stores (with gas) : 103This county :
3.00 / 10,000 pop.State :
4.34 / 10,000 pop.
Number of full-service restaurants : 241St. Charles County :
7.02 / 10,000 pop.Missouri :
7.37 / 10,000 pop.
Adult diabetes rate : St. Charles County :
8.0%Missouri :
8.8%
Adult obesity rate : This county :
28.0%Missouri :
29.6%
Low-income preschool obesity rate : This county :
15.1%Missouri :
13.5%
Health and Nutrition: Healthy diet rate : Dardenne Prairie:
61.7%State:
50.9%
Average overall health of teeth and gums : Dardenne Prairie:
64.9%Missouri:
48.6%
Average BMI : Dardenne Prairie:
27.1Missouri:
28.7
People feeling badly about themselves : People not drinking alcohol at all : Dardenne Prairie:
5.6%Missouri:
10.1%
Average hours sleeping at night : Overweight people : This city:
30.9%Missouri:
34.3%
General health condition : Dardenne Prairie:
68.7%State:
57.5%
Average condition of hearing : Dardenne Prairie:
85.2%Missouri:
79.3%
More about Health and Nutrition of Dardenne Prairie, MO Residents
Local government employment and payroll (March 2022)
Function
Full-time employees
Monthly full-time payroll
Average yearly full-time wage
Part-time employees
Monthly part-time payroll
Other Government Administration
11 $30,356 $33,116 0 $0 Parks and Recreation
1 $4,705 $56,460 0 $0 Judicial and Legal
1 $3,662 $43,944 0 $0 Streets and Highways
1 $3,383 $40,596 0 $0
Totals for Government
14 $42,107 $36,092 0 $0
Dardenne Prairie government finances - Expenditure in 2017 (per resident):
Construction - Regular Highways: $486,000 ($35.83)
Current Operations - General - Other: $759,000 ($55.96)
Central Staff Services: $726,000 ($53.52)Regular Highways: $376,000 ($27.72)Police Protection: $313,000 ($23.08)General Public Buildings: $158,000 ($11.65)Parks and Recreation: $133,000 ($9.81)Judicial and Legal Services: $42,000 ($3.10)Sewerage: $10,000 ($0.74)Protective Inspection and Regulation - Other: $9,000 ($0.66)General - Interest on Debt: $162,000 ($11.94)
Total Salaries and Wages: $475,000 ($35.02)
Dardenne Prairie government finances - Revenue in 2017 (per resident):
Charges - Parks and Recreation: $120,000 ($8.85)
Local Intergovernmental - Highways: $261,000 ($19.24)
Miscellaneous - Fines and Forfeits: $202,000 ($14.89)
General Revenue - Other: $148,000 ($10.91)Special Assessments: $117,000 ($8.63)Rents: $58,000 ($4.28)Interest Earnings: $7,000 ($0.52)State Intergovernmental - Highways: $455,000 ($33.54)
Tax - General Sales and Gross Receipts: $1,714,000 ($126.36)
Property: $279,000 ($20.57)Public Utilities Sales: $121,000 ($8.92)Alcoholic Beverage License: $6,000 ($0.44)Occupation and Business License - Other: $5,000 ($0.37)
Dardenne Prairie government finances - Debt in 2017 (per resident):
Long Term Debt - Beginning Outstanding - Unspecified Public Purpose: $4,042,000 ($297.99)
Outstanding Unspecified Public Purpose: $3,832,000 ($282.51)Retired Unspecified Public Purpose: $3,369,000 ($248.38)Issue, Unspecified Public Purpose: $3,159,000 ($232.90)
Dardenne Prairie government finances - Cash and Securities in 2017 (per resident):
Other Funds - Cash and Securities: $4,477,000 ($330.06)
Sinking Funds - Cash and Securities: $364,000 ($26.84)
6.75% of this county's 2021 resident taxpayers lived in other counties in 2020 ($68,404 average adjusted gross income )
Here:
6.75%Missouri average:
7.67%
0.01% of residents moved from foreign countries ($105 average AGI )St. Charles County:
0.01%Missouri average:
0.02%
Top counties from which taxpayers relocated into this county between 2020 and 2021:
6.01% of this county's 2020 resident taxpayers moved to other counties in 2021 ($73,859 average adjusted gross income )
Here:
6.01%Missouri average:
7.51%
0.01% of residents moved to foreign countries ($135 average AGI )St. Charles County:
0.01%Missouri average:
0.01%
Top counties to which taxpayers relocated from this county between 2020 and 2021:
Businesses in Dardenne Prairie, MO
Name Count Name Count
JCPenney 1 Sprint Nextel 1 Payless 1 Target 1 Qdoba Mexican Grill 1 Vans 1 Red Robin 1
Strongest AM radio stations in Dardenne Prairie:
KXEN (1010 AM; 50 kW; FESTUS-ST. LOUIS, MO; Owner: BDJ RADIO ENTERPRISES, LLC)
KMOX (1120 AM; 50 kW; ST. LOUIS, MO; Owner: INFINITY BROADCASTING OPERATIONS, INC.)
KIRL (1460 AM; 5 kW; ST. CHARLES, MO; Owner: BRONCO BROADCASTING CO., INC.)
KFUO (850 AM; 5 kW; CLAYTON, MO; Owner: LUTHERAN CHURCH-MISSOURI SYNOD)
KTRS (550 AM; 5 kW; ST. LOUIS, MO; Owner: KTRS-AM LICENSE, L.L.C.)
WSDZ (1260 AM; 20 kW; BELLEVILLE, IL)
KSIV (1320 AM; 5 kW; CLAYTON, MO; Owner: BOTT COMMUNICATIONS, INC.)
KJSL (630 AM; 5 kW; ST. LOUIS, MO; Owner: WMUZ RADIO, INC.)
KRFT (1190 AM; 10 kW; DE SOTO, MO; Owner: ALL SPORTS RADIO, LLC)
KSLG (1380 AM; 5 kW; ST. LOUIS, MO; Owner: NEW HORIZON 7TH-DAY CHRISTIAN CHURCH, INC.)
WRTH (1430 AM; 5 kW; ST. LOUIS, MO)
KATZ (1600 AM; 5 kW; ST. LOUIS, MO; Owner: CITICASTERS LICENSES, L.P.)
KWRE (730 AM; 1 kW; WARRENTON, MO; Owner: KASPAR BROADCASTING CO. OF MISSOURI)
Strongest FM radio stations in Dardenne Prairie:
KFTK (97.1 FM; FLORISSANT, MO; Owner: EMMIS RADIO LICENSE CORPORATION)
KEZK-FM (102.5 FM; ST. LOUIS, MO; Owner: INFINITY RADIO SUBSIDIARY OPERATIONS INC.)
KIHT (96.3 FM; ST. LOUIS, MO; Owner: EMMIS RADIO LICENSE CORPORATION)
KSLQ-FM (104.5 FM; WASHINGTON, MO; Owner: Y2K, INC.)
KSD (93.7 FM; ST. LOUIS, MO; Owner: CITICASTERS LICENSES, L.P.)
KSLZ (107.7 FM; ST. LOUIS, MO; Owner: CITICASTERS LICENSES, L.P.)
KFUO-FM (99.1 FM; CLAYTON, MO; Owner: THE LUTHERAN CHURCH-MISSOURI SYNOD)
KYKY (98.1 FM; ST. LOUIS, MO; Owner: INFINITY RADIO SUBSIDIARY OPERATIONS INC.)
WSSM (106.5 FM; GRANITE CITY, IL; Owner: BONNEVILLE HOLDING COMPANY)
KWMU (90.7 FM; ST. LOUIS, MO; Owner: THE CURATORS OF THE UNIVERSITY OF MISSOURI)
KSHE (94.7 FM; CRESTWOOD, MO; Owner: EMMIS RADIO LICENSE CORPORATION)
WIL-FM (92.3 FM; ST. LOUIS, MO; Owner: BONNEVILLE HOLDING COMPANY)
KSIV-FM (91.5 FM; ST. LOUIS, MO; Owner: COMMUNITY BROADCASTING, INC.)
KFAV (99.9 FM; WARRENTON, MO; Owner: KASPAR B/CASTING COMPANY OF MISSOURI)
KPNT (105.7 FM; ST. GENEVIEVE, MO; Owner: EMMIS RADIO LICENSE CORPORATION)
KLOU (103.3 FM; ST. LOUIS, MO; Owner: CITICASTERS LICENSES, L.P.)
KDHX (88.1 FM; ST. LOUIS, MO; Owner: DOUBLE HELIX CORPORATION)
WMLL (104.1 FM; JERSEYVILLE, IL; Owner: EMMIS RADIO LICENSE CORPORATION)
KNLH (89.5 FM; CEDAR HILL, MO; Owner: NEW LIFE EVANGELISTIC CENTER, INC.)
KCLC (89.1 FM; ST. CHARLES, MO; Owner: LINDENWOOD COLLEGE)
TV broadcast stations around Dardenne Prairie:
K59GP (Channel 59; ST. CHARLES, MO; Owner: TRINITY BROADCASTING NETWORK)
K63FW (Channel 63; JAMESTOWN, MO; Owner: ROGER E. HARDERS)
KSDK (Channel 5; ST. LOUIS, MO; Owner: MULTIMEDIA KSDK, INC.)
KTVI (Channel 2; ST. LOUIS, MO; Owner: KTVI LICENSE, INC.)
KPLR-TV (Channel 11; ST. LOUIS, MO; Owner: KPLR, INC.)
KETC (Channel 9; ST. LOUIS, MO; Owner: ST. LOUIS REGIONAL & EDUCATIONAL PUBLIC TV COMMISSION)
KDNL-TV (Channel 30; ST. LOUIS, MO; Owner: KDNL LICENSEE, LLC)
KMOV (Channel 4; ST. LOUIS, MO; Owner: KMOV-TV, INC.)
KPTN-LP (Channel 58; ST. LOUIS, MO; Owner: KURT J. PETERSEN)
WRBU (Channel 46; EAST ST. LOUIS, IL; Owner: ROBERTS BROADCASTING COMPANY)
KNLC (Channel 24; ST. LOUIS, MO; Owner: NEW LIFE EVANGELISTIC CENTER, INC.)
K40FF (Channel 40; ST. LOUIS, MO; Owner: EBC ST. LOUIS, INC.)
K18BT (Channel 18; ST. LOUIS, MO; Owner: TRINITY BROADCASTING NETWORK)
K65FN (Channel 65; BATESVILLE, AR; Owner: MS COMMUNICATIONS, LLC)
K49FC (Channel 49; ST. LOUIS, MO; Owner: THREE ANGELS BROADCASTING NETWORK)
K64DT (Channel 64; ST. LOUIS, MO; Owner: WORD OF GOD FELLOWSHIP, INC.)
K62EG (Channel 62; ST. LOUIS, MO; Owner: ETERNAL FAMILY NETWORK)
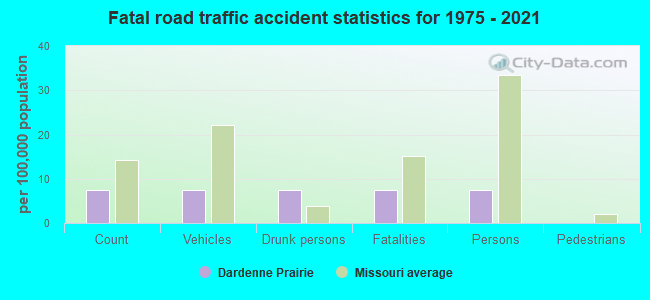
Dardenne Prairie fatal accident statistics for 1975 - 2021
Dardenne Prairie fatal accident list:
Apr 13, 2017 11:40 PM, Feise Rd, Lat: 38.773025, Lon: -90.727047, Vehicles: 1, Persons: 1, Fatalities: 1, Drunk persons involved: 1
FCC Registered Broadcast Land Mobile Towers: 2
7939 Highway N (Lat: 38.768889 Lon: -90.735000), Call Sign: WQFJ919, Assigned Frequencies: 466.962 MHz, 467.225 MHz, 451.612 MHz, 451.662 MHz, 452.862 MHz, Grant Date: 06/02/2016, Expiration Date: 08/02/2026, Certifier: Lisa Monnig, Registrant: Bearcom Operating LLC, ., Dallas, TX 75355-9001, Phone: (800) 458-9887, Fax: (214) 355-1713, Email:
7575 State Hwy N (Lat: 38.766194 Lon: -90.739917), Call Sign: WRKD872, Assigned Frequencies: 451.437 MHz, 456.437 MHz, 451.537 MHz, 456.537 MHz, 451.737 MHz, 456.737 MHz, 452.062 MHz, 457.062 MHz, 452.312 MHz, 457.312 MHz, Grant Date: 12/17/2020, Expiration Date: 12/17/2030, Certifier: Jason Peterson, Registrant: Advanced Wireless Communications, 20809 Kensington Blvd, Lakeville, MN 55044-8353, Phone: (952) 469-5400, Fax: (952) 469-0170, Email:
FCC Registered Microwave Towers: 84 (
See the full list of FCC Registered Microwave Towers in this town )
FCC Registered Amateur Radio Licenses: 23 (
See the full list of FCC Registered Amateur Radio Licenses in Dardenne Prairie )
FAA Registered Aircraft: 5
Aircraft: DAVILA-DON PITTS SPECIAL S-1 (Category: Land, Weight: Up to 12,499 Pounds), Engine: LYCOMING I0360 SER A&C (200 HP) (Reciprocating)N-Number: 10LD, N10LD, N-10LD, Serial Number: DD03, Airworthiness Date: 10/22/1980, Certificate Issue Date: 09/14/2019Registrant (LLC): Sport Aero LLC, 7717 Boatside Dr, Dardenne Prairie, MO 63368Aircraft: LUSCOMBE 8A (Category: Land, Seats: 2, Weight: Up to 12,499 Pounds, Speed: 86 mph), Engine: CONT MOTOR A&C65 SERIES (65 HP) (Reciprocating)N-Number: 1131B, N1131B, N-1131B, Serial Number: 5758, Year manufactured: 1947, Airworthiness Date: 04/16/1956, Certificate Issue Date: 10/09/2012Registrant (Individual): Ronald L Burnett, 327 Greenshire Ln, Dardenne Prairie, MO 63368Aircraft: CESSNA 172D (Category: Land, Seats: 4, Weight: Up to 12,499 Pounds, Speed: 105 mph), Engine: CONT MOTOR 0-300 SER (145 HP) (Reciprocating)N-Number: 2444Y, N2444Y, N-2444Y, Serial Number: 17249744, Year manufactured: 1962, Airworthiness Date: 10/16/1962, Certificate Issue Date: 11/04/2019Registrant (Co-Owned): Gregory M Pochapsky, 37 Hampton Springs Ln, Dardenne Prairie, MO 63368, Other Owners: Stuart J Scott, Matthew J ConradAircraft: BURNETT RONALD L RV-6A (Category: Land, Seats: 2, Weight: Up to 12,499 Pounds), Engine: AMA/EXPR UNKNOWN ENG (Reciprocating)N-Number: 524RB, N524RB, N-524RB, Serial Number: 60356, Year manufactured: 2011, Airworthiness Date: 02/17/2011, Certificate Issue Date: 09/28/2010Registrant (Individual): Ronald L Burnett, 327 Greenshire Ln, Dardenne Prairie, MO 63368Aircraft: MOONEY M20J (Category: Land, Seats: 4, Weight: Up to 12,499 Pounds, Speed: 126 mph), Engine: LYCOMING I0360 SER A&C (200 HP) (Reciprocating)N-Number: 9114Y, N9114Y, N-9114Y, Serial Number: 24-3183, Year manufactured: 1990, Airworthiness Date: 07/10/1990, Certificate Issue Date: 09/14/2018Registrant (LLC): Spirit Aero LLC, 7717 Boatside Dr, Dardenne Prairie, MO 63368
Home Mortgage Disclosure Act Aggregated Statistics For Year 2009(Based on 5 partial tracts) A) FHA, FSA/RHS & VA B) Conventional C) Refinancings D) Home Improvement Loans F) Non-occupant Loans on G) Loans On Manufactured Number Average Value Number Average Value Number Average Value Number Average Value Number Average Value Number Average Value
LOANS ORIGINATED 79 $170,609 81 $184,333 652 $182,127 9 $82,243 14 $131,741 0 $0 APPLICATIONS APPROVED, NOT ACCEPTED 5 $170,552 3 $236,403 45 $192,372 3 $40,223 1 $161,440 0 $0 APPLICATIONS DENIED 7 $144,790 7 $187,229 126 $199,787 6 $40,322 1 $185,680 1 $40,570 APPLICATIONS WITHDRAWN 7 $145,480 9 $187,839 95 $194,481 4 $75,682 2 $107,975 0 $0 FILES CLOSED FOR INCOMPLETENESS 0 $0 1 $154,690 23 $192,068 0 $0 0 $0 0 $0
Aggregated Statistics For Year 2008(Based on 5 partial tracts) A) FHA, FSA/RHS & VA B) Conventional C) Refinancings D) Home Improvement Loans F) Non-occupant Loans on G) Loans On Manufactured Number Average Value Number Average Value Number Average Value Number Average Value Number Average Value Number Average Value
LOANS ORIGINATED 50 $180,212 116 $187,359 330 $191,284 20 $45,637 19 $144,307 1 $60,060 APPLICATIONS APPROVED, NOT ACCEPTED 3 $201,603 14 $199,253 37 $178,987 4 $48,508 3 $132,830 1 $42,160 APPLICATIONS DENIED 4 $191,285 13 $189,345 153 $185,532 17 $65,332 7 $142,780 2 $25,830 APPLICATIONS WITHDRAWN 6 $165,670 13 $194,649 65 $196,951 4 $73,588 3 $109,620 0 $0 FILES CLOSED FOR INCOMPLETENESS 1 $246,100 3 $284,373 20 $181,688 1 $96,860 0 $0 0 $0
Aggregated Statistics For Year 2007(Based on 5 partial tracts) A) FHA, FSA/RHS & VA B) Conventional C) Refinancings D) Home Improvement Loans F) Non-occupant Loans on G) Loans On Manufactured Number Average Value Number Average Value Number Average Value Number Average Value Number Average Value Number Average Value
LOANS ORIGINATED 15 $184,111 269 $175,005 374 $165,397 44 $45,329 32 $160,711 0 $0 APPLICATIONS APPROVED, NOT ACCEPTED 0 $0 22 $160,020 59 $177,626 10 $81,510 1 $145,170 1 $29,700 APPLICATIONS DENIED 2 $192,110 30 $161,664 185 $173,410 25 $70,126 6 $120,050 4 $55,715 APPLICATIONS WITHDRAWN 2 $186,525 22 $155,180 89 $183,843 7 $62,319 3 $146,003 0 $0 FILES CLOSED FOR INCOMPLETENESS 0 $0 4 $262,200 34 $170,269 3 $79,190 0 $0 0 $0
Aggregated Statistics For Year 2006(Based on 5 partial tracts) A) FHA, FSA/RHS & VA B) Conventional C) Refinancings D) Home Improvement Loans E) Loans on Dwellings For 5+ Families F) Non-occupant Loans on G) Loans On Manufactured Number Average Value Number Average Value Number Average Value Number Average Value Number Average Value Number Average Value Number Average Value
LOANS ORIGINATED 17 $171,805 361 $156,182 389 $151,692 36 $43,141 1 $9,808,930 44 $133,725 1 $82,440 APPLICATIONS APPROVED, NOT ACCEPTED 2 $156,055 27 $149,631 63 $149,931 10 $34,757 0 $0 4 $147,538 1 $33,890 APPLICATIONS DENIED 3 $130,620 43 $153,530 173 $163,833 25 $57,272 0 $0 10 $168,875 5 $46,874 APPLICATIONS WITHDRAWN 2 $185,245 38 $146,858 115 $161,224 4 $168,410 0 $0 6 $152,572 0 $0 FILES CLOSED FOR INCOMPLETENESS 1 $85,790 9 $155,328 39 $170,098 1 $27,980 0 $0 1 $165,400 0 $0
Aggregated Statistics For Year 2005(Based on 5 partial tracts) A) FHA, FSA/RHS & VA B) Conventional C) Refinancings D) Home Improvement Loans F) Non-occupant Loans on G) Loans On Manufactured Number Average Value Number Average Value Number Average Value Number Average Value Number Average Value Number Average Value
LOANS ORIGINATED 25 $171,424 393 $150,687 499 $153,127 44 $62,003 43 $127,667 2 $42,850 APPLICATIONS APPROVED, NOT ACCEPTED 2 $131,980 32 $154,632 62 $141,242 11 $35,530 3 $116,547 3 $42,740 APPLICATIONS DENIED 3 $134,730 37 $128,058 168 $157,675 23 $46,714 5 $150,862 5 $39,510 APPLICATIONS WITHDRAWN 2 $124,725 40 $151,518 165 $166,455 13 $173,997 6 $107,417 0 $0 FILES CLOSED FOR INCOMPLETENESS 0 $0 7 $134,760 33 $182,142 2 $89,645 0 $0 0 $0
Aggregated Statistics For Year 2004(Based on 5 partial tracts) A) FHA, FSA/RHS & VA B) Conventional C) Refinancings D) Home Improvement Loans F) Non-occupant Loans on G) Loans On Manufactured Number Average Value Number Average Value Number Average Value Number Average Value Number Average Value Number Average Value
LOANS ORIGINATED 39 $152,666 390 $154,521 537 $149,504 29 $61,680 40 $122,482 1 $37,350 APPLICATIONS APPROVED, NOT ACCEPTED 2 $148,715 33 $144,480 79 $140,560 7 $40,984 3 $172,790 1 $58,300 APPLICATIONS DENIED 4 $129,782 36 $138,921 143 $144,113 26 $60,228 4 $128,200 4 $34,178 APPLICATIONS WITHDRAWN 2 $118,195 30 $140,930 127 $155,325 5 $44,392 4 $138,568 0 $0 FILES CLOSED FOR INCOMPLETENESS 1 $124,220 9 $142,468 24 $152,348 2 $34,340 1 $100,580 0 $0
Aggregated Statistics For Year 2003(Based on 5 partial tracts) A) FHA, FSA/RHS & VA B) Conventional C) Refinancings D) Home Improvement Loans F) Non-occupant Loans on Number Average Value Number Average Value Number Average Value Number Average Value Number Average Value
LOANS ORIGINATED 50 $144,939 396 $151,381 1,363 $141,560 23 $28,762 28 $105,415 APPLICATIONS APPROVED, NOT ACCEPTED 0 $0 32 $137,083 120 $136,020 12 $45,728 2 $84,415 APPLICATIONS DENIED 3 $124,213 44 $91,888 164 $130,108 17 $37,807 4 $112,250 APPLICATIONS WITHDRAWN 2 $134,000 30 $157,082 177 $140,584 2 $28,280 3 $106,633 FILES CLOSED FOR INCOMPLETENESS 0 $0 5 $175,848 38 $139,499 1 $88,060 1 $91,960
Detailed HMDA statistics for the following Tracts:
3111.34
, 3111.44 , 3117.32 , 3119.01
Private Mortgage Insurance Companies Aggregated Statistics For Year 2009(Based on 5 partial tracts) A) Conventional B) Refinancings Number Average Value Number Average Value
LOANS ORIGINATED 18 $222,021 26 $210,060 APPLICATIONS APPROVED, NOT ACCEPTED 5 $244,272 8 $176,775 APPLICATIONS DENIED 3 $305,120 6 $240,137 APPLICATIONS WITHDRAWN 3 $207,710 3 $247,320 FILES CLOSED FOR INCOMPLETENESS 0 $0 2 $215,930
Aggregated Statistics For Year 2008(Based on 5 partial tracts) A) Conventional B) Refinancings C) Non-occupant Loans on Number Average Value Number Average Value Number Average Value
LOANS ORIGINATED 48 $213,907 43 $224,343 4 $142,882 APPLICATIONS APPROVED, NOT ACCEPTED 9 $208,347 18 $213,287 0 $0 APPLICATIONS DENIED 3 $255,100 4 $243,978 1 $151,000 APPLICATIONS WITHDRAWN 1 $341,690 2 $126,415 0 $0 FILES CLOSED FOR INCOMPLETENESS 1 $210,680 1 $480,570 0 $0
Aggregated Statistics For Year 2007(Based on 5 partial tracts) A) Conventional B) Refinancings C) Non-occupant Loans on Number Average Value Number Average Value Number Average Value
LOANS ORIGINATED 64 $188,464 45 $206,023 4 $151,382 APPLICATIONS APPROVED, NOT ACCEPTED 5 $210,254 11 $226,765 0 $0 APPLICATIONS DENIED 1 $179,770 0 $0 0 $0 APPLICATIONS WITHDRAWN 1 $299,020 5 $240,426 0 $0 FILES CLOSED FOR INCOMPLETENESS 0 $0 1 $352,510 0 $0
Aggregated Statistics For Year 2006(Based on 5 partial tracts) A) Conventional B) Refinancings C) Non-occupant Loans on Number Average Value Number Average Value Number Average Value
LOANS ORIGINATED 46 $186,762 26 $207,486 3 $105,127 APPLICATIONS APPROVED, NOT ACCEPTED 6 $276,143 12 $218,518 1 $159,500 APPLICATIONS DENIED 0 $0 0 $0 1 $104,360 APPLICATIONS WITHDRAWN 3 $183,453 3 $230,227 1 $84,400 FILES CLOSED FOR INCOMPLETENESS 0 $0 0 $0 0 $0
Aggregated Statistics For Year 2005(Based on 5 partial tracts) A) Conventional B) Refinancings C) Non-occupant Loans on Number Average Value Number Average Value Number Average Value
LOANS ORIGINATED 44 $207,535 44 $189,950 3 $118,353 APPLICATIONS APPROVED, NOT ACCEPTED 8 $178,496 9 $209,181 1 $83,250 APPLICATIONS DENIED 0 $0 1 $222,620 0 $0 APPLICATIONS WITHDRAWN 3 $167,597 6 $188,373 1 $86,220 FILES CLOSED FOR INCOMPLETENESS 1 $180,080 0 $0 0 $0
Aggregated Statistics For Year 2004(Based on 5 partial tracts) A) Conventional B) Refinancings C) Non-occupant Loans on Number Average Value Number Average Value Number Average Value
LOANS ORIGINATED 61 $186,321 56 $169,270 4 $144,315 APPLICATIONS APPROVED, NOT ACCEPTED 10 $165,030 18 $171,902 1 $147,100 APPLICATIONS DENIED 0 $0 1 $168,480 0 $0 APPLICATIONS WITHDRAWN 4 $153,300 3 $197,427 0 $0 FILES CLOSED FOR INCOMPLETENESS 0 $0 1 $139,990 0 $0
Aggregated Statistics For Year 2003(Based on 5 partial tracts) A) Conventional B) Refinancings C) Non-occupant Loans on Number Average Value Number Average Value Number Average Value
LOANS ORIGINATED 101 $172,543 168 $168,105 3 $109,923 APPLICATIONS APPROVED, NOT ACCEPTED 12 $183,768 48 $168,196 0 $0 APPLICATIONS DENIED 0 $0 1 $140,180 0 $0 APPLICATIONS WITHDRAWN 5 $176,992 9 $151,788 1 $78,140 FILES CLOSED FOR INCOMPLETENESS 1 $110,860 0 $0 0 $0
Detailed PMIC statistics for the following Tracts:
3111.34
, 3111.44 , 3117.32 , 3119.01 Dardenne Prairie compared to Missouri state average:
Median household income above state average. Median house value above state average. Unemployed percentage significantly below state average. Hispanic race population percentage above state average. Median age above state average. Foreign-born population percentage significantly above state average. Renting percentage significantly below state average. Length of stay since moving in significantly above state average. Number of rooms per house above state average. House age significantly below state average. Number of college students above state average. Percentage of population with a bachelor's degree or higher significantly above state average. Dardenne Prairie on our top lists :
#47 on the list of "Top 101 cities with the most people living the same house as 1 year ago (population 5,000+))"
#54 on the list of "Top 101 cities with the smallest household incomes disparities (population 5,000+)"
#73 on the list of "Top 101 cities with the most people taking a motorcycle to work (population 5,000+)"
#83 on the list of "Top 101 cities with the highest percentage of family households, population 10,000+"
#20 on the list of "Top 101 counties with the largest decrease in the number of infant deaths per 1000 residents 2000-2006 to 2007-2013 (pop. 50,000+)"
#33 on the list of "Top 101 counties with the lowest number of infant deaths per 1000 residents 2007-2013 (pop. 50,000+)"
#87 on the list of "Top 101 counties with the lowest percentage of residents relocating from foreign countries between 2010 and 2011"
Top Patent Applicants
David Brown (7)
Vikranth Kumar Anneboina (6)
Bejoy Mathew (6)
Carl P. Urwin (5)
David C. Brown (5)
Terry D. Richardson (4)
David C. Reardon (4)
Thomas Joseph Sellner (4)
Vandan Tanna (4)
Jacob J. Rede (3)
Total of 108 patent applications in 2008-2024.


 Recent articles from our blog. Our writers, many of them Ph.D. graduates or candidates, create easy-to-read articles on a wide variety of topics.

 (7.1 miles
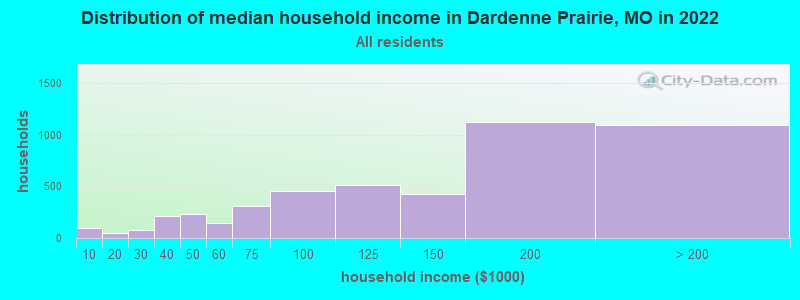


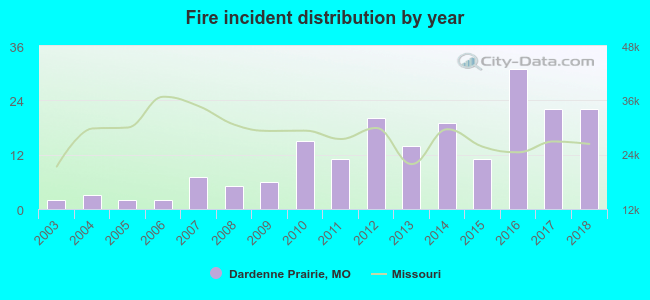 Based on the data from the years 2003 - 2018 the average number of fires per year is 12. The highest number of reported fire incidents - 31 took place in 2016, and the least - 2 in 2003. The data has an increasing trend.
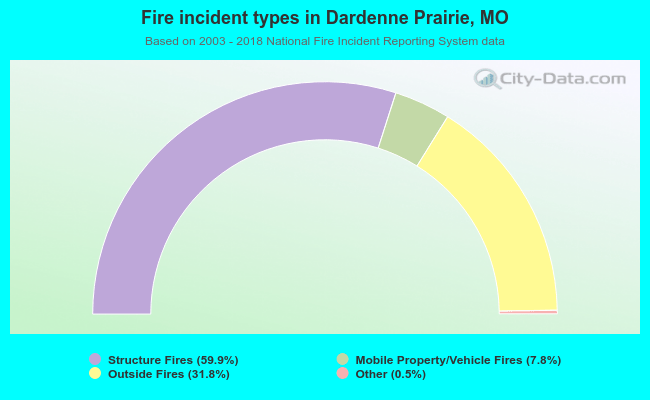 When looking into fire subcategories, the most incidents belonged to: Structure Fires (59.9%), and Outside Fires (31.8%).