Percentage of residents living in poverty in 2022: 5.9%
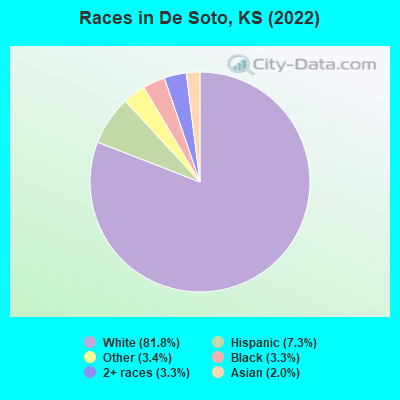
(1.8% for White Non-Hispanic residents, 75.3% for Black residents, 23.9% for Hispanic or Latino residents, 1.0% for two or more races residents)
According to our research of Kansas and other state lists, there were 8 registered sex offenders living in De Soto, Kansas as of June 16, 2024. The ratio of all residents to sex offenders in De Soto is 763 to 1. The ratio of registered sex offenders to all residents in this city is much lower than the state average.
Recent articles from our blog. Our writers, many of them Ph.D. graduates or candidates, create easy-to-read articles on a wide variety of topics.
Latest news from De Soto, KS collected exclusively by city-data.com from local newspapers, TV, and radio stations
Ancestries: German (23.5%), Irish (16.7%), English (11.0%), American (7.2%), European (5.2%), French (4.8%).
Current Local Time: CST time zone
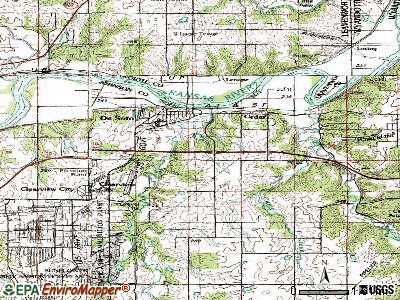
Elevation: 842 feet
Land area: 11.3 square miles.
Population density: 572 people per square mile (low).
310 residents are foreign born (2.6% Latin America, 1.7% Asia, 0.6% Europe).
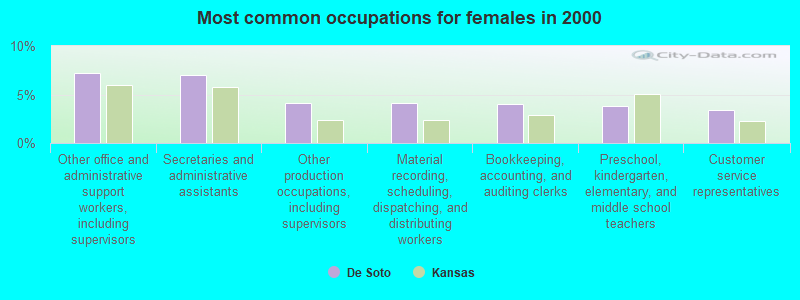
This city:
4.9%
Kansas:
7.1%
Median real estate property taxes paid for housing units with mortgages in 2022: $5,733 (1.3%) Median real estate property taxes paid for housing units with no mortgage in 2022: $3,791 (1.4%)
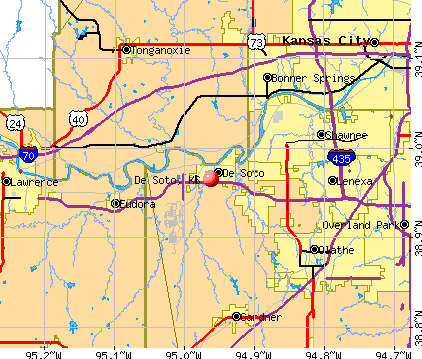
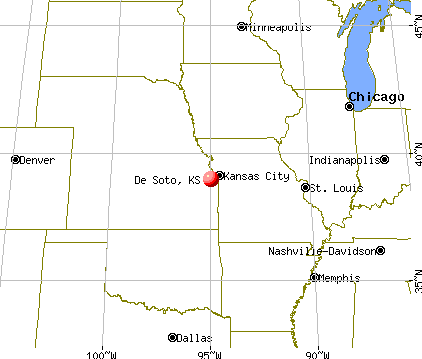
Nearest city with pop. 50,000+: Olathe, KS (10.4 miles , pop. 92,962).
Nearest city with pop. 200,000+: Kansas City, MO (23.2 miles , pop. 441,545).
Nearest city with pop. 1,000,000+: Chicago, IL (431.9 miles , pop. 2,896,016).
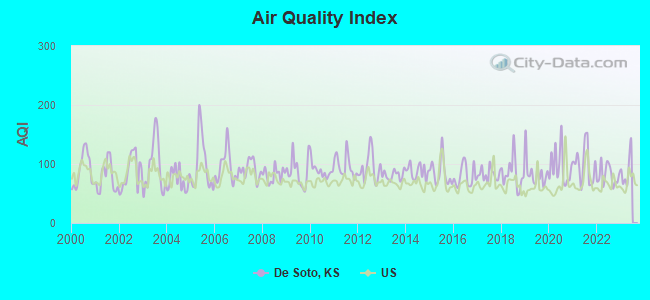
Air Quality Index (AQI) level in 2022 was 80.7. This is about average.
City:
80.7
U.S.:
72.6
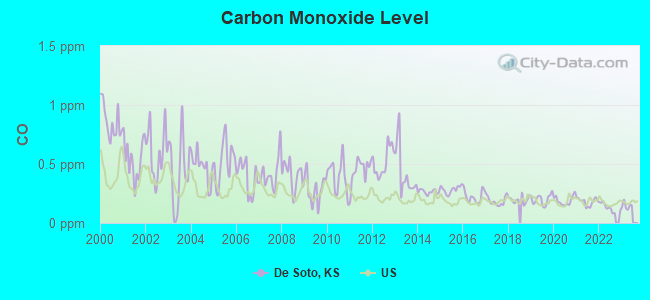
Carbon Monoxide (CO) [ppm] level in 2022 was 0.132. This is significantly better than average.Closest monitor was 9.5 miles away from the city center.
City:
0.132
U.S.:
0.251
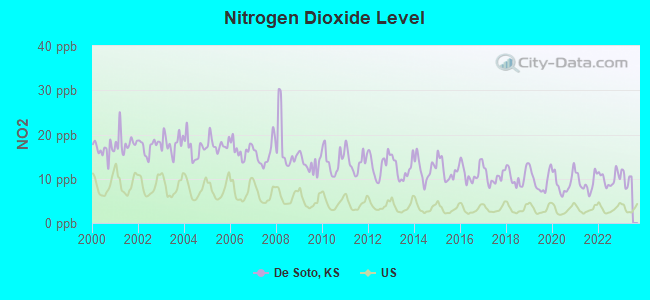
Nitrogen Dioxide (NO2) [ppb] level in 2022 was 9.97. This is significantly worse than average.Closest monitor was 9.5 miles away from the city center.
City:
9.97
U.S.:
5.11
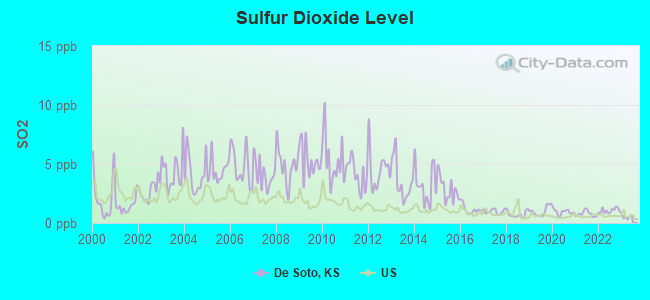
Sulfur Dioxide (SO2) [ppb] level in 2022 was 1.05. This is significantly better than average.Closest monitor was 9.5 miles away from the city center.
City:
1.05
U.S.:
1.51
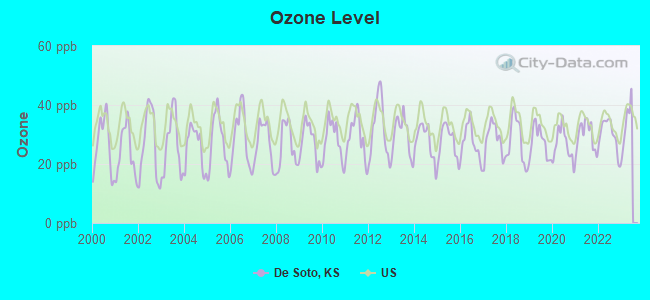
Ozone [ppb] level in 2022 was 29.9. This is about average.Closest monitor was 13.5 miles away from the city center.
City:
29.9
U.S.:
33.3
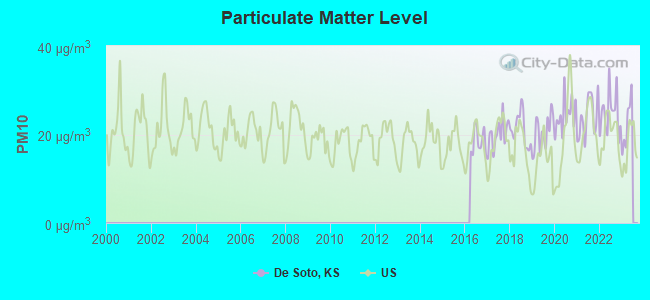
Particulate Matter (PM10) [µg/m3] level in 2022 was 24.8. This is worse than average.Closest monitor was 14.4 miles away from the city center.
City:
24.8
U.S.:
19.2
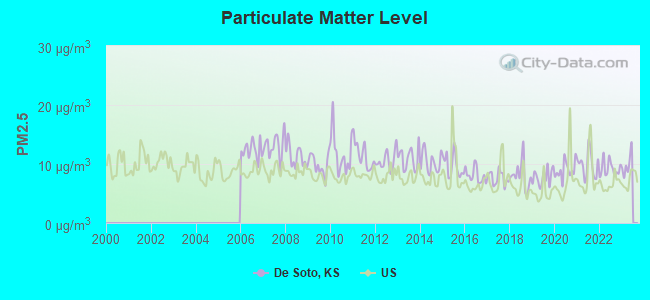
Particulate Matter (PM2.5) [µg/m3] level in 2022 was 9.21. This is about average.Closest monitor was 12.6 miles away from the city center.
City:
9.21
U.S.:
8.11
Tornado activity:
De Soto-area historical tornado activity is near Kansas state average. It is 107% greater than the overall U.S. average.
On 5/4/2003, a category F4 (max. wind speeds 207-260 mph) tornado 10.2 miles away from the De Soto city center killed 2 peopleand injured 30 peopleand caused $48 million in damages.
On 5/20/1957, a category F5 (max. wind speeds 261-318 mph) tornado 30.3 miles away from the city center killed 44 peopleand injured 207 peopleand causedbetween $500,000 and $5,000,000 in damages.
Earthquake activity:
De Soto-area historical earthquake activity is significantly above Kansas state average. It is 532% greater than the overall U.S. average.
On 9/3/2016 at 12:02:44, a magnitude 5.8 (5.8 MW, Depth: 3.5 mi, Class: Moderate, Intensity: VI - VII) earthquake occurred 206.0 miles away from the city center On 11/6/2011 at 03:53:10, a magnitude 5.7 (5.7 MW, Depth: 3.2 mi) earthquake occurred 257.4 miles away from De Soto center On 11/12/2014 at 21:40:00, a magnitude 4.9 (4.9 MW, Depth: 2.5 mi, Class: Light, Intensity: IV - V) earthquake occurred 186.1 miles away from the city center On 11/7/2016 at 01:44:24, a magnitude 5.0 (5.0 MW, Depth: 2.8 mi) earthquake occurred 229.2 miles away from the city center On 2/13/2016 at 17:07:06, a magnitude 5.1 (5.1 MW, Depth: 5.2 mi) earthquake occurred 267.0 miles away from De Soto center On 1/19/2020 at 19:08:42, a magnitude 4.5 (4.5 MW, Depth: 3.1 mi) earthquake occurred 175.5 miles away from De Soto center Magnitude types: moment magnitude (MW)
Natural disasters:
The number of natural disasters in Johnson County (10) is smaller than the US average (15). Major Disasters (Presidential) Declared: 6 Emergencies Declared: 2
Causes of natural disasters: Floods: 6, Storms: 6, Tornadoes: 2, Hurricane: 1, Ice Storm: 1, Wind: 1, Winter Storm: 1, Other: 1 (Note: some incidents may be assigned to more than one category).
Hospitals and medical centers in De Soto:
CEDAR GROVE HEALTH CARE (33600 W 85TH ST)
HILLSIDE VILLAGE OF DESOTO (33600 WEST 85TH ST)
Other hospitals and medical centers near De Soto:
KANSAS INSTITUTE (Hospital, about 5 miles away; OLATHE, KS)
MEDICALODGES EUDORA (Nursing Home, about 8 miles away; EUDORA, KS)
HILLSIDE HEALTH CARE CENTER (Nursing Home, about 9 miles away; BONNER SPRINGS, KS)
BONNER SPRINGS NURSING AND REHABILITATION CENTER (Nursing Home, about 9 miles away; BONNER SPRINGS, KS)
JOHNSON CO RESIDENTIAL CARE FACILITY (Nursing Home, about 9 miles away; OLATHE, KS)
LINCOLN AVENUE CARE CENTER (Nursing Home, about 9 miles away; OLATHE, KS)
EVERGREEN COMMUNITY OF JOHNSON COUNTY (Nursing Home, about 10 miles away; OLATHE, KS)
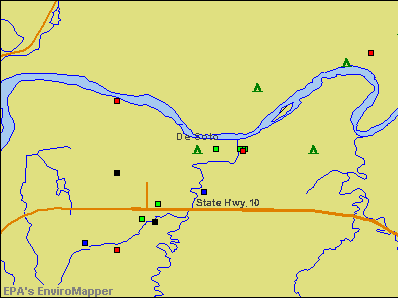
Notable locations in De Soto: Oak Country Club (A), DeSoto Business Park (B), De Soto Chamber of Commerce (C), Jewett Business Park (D), Desoto Business Park (E), Desoto Library (F), Station 2 (G), De Soto Fire and Rescue Department Station 2 (H), Station Number 2 (I), De Soto City Hall (J), Merriam Community Center (K), Johnson County Rural Fire District 3 Station 1 (L), Johnson County Medical Action Station 191 (M), De Soto Fire and Rescue Department Station 1 (N). Display/hide their locations on the map
Churches in De Soto include: United Methodist Church of Desoto (A), Faith Builders International (B), De Soto Baptist Church (C), Clearview City Independent Baptist Church (D), Clearview Baptist Church (E). Display/hide their locations on the map
Tourist attraction: Libraries Public - Johnson County Libraries- Branch Libraries- Desoto Lib (Cultural Attractions- Events- & Facilities; 33145 West 83rd Street).
Hotel: Super 8 of Desoto (34085 Commerce Drive).
Birthplace of: Stanley T. Adams - Army Medal of Honor recipient.
Johnson County has a predicted average indoor radon screening level greater than 4 pCi/L (pico curies per liter) - Highest Potential
Average household size:
This city:
2.8 people
Kansas:
2.5 people
Percentage of family households:
This city:
75.9%
Whole state:
66.0%
Percentage of households with unmarried partners:
This city:
7.1%
Whole state:
5.8%
Likely homosexual households (counted as self-reported same-sex unmarried-partner households)
Lesbian couples: 0.4% of all households
Gay men: 0.3% of all households
41 people in nursing facilities/skilled-nursing facilities in 2010
Banks with branches in De Soto (2011 data):
Great Southern Bank: Desoto Branch at 34102 Commerce Drive, branch established on 1994/11/21. Info updated 2012/02/03: Bank assets: $3,788.7 mil, Deposits: $2,986.3 mil, headquarters in Reeds Spring, MO, positive income, Commercial Lending Specialization, 109 total offices, Holding Company: Great Southern Bancorp, Inc.
First Community Bank: De Soto Branch 81 at 33485 Lexington, branch established on 2006/03/03. Info updated 2010/08/12: Bank assets: $638.3 mil, Deposits: $567.3 mil, headquarters in Lees Summit, MO, positive income, Commercial Lending Specialization, 18 total offices, Holding Company: First Community Bancshares, Inc.
Great American Bank: at 33050 West 83rd Street, branch established on 1901/01/15. Info updated 2009/09/08: Bank assets: $51.4 mil, Deposits: $40.7 mil, local headquarters, positive income, Commercial Lending Specialization, 2 total offices, Holding Company: First Financial Bancshares, Inc.
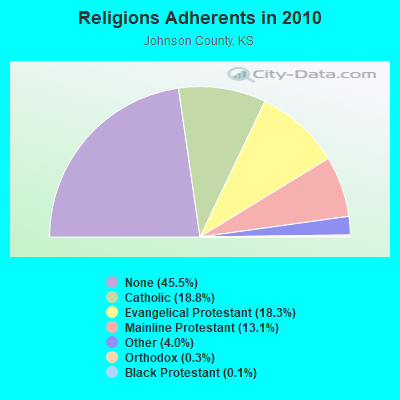
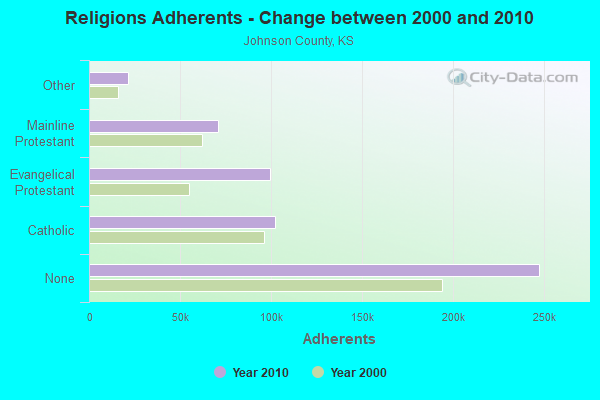
Religion statistics for De Soto, KS (based on Johnson County data)
Religion
Adherents
Congregations
Catholic
102,131
18
Evangelical Protestant
99,699
190
Mainline Protestant
71,068
87
Other
21,644
46
Orthodox
1,505
5
Black Protestant
642
4
None
247,490
-
Source: Clifford Grammich, Kirk Hadaway, Richard Houseal, Dale E.Jones, Alexei Krindatch, Richie Stanley and Richard H.Taylor. 2012. 2010 U.S.Religion Census: Religious Congregations & Membership Study. Association of Statisticians of American Religious Bodies. Jones, Dale E., et al. 2002. Congregations and Membership in the United States 2000. Nashville, TN: Glenmary Research Center. Graphs represent county-level data
FAA Registered Aircraft Manufacturers and Dealers:
1
EXPERIENCED AIRCRAFT PARTS INC, Po Box B, De Soto, KS 66018 Certificate: 01-1796 (Corporation), Certificate Issue Date: 10/13/2001, Expiration Date: 10/12/2002
FAA Registered Aircraft:
4
Aircraft: CIRRUS DESIGN CORP SR22 (Category: Land, Seats: 4, Weight: Up to 12,499 Pounds), Engine: CONT MOTOR IO-550-N (310 HP) (Reciprocating) N-Number: 536PC, N536PC, N-536PC, Serial Number: 1763, Year manufactured: 2006, Airworthiness Date: 01/10/2006, Certificate Issue Date: 05/15/2006 Registrant (LLC): S & P Air LLC, 8997 Commerce Dr, De Soto, KS 66018
Aircraft: AVIAT AIRCRAFT INC A-1B (Category: Land, Seats: 2, Weight: Up to 12,499 Pounds), Engine: LYCOMING O-360 SERIES (180 HP) (Reciprocating) N-Number: 62DF, N62DF, N-62DF, Serial Number: 2268, Year manufactured: 2004, Airworthiness Date: 05/24/2004, Certificate Issue Date: 05/28/2020 Registrant (Individual): Peter E Jr Buffkin, 8560 Oak Country Ln, De Soto, KS 66018
Aircraft: CIRRUS DESIGN CORP SR22 (Category: Land, Seats: 4, Weight: Up to 12,499 Pounds), Engine: CONT MOTOR IO-550 SERIES (300 HP) (Reciprocating) N-Number: 925PD, N925PD, N-925PD, Serial Number: 1270, Year manufactured: 2005, Airworthiness Date: 01/13/2005, Certificate Issue Date: 02/02/2015 Registrant (LLC): C2 Aviation LLC, 8311 Frederick Ct, De Soto, KS 66018
Aircraft: CESSNA 150G (Category: Land, Seats: 2, Weight: Up to 12,499 Pounds, Speed: 90 mph), Engine: 4 Cycle N-Number: 2198T, N2198T, N-2198T, Serial Number: 15064610, Certificate Issue Date: 05/09/2000 Registrant (Individual): Dale H Rose, Po Box B, De Soto, KS 66018 Deregistered:Cancel Date: 07/23/1994
Home Mortgage Disclosure Act Aggregated Statistics For Year 2009 (Based on 3 partial tracts)
A) FHA, FSA/RHS & VA Home Purchase Loans
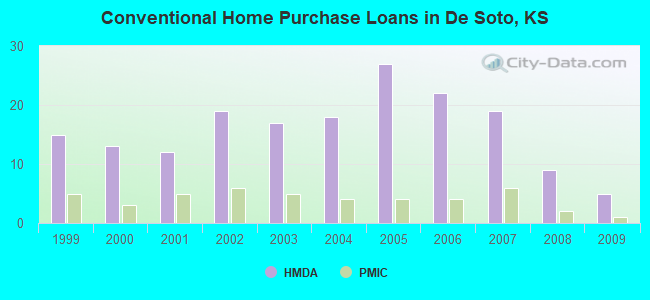
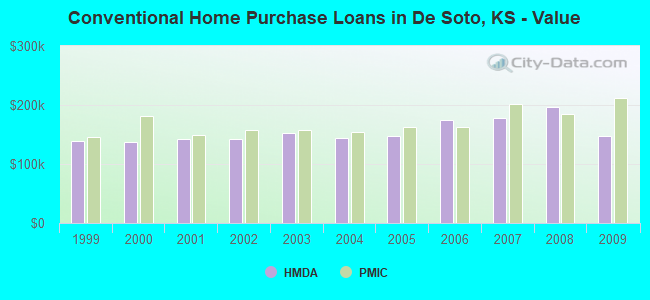
B) Conventional Home Purchase Loans
C) Refinancings
D) Home Improvement Loans
F) Non-occupant Loans on < 5 Family Dwellings (A B C & D)
Number
Average Value
Number
Average Value
Number
Average Value
Number
Average Value
Number
Average Value
LOANS ORIGINATED
6
$150,330
5
$147,552
33
$200,762
1
$61,140
1
$151,640
APPLICATIONS APPROVED, NOT ACCEPTED
0
$0
0
$0
3
$209,117
0
$0
0
$0
APPLICATIONS DENIED
1
$129,280
2
$105,080
9
$250,694
1
$51,010
0
$0
APPLICATIONS WITHDRAWN
0
$0
1
$216,630
10
$190,790
0
$0
0
$0
FILES CLOSED FOR INCOMPLETENESS
0
$0
0
$0
1
$295,240
0
$0
0
$0
Aggregated Statistics For Year 2008 (Based on 3 partial tracts)
A) FHA, FSA/RHS & VA Home Purchase Loans
B) Conventional Home Purchase Loans
C) Refinancings
D) Home Improvement Loans
F) Non-occupant Loans on < 5 Family Dwellings (A B C & D)
G) Loans On Manufactured Home Dwelling (A B C & D)
Number
Average Value
Number
Average Value
Number
Average Value
Number
Average Value
Number
Average Value
Number
Average Value
LOANS ORIGINATED
4
$165,092
9
$196,440
21
$183,177
2
$167,800
2
$132,335
0
$0
APPLICATIONS APPROVED, NOT ACCEPTED
0
$0
1
$220,120
2
$199,335
0
$0
0
$0
0
$0
APPLICATIONS DENIED
1
$124,040
2
$122,115
7
$181,339
2
$47,345
1
$72,680
1
$58,350
APPLICATIONS WITHDRAWN
1
$108,140
1
$124,910
4
$201,690
0
$0
0
$0
0
$0
FILES CLOSED FOR INCOMPLETENESS
0
$0
1
$110,590
2
$131,900
0
$0
0
$0
0
$0
Aggregated Statistics For Year 2007 (Based on 3 partial tracts)
B) Conventional Home Purchase Loans
C) Refinancings
D) Home Improvement Loans
F) Non-occupant Loans on < 5 Family Dwellings (A B C & D)
Number
Average Value
Number
Average Value
Number
Average Value
Number
Average Value
LOANS ORIGINATED
19
$177,578
20
$190,624
3
$31,853
2
$120,105
APPLICATIONS APPROVED, NOT ACCEPTED
2
$219,775
5
$182,666
0
$0
0
$0
APPLICATIONS DENIED
2
$169,635
13
$215,499
2
$117,050
1
$99,580
APPLICATIONS WITHDRAWN
1
$411,070
6
$210,427
0
$0
1
$107,620
FILES CLOSED FOR INCOMPLETENESS
1
$55,210
2
$184,395
0
$0
0
$0
Aggregated Statistics For Year 2006 (Based on 3 partial tracts)
A) FHA, FSA/RHS & VA Home Purchase Loans
B) Conventional Home Purchase Loans
C) Refinancings
D) Home Improvement Loans
F) Non-occupant Loans on < 5 Family Dwellings (A B C & D)
G) Loans On Manufactured Home Dwelling (A B C & D)
Number
Average Value
Number
Average Value
Number
Average Value
Number
Average Value
Number
Average Value
Number
Average Value
LOANS ORIGINATED
1
$162,470
22
$174,089
27
$169,815
5
$42,802
5
$155,274
0
$0
APPLICATIONS APPROVED, NOT ACCEPTED
0
$0
1
$232,350
5
$162,856
1
$128,230
1
$106,220
0
$0
APPLICATIONS DENIED
0
$0
6
$107,907
20
$149,010
4
$109,755
1
$108,490
1
$37,040
APPLICATIONS WITHDRAWN
0
$0
3
$159,383
12
$185,124
1
$35,640
0
$0
0
$0
FILES CLOSED FOR INCOMPLETENESS
0
$0
0
$0
2
$228,070
0
$0
0
$0
0
$0
Aggregated Statistics For Year 2005 (Based on 3 partial tracts)
A) FHA, FSA/RHS & VA Home Purchase Loans
B) Conventional Home Purchase Loans
C) Refinancings
D) Home Improvement Loans
F) Non-occupant Loans on < 5 Family Dwellings (A B C & D)
Number
Average Value
Number
Average Value
Number
Average Value
Number
Average Value
Number
Average Value
LOANS ORIGINATED
2
$109,625
27
$147,110
34
$157,322
5
$47,518
4
$130,588
APPLICATIONS APPROVED, NOT ACCEPTED
0
$0
2
$153,560
5
$151,396
1
$70,230
0
$0
APPLICATIONS DENIED
0
$0
6
$120,688
19
$159,630
2
$48,390
0
$0
APPLICATIONS WITHDRAWN
0
$0
6
$116,583
18
$165,324
1
$215,410
1
$125,780
FILES CLOSED FOR INCOMPLETENESS
0
$0
1
$178,540
5
$149,962
0
$0
0
$0
Aggregated Statistics For Year 2004 (Based on 3 partial tracts)
A) FHA, FSA/RHS & VA Home Purchase Loans
B) Conventional Home Purchase Loans
C) Refinancings
D) Home Improvement Loans
F) Non-occupant Loans on < 5 Family Dwellings (A B C & D)
G) Loans On Manufactured Home Dwelling (A B C & D)
Number
Average Value
Number
Average Value
Number
Average Value
Number
Average Value
Number
Average Value
Number
Average Value
LOANS ORIGINATED
2
$151,465
18
$144,545
34
$165,888
3
$94,980
2
$115,915
1
$21,490
APPLICATIONS APPROVED, NOT ACCEPTED
0
$0
3
$136,790
5
$161,772
0
$0
0
$0
0
$0
APPLICATIONS DENIED
0
$0
3
$153,737
16
$156,553
1
$50,140
0
$0
0
$0
APPLICATIONS WITHDRAWN
0
$0
3
$130,443
12
$138,988
1
$36,510
0
$0
0
$0
FILES CLOSED FOR INCOMPLETENESS
0
$0
1
$68,130
5
$150,452
0
$0
0
$0
0
$0
Aggregated Statistics For Year 2003 (Based on 3 partial tracts)
A) FHA, FSA/RHS & VA Home Purchase Loans
B) Conventional Home Purchase Loans
C) Refinancings
D) Home Improvement Loans
F) Non-occupant Loans on < 5 Family Dwellings (A B C & D)
Number
Average Value
Number
Average Value
Number
Average Value
Number
Average Value
Number
Average Value
LOANS ORIGINATED
2
$116,090
17
$152,534
77
$161,092
1
$17,470
2
$119,755
APPLICATIONS APPROVED, NOT ACCEPTED
0
$0
2
$111,895
6
$179,155
1
$7,510
0
$0
APPLICATIONS DENIED
0
$0
4
$102,288
15
$162,098
1
$62,720
1
$48,390
APPLICATIONS WITHDRAWN
0
$0
2
$140,545
11
$145,557
1
$60,450
0
$0
FILES CLOSED FOR INCOMPLETENESS
0
$0
1
$114,080
3
$183,610
0
$0
0
$0
Aggregated Statistics For Year 2002 (Based on 3 partial tracts)
A) FHA, FSA/RHS & VA Home Purchase Loans
B) Conventional Home Purchase Loans
C) Refinancings
D) Home Improvement Loans
F) Non-occupant Loans on < 5 Family Dwellings (A B C & D)
Number
Average Value
Number
Average Value
Number
Average Value
Number
Average Value
Number
Average Value
LOANS ORIGINATED
3
$114,720
19
$142,344
55
$155,766
4
$30,748
2
$145,525
APPLICATIONS APPROVED, NOT ACCEPTED
0
$0
3
$113,323
8
$174,372
1
$14,150
1
$44,550
APPLICATIONS DENIED
0
$0
5
$102,234
19
$126,446
1
$20,270
0
$0
APPLICATIONS WITHDRAWN
0
$0
2
$106,830
12
$143,909
1
$53,280
0
$0
FILES CLOSED FOR INCOMPLETENESS
0
$0
1
$85,430
8
$130,020
0
$0
0
$0
Aggregated Statistics For Year 2001 (Based on 3 partial tracts)
A) FHA, FSA/RHS & VA Home Purchase Loans
B) Conventional Home Purchase Loans
C) Refinancings
D) Home Improvement Loans
F) Non-occupant Loans on < 5 Family Dwellings (A B C & D)
Number
Average Value
Number
Average Value
Number
Average Value
Number
Average Value
Number
Average Value
LOANS ORIGINATED
3
$106,567
12
$143,210
47
$151,811
2
$41,665
2
$125,785
APPLICATIONS APPROVED, NOT ACCEPTED
0
$0
2
$78,875
3
$123,863
1
$13,980
0
$0
APPLICATIONS DENIED
1
$62,370
4
$56,515
12
$132,117
1
$27,430
0
$0
APPLICATIONS WITHDRAWN
0
$0
1
$118,620
10
$141,315
1
$20,440
0
$0
FILES CLOSED FOR INCOMPLETENESS
1
$58,000
0
$0
3
$132,423
0
$0
0
$0
Aggregated Statistics For Year 2000 (Based on 3 partial tracts)
A) FHA, FSA/RHS & VA Home Purchase Loans
B) Conventional Home Purchase Loans
C) Refinancings
D) Home Improvement Loans
F) Non-occupant Loans on < 5 Family Dwellings (A B C & D)
Number
Average Value
Number
Average Value
Number
Average Value
Number
Average Value
Number
Average Value
LOANS ORIGINATED
3
$140,983
13
$137,610
15
$134,892
4
$25,550
2
$58,960
APPLICATIONS APPROVED, NOT ACCEPTED
1
$66,390
3
$103,423
2
$109,535
1
$14,330
0
$0
APPLICATIONS DENIED
1
$121,770
3
$74,013
6
$126,047
1
$23,580
0
$0
APPLICATIONS WITHDRAWN
1
$72,500
1
$79,490
3
$98,530
1
$56,430
0
$0
FILES CLOSED FOR INCOMPLETENESS
0
$0
0
$0
2
$77,130
0
$0
0
$0
Aggregated Statistics For Year 1999 (Based on 3 partial tracts)
A) FHA, FSA/RHS & VA Home Purchase Loans
B) Conventional Home Purchase Loans
C) Refinancings
D) Home Improvement Loans
F) Non-occupant Loans on < 5 Family Dwellings (A B C & D)
Detailed PMIC statistics for the following Tracts:0527.00
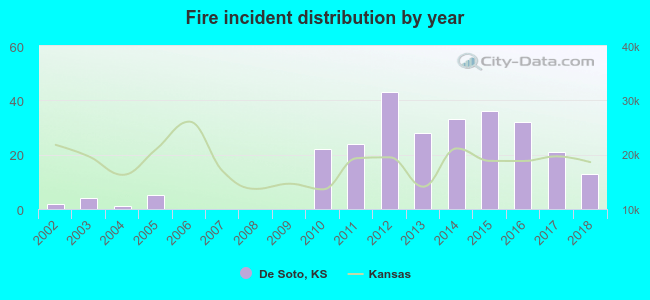
2002 - 2018 National Fire Incident Reporting System (NFIRS) incidents
According to the data from the years 2002 - 2018 the average number of fires per year is 16. The highest number of reported fires - 43 took place in 2012, and the least - 0 in 2006. The data has a rising trend.
When looking into fire subcategories, the most incidents belonged to: Outside Fires (58.0%), and Structure Fires (21.2%).
Fire incident types reported to NFIRS in De Soto, KS
#17 on the list of "Top 101 cities with largest percentage of females in occupations: architecture and engineering occupations (population 5,000+)"
#41 on the list of "Top 101 cities with largest percentage of females in occupations: transportation occupations (population 5,000+)"
#45 on the list of "Top 101 cities with largest percentage of males in occupations: life, physical, and social science occupations (population 5,000+)"
#81 on the list of "Top 101 cities with largest percentage of females in industries: professional, scientific, and technical services (population 5,000+)"
#9 (66019) on the list of "Top 101 zip codes with the largest percentage of Scottish first ancestries"
#9 on the list of "Top 101 counties with the best general health status score of residents (1-5), 3 years of data"
#11 on the list of "Top 101 counties with the highest percentage of residents that visited a dentist within the past year"
#31 on the list of "Top 101 counties with the largest number of people without health insurance coverage in 2000 (pop. 50,000+)"
#33 on the list of "Top 101 counties with the largest number of children under 18 without health insurance coverage in 2000 (pop. 50,000+)"
#36 on the list of "Top 101 counties with the highest percentage of residents that exercised in the past month"


 Recent articles from our blog. Our writers, many of them Ph.D. graduates or candidates, create easy-to-read articles on a wide variety of topics.

 (10.4 miles


 According to the data from the years 2002 - 2018 the average number of fires per year is 16. The highest number of reported fires - 43 took place in 2012, and the least - 0 in 2006. The data has a rising trend.
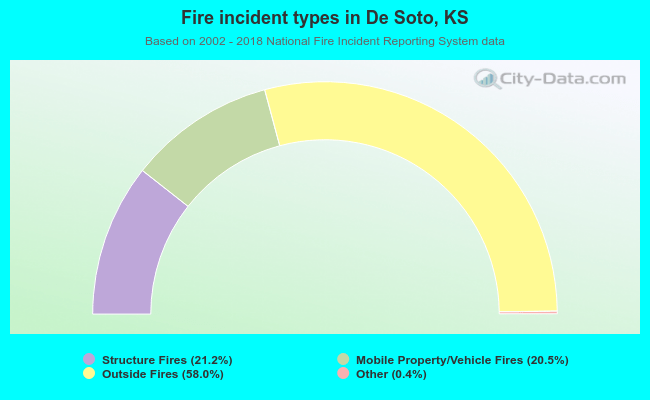 When looking into fire subcategories, the most incidents belonged to: Outside Fires (58.0%), and Structure Fires (21.2%).