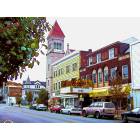
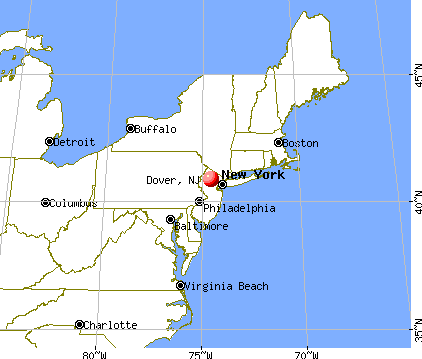
Dover, New Jersey

Submit your own pictures of this town and show them to the world
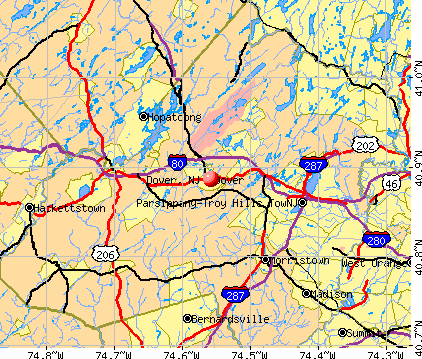
- OSM Map
- General Map
- Google Map
- MSN Map
Population change since 2000: +1.3%
 |
| Males: 8,945 | |
| Females: 9,477 |
| Median resident age: | 39.1 years |
| New Jersey median age: | 40.4 years |
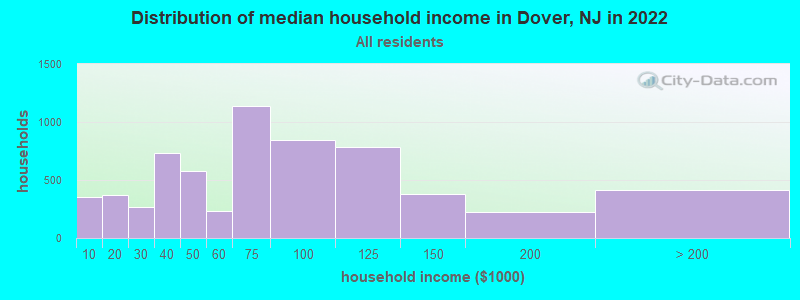
| Dover: | $68,500 |
| NJ: | $96,346 |
Estimated per capita income in 2022: $35,532 (it was $18,056 in 2000)
Dover town income, earnings, and wages data
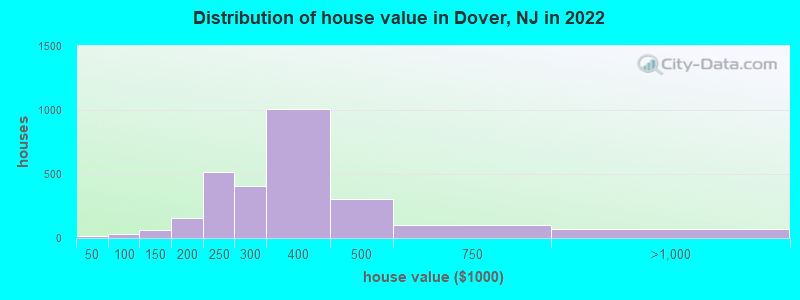
Estimated median house or condo value in 2022: $325,719 (it was $152,300 in 2000)
| Dover: | $325,719 |
| NJ: | $428,900 |
Mean prices in 2022: all housing units: $408,895; detached houses: $418,330; townhouses or other attached units: $415,054; in 2-unit structures: $334,232; in 3-to-4-unit structures: $143,859; in 5-or-more-unit structures: $269,268
Median gross rent in 2022: $1,652.
(12.9% for White Non-Hispanic residents, 23.3% for Black residents, 14.9% for Hispanic or Latino residents, 13.6% for other race residents, 20.6% for two or more races residents)
Detailed information about poverty and poor residents in Dover, NJ

Compare current foreclosures in Dover, NJ:
| Photo | Address | Area | Beds / Baths | Price | Details |
|---|---|---|---|---|---|

|
#1
Victory Ct
Dover, NJ 07801
|
1,090 sq. feet
|
- baths - beds |
show details | |

|
#2
W Dickerson St # 443
Dover, NJ 07801
|
- sq. feet
|
- baths - beds |
show details | |

|
#3
Summer Ave
Dover, NJ 07801
|
912 sq. feet
|
- baths - beds |
show details | |

|
#4
Washington Ave Apt G4
Dover, NJ 07801
|
- sq. feet
|
- baths - beds |
show details | |

|
#5
Debbie Pl
Dover, NJ 07801
|
2,008 sq. feet
|
- baths - beds |
show details | |
|
|
#6
Christopher St
Dover, NJ 07801
|
954 sq. feet
|
- baths - beds |
show details | |

|
#7
Mount Pleasant Ave
Dover, NJ 07801
|
3,220 sq. feet
|
- baths - beds |
show details | |

|
#8
Brook Dr
Dover, NJ 07801
|
1,456 sq. feet
|
- baths - beds |
show details | |

|
#9
E Cooper St
Dover, NJ 07801
|
1,906 sq. feet
|
- baths - beds |
show details | |

|
#10
Audrey Pl
Dover, NJ 07801
|
1,428 sq. feet
|
- baths - beds |
show details |
| Photo | Address | Area | Beds / Baths | Price | Details |
|---|---|---|---|---|---|

|
#11
Curtis St
Dover, NJ 07801
|
912 sq. feet
|
- baths - beds |
show details | |

|
#12
David St
Dover, NJ 07801
|
850 sq. feet
|
- baths - beds |
show details | |

|
#13
Van Nostrand Ave
Dover, NJ 07801
|
- sq. feet
|
- baths - beds |
show details | |

|
#14
W Munson Ave
Dover, NJ 07801
|
1,232 sq. feet
|
- baths - beds |
show details | |

|
#15
Adams Ave
Dover, NJ 07801
|
1,250 sq. feet
|
- baths - beds |
show details | |

|
#16
E Fairview Ave
Dover, NJ 07801
|
2,347 sq. feet
|
- baths - beds |
show details | |

|
#17
Berkshire Ave
Dover, NJ 07801
|
1,624 sq. feet
|
- baths - beds |
show details | |

|
#18
Mount Hope Ave
Dover, NJ 07801
|
1,248 sq. feet
|
- baths - beds |
show details | |

|
#19
Randolph Ave
Dover, NJ 07801
|
2,013 sq. feet
|
- baths - beds |
show details | |

|
#20
S Salem St
Dover, NJ 07801
|
1,722 sq. feet
|
- baths - beds |
show details |
| Photo | Address | Area | Beds / Baths | Price | Details |
|---|---|---|---|---|---|

|
#21
Brook Dr
Dover, NJ 07801
|
1,456 sq. feet
|
- baths - beds |
show details | |

|
#22
N Sussex St
Dover, NJ 07801
|
1,782 sq. feet
|
- baths - beds |
show details | |

|
#23
E Mcfarlan St
Dover, NJ 07801
|
1,339 sq. feet
|
- baths - beds |
show details | |

|
#24
Kearney St
Dover, NJ 07801
|
1,555 sq. feet
|
- baths - beds |
show details | |

|
#25
Schley St
Dover, NJ 07801
|
2,525 sq. feet
|
- baths - beds |
show details | |

|
#26
Audrey Pl
Dover, NJ 07801
|
1,428 sq. feet
|
- baths - beds |
show details | |

|
#27
Summer Ave
Dover, NJ 07801
|
912 sq. feet
|
- baths - beds |
show details | |

|
#28
Berry St
Dover, NJ 07801
|
1,634 sq. feet
|
- baths - beds |
show details | |

|
#29
Trenton St
Dover, NJ 07801
|
1,632 sq. feet
|
- baths - beds |
show details | |

|
#30
Baker St
Dover, NJ 07801
|
2,110 sq. feet
|
- baths - beds |
show details |
| Photo | Address | Area | Beds / Baths | Price | Details |
|---|---|---|---|---|---|

|
#31
Perry St
Dover, NJ 07801
|
1,520 sq. feet
|
- baths - beds |
show details | |

|
#32
Herrick Dr
Dover, NJ 07801
|
1,247 sq. feet
|
- baths - beds |
show details | |

|
#33
Perry St
Dover, NJ 07801
|
1,648 sq. feet
|
- baths - beds |
show details | |

|
#34
W Clinton St
Dover, NJ 07801
|
2,038 sq. feet
|
- baths - beds |
show details | |

|
#35
Liberty St
Dover, NJ 07801
|
1,227 sq. feet
|
- baths - beds |
show details | |

|
#36
Goodale Ave
Dover, NJ 07801
|
1,338 sq. feet
|
- baths - beds |
show details | |

|
#37
W Chrystal St
Dover, NJ 07801
|
1,447 sq. feet
|
- baths - beds |
show details | |

|
#38
Oak St
Dover, NJ 07801
|
- sq. feet
|
- baths - beds |
show details | |

|
Check over 1 million property listings on Foreclosure.com!
|
browse all offers | |||


- 14,04975.9%Hispanic
- 2,61414.1%White alone
- 1,1386.1%Black alone
- 9395.1%Other race alone
- 3571.9%Asian alone
- 2401.3%Two or more races
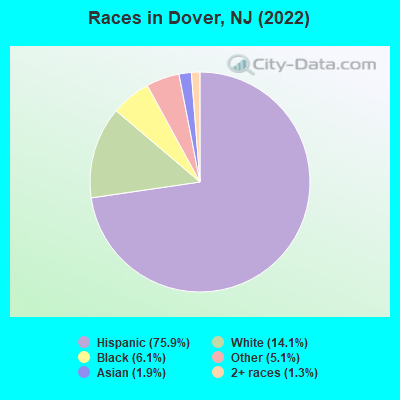
Races in Dover detailed stats: ancestries, foreign born residents, place of birth
According to our research of New Jersey and other state lists, there were 11 registered sex offenders living in Dover, New Jersey as of June 16, 2024.
The ratio of all residents to sex offenders in Dover is 1,666 to 1.
The ratio of registered sex offenders to all residents in this city is near the state average.
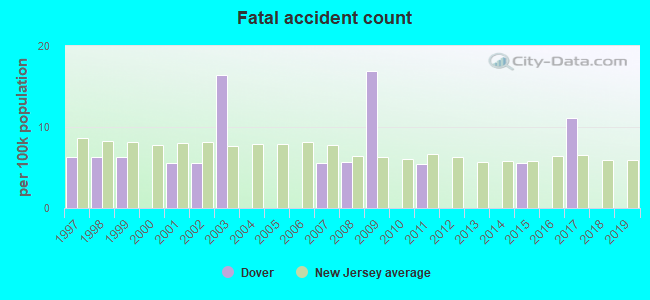
Type |
2009 |
2010 |
2011 |
2012 |
2013 |
2014 |
2015 |
2016 |
2017 |
2018 |
2019 |
2020 |
2022 |
|---|---|---|---|---|---|---|---|---|---|---|---|---|---|
| Murders (per 100,000) | 0 (0.0) | 0 (0.0) | 1 (5.5) | 0 (0.0) | 0 (0.0) | 1 (5.4) | 0 (0.0) | 0 (0.0) | 0 (0.0) | 0 (0.0) | 0 (0.0) | 1 (5.7) | 0 (0.0) |
| Rapes (per 100,000) | 6 (33.7) | 1 (5.5) | 2 (11.0) | 1 (5.5) | 1 (5.4) | 0 (0.0) | 0 (0.0) | 3 (16.4) | 0 (0.0) | 1 (5.6) | 2 (11.2) | 2 (11.3) | 4 (21.7) |
| Robberies (per 100,000) | 19 (106.6) | 13 (71.6) | 28 (153.7) | 24 (130.8) | 15 (81.7) | 16 (86.9) | 15 (81.7) | 16 (87.5) | 14 (76.3) | 10 (55.6) | 11 (61.6) | 7 (39.7) | 7 (38.0) |
| Assaults (per 100,000) | 18 (101.0) | 22 (121.2) | 20 (109.8) | 22 (119.9) | 12 (65.4) | 21 (114.0) | 15 (81.7) | 15 (82.0) | 15 (81.8) | 15 (83.4) | 27 (151.2) | 14 (79.3) | 21 (113.9) |
| Burglaries (per 100,000) | 93 (521.7) | 93 (512.2) | 84 (461.1) | 82 (446.9) | 71 (386.9) | 56 (304.0) | 44 (239.7) | 43 (235.1) | 31 (169.0) | 32 (178.0) | 49 (274.5) | 19 (107.6) | 13 (70.5) |
| Thefts (per 100,000) | 239 (1,341) | 222 (1,223) | 302 (1,658) | 236 (1,286) | 215 (1,172) | 189 (1,026) | 186 (1,013) | 168 (918.5) | 139 (757.9) | 141 (784.1) | 94 (526.6) | 72 (407.8) | 67 (363.5) |
| Auto thefts (per 100,000) | 26 (145.8) | 22 (121.2) | 13 (71.4) | 13 (70.9) | 11 (59.9) | 14 (76.0) | 17 (92.6) | 15 (82.0) | 20 (109.1) | 14 (77.9) | 14 (78.4) | 10 (56.6) | 11 (59.7) |
| Arson (per 100,000) | 1 (5.6) | 0 (0.0) | 0 (0.0) | 0 (0.0) | 0 (0.0) | 0 (0.0) | 0 (0.0) | 0 (0.0) | 0 (0.0) | 1 (5.6) | 1 (5.6) | 3 (17.0) | 0 (0.0) |
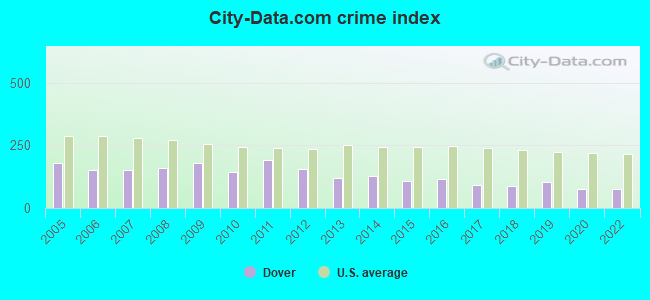
| City-Data.com crime index | 180.9 | 144.6 | 192.1 | 156.0 | 120.7 | 128.1 | 105.6 | 115.5 | 90.1 | 87.9 | 104.2 | 76.5 | 75.8 |
The City-Data.com crime index weighs serious crimes and violent crimes more heavily. Higher means more crime, U.S. average is 246.1. It adjusts for the number of visitors and daily workers commuting into cities.
Crime rate in Dover detailed stats: murders, rapes, robberies, assaults, burglaries, thefts, arson
Full-time law enforcement employees in 2021, including police officers: 38 (34 officers - 34 male; 0 female).
| Officers per 1,000 residents here: | 1.86 |
| New Jersey average: | 5.53 |
 Recent articles from our blog. Our writers, many of them Ph.D. graduates or candidates, create easy-to-read articles on a wide variety of topics.

 | poop just go real! dover nj has a hipster coffee shop (6 replies) |
| What is the next up and coming area/town? (36 replies) |
| Relocation to Dover NJ near Rockaway Mall (5 replies) |
| Hopatcong2021 (38 replies) |
| ANyone returned to NJ from the South? (173 replies) |
| Best areas to live in north jersey for young people (48 replies) |
Latest news from Dover, NJ collected exclusively by city-data.com from local newspapers, TV, and radio stations
Ancestries: Jamaican (1.7%), Italian (1.4%).
Current Local Time: EST time zone
Incorporated in 1869
Elevation: 800 feet
Land area: 2.68 square miles.
Population density: 6,875 people per square mile (high).
9,382 residents are foreign born (46.9% Latin America).
| This town: | 50.7% |
| New Jersey: | 23.2% |
Median real estate property taxes paid for housing units with mortgages in 2022: $6,770 (2.0%)
Median real estate property taxes paid for housing units with no mortgage in 2022: $6,489 (2.1%)
Nearest city with pop. 50,000+: Wayne, NJ  (16.6 miles , pop. 54,069).
Nearest city with pop. 200,000+: Newark, NJ (22.1 miles , pop. 273,546).
Nearest city with pop. 1,000,000+: Manhattan, NY (31.6 miles , pop. 1,537,195).
Nearest cities:
), ), ), ), ), )Latitude: 40.89 N, Longitude: 74.56 W
Daytime population change due to commuting: -2,131 (-11.5%)
Workers who live and work in this town: 3,053 (30.7%)
Area code: 973

Dover, New Jersey accommodation & food services, waste management - Economy and Business Data
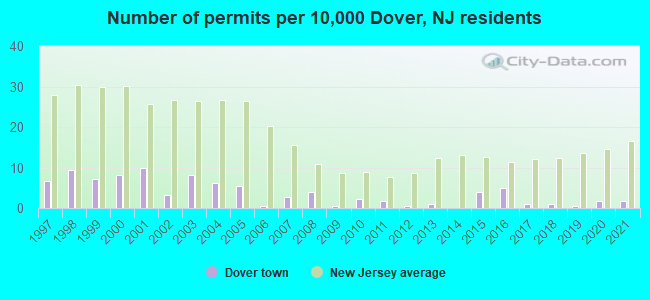
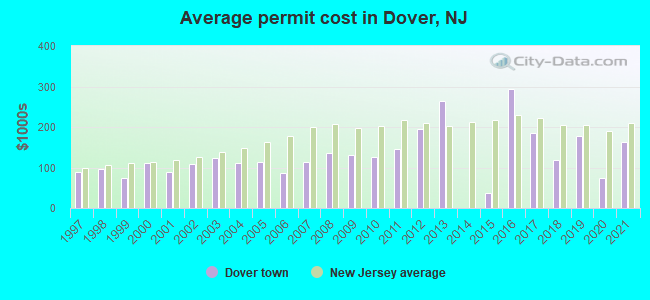
Single-family new house construction building permits:
- 2021: 3 buildings, average cost: $161,500
- 2020: 3 buildings, average cost: $73,700
- 2019: 1 building, cost: $178,100
- 2018: 2 buildings, average cost: $118,300
- 2017: 2 buildings, average cost: $185,000
- 2016: 9 buildings, average cost: $292,600
- 2015: 7 buildings, average cost: $36,900
- 2013: 2 buildings, average cost: $265,100
- 2012: 1 building, cost: $195,000
- 2011: 3 buildings, average cost: $145,900
- 2010: 4 buildings, average cost: $125,100
- 2009: 1 building, cost: $130,900
- 2008: 7 buildings, average cost: $134,800
- 2007: 5 buildings, average cost: $113,400
- 2006: 1 building, cost: $86,500
- 2005: 10 buildings, average cost: $114,300
- 2004: 11 buildings, average cost: $112,400
- 2003: 15 buildings, average cost: $123,300
- 2002: 6 buildings, average cost: $108,300
- 2001: 18 buildings, average cost: $88,100
- 2000: 15 buildings, average cost: $112,000
- 1999: 13 buildings, average cost: $73,700
- 1998: 17 buildings, average cost: $96,900
- 1997: 12 buildings, average cost: $88,000
| Here: | 3.6% |
| New Jersey: | 4.5% |
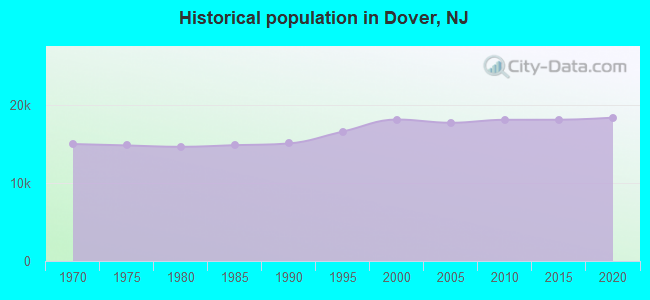
Population change in the 1990s: +2,510 (+16.0%).
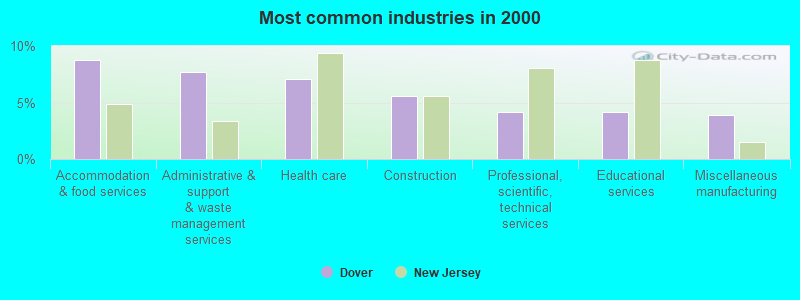
- Accommodation & food services (8.8%)
- Administrative & support & waste management services (7.7%)
- Health care (7.1%)
- Construction (5.6%)
- Professional, scientific, technical services (4.2%)
- Educational services (4.2%)
- Miscellaneous manufacturing (3.9%)
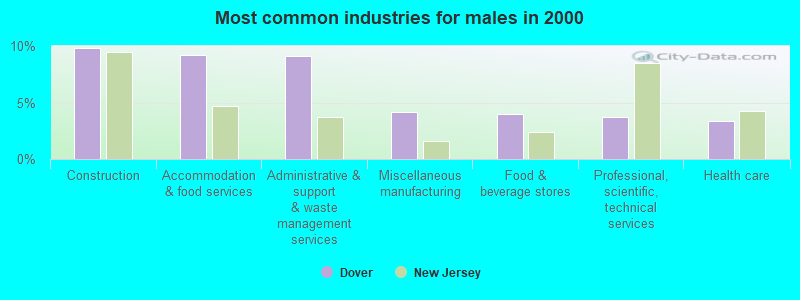
- Construction (9.8%)
- Accommodation & food services (9.2%)
- Administrative & support & waste management services (9.2%)
- Miscellaneous manufacturing (4.2%)
- Food & beverage stores (4.0%)
- Professional, scientific, technical services (3.7%)
- Health care (3.3%)
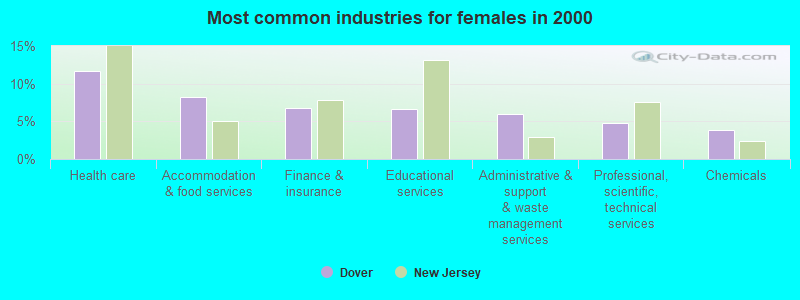
- Health care (11.6%)
- Accommodation & food services (8.2%)
- Finance & insurance (6.7%)
- Educational services (6.6%)
- Administrative & support & waste management services (6.0%)
- Professional, scientific, technical services (4.8%)
- Chemicals (3.9%)
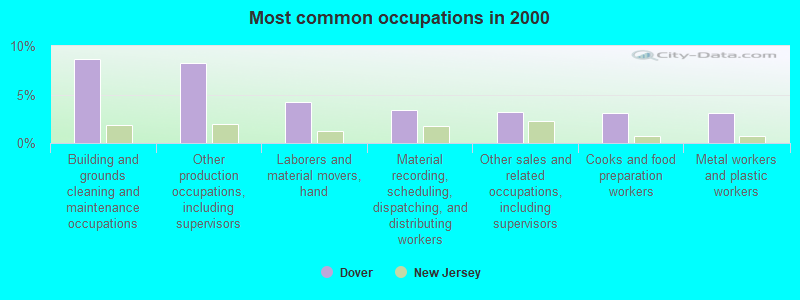
- Building and grounds cleaning and maintenance occupations (8.7%)
- Other production occupations, including supervisors (8.2%)
- Laborers and material movers, hand (4.3%)
- Material recording, scheduling, dispatching, and distributing workers (3.4%)
- Other sales and related occupations, including supervisors (3.2%)
- Cooks and food preparation workers (3.1%)
- Metal workers and plastic workers (3.1%)
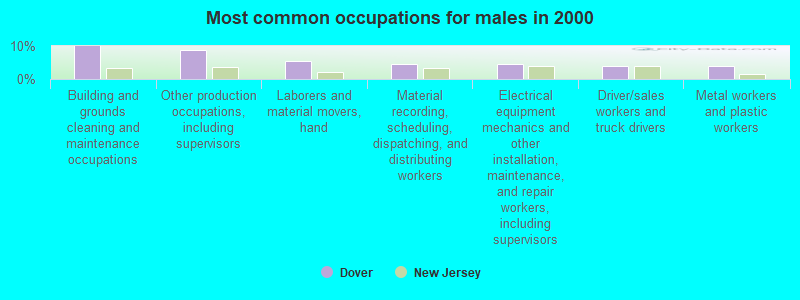
- Building and grounds cleaning and maintenance occupations (10.0%)
- Other production occupations, including supervisors (8.8%)
- Laborers and material movers, hand (5.5%)
- Material recording, scheduling, dispatching, and distributing workers (4.6%)
- Electrical equipment mechanics and other installation, maintenance, and repair workers, including supervisors (4.5%)
- Driver/sales workers and truck drivers (4.1%)
- Metal workers and plastic workers (3.8%)
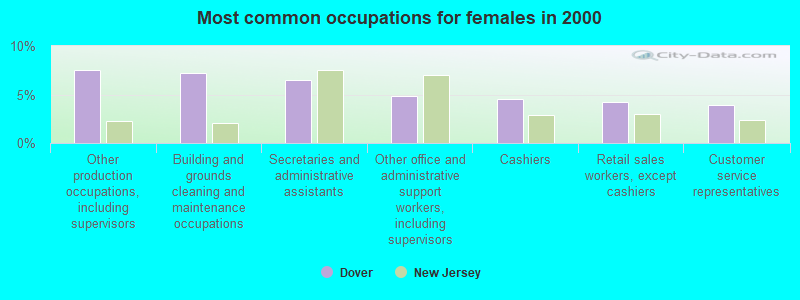
- Other production occupations, including supervisors (7.5%)
- Building and grounds cleaning and maintenance occupations (7.2%)
- Secretaries and administrative assistants (6.5%)
- Other office and administrative support workers, including supervisors (4.9%)
- Cashiers (4.5%)
- Retail sales workers, except cashiers (4.2%)
- Customer service representatives (3.9%)
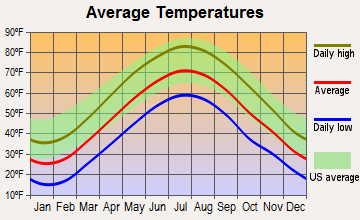
Average climate in Dover, New Jersey
Based on data reported by over 4,000 weather stations


(lower is better)
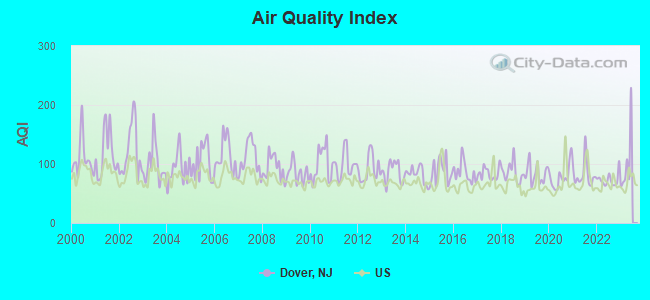
Air Quality Index (AQI) level in 2022 was 73.1. This is about average.
| City: | 73.1 |
| U.S.: | 72.6 |
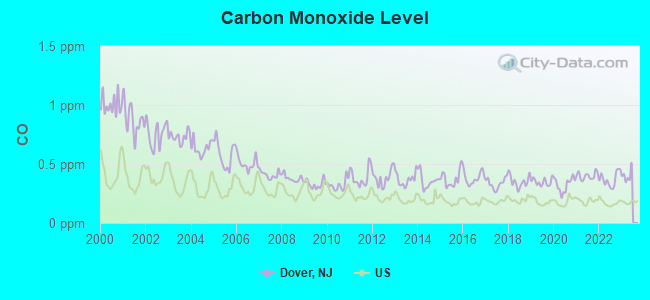
Carbon Monoxide (CO) [ppm] level in 2022 was 0.369. This is significantly worse than average. Closest monitor was 7.3 miles away from the city center.
| City: | 0.369 |
| U.S.: | 0.251 |
Nitrogen Dioxide (NO2) [ppb] level in 2022 was 5.92. This is about average. Closest monitor was 9.2 miles away from the city center.
| City: | 5.92 |
| U.S.: | 5.11 |
Sulfur Dioxide (SO2) [ppb] level in 2022 was 0.549. This is significantly better than average. Closest monitor was 7.3 miles away from the city center.
| City: | 0.549 |
| U.S.: | 1.515 |
Ozone [ppb] level in 2022 was 32.3. This is about average. Closest monitor was 9.2 miles away from the city center.
| City: | 32.3 |
| U.S.: | 33.3 |
Particulate Matter (PM2.5) [µg/m3] level in 2022 was 8.08. This is about average. Closest monitor was 7.0 miles away from the city center.
| City: | 8.08 |
| U.S.: | 8.11 |
Tornado activity:
Dover-area historical tornado activity is near New Jersey state average. It is 28% smaller than the overall U.S. average.
On 5/28/1973, a category F3 (max. wind speeds 158-206 mph) tornado 6.7 miles away from the Dover town center caused between $50,000 and $500,000 in damages.
On 5/28/1973, a category F3 tornado 8.8 miles away from the town center injured 12 people and caused between $50,000 and $500,000 in damages.
Earthquake activity:
Dover-area historical earthquake activity is significantly above New Jersey state average. It is 67% smaller than the overall U.S. average.On 8/23/2011 at 17:51:04, a magnitude 5.8 (5.8 MW, Depth: 3.7 mi, Class: Moderate, Intensity: VI - VII) earthquake occurred 273.8 miles away from Dover center
On 10/7/1983 at 10:18:46, a magnitude 5.3 (5.1 MB, 5.3 LG, 5.1 ML) earthquake occurred 212.4 miles away from the city center
On 1/16/1994 at 01:49:16, a magnitude 4.6 (4.6 MB, 4.6 LG, Depth: 3.1 mi, Class: Light, Intensity: IV - V) earthquake occurred 86.6 miles away from the city center
On 4/20/2002 at 10:50:47, a magnitude 5.3 (5.3 ML, Depth: 3.0 mi) earthquake occurred 254.6 miles away from Dover center
On 4/20/2002 at 10:50:47, a magnitude 5.2 (5.2 MB, 4.2 MS, 5.2 MW, 5.0 MW) earthquake occurred 252.7 miles away from the city center
On 1/16/1994 at 00:42:43, a magnitude 4.2 (4.2 MB, 4.0 LG, Depth: 3.1 mi) earthquake occurred 85.3 miles away from the city center
Magnitude types: regional Lg-wave magnitude (LG), body-wave magnitude (MB), local magnitude (ML), surface-wave magnitude (MS), moment magnitude (MW)
Natural disasters:
The number of natural disasters in Morris County (29) is a lot greater than the US average (15).Major Disasters (Presidential) Declared: 19
Emergencies Declared: 9
Causes of natural disasters: Floods: 8, Hurricanes: 7, Storms: 7, Snowstorms: 4, Heavy Rains: 3, Winter Storms: 3, Blizzards: 2, Water Shortages: 2, Mudslide: 1, Tornado: 1, Tropical Storm: 1, Wind: 1, Other: 3 (Note: some incidents may be assigned to more than one category).

Hospitals and medical centers in Dover:
College/University in Dover:
Colleges/universities with over 2000 students nearest to Dover:
- County College of Morris (about 3 miles; Randolph, NJ; Full-time enrollment: 6,427)
- Fairleigh Dickinson University-College at Florham (about 10 miles; Madison, NJ; FT enrollment: 2,690)
- Drew University (about 12 miles; Madison, NJ; FT enrollment: 2,272)
- Centenary College (about 15 miles; Hackettstown, NJ; FT enrollment: 2,271)
- Sussex County Community College (about 17 miles; Newton, NJ; FT enrollment: 2,402)
- Montclair State University (about 19 miles; Montclair, NJ; FT enrollment: 16,277)
- Seton Hall University (about 19 miles; South Orange, NJ; FT enrollment: 7,742)
Public high school in Dover:
- DOVER HIGH SCHOOL (Students: 880, Location: 100 GRACE STREET, Grades: 9-12)
Public elementary/middle schools in Dover:
- NORTH DOVER ELEMENTARY SCHOOL (Students: 530, Location: 51 HIGHLAND AVENUE, Grades: PK-6)
- EAST DOVER ELEMENTARY SCHOOL (Students: 496, Location: 302 EAST MCFARLAN STREET, Grades: KG-6)
- DOVER MIDDLE SCHOOL (Students: 489, Location: 302 EAST MCFARLAN STREET, Grades: 7-8)
- ACADEMY STREET ELEMENTARY SCHOOL (Students: 481, Location: 14 ACADEMY STREET, Grades: PK-6)
- BIRCHWOOD ELEMENTARY SCHOOL (Students: 374, Location: 1 ART STREET, Grades: KG-5)
- DENNIS B O'BRIEN ELEMENTARY SCHOOL (Students: 347, Location: 16 MINERAL SPRING DRIVE, Grades: PK-5)
Points of interest:
Notable location: Town of Dover Fire Department (A). Display/hide its location on the map
Churches in Dover include: Chapel In the Hills (A), Dover Spanish Seventh Day Adventist Church (B), First Pentecostal Church of Dover (C), First Presbyterian Church (D), First United Methodist Church (E), Founders Baptist Church (F), Grace United Methodist Church (G), Holy Rosary Church (H), Saint John's Episcopal Church (I). Display/hide their locations on the map
Cemeteries: Orchard Street Cemetery (1), Locust Hill Cemetery (2). Display/hide their locations on the map
Lakes: Brownwood Pond (A), Bowlby Pond (B). Display/hide their locations on the map
Streams, rivers, and creeks: Jackson Brook (A), Spring Brook (B). Display/hide their locations on the map
Tourist attraction: Community Children's Museum (77 East Blackwell Street).
Birthplace of: Sidney Mintz - Anthropologist, Drew Miller - Ice hockey player, X. J. Kennedy - Educator, Lois Barker - Baseball player, Mike Leach (long snapper) - Football player, Ben Loory - Short fiction writer, Carl Anderson (art director) - Art director, Jacque MacKinnon - Football player, Jesse Selengut - Jazz trumpeter, John Costanza - Artist and letterer.
Drinking water stations with addresses in Dover and their reported violations in the past:
DOVER WATER COMMISSION (Population served: 27,806, Groundwater):Past health violations:SPARTAN MART (Population served: 125, Groundwater):Past monitoring violations:
- MCL, Monthly (TCR) - In DEC-2013, Contaminant: Coliform. Follow-up actions: St Public Notif requested (DEC-31-2013), St Formal NOV issued (DEC-31-2013), St Compliance achieved (JAN-21-2014)
- MCL, Monthly (TCR) - In SEP-2007, Contaminant: Coliform. Follow-up actions: St Public Notif received (SEP-19-2007), St Compliance achieved (OCT-10-2007), St Public Notif requested (OCT-17-2007), St Formal NOV issued (OCT-17-2007)
- MCL, Monthly (TCR) - In JUN-2006, Contaminant: Coliform. Follow-up actions: St Public Notif requested (JUL-12-2006), St Formal NOV issued (JUL-12-2006), St Public Notif received (JUL-13-2006), St Compliance achieved (JUL-31-2006)
- MCL, Monthly (TCR) - In JUN-2005, Contaminant: Coliform. Follow-up actions: St Public Notif requested (AUG-04-2005), St Formal NOV issued (AUG-04-2005), St Public Notif received (AUG-15-2005), St Compliance achieved (2 times from AUG-30-2005 to AUG-31-2005)
- Monitoring and Reporting (DBP) - Between JAN-2008 and MAR-2008, Contaminant: Total Haloacetic Acids (HAA5). Follow-up actions: St Compliance achieved (JUN-04-2008), St Public Notif requested (DEC-02-2009), St Formal NOV issued (DEC-02-2009)
- Monitoring and Reporting (DBP) - Between JAN-2008 and MAR-2008, Contaminant: TTHM. Follow-up actions: St Compliance achieved (JUN-04-2008), St Public Notif requested (DEC-02-2009), St Formal NOV issued (DEC-02-2009)
- Monitoring and Reporting (DBP) - Between OCT-2007 and DEC-2007, Contaminant: Total Haloacetic Acids (HAA5). Follow-up actions: St Compliance achieved (JUN-04-2008), St Public Notif requested (DEC-02-2009), St Formal NOV issued (DEC-02-2009)
- Monitoring and Reporting (DBP) - Between OCT-2007 and DEC-2007, Contaminant: TTHM. Follow-up actions: St Compliance achieved (JUN-04-2008), St Public Notif requested (DEC-02-2009), St Formal NOV issued (DEC-02-2009)
- Monitoring and Reporting (DBP) - Between JUL-2007 and SEP-2007, Contaminant: Total Haloacetic Acids (HAA5). Follow-up actions: St Compliance achieved (JUN-04-2008), St Public Notif requested (DEC-02-2009), St Formal NOV issued (DEC-02-2009)
- One minor monitoring violation
- 73 regular monitoring violations
- 5 other older monitoring violations
Past health violations:HOFFMAN HOMES (Population served: 120, Groundwater):
- MCL, Monthly (TCR) - In JUN-2011, Contaminant: Coliform. Follow-up actions: St Public Notif requested (JUL-06-2011), St Formal NOV issued (JUL-06-2011), St Public Notif received (JUL-07-2011), St Compliance achieved (JUL-15-2011)
Past monitoring violations:SUCCASUNNA PLAZA (Population served: 66, Groundwater):
- One minor monitoring violation
- One regular monitoring violation
Past monitoring violations:
- 2 routine major monitoring violations
- One regular monitoring violation
| This town: | 3.2 people |
| New Jersey: | 2.7 people |
| This town: | 69.7% |
| Whole state: | 69.3% |
| This town: | 8.8% |
| Whole state: | 5.9% |
Likely homosexual households (counted as self-reported same-sex unmarried-partner households)
- Lesbian couples: 0.3% of all households
- Gay men: 0.4% of all households
People in group quarters in Dover in 2010:
- 155 people in nursing facilities/skilled-nursing facilities
- 68 people in other noninstitutional facilities
- 25 people in hospitals with patients who have no usual home elsewhere
- 22 people in group homes intended for adults
- 14 people in college/university student housing
People in group quarters in Dover in 2000:
- 252 people in nursing homes
- 37 people in other noninstitutional group quarters
- 16 people in homes for the mentally ill
- 6 people in religious group quarters
- 3 people in other nonhousehold living situations
- 2 people in homes for the mentally retarded
Banks with branches in Dover (2011 data):
- Bank of America, National Association: Dover Branch at 15 West Blackwell Street, branch established on 1901/01/01; Dover Drive-Up Branch at Clinton And Pequannock Streets, branch established on 1957/09/11. Info updated 2009/11/18: Bank assets: $1,451,969.3 mil, Deposits: $1,077,176.8 mil, headquarters in Charlotte, NC, positive income, 5782 total offices, Holding Company: Bank Of America Corporation
- JPMorgan Chase Bank, National Association: Clinton Street Branch at 1 East Clinton Street, branch established on 1962/05/07. Info updated 2011/11/10: Bank assets: $1,811,678.0 mil, Deposits: $1,190,738.0 mil, headquarters in Columbus, OH, positive income, International Specialization, 5577 total offices, Holding Company: Jpmorgan Chase & Co.
- Wells Fargo Bank, National Association: Dover Branch at 401 Route 46, branch established on 1971/01/09. Info updated 2011/04/05: Bank assets: $1,161,490.0 mil, Deposits: $905,653.0 mil, headquarters in Sioux Falls, SD, positive income, 6395 total offices, Holding Company: Wells Fargo & Company
- Valley National Bank: 100 E Blackwell St Branch at 100 E Blackwell St, branch established on 1925/01/01. Info updated 2012/01/10: Bank assets: $14,186.7 mil, Deposits: $9,715.7 mil, headquarters in Wayne, NJ, positive income, Commercial Lending Specialization, 219 total offices, Holding Company: Valley National Bancorp
- The Provident Bank: Dover Branch at 340 Route 46 East, branch established on 1997/06/30. Info updated 2010/07/27: Bank assets: $7,097.5 mil, Deposits: $5,186.9 mil, headquarters in Jersey City, NJ, positive income, Commercial Lending Specialization, 83 total offices, Holding Company: Provident Financial Services, Inc.
- TD Bank, National Association: Rockaway Branch at 326 Mt. Hope Avenue, branch established on 2004/01/17. Info updated 2010/10/04: Bank assets: $188,912.6 mil, Deposits: $153,149.8 mil, headquarters in Wilmington, DE, positive income, 1314 total offices, Holding Company: Toronto-Dominion Bank, The
- Sovereign Bank, National Association: 1 Basset Highway Branch at 1 Basset Highway, branch established on 1923/01/01. Info updated 2012/01/31: Bank assets: $78,146.9 mil, Deposits: $48,042.9 mil, headquarters in Wilmington, DE, positive income, Commercial Lending Specialization, 718 total offices, Holding Company: Banco Santander, S.A.
For population 15 years and over in Dover:
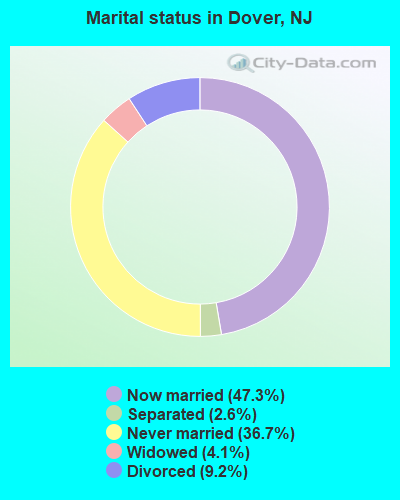
- Never married: 36.7%
- Now married: 47.3%
- Separated: 2.6%
- Widowed: 4.1%
- Divorced: 9.2%
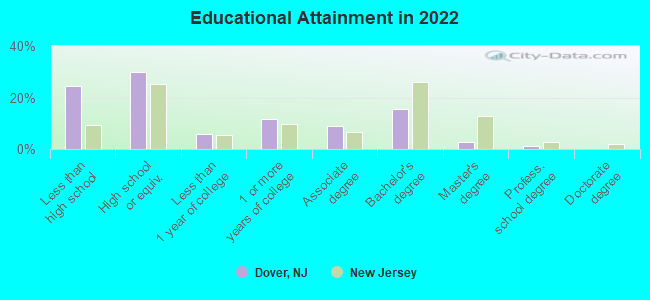
For population 25 years and over in Dover:
- High school or higher: 74.0%
- Bachelor's degree or higher: 18.1%
- Graduate or professional degree: 3.7%
- Unemployed: 7.4%
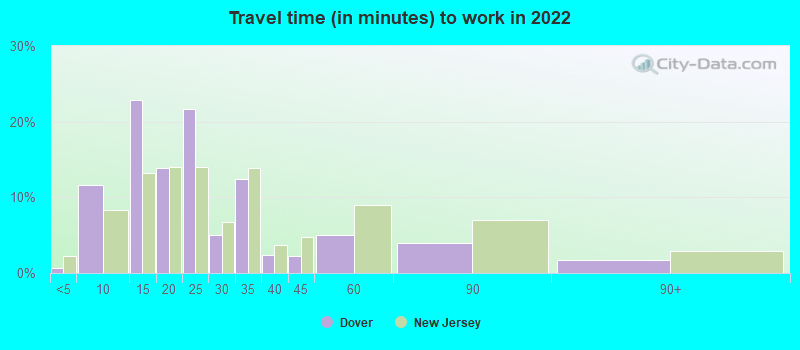
- Mean travel time to work (commute): 22.8 minutes
| Here: | 16.8 |
| New Jersey average: | 12.8 |
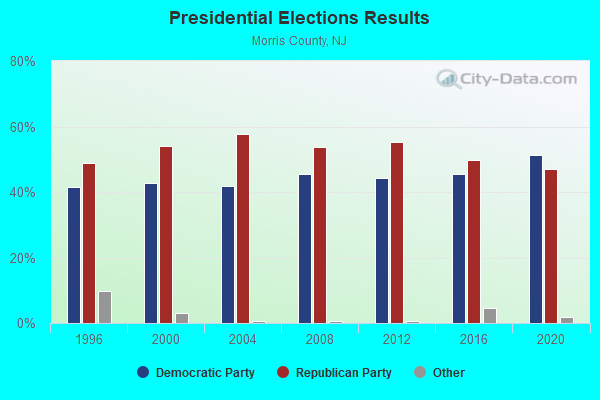
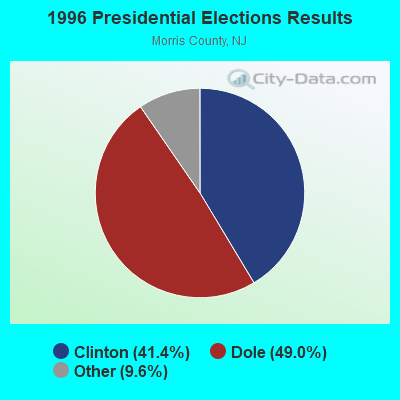
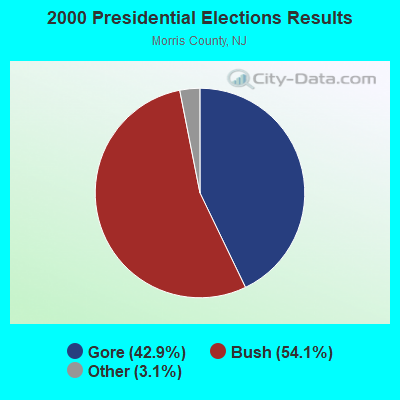
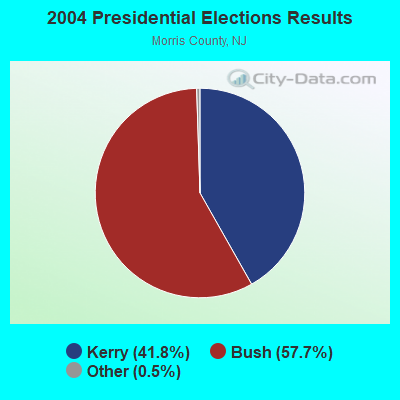
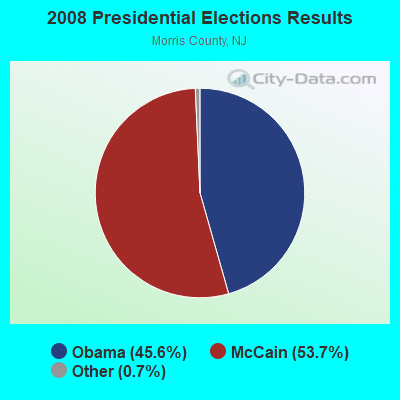
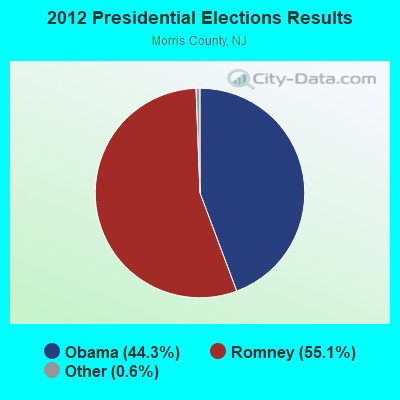
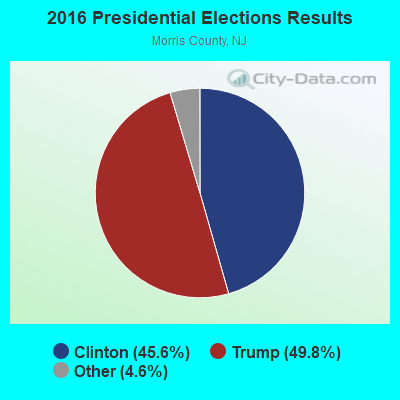
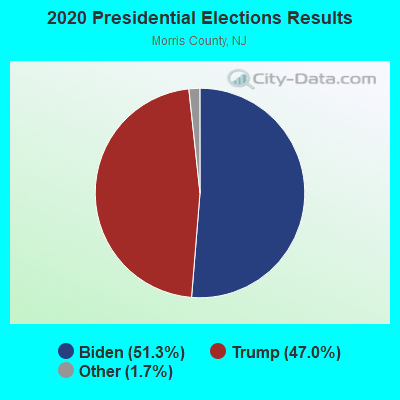
Graphs represent county-level data. Detailed 2008 Election Results
Religion statistics for Dover, NJ (based on Morris County data)
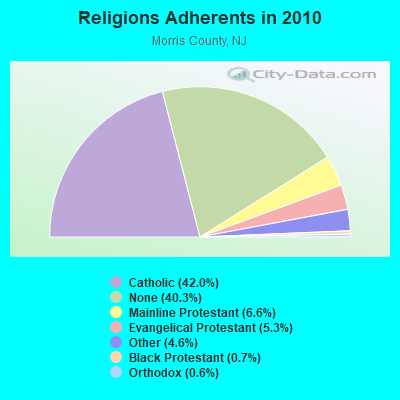
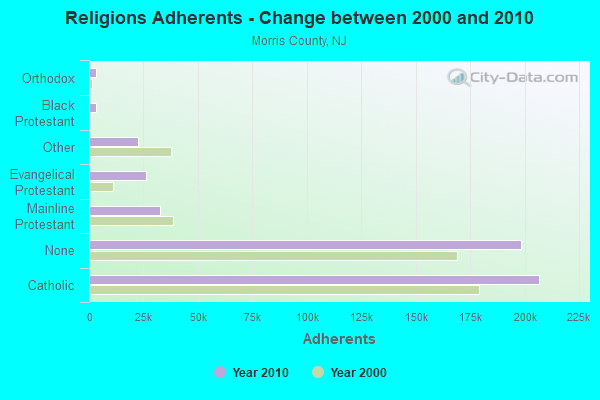
| Religion | Adherents | Congregations |
|---|---|---|
| Catholic | 206,700 | 49 |
| Mainline Protestant | 32,353 | 111 |
| Evangelical Protestant | 25,971 | 94 |
| Other | 22,414 | 43 |
| Black Protestant | 3,281 | 7 |
| Orthodox | 3,145 | 6 |
| None | 198,412 | - |
Food Environment Statistics:
| This county: | 2.12 / 10,000 pop. |
| New Jersey: | 2.90 / 10,000 pop. |
| Here: | 0.10 / 10,000 pop. |
| State: | 0.06 / 10,000 pop. |
| Here: | 1.13 / 10,000 pop. |
| State: | 1.76 / 10,000 pop. |
| Here: | 0.88 / 10,000 pop. |
| New Jersey: | 0.81 / 10,000 pop. |
| This county: | 8.80 / 10,000 pop. |
| New Jersey: | 7.15 / 10,000 pop. |
| Morris County: | 7.3% |
| New Jersey: | 8.3% |
| Morris County: | 20.4% |
| State: | 23.3% |
| Morris County: | 20.1% |
| New Jersey: | 18.0% |
Health and Nutrition:
| Dover: | 48.0% |
| New Jersey: | 50.6% |
| This city: | 47.9% |
| New Jersey: | 48.5% |
| Here: | 28.4 |
| New Jersey: | 28.5 |
| Dover: | 19.8% |
| State: | 20.0% |
| Dover: | 9.8% |
| New Jersey: | 11.1% |
| Here: | 6.8 |
| New Jersey: | 6.8 |
| Dover: | 32.3% |
| New Jersey: | 33.6% |
| Dover: | 56.3% |
| New Jersey: | 56.9% |
| This city: | 81.5% |
| New Jersey: | 80.0% |
More about Health and Nutrition of Dover, NJ Residents
| Local government employment and payroll (March 2022) | |||||
| Function | Full-time employees | Monthly full-time payroll | Average yearly full-time wage | Part-time employees | Monthly part-time payroll |
|---|---|---|---|---|---|
| Police Protection - Officers | 36 | $376,267 | $125,422 | 3 | $6,955 |
| Streets and Highways | 18 | $104,674 | $69,783 | 1 | $2,613 |
| Water Supply | 10 | $56,513 | $67,816 | 1 | $2,329 |
| Firefighters | 9 | $105,573 | $140,764 | 1 | $1,093 |
| Judicial and Legal | 8 | $45,935 | $68,903 | 1 | $1,778 |
| Financial Administration | 6 | $40,606 | $81,212 | 0 | $0 |
| Police - Other | 5 | $10,801 | $25,922 | 12 | $20,216 |
| Sewerage | 4 | $23,507 | $70,521 | 0 | $0 |
| Solid Waste Management | 4 | $26,744 | $80,232 | 0 | $0 |
| Other Government Administration | 4 | $38,752 | $116,256 | 0 | $0 |
| Parks and Recreation | 3 | $22,448 | $89,792 | 1 | $910 |
| Local Libraries | 3 | $14,889 | $59,556 | 7 | $18,613 |
| Other and Unallocable | 3 | $18,195 | $72,780 | 3 | $6,913 |
| Health | 3 | $11,373 | $45,492 | 2 | $3,170 |
| Welfare | 1 | $3,824 | $45,888 | 0 | $0 |
| Totals for Government | 117 | $900,100 | $92,318 | 32 | $64,591 |
Dover government finances - Expenditure in 2021 (per resident):
- Construction - General Public Buildings: $21,716,000 ($1178.81)
Regular Highways: $1,120,000 ($60.80)
Water Utilities: $172,000 ($9.34)
Parks and Recreation: $24,000 ($1.30)
Parking Facilities: $5,000 ($0.27)
- Current Operations - General - Other: $6,697,000 ($363.53)
Police Protection: $4,508,000 ($244.71)
Housing and Community Development: $2,831,000 ($153.67)
Solid Waste Management: $1,085,000 ($58.90)
Water Utilities: $1,052,000 ($57.11)
Regular Highways: $961,000 ($52.17)
Central Staff Services: $716,000 ($38.87)
Judicial and Legal Services: $707,000 ($38.38)
Local Fire Protection: $697,000 ($37.84)
Libraries: $439,000 ($23.83)
Financial Administration: $414,000 ($22.47)
Health - Other: $255,000 ($13.84)
Parking Facilities: $221,000 ($12.00)
Sewerage: $195,000 ($10.59)
Parks and Recreation: $192,000 ($10.42)
Protective Inspection and Regulation - Other: $183,000 ($9.93)
General Public Buildings: $139,000 ($7.55)
Transit Utilities: $47,000 ($2.55)
Natural Resources - Other: $19,000 ($1.03)
- General - Interest on Debt: $45,000 ($2.44)
- Intergovernmental to Local - Other - General - Other: $179,000 ($9.72)
Other - Housing and Community Development: $6,000 ($0.33)
- Other Capital Outlay - Health - Other: $2,244,000 ($121.81)
Water Utilities: $1,237,000 ($67.15)
Local Fire Protection: $706,000 ($38.32)
Solid Waste Management: $525,000 ($28.50)
Police Protection: $108,000 ($5.86)
Sewerage: $57,000 ($3.09)
Central Staff Services: $45,000 ($2.44)
Housing and Community Development: $34,000 ($1.85)
Parks and Recreation: $30,000 ($1.63)
Parking Facilities: $24,000 ($1.30)
- Total Salaries and Wages: $9,421,000 ($511.40)
- Water Utilities - Interest on Debt: $588,000 ($31.92)
Dover government finances - Revenue in 2021 (per resident):
- Charges - Sewerage: $1,562,000 ($84.79)
Housing and Community Development: $265,000 ($14.38)
Parking Facilities: $263,000 ($14.28)
Other: $42,000 ($2.28)
- Federal Intergovernmental - Housing and Community Development: $2,469,000 ($134.02)
- Local Intergovernmental - Other: $293,000 ($15.90)
General Local Government Support: $181,000 ($9.83)
Public Welfare: $33,000 ($1.79)
- Miscellaneous - General Revenue - Other: $1,061,000 ($57.59)
Fines and Forfeits: $366,000 ($19.87)
Rents: $106,000 ($5.75)
Interest Earnings: $28,000 ($1.52)
- Revenue - Water Utilities: $3,432,000 ($186.30)
- State Intergovernmental - Other: $1,931,000 ($104.82)
General Local Government Support: $1,345,000 ($73.01)
Highways: $67,000 ($3.64)
Housing and Community Development: $42,000 ($2.28)
- Tax - Property: $15,671,000 ($850.67)
Other License: $232,000 ($12.59)
Alcoholic Beverage License: $46,000 ($2.50)
Dover government finances - Debt in 2021 (per resident):
- Long Term Debt - Beginning Outstanding - Unspecified Public Purpose: $14,981,000 ($813.21)
Outstanding Unspecified Public Purpose: $14,071,000 ($763.82)
Retired Unspecified Public Purpose: $910,000 ($49.40)
Dover government finances - Cash and Securities in 2021 (per resident):
- Bond Funds - Cash and Securities: $7,344,000 ($398.65)
- Other Funds - Cash and Securities: $10,650,000 ($578.11)
7.05% of this county's 2020 resident taxpayers moved to other counties in 2021 ($142,356 average adjusted gross income)
| Here: | 7.05% |
| New Jersey average: | 7.02% |
0.01% of residents moved to foreign countries ($178 average AGI)
Morris County: 0.01% New Jersey average: 0.02%
Top counties to which taxpayers relocated from this county between 2020 and 2021:
| to Sussex County, NJ | |
| to Essex County, NJ | |
| to Somerset County, NJ |
| Businesses in Dover, NJ | ||||
| Name | Count | Name | Count | |
|---|---|---|---|---|
| Advance Auto Parts | 1 | Home Depot | 1 | |
| Applebee's | 1 | Kmart | 1 | |
| AutoZone | 1 | La-Z-Boy | 1 | |
| Blockbuster | 1 | Lane Furniture | 2 | |
| Burger King | 1 | MasterBrand Cabinets | 1 | |
| Chevrolet | 1 | T.J.Maxx | 1 | |
| Domino's Pizza | 1 | U-Haul | 1 | |
| FedEx | 2 | UPS | 4 | |
| H&R Block | 1 | Walgreens | 1 | |
Strongest AM radio stations in Dover:
- WSNR (620 AM; 20 kW; JERSEY CITY, NJ)
- WMCA (570 AM; 50 kW; NEW YORK, NY; Owner: SALEM MEDIA OF NEW YORK, LLC)
- WMTR (1250 AM; 7 kW; MORRISTOWN, NJ; Owner: THE SENTINEL PUBLISHING CO.)
- WOR (710 AM; 50 kW; NEW YORK, NY; Owner: BUCKLEY BROADCASTING CORPORATION)
- WABC (770 AM; 50 kW; NEW YORK, NY; Owner: WABC-AM RADIO, INC.)
- WINS (1010 AM; 50 kW; NEW YORK, NY; Owner: INFINITY BROADCASTING OPERATIONS, INC.)
- WEPN (1050 AM; 50 kW; NEW YORK, NY; Owner: NEW YORK AM RADIO, LLC)
- WADO (1280 AM; 50 kW; NEW YORK, NY; Owner: WADO-AM LICENSE CORP.)
- WBBR (1130 AM; 50 kW; NEW YORK, NY; Owner: BLOOMBERG COMMUNICATIONS INC.)
- WFAN (660 AM; 50 kW; NEW YORK, NY; Owner: INFINITY BROADCASTING OPERATIONS, INC.)
- WVNJ (1160 AM; 20 kW; OAKLAND, NJ; Owner: UNIVERSAL B/CASTING OF NEW YORK,INC.)
- WLIB (1190 AM; 30 kW; NEW YORK, NY; Owner: ICBC BROADCAST HOLDINGS-NY, INC.)
- WCBS (880 AM; 50 kW; NEW YORK, NY; Owner: INFINITY BROADCASTING OPERATIONS, INC.)
Strongest FM radio stations in Dover:
- WDHA-FM (105.5 FM; DOVER, NJ; Owner: THE SENTINEL PUBLISHING CO.)
- WRKS (98.7 FM; NEW YORK, NY; Owner: EMMIS RADIO LICENSE CORP OF NEW YORK)
- WNEW (102.7 FM; NEW YORK, NY; Owner: INFINITY BROADCASTING OPERATIONS, INC.)
- WSUS (102.3 FM; FRANKLIN, NJ; Owner: CLEAR CHANNEL BROADCASTING LICENSES, INC.)
- WAWZ (99.1 FM; ZAREPHATH, NJ; Owner: PILLAR OF FIRE)
- WNYC-FM (93.9 FM; NEW YORK, NY; Owner: WNYC RADIO)
- WNNJ-FM (103.7 FM; NEWTON, NJ; Owner: CLEAR CHANNEL BROADCASTING LICENSES, INC.)
- WPAT-FM (93.1 FM; PATERSON, NJ; Owner: WPAT LICENSING, INC.)
- WKTU (103.5 FM; LAKE SUCCESS, NY; Owner: AMFM RADIO LICENSES, LLC)
- WQCD (101.9 FM; NEW YORK, NY; Owner: EMMIS RADIO LICENSE CORPORATION)
- WKCR-FM (89.9 FM; NEW YORK, NY; Owner: TRUSTEES OF COLUMBIA UNIVERSITY IN NEW YORK)
- WAXQ (104.3 FM; NEW YORK, NY; Owner: AMFM NEW YORK LICENSES, LLC)
- WHTZ (100.3 FM; NEWARK, NJ; Owner: AMFM RADIO LICENSES, L.L.C.)
- WWPR-FM (105.1 FM; NEW YORK, NY; Owner: AMFM RADIO LICENSES, L.L.C.)
- WCAA (105.9 FM; NEWARK, NJ; Owner: WADO-AM LICENSE CORP. ("WADO"))
- WBAI (99.5 FM; NEW YORK, NY; Owner: PACIFICA FOUNDATION, INC.)
- WBLS (107.5 FM; NEW YORK, NY; Owner: ICBC BROADCAST HOLDINGS-NY, INC.)
- WLTW (106.7 FM; NEW YORK, NY; Owner: AMFM NEW YORK LICENSES, LLC)
- WQXR-FM (96.3 FM; NEW YORK, NY; Owner: THE NEW YORK TIMES ELECTRONIC MEDIA COMPANY)
- WSKQ-FM (97.9 FM; NEW YORK, NY; Owner: WSKQ LICENSING, INC.)
TV broadcast stations around Dover:
- WMBC-TV (Channel 63; NEWTON, NJ; Owner: MOUNTAIN BROADCASTING CORPORATION)
- W54CZ (Channel 54; MORRISTOWN, NJ; Owner: WLNY-TV, INC.)
- WPXO-LP (Channel 34; EAST ORANGE, NJ; Owner: PAXSON COMMUNICATIONS LPTV, INC.)
- WNYW (Channel 5; NEW YORK, NY; Owner: FOX TELEVISION STATIONS, INC.)
- WCBS-TV (Channel 2; NEW YORK, NY; Owner: CBS BROADCASTING INC.)
- WABC-TV (Channel 7; NEW YORK, NY; Owner: AMERICAN BROADCASTING COMPANIES, INC)
- WPIX (Channel 11; NEW YORK, NY; Owner: WPIX, INC.)
- WWOR-TV (Channel 9; SECAUCUS, NJ; Owner: FOX TELEVISION STATIONS, INC.)
- WPXN-TV (Channel 31; NEW YORK, NY; Owner: PAXSON COMMUNICATIONS LICENSE COMPANY, LLC)
- WNJU (Channel 47; LINDEN, NJ; Owner: WNJU LICENSE CORPORATION)
- WNBC (Channel 4; NEW YORK, NY; Owner: NATIONAL BROADCASTING COMPANY, INC.)
- WNET (Channel 13; NEWARK, NJ; Owner: EDUCATIONAL BROADCASTING CORPORATION)
- WXTV (Channel 41; PATERSON, NJ; Owner: WXTV LICENSE PARTNERSHIP, G.P.)
- WFUT (Channel 68; NEWARK, NJ; Owner: UNIVISION NEW YORK LLC)
- WNYE-TV (Channel 25; NEW YORK, NY; Owner: NEW YORK CITY BOARD OF EDUCATION)
- WXNY-LP (Channel 32; NEW YORK, NY; Owner: ISLAND BROADCASTING COMPANY)
- WFME-TV (Channel 66; WEST MILFORD, NJ; Owner: FAMILY STATIONS, INC.)
- WKOB-LP (Channel 53; NEW YORK, NY; Owner: WKOB COMMUNICATIONS, INC.)
- WEBR-CA (Channel 17; MANHATTAN, NY; Owner: K LICENSEE INC.)
- WRNN-LP (Channel 57; NYACK, NY; Owner: LP NYACK LIMITED PARTNERSHIP)
- W60AI (Channel 60; NEW YORK, NY; Owner: VENTANA TELEVISION, INC.)
- WLBX-LP (Channel 22; CRANFORD, NJ; Owner: RENARD COMMUNICATIONS CORP.)
- WNJB (Channel 58; NEW BRUNSWICK, NJ; Owner: NEW JERSEY PUBLIC BROADCASTING AUTHORITY)
- WNXY-LP (Channel 26; NEW YORK, NY; Owner: ISLAND BROADCASTING COMPANY)
- W68DN (Channel 68; CHERRY HILL, ETC., NJ; Owner: MARCIA COHEN)
- National Bridge Inventory (NBI) Statistics
- 28Number of bridges
- 194ft / 59.1mTotal length
- $37,039,000Total costs
- 358,608Total average daily traffic
- 21,454Total average daily truck traffic
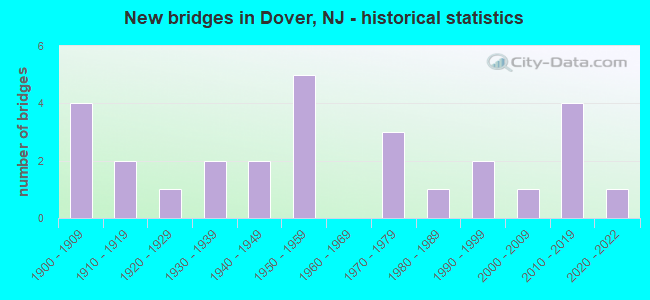
- New bridges - historical statistics
- 41900-1909
- 21910-1919
- 11920-1929
- 21930-1939
- 21940-1949
- 51950-1959
- 31970-1979
- 11980-1989
- 21990-1999
- 12000-2009
- 42010-2019
- 12020-2022
FCC Registered Cell Phone Towers:
1 (See the full list of FCC Registered Cell Phone Towers in Dover)FCC Registered Antenna Towers:
30 (See the full list of FCC Registered Antenna Towers)FCC Registered Commercial Land Mobile Towers:
1 (See the full list of FCC Registered Commercial Land Mobile Towers in Dover, NJ)FCC Registered Private Land Mobile Towers:
4 (See the full list of FCC Registered Private Land Mobile Towers)FCC Registered Broadcast Land Mobile Towers:
19 (See the full list of FCC Registered Broadcast Land Mobile Towers)FCC Registered Microwave Towers:
7 (See the full list of FCC Registered Microwave Towers in this town)FCC Registered Paging Towers:
9 (See the full list of FCC Registered Paging Towers)FCC Registered Maritime Coast & Aviation Ground Towers:
2 (See the full list of FCC Registered Maritime Coast & Aviation Ground Towers)FCC Registered Amateur Radio Licenses:
57 (See the full list of FCC Registered Amateur Radio Licenses in Dover)FAA Registered Aircraft:
5- Aircraft: TEXTRON AVIATION INC T206H (Category: Land, Seats: 6, Weight: Up to 12,499 Pounds), Engine: LYCOMING TIO-540-AJ1A (310 HP) (Reciprocating)
N-Number: 334AD, N334AD, N-334AD, Serial Number: T20609218, Year manufactured: 2016, Airworthiness Date: 09/26/2016, Certificate Issue Date: 10/27/2016
Registrant (LLC): A&d Terminal Management LLC, 19 E Blackwell St Ste 114, Dover, NJ 07801 - Aircraft: TEXTRON AVIATION INC G58 (Category: Land, Engines: 2, Seats: 6, Weight: Up to 12,499 Pounds), Engine: CONT MOTOR IO-550-C (300 HP) (Reciprocating)
N-Number: 496BB, N496BB, N-496BB, Serial Number: TH-2496, Year manufactured: 2018, Airworthiness Date: 02/26/2018, Certificate Issue Date: 08/07/2018
Registrant (LLC): A&d Terminal Management LLC, 19 E Blackwell St Ste 114, Dover, NJ 07801 - Aircraft: CESSNA 150G (Category: Land, Seats: 2, Weight: Up to 12,499 Pounds, Speed: 90 mph), Engine: CONT MOTOR 0-200 SERIES (100 HP) (4 Cycle)
N-Number: 8384J, N8384J, N-8384J, Serial Number: 15066284, Year manufactured: 1967, Airworthiness Date: 03/21/1967, Certificate Issue Date: 12/02/2019
Registrant (Individual): Jerzy Wolowiec, 289 Mount Hope Ave Apt F20, Dover, NJ 07801 - Aircraft: PIPER PA-24-260 (Category: Land, Seats: 4, Weight: Up to 12,499 Pounds, Speed: 135 mph), Engine: LYCOMING TI0-540 SER (310 HP) (Reciprocating)
N-Number: 9411P, N9411P, N-9411P, Serial Number: 24-4916, Year manufactured: 1970, Airworthiness Date: 05/06/1970, Certificate Issue Date: 04/15/2019
Registrant (Individual): Joseph Homsi, 8 Rock Hollow Rd, Dover, NJ 07801 - Aircraft: PIPER J3F-65 (Category: Land, Seats: 2, Weight: Up to 12,499 Pounds, Speed: 67 mph), Engine: CONT MOTOR A&C65 SERIES (65 HP) (Reciprocating)
N-Number: 35500, N35500, N-35500, Serial Number: 6405
Registrant (Individual): William A Meissner, 44 Park Ave, Dover, NJ 07801
Deregistered: Cancel Date: 06/19/2020
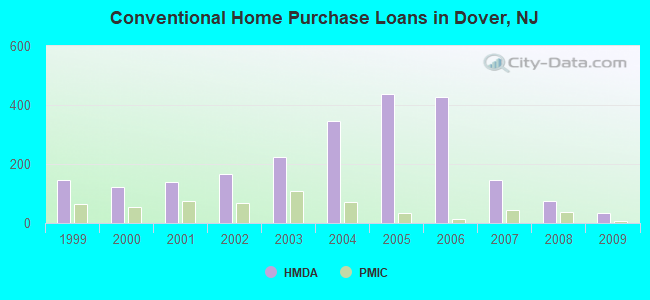
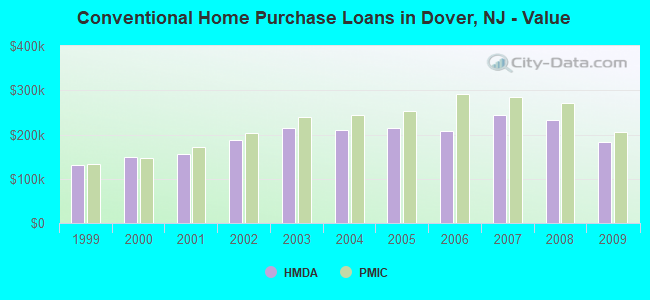
| Home Mortgage Disclosure Act Aggregated Statistics For Year 2009 (Based on 3 full tracts) | ||||||||||||||
| A) FHA, FSA/RHS & VA Home Purchase Loans | B) Conventional Home Purchase Loans | C) Refinancings | D) Home Improvement Loans | E) Loans on Dwellings For 5+ Families | F) Non-occupant Loans on < 5 Family Dwellings (A B C & D) | G) Loans On Manufactured Home Dwelling (A B C & D) | ||||||||
|---|---|---|---|---|---|---|---|---|---|---|---|---|---|---|
| Number | Average Value | Number | Average Value | Number | Average Value | Number | Average Value | Number | Average Value | Number | Average Value | Number | Average Value | |
| LOANS ORIGINATED | 63 | $222,746 | 33 | $183,545 | 118 | $213,271 | 7 | $102,143 | 2 | $234,000 | 12 | $178,333 | 0 | $0 |
| APPLICATIONS APPROVED, NOT ACCEPTED | 6 | $206,500 | 9 | $158,778 | 15 | $240,933 | 2 | $17,000 | 0 | $0 | 2 | $110,000 | 1 | $80,000 |
| APPLICATIONS DENIED | 22 | $222,864 | 8 | $208,000 | 87 | $246,816 | 11 | $29,091 | 0 | $0 | 11 | $154,818 | 0 | $0 |
| APPLICATIONS WITHDRAWN | 24 | $254,500 | 7 | $191,000 | 45 | $202,022 | 1 | $111,000 | 1 | $400,000 | 5 | $198,000 | 0 | $0 |
| FILES CLOSED FOR INCOMPLETENESS | 11 | $222,182 | 5 | $163,200 | 12 | $263,583 | 0 | $0 | 0 | $0 | 0 | $0 | 0 | $0 |
Detailed HMDA statistics for the following Tracts: 0448.00 , 0449.00, 0450.00
| Private Mortgage Insurance Companies Aggregated Statistics For Year 2009 (Based on 3 full tracts) | ||||
| A) Conventional Home Purchase Loans | B) Refinancings | |||
|---|---|---|---|---|
| Number | Average Value | Number | Average Value | |
| LOANS ORIGINATED | 7 | $205,143 | 1 | $338,000 |
| APPLICATIONS APPROVED, NOT ACCEPTED | 7 | $218,857 | 0 | $0 |
| APPLICATIONS DENIED | 1 | $102,000 | 3 | $320,667 |
| APPLICATIONS WITHDRAWN | 3 | $257,333 | 0 | $0 |
| FILES CLOSED FOR INCOMPLETENESS | 0 | $0 | 0 | $0 |
Detailed PMIC statistics for the following Tracts: 0448.00 , 0449.00, 0450.00
2002 - 2018 National Fire Incident Reporting System (NFIRS) incidents
- Fire incident types reported to NFIRS in Dover, NJ
- 90672.3%Structure Fires
- 24019.2%Outside Fires
- 917.3%Mobile Property/Vehicle Fires
- 161.3%Other
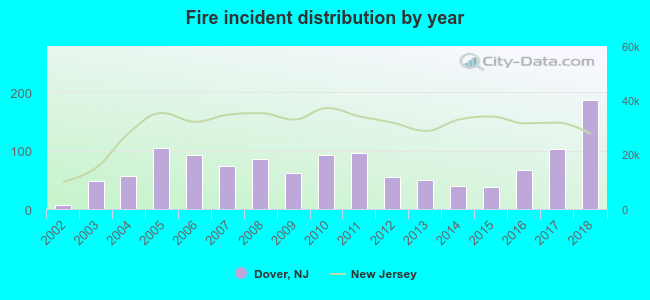 Based on the data from the years 2002 - 2018 the average number of fires per year is 74. The highest number of reported fires - 186 took place in 2018, and the least - 6 in 2002. The data has a rising trend.
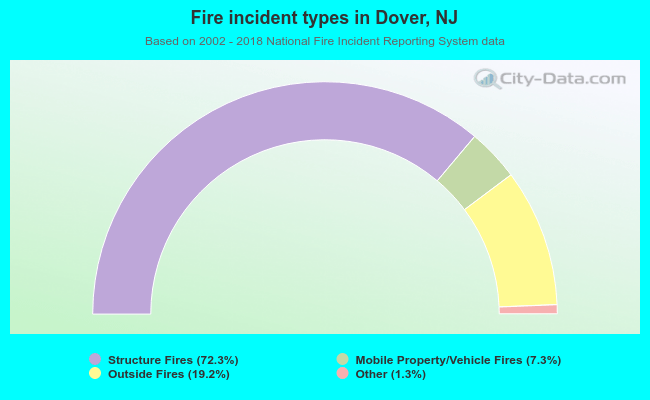 When looking into fire subcategories, the most incidents belonged to: Structure Fires (72.3%), and Outside Fires (19.2%).
Fire-safe hotels and motels in Dover, New Jersey:
- Homewood Suites By Hilton Dover/Rockaway, 2 Commerce Center Dr, Dover, New Jersey 07801 , Phone: (973) 989-8899, Fax: (973) 989-8898
- TownePlace Suites by Marriott Dover Rockaway, 4 Commerce Center Dr, Dover, New Jersey 07801 , Phone: (800) 257-3000, Fax: (973) 659-9998
| Most common first names in Dover, NJ among deceased individuals | ||
| Name | Count | Lived (average) |
|---|---|---|
| Mary | 261 | 79.6 years |
| John | 235 | 73.5 years |
| William | 210 | 75.1 years |
| Joseph | 160 | 74.2 years |
| Anna | 135 | 81.1 years |
| George | 134 | 75.1 years |
| Charles | 122 | 72.8 years |
| James | 117 | 73.7 years |
| Margaret | 108 | 80.8 years |
| Helen | 108 | 80.6 years |
| Most common last names in Dover, NJ among deceased individuals | ||
| Last name | Count | Lived (average) |
|---|---|---|
| Smith | 61 | 75.5 years |
| Miller | 47 | 75.5 years |
| Johnson | 23 | 79.0 years |
| Williams | 22 | 76.3 years |
| Anderson | 21 | 80.2 years |
| Harris | 19 | 71.7 years |
| Jones | 19 | 77.0 years |
| Hoffman | 19 | 75.1 years |
| Kelly | 19 | 72.4 years |
| Weber | 18 | 76.7 years |
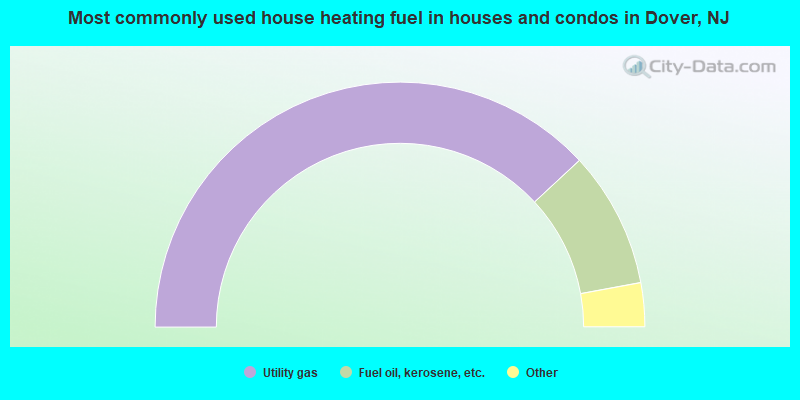
- 76.2%Utility gas
- 18.0%Fuel oil, kerosene, etc.
- 3.7%Electricity
- 1.3%Bottled, tank, or LP gas
- 0.8%Solar energy
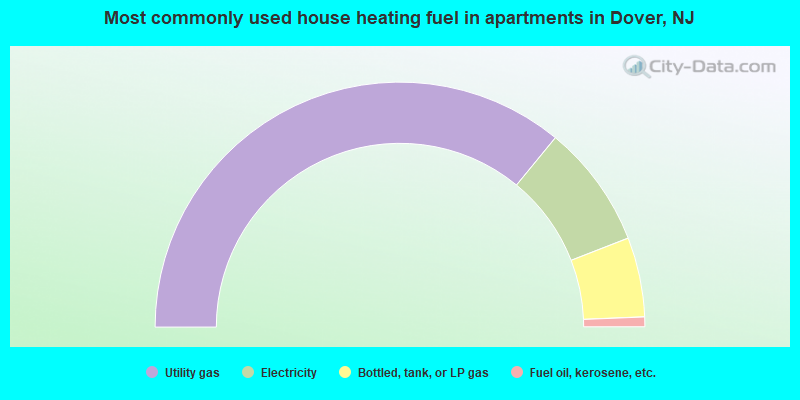
- 71.9%Utility gas
- 16.3%Electricity
- 10.5%Bottled, tank, or LP gas
- 1.3%Fuel oil, kerosene, etc.
Dover compared to New Jersey state average:
- Unemployed percentage below state average.
- Black race population percentage below state average.
- Hispanic race population percentage significantly above state average.
- Median age below state average.
- Foreign-born population percentage above state average.
- Length of stay since moving in significantly above state average.
- House age above state average.
- Percentage of population with a bachelor's degree or higher below state average.
Dover on our top lists:
- #2 on the list of "Top 101 cities with the most residents born in Colombia (population 500+)"
- #8 on the list of "Top 101 cities with the most residents born in South America (population 500+)"
- #13 on the list of "Top 101 cities with the most residents born in Chile (population 500+)"
- #30 on the list of "Top 101 cities with the most residents born in Costa Rica (population 500+)"
- #39 on the list of "Top 101 cities with the most residents born in Ecuador (population 500+)"
- #45 on the list of "Top 101 cities with the most residents born in Honduras (population 500+)"
- #51 on the list of "Top 101 cities with largest percentage of females in industries: administrative and support and waste management services (population 5,000+)"
- #57 on the list of "Top 101 cities with largest percentage of females in occupations: building and grounds cleaning and maintenance occupations (population 5,000+)"
- #65 on the list of "Top 100 cities with highest percentage of foreign-born residents (pop. 5,000+)"
- #70 on the list of "Top 101 cities with the most residents born in Peru (population 500+)"
- #100 on the list of "Top 101 cities with the most residents born in Americas (population 500+)"
- #101 on the list of "Top 101 cities with largest percentage of females in occupations: material moving occupations (population 5,000+)"
- #100 (07801) on the list of "Top 101 zip codes with the largest percentage of Greek first ancestries (pop 5,000+)"
- #4 on the list of "Top 101 counties with the largest decrease in the number of births per 1000 residents 2000-2006 to 2007-2013 (pop 50,000+)"
- #8 on the list of "Top 101 counties with the lowest number of infant deaths per 1000 residents 2007-2013 (pop. 50,000+)"
- #10 on the list of "Top 101 counties with the highest percentage of residents that visited a dentist within the past year"
- #11 on the list of "Top 101 counties with the largest decrease in the number of infant deaths per 1000 residents 2000-2006 to 2007-2013 (pop. 50,000+)"
- #12 on the list of "Top 101 counties with the best general health status score of residents (1-5), 3 years of data"

|
|
Total of 73 patent applications in 2008-2024.