Fairview Heights, Illinois
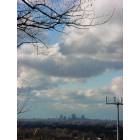
Fairview Heights: A View of the St Louis Skyline , From Fairview Heights. This must be that, "Fair View" they were talking about.

Fairview Heights: Fall in Fairview Heights, Illinois 2009
- add
your
Submit your own pictures of this city and show them to the world
- OSM Map
- General Map
- Google Map
- MSN Map
Population change since 2000: +8.6%
 |
| Males: 8,288 | |
| Females: 8,036 |
| Median resident age: | 40.5 years |
| Illinois median age: | 39.1 years |
Zip codes: 62208.
| Fairview Heights: | $72,405 |
| IL: | $76,708 |
Estimated per capita income in 2022: $37,138 (it was $22,614 in 2000)
Fairview Heights city income, earnings, and wages data
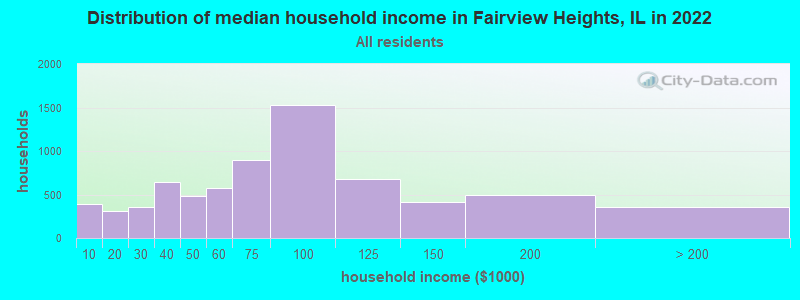
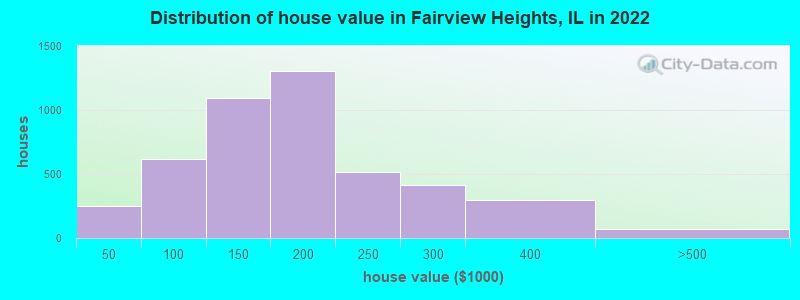
Estimated median house or condo value in 2022: $170,315 (it was $83,600 in 2000)
| Fairview Heights: | $170,315 |
| IL: | $251,600 |
Mean prices in 2022: all housing units: $165,809; detached houses: $166,772; townhouses or other attached units: $229,374; mobile homes: $69,125
Median gross rent in 2022: $1,106.
Fairview Heights, IL residents, houses, and apartments details
(9.1% for White Non-Hispanic residents, 12.2% for Black residents, 2.6% for Hispanic or Latino residents, 7.4% for two or more races residents)
Detailed information about poverty and poor residents in Fairview Heights, IL


Compare current foreclosures in Fairview Heights, IL:
| Photo | Address | Area | Beds / Baths | Price | Details |
|---|---|---|---|---|---|

|
#1
Lucinda Dr
Fairview Heights, IL 62208
|
1,040 sq. feet
|
2 baths 2 beds |
$149,000
|
show details |

|
#2
Frey Ln
Fairview Heights, IL 62208
|
1,258 sq. feet
|
2 baths 3 beds |
$159,000
|
show details |

|
#3
Pine Trl
Fairview Heights, IL 62208
|
1 sq. feet
|
1 baths 2 beds |
show details | |

|
#4
Dogwood Ln
Fairview Heights, IL 62208
|
- sq. feet
|
- baths - beds |
$54,900
|
show details |

|
#5
Holy Cross Rd
Fairview Heights, IL 62208
|
1,420 sq. feet
|
- baths - beds |
show details | |

|
#6
Pleasant Ridge Rd
Fairview Heights, IL 62208
|
1,404 sq. feet
|
- baths - beds |
show details | |

|
#7
Anita Dr
Fairview Heights, IL 62208
|
1,058 sq. feet
|
- baths - beds |
show details | |

|
#8
Orleans Dr
Fairview Heights, IL 62208
|
600 sq. feet
|
- baths - beds |
show details | |

|
#9
Potomac Dr
Fairview Heights, IL 62208
|
1,054 sq. feet
|
- baths - beds |
show details | |

|
#10
Judith Ann Pl
Fairview Heights, IL 62208
|
1,140 sq. feet
|
- baths - beds |
show details |
| Photo | Address | Area | Beds / Baths | Price | Details |
|---|---|---|---|---|---|

|
#11
Highland Rd
Fairview Heights, IL 62208
|
832 sq. feet
|
- baths - beds |
show details | |

|
#12
Anita Dr
Fairview Heights, IL 62208
|
936 sq. feet
|
- baths - beds |
show details | |

|
#13
Northbrook Cir Apt 11
Fairview Heights, IL 62208
|
- sq. feet
|
- baths - beds |
show details | |

|
#14
Legend Ct
Fairview Heights, IL 62208
|
- sq. feet
|
- baths - beds |
show details | |

|
#15
Autumn Pine Dr Apt 5
Fairview Heights, IL 62208
|
- sq. feet
|
- baths - beds |
show details | |

|
#16
Northbrook Cir Apt 32
Fairview Heights, IL 62208
|
- sq. feet
|
- baths - beds |
show details | |

|
#17
Old Collinsville Rd
Fairview Heights, IL 62208
|
- sq. feet
|
- baths - beds |
show details | |

|
#18
Peachtree Ln
Fairview Heights, IL 62208
|
- sq. feet
|
- baths - beds |
show details | |

|
#19
Sapphire Ln
Fairview Heights, IL 62208
|
- sq. feet
|
- baths - beds |
show details | |

|
#20
Winchester Pl
Fairview Heights, IL 62208
|
- sq. feet
|
- baths - beds |
show details |
| Photo | Address | Area | Beds / Baths | Price | Details |
|---|---|---|---|---|---|

|
#21
S Ruby Ln Apt 4
Fairview Heights, IL 62208
|
- sq. feet
|
- baths - beds |
show details | |

|
#22
Old Collinsville Rd Apt 8
Fairview Heights, IL 62208
|
- sq. feet
|
- baths - beds |
show details | |

|
#23
Jennifer Dr
Fairview Heights, IL 62208
|
- sq. feet
|
- baths - beds |
show details | |

|
#24
Ponderosa Av 7
Fairview Heights, IL 62208
|
- sq. feet
|
- baths - beds |
show details | |

|
#25
Ponderosa Av 5
Fairview Heights, IL 62208
|
- sq. feet
|
- baths - beds |
show details | |

|
#26
Pastor Jerome Jackson 1st Senior Blvd
Fairview Heights, IL 62208
|
- sq. feet
|
- baths - beds |
show details | |

|
#27
Orchard St
Fairview Heights, IL 62208
|
- sq. feet
|
- baths - beds |
show details | |

|
#28
Deerwood Trl
Fairview Heights, IL 62208
|
- sq. feet
|
- baths 3 beds |
show details | |

|
#29
Sapphire Ln
Fairview Heights, IL 62208
|
- sq. feet
|
- baths - beds |
show details | |

|
#30
Old Collinsville Rd
Fairview Heights, IL 62208
|
- sq. feet
|
- baths - beds |
show details |
| Photo | Address | Area | Beds / Baths | Price | Details |
|---|---|---|---|---|---|

|
#31
Irma Ln
Fairview Heights, IL 62208
|
- sq. feet
|
- baths - beds |
show details | |

|
#32
Applewood Creek Dr
Fairview Heights, IL 62208
|
- sq. feet
|
- baths - beds |
show details | |

|
#33
Northbrook Cir Apt 25
Fairview Heights, IL 62208
|
- sq. feet
|
- baths - beds |
show details | |

|
#34
Ponderosa Av 8
Fairview Heights, IL 62208
|
- sq. feet
|
- baths - beds |
show details | |

|
#35
Bountiful Dr
Fairview Heights, IL 62208
|
- sq. feet
|
- baths - beds |
show details | |

|
#36
Perrin Rd
Fairview Heights, IL 62208
|
- sq. feet
|
- baths - beds |
show details | |

|
#37
Richmond Dr
Fairview Heights, IL 62208
|
- sq. feet
|
- baths - beds |
show details | |

|
#38
Catherine Dr
Fairview Heights, IL 62208
|
- sq. feet
|
- baths - beds |
show details | |

|
#39
Pleasant View Dr
Fairview Heights, IL 62208
|
- sq. feet
|
- baths - beds |
show details | |

|
#40
Fairway Dr
Fairview Heights, IL 62208
|
- sq. feet
|
- baths - beds |
show details |
| Photo | Address | Area | Beds / Baths | Price | Details |
|---|---|---|---|---|---|

|
#41
N Ruby Ln
Fairview Heights, IL 62208
|
- sq. feet
|
- baths - beds |
show details | |

|
#42
Cliff Dr
Fairview Heights, IL 62208
|
- sq. feet
|
- baths - beds |
show details | |

|
#43
Marbarry Dr
Fairview Heights, IL 62208
|
- sq. feet
|
- baths - beds |
show details | |

|
#44
Lexington Dr
Fairview Heights, IL 62208
|
- sq. feet
|
- baths - beds |
show details | |

|
#45
Montclair Dr
Fairview Heights, IL 62208
|
- sq. feet
|
- baths - beds |
show details | |

|
#46
Lexington Dr
Fairview Heights, IL 62208
|
- sq. feet
|
- baths - beds |
show details | |

|
#47
Union Hill Rd
Fairview Heights, IL 62208
|
- sq. feet
|
- baths - beds |
show details | |

|
#48
Pontiac Dr
Fairview Heights, IL 62208
|
- sq. feet
|
- baths - beds |
show details | |

|
#49
Fay Ln
Fairview Heights, IL 62208
|
- sq. feet
|
- baths - beds |
show details | |

|
Check over 1 million property listings on Foreclosure.com!
|
browse all offers | |||


- 8,45252.5%White alone
- 4,74929.5%Black alone
- 2,13813.3%Two or more races
- 5893.7%Hispanic
- 2101.3%Asian alone
- 1591.0%Other race alone
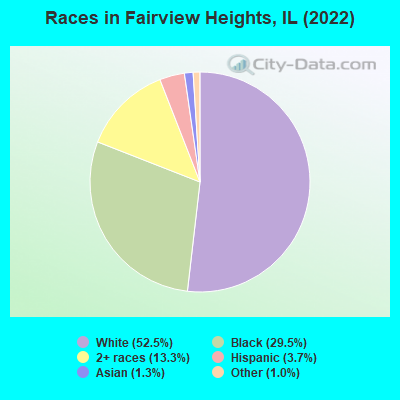
Races in Fairview Heights detailed stats: ancestries, foreign born residents, place of birth
According to our research of Illinois and other state lists, there were 9 registered sex offenders living in Fairview Heights, Illinois as of June 16, 2024.
The ratio of all residents to sex offenders in Fairview Heights is 1,859 to 1.
The ratio of registered sex offenders to all residents in this city is lower than the state average.
Type |
2010 |
2011 |
2012 |
2013 |
2014 |
2015 |
2016 |
2017 |
2018 |
2019 |
2020 |
2021 |
2022 |
|---|---|---|---|---|---|---|---|---|---|---|---|---|---|
| Murders (per 100,000) | 0 (0.0) | 0 (0.0) | 2 (11.7) | 0 (0.0) | 0 (0.0) | 1 (5.9) | 1 (6.0) | 0 (0.0) | 0 (0.0) | 0 (0.0) | 1 (6.2) | 1 (6.2) | 0 (0.0) |
| Rapes (per 100,000) | 3 (17.6) | 5 (29.2) | 3 (17.5) | 5 (29.5) | 2 (11.8) | 9 (53.4) | 6 (35.8) | 5 (30.1) | 18 (109.0) | 8 (48.9) | 10 (61.7) | 5 (31.2) | 11 (67.6) |
| Robberies (per 100,000) | 6 (35.1) | 8 (46.7) | 3 (17.5) | 10 (59.0) | 5 (29.6) | 10 (59.3) | 4 (23.8) | 5 (30.1) | 6 (36.3) | 8 (48.9) | 3 (18.5) | 5 (31.2) | 4 (24.6) |
| Assaults (per 100,000) | 28 (164.0) | 34 (198.5) | 37 (216.4) | 20 (117.9) | 17 (100.7) | 24 (142.4) | 30 (178.9) | 37 (222.7) | 43 (260.4) | 25 (152.7) | 23 (141.8) | 33 (205.8) | 35 (215.1) |
| Burglaries (per 100,000) | 60 (351.3) | 105 (613.0) | 78 (456.2) | 68 (400.9) | 39 (231.0) | 52 (308.6) | 67 (399.5) | 60 (361.1) | 56 (339.1) | 45 (274.9) | 35 (215.8) | 24 (149.7) | 60 (368.8) |
| Thefts (per 100,000) | 864 (5,059) | 787 (4,595) | 924 (5,404) | 695 (4,098) | 618 (3,660) | 653 (3,875) | 779 (4,644) | 633 (3,809) | 615 (3,724) | 516 (3,152) | 443 (2,732) | 423 (2,638) | 412 (2,532) |
| Auto thefts (per 100,000) | 30 (175.7) | 32 (186.8) | 28 (163.8) | 25 (147.4) | 20 (118.4) | 20 (118.7) | 24 (143.1) | 27 (162.5) | 24 (145.3) | 30 (183.3) | 32 (197.3) | 27 (168.4) | 40 (245.9) |
| Arson (per 100,000) | 9 (52.7) | 10 (58.4) | 0 (0.0) | 5 (29.5) | 1 (5.9) | 2 (11.9) | 0 (0.0) | 0 (0.0) | 1 (6.1) | 0 (0.0) | 0 (0.0) | 2 (12.5) | 0 (0.0) |
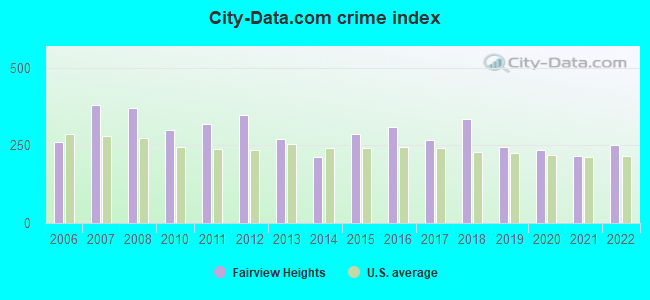
| City-Data.com crime index | 298.4 | 318.7 | 347.2 | 268.6 | 210.5 | 287.0 | 308.7 | 268.3 | 334.5 | 244.3 | 235.7 | 217.4 | 251.3 |
The City-Data.com crime index weighs serious crimes and violent crimes more heavily. Higher means more crime, U.S. average is 246.1. It adjusts for the number of visitors and daily workers commuting into cities.
Crime rate in Fairview Heights detailed stats: murders, rapes, robberies, assaults, burglaries, thefts, arson
Full-time law enforcement employees in 2020, including police officers: 49 (45 officers - 43 male; 2 female).
| Officers per 1,000 residents here: | 2.77 |
| Illinois average: | 3.04 |
 Recent articles from our blog. Our writers, many of them Ph.D. graduates or candidates, create easy-to-read articles on a wide variety of topics.

 | illinois taxes and people who are moving out of the state (400 replies) |
| Belleville vs Edwardsville vs O'Fallon (14 replies) |
| East St. Louis... what happened there? (79 replies) |
| Illinois......are you staying or leaving? (277 replies) |
| Most scenic retirement area in Illinois (17 replies) |
| Considering moving to Lebanon, Illinois (6 replies) |
Latest news from Fairview Heights, IL collected exclusively by city-data.com from local newspapers, TV, and radio stations
Ancestries: German (13.9%), English (9.1%), American (4.8%), Irish (4.6%), Italian (2.4%), Polish (1.5%).
Current Local Time: CST time zone
Incorporated on 01/26/1970
Elevation: 593 feet
Land area: 11.1 square miles.
Population density: 1,464 people per square mile (low).

373 residents are foreign born (1.2% Asia, 0.8% Latin America).
| This city: | 2.3% |
| Illinois: | 14.1% |
Median real estate property taxes paid for housing units with mortgages in 2022: $2,933 (1.7%)
Median real estate property taxes paid for housing units with no mortgage in 2022: $2,671 (1.9%)
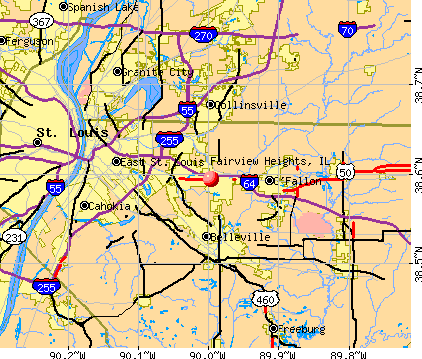
Nearest city with pop. 50,000+: St. Louis, MO  (13.5 miles , pop. 348,189).
Nearest city with pop. 1,000,000+: Chicago, IL (255.7 miles , pop. 2,896,016).
Nearest cities:
), ), )Latitude: 38.59 N, Longitude: 90.00 W
Daytime population change due to commuting: +1,732 (+10.8%)
Workers who live and work in this city: 1,564 (20.3%)
Area code commonly used in this area: 618

Fairview Heights tourist attractions:
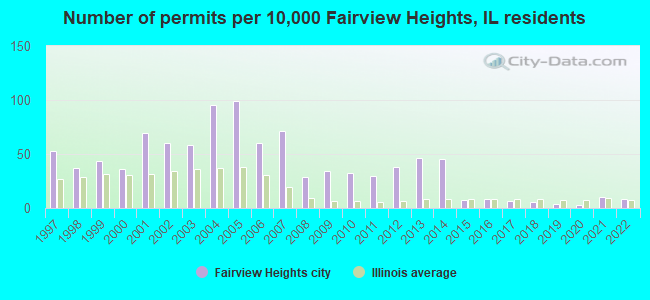
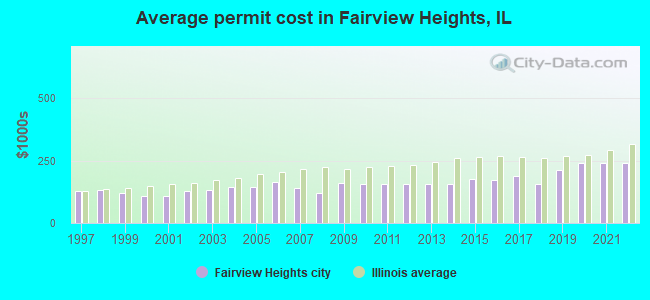
Single-family new house construction building permits:
- 2022: 13 buildings, average cost: $241,400
- 2021: 15 buildings, average cost: $241,400
- 2020: 4 buildings, average cost: $242,000
- 2019: 5 buildings, average cost: $211,100
- 2018: 8 buildings, average cost: $157,400
- 2017: 10 buildings, average cost: $188,400
- 2016: 12 buildings, average cost: $174,000
- 2015: 11 buildings, average cost: $177,900
- 2014: 68 buildings, average cost: $155,600
- 2013: 70 buildings, average cost: $155,600
- 2012: 57 buildings, average cost: $155,500
- 2011: 45 buildings, average cost: $155,700
- 2010: 49 buildings, average cost: $154,600
- 2009: 51 buildings, average cost: $161,300
- 2008: 43 buildings, average cost: $120,200
- 2007: 107 buildings, average cost: $139,900
- 2006: 90 buildings, average cost: $165,500
- 2005: 149 buildings, average cost: $142,900
- 2004: 144 buildings, average cost: $143,500
- 2003: 88 buildings, average cost: $131,900
- 2002: 90 buildings, average cost: $126,800
- 2001: 105 buildings, average cost: $107,100
- 2000: 54 buildings, average cost: $106,900
- 1999: 66 buildings, average cost: $118,500
- 1998: 55 buildings, average cost: $133,000
- 1997: 80 buildings, average cost: $127,500
| Here: | 4.3% |
| Illinois: | 4.2% |
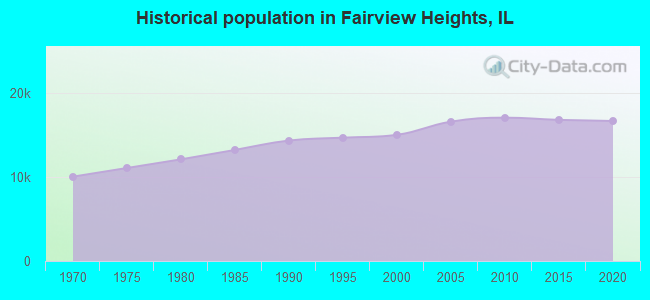
Population change in the 1990s: +131 (+0.9%).
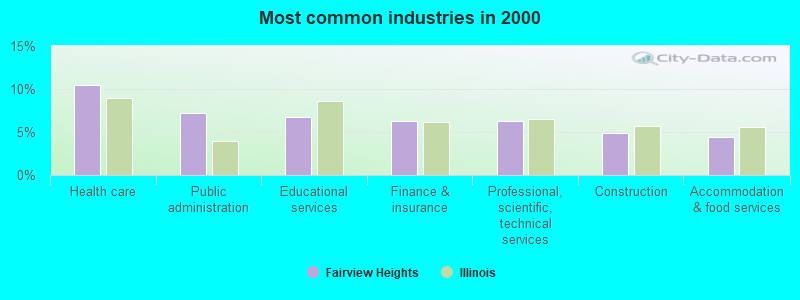
- Health care (10.5%)
- Public administration (7.2%)
- Educational services (6.7%)
- Finance & insurance (6.3%)
- Professional, scientific, technical services (6.3%)
- Construction (4.9%)
- Accommodation & food services (4.4%)
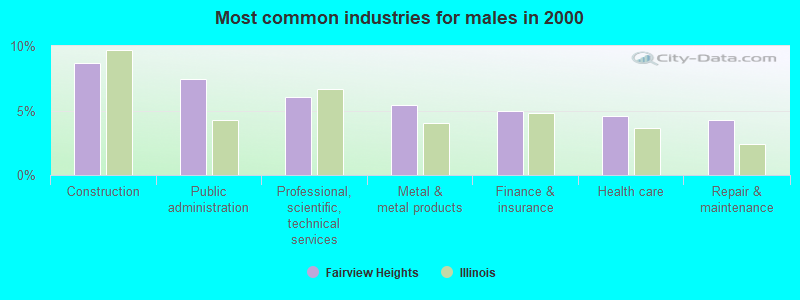
- Construction (8.7%)
- Public administration (7.5%)
- Professional, scientific, technical services (6.1%)
- Metal & metal products (5.5%)
- Finance & insurance (5.0%)
- Health care (4.5%)
- Repair & maintenance (4.3%)
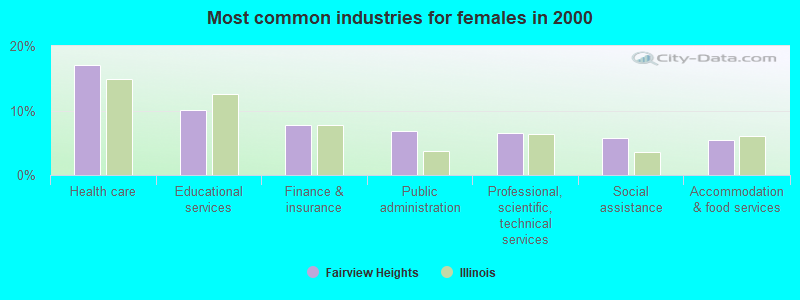
- Health care (17.0%)
- Educational services (10.0%)
- Finance & insurance (7.7%)
- Public administration (6.9%)
- Professional, scientific, technical services (6.5%)
- Social assistance (5.7%)
- Accommodation & food services (5.4%)
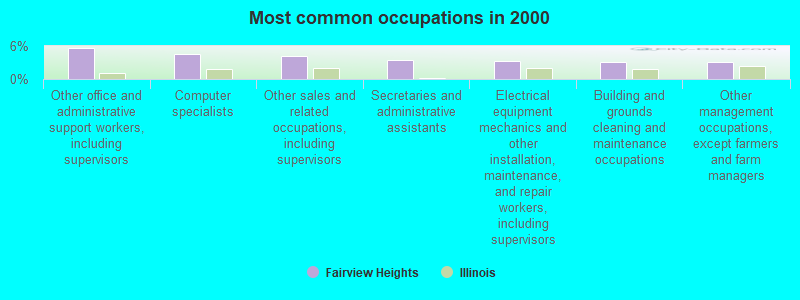
- Other office and administrative support workers, including supervisors (5.6%)
- Computer specialists (4.6%)
- Other sales and related occupations, including supervisors (4.1%)
- Secretaries and administrative assistants (3.4%)
- Electrical equipment mechanics and other installation, maintenance, and repair workers, including supervisors (3.2%)
- Building and grounds cleaning and maintenance occupations (3.1%)
- Other management occupations, except farmers and farm managers (3.1%)
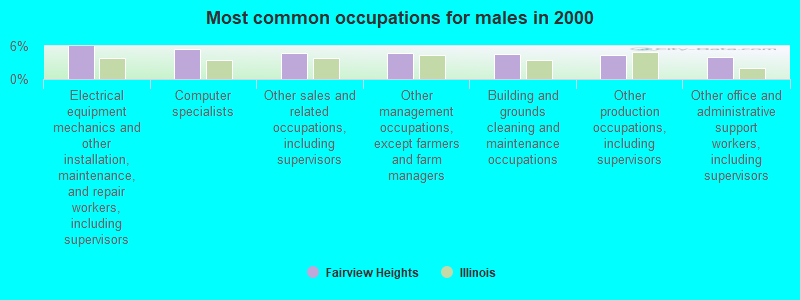
- Electrical equipment mechanics and other installation, maintenance, and repair workers, including supervisors (5.9%)
- Computer specialists (5.4%)
- Other sales and related occupations, including supervisors (4.7%)
- Other management occupations, except farmers and farm managers (4.6%)
- Building and grounds cleaning and maintenance occupations (4.6%)
- Other production occupations, including supervisors (4.4%)
- Other office and administrative support workers, including supervisors (4.0%)
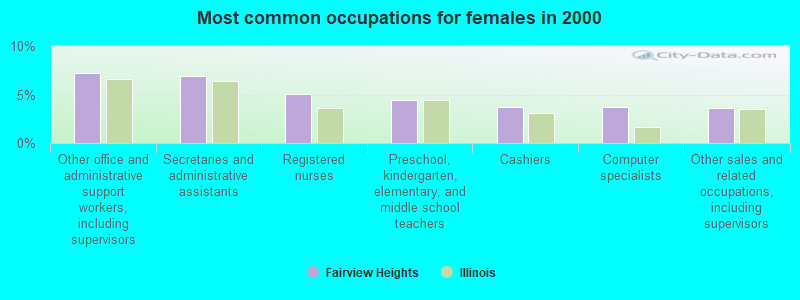
- Other office and administrative support workers, including supervisors (7.2%)
- Secretaries and administrative assistants (6.9%)
- Registered nurses (5.1%)
- Preschool, kindergarten, elementary, and middle school teachers (4.4%)
- Cashiers (3.8%)
- Computer specialists (3.7%)
- Other sales and related occupations, including supervisors (3.6%)
Average climate in Fairview Heights, Illinois
Based on data reported by over 4,000 weather stations


(lower is better)
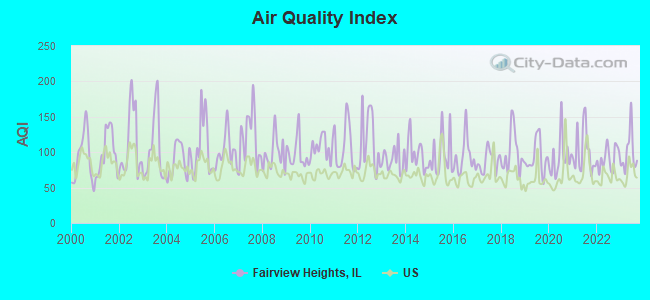
Air Quality Index (AQI) level in 2023 was 99.1. This is worse than average.
| City: | 99.1 |
| U.S.: | 72.6 |
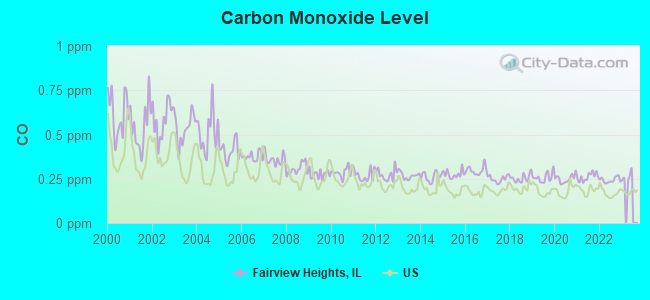
Carbon Monoxide (CO) [ppm] level in 2022 was 0.243. This is about average. Closest monitor was 2.0 miles away from the city center.
| City: | 0.243 |
| U.S.: | 0.251 |
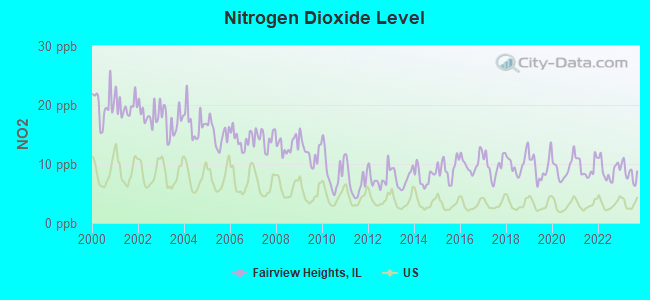
Nitrogen Dioxide (NO2) [ppb] level in 2023 was 8.51. This is significantly worse than average. Closest monitor was 2.0 miles away from the city center.
| City: | 8.51 |
| U.S.: | 5.11 |
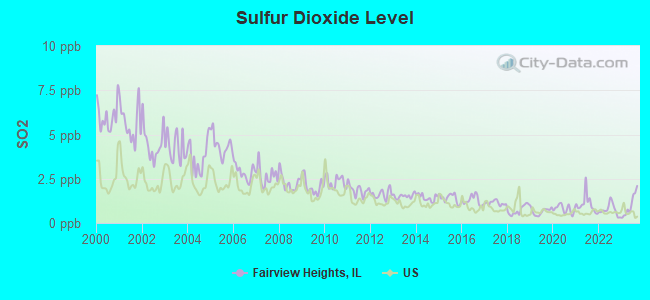
Sulfur Dioxide (SO2) [ppb] level in 2023 was 0.997. This is significantly better than average. Closest monitor was 6.2 miles away from the city center.
| City: | 0.997 |
| U.S.: | 1.515 |
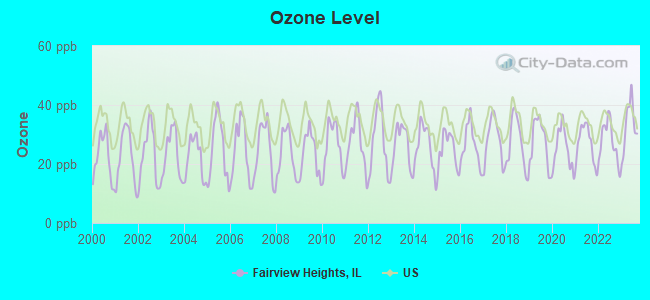
Ozone [ppb] level in 2023 was 33.2. This is about average. Closest monitor was 2.0 miles away from the city center.
| City: | 33.2 |
| U.S.: | 33.3 |
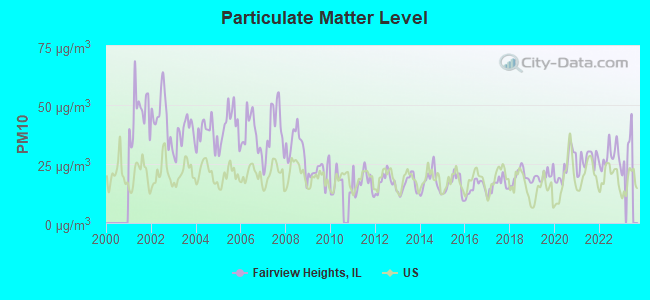
Particulate Matter (PM10) [µg/m3] level in 2022 was 28.2. This is significantly worse than average. Closest monitor was 8.9 miles away from the city center.
| City: | 28.2 |
| U.S.: | 19.2 |
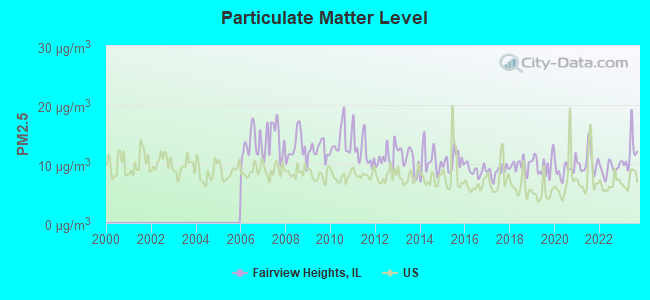
Particulate Matter (PM2.5) [µg/m3] level in 2023 was 11.8. This is significantly worse than average. Closest monitor was 4.4 miles away from the city center.
| City: | 11.8 |
| U.S.: | 8.1 |
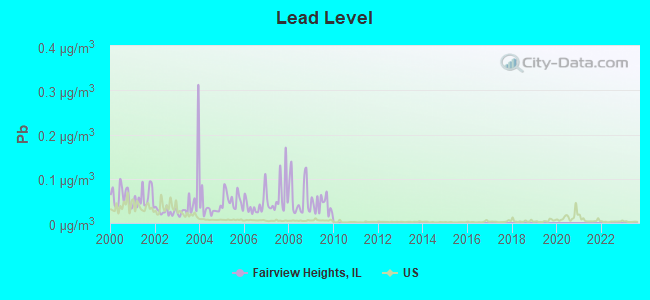
Lead (Pb) [µg/m3] level in 2009 was 0.0421. This is significantly worse than average. Closest monitor was 5.3 miles away from the city center.
| City: | 0.0421 |
| U.S.: | 0.0093 |
Tornado activity:
Fairview Heights-area historical tornado activity is slightly above Illinois state average. It is 91% greater than the overall U.S. average.
On 2/10/1959, a category F4 (max. wind speeds 207-260 mph) tornado 9.8 miles away from the Fairview Heights city center killed 21 people and injured 345 people and caused between $5,000,000 and $50,000,000 in damages.
On 4/3/1981, a category F4 tornado 11.3 miles away from the city center injured 32 people and caused between $5,000,000 and $50,000,000 in damages.
Earthquake activity:
Fairview Heights-area historical earthquake activity is significantly above Illinois state average. It is 304% greater than the overall U.S. average.On 4/18/2008 at 09:36:59, a magnitude 5.4 (5.1 MB, 4.8 MS, 5.4 MW, 5.2 MW, Class: Moderate, Intensity: VI - VII) earthquake occurred 114.6 miles away from Fairview Heights center
On 4/18/2008 at 09:36:59, a magnitude 5.2 (5.2 MW, Depth: 8.9 mi) earthquake occurred 114.6 miles away from Fairview Heights center
On 6/10/1987 at 23:48:54, a magnitude 5.1 (4.9 MB, 4.4 MS, 4.6 MS, 5.1 LG) earthquake occurred 115.1 miles away from the city center
On 9/26/1990 at 13:18:51, a magnitude 5.0 (4.7 MB, 4.8 LG, 5.0 LG, Depth: 7.7 mi) earthquake occurred 101.9 miles away from Fairview Heights center
On 6/18/2002 at 17:37:15, a magnitude 5.0 (4.3 MB, 4.6 MW, 5.0 LG) earthquake occurred 127.4 miles away from Fairview Heights center
On 5/4/1991 at 01:18:54, a magnitude 5.0 (4.4 MB, 4.6 LG, 5.0 LG, Depth: 3.1 mi) earthquake occurred 140.7 miles away from the city center
Magnitude types: regional Lg-wave magnitude (LG), body-wave magnitude (MB), surface-wave magnitude (MS), moment magnitude (MW)
Natural disasters:
The number of natural disasters in St. Clair County (2) is a lot smaller than the US average (15).Causes of natural disasters: Flood: 1, Storm: 1, Other: 1 (Note: some incidents may be assigned to more than one category).

Hospitals and medical centers in Fairview Heights:
- FAIRVIEW HEIGHTS DIALYSIS (821 LINCOLN HIGHWAY)
- CARETENDERS VISITING SERVICES OF SOUTHERN ILLINOIS (13 EXECUTIVE DRIVE, STE 12)
Other hospitals and medical centers near Fairview Heights:
- SOUTHWESTERN IL VISITING NURSE ASSOC (Home Health Center, about 3 miles away; SWANSEA, IL)
- AMEDISYS HOME HEALTH (Home Health Center, about 3 miles away; BELLEVILLE, IL)
- CRESCENT HOME HEALTH AGENCY, LLC (Home Health Center, about 4 miles away; SWANSEA, IL)
- MEMORIAL CARE CENTER (Nursing Home, about 4 miles away; BELLEVILLE, IL)
- MEMORIAL HOSPITAL HOME CARE (Home Health Center, about 4 miles away; BELLEVILLE, IL)
- MEMORIAL HOSPITAL Acute Care Hospitals (about 4 miles away; BELLEVILLE, IL)
- RENAISSANCE AT BELLEVILLE (Nursing Home, about 4 miles away; BELLEVILLE, IL)
Amtrak station near Fairview Heights:
Colleges/Universities in Fairview Heights:
Colleges/universities with over 2000 students nearest to Fairview Heights:
- Southwestern Illinois College (about 7 miles; Belleville, IL; Full-time enrollment: 9,085)
- McKendree University (about 10 miles; Lebanon, IL; FT enrollment: 2,564)
- Saint Louis Community College (about 11 miles; Saint Louis, MO; FT enrollment: 18,019)
- Saint Louis University (about 14 miles; Saint Louis, MO; FT enrollment: 11,606)
- Southern Illinois University-Edwardsville (about 14 miles; Edwardsville, IL; FT enrollment: 11,933)
- Ranken Technical College (about 15 miles; Saint Louis, MO; FT enrollment: 2,134)
- Washington University in St Louis (about 18 miles; Saint Louis, MO; FT enrollment: 10,823)
Private high school in Fairview Heights:
Public elementary/middle schools in Fairview Heights:
- WILLIAM HOLLIDAY ELEM SCHOOL (Students: 563, Location: 400 JOSEPH DR, Grades: PK-5)
- GRANT MIDDLE SCHOOL (Students: 393, Location: 10110 OLD LINCOLN TRL, Grades: 5-8)
- ILLINI ELEM SCHOOL (Students: 379, Location: 21 CIRCLE DR, Grades: PK-4)
- PONTIAC JR HIGH SCHOOL (Location: 400 ASHLAND AVE, Grades: 6-8)
Private elementary/middle school in Fairview Heights:
User-submitted facts and corrections:
- An additional Primary and middle school option in Fairview Heights is Holy Trinity Catholic School. web site is holytrinitycatholicchurch.com
Points of interest:
Notable locations in Fairview Heights: MedStar Ambulance (A), French Village Volunteer Fire Protection District Station 1 Headquarters (B), French Village Volunteer Fire Protection District Station 2 (C), Fairview - Caseyville Township Fire Protection District Station 2 Headquarters (D), Fairview Fire Department Station 1 (E). Display/hide their locations on the map
Shopping Centers: Crossroads Center Mall (1), Fairview Center Shopping Center (2), Fairview Heights Plaza Shopping Center (3), Market Place Shopping Center (4), Saint Clair Square Mall (5). Display/hide their locations on the map
Churches in Fairview Heights include: Full Gospel Tabernacle Church (A), Christ United Methodist Church (B), First Church of the Nazarene (C), Saint Albert the Great Church (D), Roselawn Church (E), Saint John Church (F). Display/hide their locations on the map
Cemeteries: Saint Clair Memorial Park (1), Saint Adalbert Cemetery (2), Lakeview Memorial Gardens (3), Kampmeyer Cemetery (4), Holy Cross Cemetery (5), Greenwood Cemetery (6). Display/hide their locations on the map
Lakes and reservoirs: Lawrence Lake (A), Jubaka Lake (B), Swan Lake (C), Weslake (D). Display/hide their locations on the map
Park in Fairview Heights: Longacre Park (1). Display/hide its location on the map
Hotels: Drury Inn and Suites St Louis - Fairview Heights (12 Ludwig Drive), Four Points by Sheraton Fairview Heights (319 Fountains Parkway), Fairview Inn (10002 Old Lincoln Trail), Best Western Camelot Inn (305 Salem Place), French Village Motel (9811 West State Route 161), Hampton Inn St. Louis-Fairview Heights (150 Ludwig Drive).
Birthplace of: Nathan Hodel - Football player, Stetson Hairston - College basketball player (Southern Illinois Salukis).
| This city: | 2.3 people |
| Illinois: | 2.6 people |
| This city: | 63.4% |
| Whole state: | 65.8% |
| This city: | 5.7% |
| Whole state: | 6.3% |
Likely homosexual households (counted as self-reported same-sex unmarried-partner households)
- Lesbian couples: 0.3% of all households
- Gay men: 0.3% of all households
People in group quarters in Fairview Heights in 2000:
- 105 people in other group homes
- 10 people in homes for the mentally retarded
- 4 people in religious group quarters
Banks with branches in Fairview Heights (2011 data):
- Regions Bank: Fairview Heights Branch, Bunkum Road Facility, Longacre Branch. Info updated 2011/02/24: Bank assets: $123,368.2 mil, Deposits: $98,301.3 mil, headquarters in Birmingham, AL, positive income, Commercial Lending Specialization, 1778 total offices, Holding Company: Regions Financial Corporation
- U.S. Bank National Association: Fairview Heights Branch at 6701 North Illinois Street, branch established on 1869/01/01; Fairview Heights Schnucks Branch at 625 Lincoln Highway, branch established on 2006/03/02. Info updated 2012/01/30: Bank assets: $330,470.8 mil, Deposits: $236,091.5 mil, headquarters in Cincinnati, OH, positive income, 3121 total offices, Holding Company: U.S. Bancorp
- Associated Bank, National Association: Fairview Heights Main Branch at 6550 North Illinois Street, branch established on 1894/01/01. Info updated 2008/09/12: Bank assets: $21,715.0 mil, Deposits: $15,244.4 mil, headquarters in Green Bay, WI, positive income, Commercial Lending Specialization, 282 total offices, Holding Company: Associated Banc-Corp
- Centrue Bank: Fairview Heights Branch at 303 Fountains Parkway, branch established on 2003/06/16. Info updated 2007/06/27: Bank assets: $964.9 mil, Deposits: $850.6 mil, headquarters in Streator, IL, negative income in the last year, Commercial Lending Specialization, 28 total offices, Holding Company: Centrue Financial Corporation
- Community First Bank: at 4600 North Illinois, branch established on 1988/11/30. Info updated 2006/11/03: Bank assets: $190.9 mil, Deposits: $161.6 mil, local headquarters, positive income, Commercial Lending Specialization, 1 total offices, Holding Company: Community First Bancorp, Inc.
For population 15 years and over in Fairview Heights:
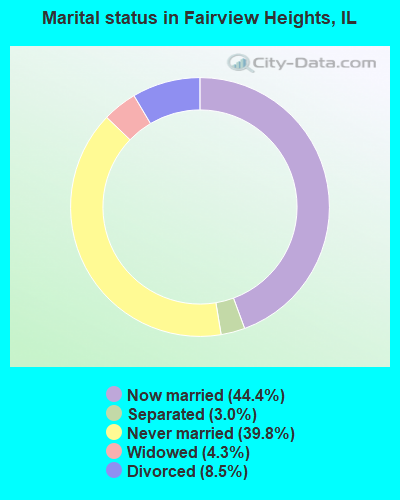
- Never married: 39.8%
- Now married: 44.4%
- Separated: 3.0%
- Widowed: 4.3%
- Divorced: 8.5%
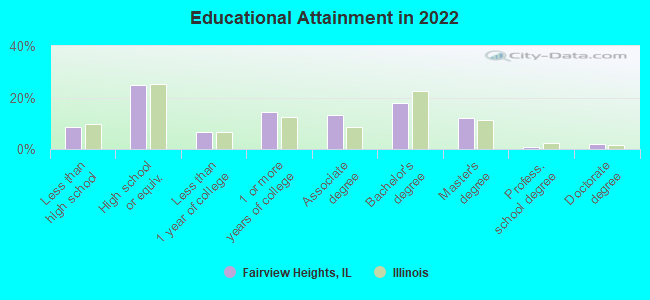
For population 25 years and over in Fairview Heights:
- High school or higher: 92.7%
- Bachelor's degree or higher: 32.2%
- Graduate or professional degree: 13.9%
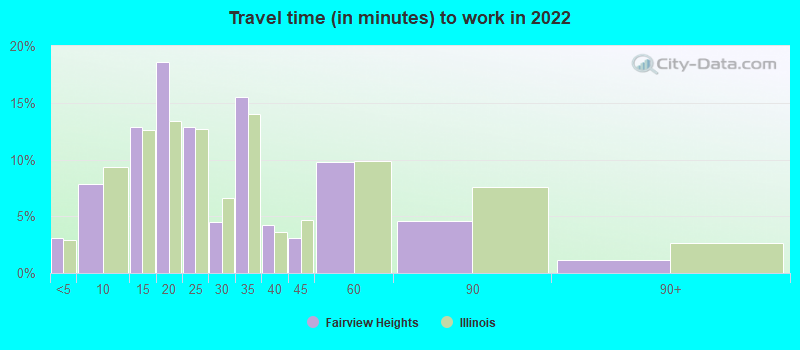
- Unemployed: 3.2%
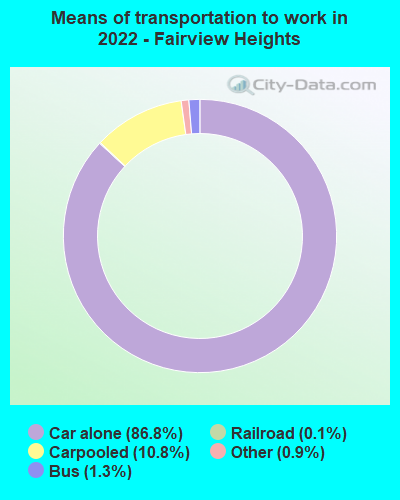
- Mean travel time to work (commute): 19.3 minutes
| Here: | 11.8 |
| Illinois average: | 12.5 |
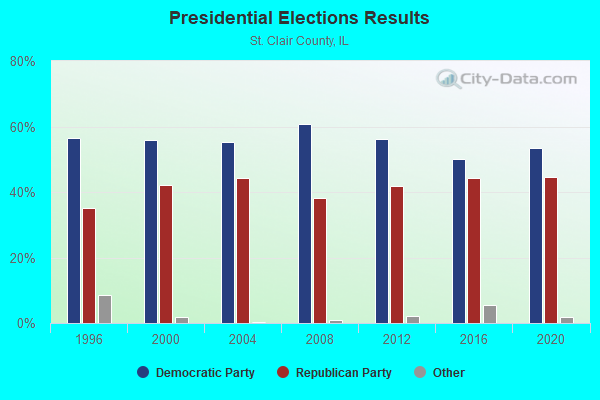
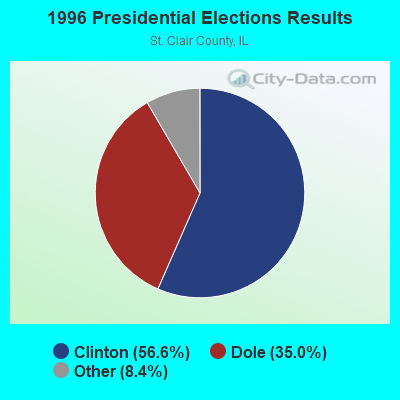
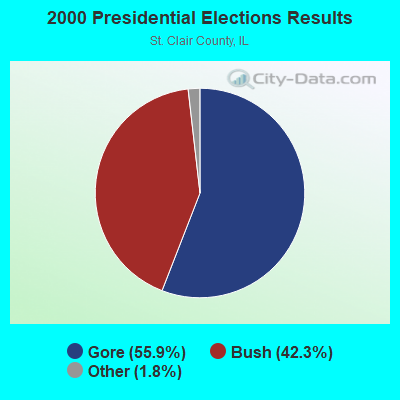
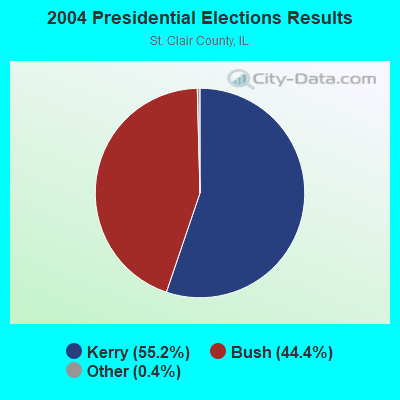
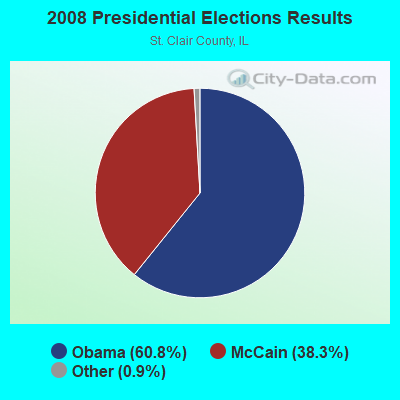
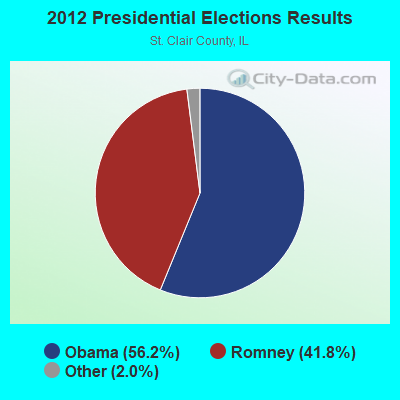
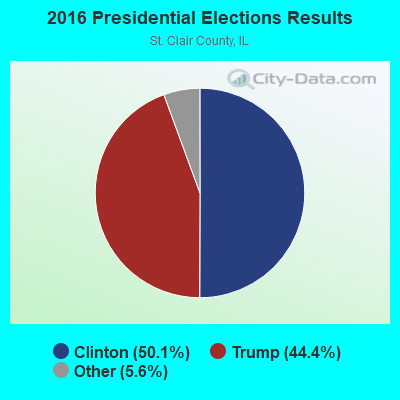
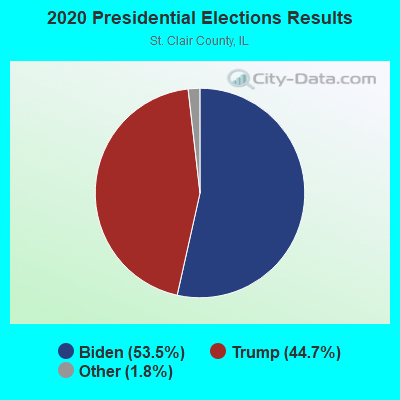
Graphs represent county-level data. Detailed 2008 Election Results
Political contributions by individuals in Fairview Heights, IL
Religion statistics for Fairview Heights, IL (based on St. Clair County data)
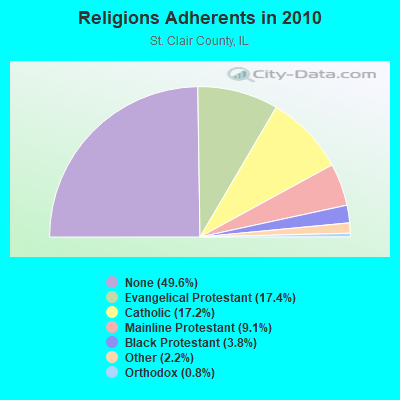
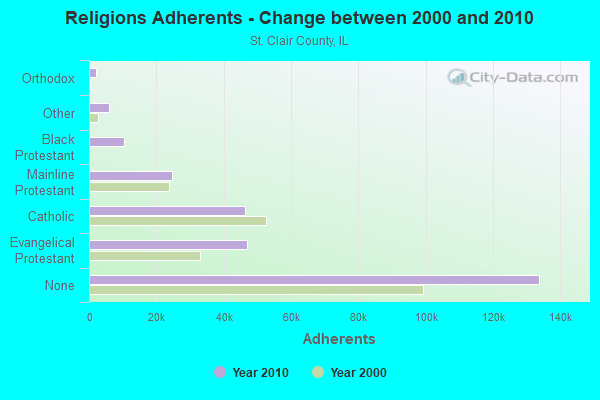
| Religion | Adherents | Congregations |
|---|---|---|
| Evangelical Protestant | 46,903 | 169 |
| Catholic | 46,372 | 28 |
| Mainline Protestant | 24,655 | 53 |
| Black Protestant | 10,290 | 41 |
| Other | 5,880 | 16 |
| Orthodox | 2,100 | 2 |
| None | 133,856 | - |
Food Environment Statistics:
| St. Clair County: | 1.80 / 10,000 pop. |
| Illinois: | 2.24 / 10,000 pop. |
| St. Clair County: | 0.04 / 10,000 pop. |
| Illinois: | 0.08 / 10,000 pop. |
| Here: | 0.65 / 10,000 pop. |
| Illinois: | 0.75 / 10,000 pop. |
| This county: | 3.56 / 10,000 pop. |
| Illinois: | 2.61 / 10,000 pop. |
| St. Clair County: | 5.93 / 10,000 pop. |
| State: | 6.86 / 10,000 pop. |
| St. Clair County: | 9.5% |
| Illinois: | 8.3% |
| St. Clair County: | 28.4% |
| State: | 25.2% |
| Here: | 8.2% |
| State: | 14.5% |
Health and Nutrition:
| Fairview Heights: | 56.5% |
| Illinois: | 49.5% |
| Fairview Heights: | 56.6% |
| State: | 47.2% |
| Here: | 28.1 |
| State: | 28.6 |
| Fairview Heights: | 17.6% |
| Illinois: | 20.5% |
| Fairview Heights: | 8.2% |
| State: | 10.8% |
| This city: | 6.9 |
| Illinois: | 6.8 |
| Fairview Heights: | 34.6% |
| Illinois: | 33.4% |
| Fairview Heights: | 62.4% |
| Illinois: | 56.4% |
| Fairview Heights: | 81.4% |
| Illinois: | 79.9% |
More about Health and Nutrition of Fairview Heights, IL Residents
| Local government employment and payroll (March 2022) | |||||
| Function | Full-time employees | Monthly full-time payroll | Average yearly full-time wage | Part-time employees | Monthly part-time payroll |
|---|---|---|---|---|---|
| Police Protection - Officers | 43 | $345,178 | $96,329 | 0 | $0 |
| Parks and Recreation | 15 | $67,555 | $54,044 | 43 | $34,628 |
| Other Government Administration | 15 | $80,605 | $64,484 | 16 | $14,905 |
| Streets and Highways | 9 | $53,857 | $71,809 | 0 | $0 |
| Other and Unallocable | 6 | $32,124 | $64,248 | 2 | $3,857 |
| Financial Administration | 5 | $32,033 | $76,879 | 0 | $0 |
| Police - Other | 4 | $18,814 | $56,442 | 6 | $14,190 |
| Local Libraries | 2 | $12,290 | $73,740 | 6 | $12,002 |
| Totals for Government | 99 | $642,454 | $77,873 | 73 | $79,583 |
Fairview Heights government finances - Expenditure in 2017 (per resident):
- Current Operations - Police Protection: $7,848,000 ($480.76)
Regular Highways: $5,921,000 ($362.72)
Central Staff Services: $2,692,000 ($164.91)
Parks and Recreation: $1,645,000 ($100.77)
General Public Buildings: $560,000 ($34.31)
General - Other: $554,000 ($33.94)
Financial Administration: $295,000 ($18.07)
Libraries: $89,000 ($5.45)
- General - Interest on Debt: $55,000 ($3.37)
- Total Salaries and Wages: $8,104,000 ($496.45)
Fairview Heights government finances - Revenue in 2017 (per resident):
- Charges - Parks and Recreation: $95,000 ($5.82)
Other: $63,000 ($3.86)
Solid Waste Management: $3,000 ($0.18)
- Federal Intergovernmental - Highways: $832,000 ($50.97)
- Miscellaneous - General Revenue - Other: $558,000 ($34.18)
Fines and Forfeits: $519,000 ($31.79)
Interest Earnings: $100,000 ($6.13)
- State Intergovernmental - General Local Government Support: $9,444,000 ($578.53)
Highways: $449,000 ($27.51)
Other: $433,000 ($26.53)
Public Welfare: $24,000 ($1.47)
- Tax - General Sales and Gross Receipts: $8,770,000 ($537.25)
Other Selective Sales: $1,217,000 ($74.55)
Property: $914,000 ($55.99)
Other License: $301,000 ($18.44)
Fairview Heights government finances - Debt in 2017 (per resident):
- Long Term Debt - Beginning Outstanding - Unspecified Public Purpose: $2,495,000 ($152.84)
Outstanding Unspecified Public Purpose: $1,615,000 ($98.93)
Retired Unspecified Public Purpose: $880,000 ($53.91)
Fairview Heights government finances - Cash and Securities in 2017 (per resident):
- Other Funds - Cash and Securities: $13,576,000 ($831.66)
6.01% of this county's 2021 resident taxpayers lived in other counties in 2020 ($54,121 average adjusted gross income)
| Here: | 6.01% |
| Illinois average: | 5.09% |
0.18% of residents moved from foreign countries ($2,103 average AGI)
St. Clair County: 0.18% Illinois average: 0.01%
Top counties from which taxpayers relocated into this county between 2020 and 2021:
| from Madison County, IL | |
| from St. Louis County, MO | |
| from St. Louis city, MO |
6.69% of this county's 2020 resident taxpayers moved to other counties in 2021 ($61,323 average adjusted gross income)
| Here: | 6.69% |
| Illinois average: | 6.10% |
0.10% of residents moved to foreign countries ($1,075 average AGI)
St. Clair County: 0.10% Illinois average: 0.01%
Top counties to which taxpayers relocated from this county between 2020 and 2021:
| to Madison County, IL | |
| to St. Louis County, MO | |
| to St. Louis city, MO |
| Businesses in Fairview Heights, IL | ||||
| Name | Count | Name | Count | |
|---|---|---|---|---|
| ALDO | 1 | Justice | 2 | |
| AT&T | 3 | Kmart | 1 | |
| Abercrombie & Fitch | 1 | Kohl's | 1 | |
| Abercrombie Kids | 1 | Lane Bryant | 1 | |
| Aeropostale | 1 | LensCrafters | 2 | |
| American Eagle Outfitters | 1 | Little Caesars Pizza | 1 | |
| Ann Taylor | 1 | Long John Silver's | 1 | |
| Applebee's | 1 | Lowe's | 1 | |
| Arby's | 1 | Macy's | 1 | |
| Bakers | 1 | Marriott | 1 | |
| Banana Republic | 1 | Marshalls | 1 | |
| Barnes & Noble | 1 | MasterBrand Cabinets | 2 | |
| Bath & Body Works | 1 | Maurices | 1 | |
| Bed Bath & Beyond | 1 | McDonald's | 1 | |
| Best Western | 1 | Men's Wearhouse | 2 | |
| Budget Car Rental | 1 | Motherhood Maternity | 3 | |
| Burlington Coat Factory | 1 | New Balance | 3 | |
| Casual Male XL | 1 | Nike | 13 | |
| Catherines | 1 | Office Depot | 1 | |
| Charlotte Russe | 1 | Old Navy | 1 | |
| Chick-Fil-A | 1 | Olive Garden | 1 | |
| Chico's | 1 | Pac Sun | 1 | |
| Chipotle | 1 | Panera Bread | 1 | |
| Chuck E. Cheese's | 1 | Payless | 1 | |
| Circle K | 3 | Penske | 1 | |
| Coldwater Creek | 1 | Pier 1 Imports | 1 | |
| Comfort Suites | 1 | Pizza Hut | 1 | |
| Cricket Wireless | 3 | Plato's Closet | 1 | |
| Curves | 1 | Popeyes | 1 | |
| Dairy Queen | 1 | Qdoba Mexican Grill | 1 | |
| Deb | 1 | Quiznos | 2 | |
| Decora Cabinetry | 2 | Ramada | 1 | |
| Domino's Pizza | 1 | Red Lobster | 1 | |
| DressBarn | 1 | Red Robin | 1 | |
| Dressbarn | 1 | Ruby Tuesday | 1 | |
| Express | 1 | Rue21 | 1 | |
| Famous Footwear | 1 | SAS Shoes | 1 | |
| FedEx | 4 | Sephora | 1 | |
| Finish Line | 1 | Shoe Carnival | 1 | |
| Firestone Complete Auto Care | 1 | Spencer Gifts | 1 | |
| Foot Locker | 1 | Sprint Nextel | 2 | |
| Forever 21 | 2 | Starbucks | 2 | |
| Fredericks Of Hollywood | 1 | Steak 'n Shake | 1 | |
| GNC | 1 | Subway | 2 | |
| GameStop | 2 | Super 8 | 1 | |
| Gymboree | 1 | T-Mobile | 4 | |
| H&R Block | 2 | T.G.I. Driday's | 1 | |
| Hilton | 1 | T.J.Maxx | 1 | |
| Hobby Lobby | 1 | Taco Bell | 1 | |
| Holiday Inn | 1 | Talbots | 1 | |
| HomeTown Buffet | 1 | Target | 1 | |
| Hot Topic | 1 | Toys"R"Us | 2 | |
| Houlihan's | 1 | U.S. Cellular | 2 | |
| J. Jill | 1 | UPS | 5 | |
| Jimmy John's | 1 | Value City Furniture | 1 | |
| JoS. A. Bank | 1 | Verizon Wireless | 1 | |
| Jones New York | 2 | Victoria's Secret | 1 | |
| Journeys | 1 | Walgreens | 1 | |
Strongest AM radio stations in Fairview Heights:
- KMOX (1120 AM; 50 kW; ST. LOUIS, MO; Owner: INFINITY BROADCASTING OPERATIONS, INC.)
- KXEN (1010 AM; 50 kW; FESTUS-ST. LOUIS, MO; Owner: BDJ RADIO ENTERPRISES, LLC)
- WSDZ (1260 AM; 20 kW; BELLEVILLE, IL)
- KTRS (550 AM; 5 kW; ST. LOUIS, MO; Owner: KTRS-AM LICENSE, L.L.C.)
- KRFT (1190 AM; 10 kW; DE SOTO, MO; Owner: ALL SPORTS RADIO, LLC)
- KJSL (630 AM; 5 kW; ST. LOUIS, MO; Owner: WMUZ RADIO, INC.)
- WEW (770 AM; daytime; 1 kW; ST. LOUIS, MO; Owner: METROPOLITAN RADIO GROUP, INC.)
- KATZ (1600 AM; 5 kW; ST. LOUIS, MO; Owner: CITICASTERS LICENSES, L.P.)
- WRTH (1430 AM; 5 kW; ST. LOUIS, MO)
- KSLG (1380 AM; 5 kW; ST. LOUIS, MO; Owner: NEW HORIZON 7TH-DAY CHRISTIAN CHURCH, INC.)
- KFUO (850 AM; 5 kW; CLAYTON, MO; Owner: LUTHERAN CHURCH-MISSOURI SYNOD)
- KSTL (690 AM; 1 kW; ST. LOUIS, MO; Owner: WMUZ RADIO, INC.)
- KSIV (1320 AM; 5 kW; CLAYTON, MO; Owner: BOTT COMMUNICATIONS, INC.)
Strongest FM radio stations in Fairview Heights:
- KSIV-FM (91.5 FM; ST. LOUIS, MO; Owner: COMMUNITY BROADCASTING, INC.)
- WSIE (88.7 FM; EDWARDSVILLE, IL; Owner: BOARD OF TRUSTEES, S. ILLINOIS UNIV.)
- KSHE (94.7 FM; CRESTWOOD, MO; Owner: EMMIS RADIO LICENSE CORPORATION)
- KSLZ (107.7 FM; ST. LOUIS, MO; Owner: CITICASTERS LICENSES, L.P.)
- KFUO-FM (99.1 FM; CLAYTON, MO; Owner: THE LUTHERAN CHURCH-MISSOURI SYNOD)
- KYKY (98.1 FM; ST. LOUIS, MO; Owner: INFINITY RADIO SUBSIDIARY OPERATIONS INC.)
- WSSM (106.5 FM; GRANITE CITY, IL; Owner: BONNEVILLE HOLDING COMPANY)
- KMJM-FM (104.9 FM; COLUMBIA, IL; Owner: CITICASTERS LICENSES, L.P.)
- KSD (93.7 FM; ST. LOUIS, MO; Owner: CITICASTERS LICENSES, L.P.)
- KFTK-FM1 (97.1 FM; ST. LOUIS, MO; Owner: EMMIS RADIO LICENSE CORPORATION)
- KWMU (90.7 FM; ST. LOUIS, MO; Owner: THE CURATORS OF THE UNIVERSITY OF MISSOURI)
- KEZK-FM (102.5 FM; ST. LOUIS, MO; Owner: INFINITY RADIO SUBSIDIARY OPERATIONS INC.)
- KIHT (96.3 FM; ST. LOUIS, MO; Owner: EMMIS RADIO LICENSE CORPORATION)
- KLOU (103.3 FM; ST. LOUIS, MO; Owner: CITICASTERS LICENSES, L.P.)
- WVRV (101.1 FM; EAST ST. LOUIS, IL; Owner: BONNEVILLE HOLDING COMPANY)
- WIL-FM (92.3 FM; ST. LOUIS, MO; Owner: BONNEVILLE HOLDING COMPANY)
- KPNT (105.7 FM; ST. GENEVIEVE, MO; Owner: EMMIS RADIO LICENSE CORPORATION)
- KDHX (88.1 FM; ST. LOUIS, MO; Owner: DOUBLE HELIX CORPORATION)
- WMLL (104.1 FM; JERSEYVILLE, IL; Owner: EMMIS RADIO LICENSE CORPORATION)
- WCBW-FM (89.7 FM; EAST ST. LOUIS, IL; Owner: NEW LIFE EVANGELISTIC CENTER, INC.)
TV broadcast stations around Fairview Heights:
- K40FF (Channel 40; ST. LOUIS, MO; Owner: EBC ST. LOUIS, INC.)
- KSDK (Channel 5; ST. LOUIS, MO; Owner: MULTIMEDIA KSDK, INC.)
- KPLR-TV (Channel 11; ST. LOUIS, MO; Owner: KPLR, INC.)
- KMOV (Channel 4; ST. LOUIS, MO; Owner: KMOV-TV, INC.)
- KDNL-TV (Channel 30; ST. LOUIS, MO; Owner: KDNL LICENSEE, LLC)
- KTVI (Channel 2; ST. LOUIS, MO; Owner: KTVI LICENSE, INC.)
- K64DT (Channel 64; ST. LOUIS, MO; Owner: WORD OF GOD FELLOWSHIP, INC.)
- KETC (Channel 9; ST. LOUIS, MO; Owner: ST. LOUIS REGIONAL & EDUCATIONAL PUBLIC TV COMMISSION)
- K49FC (Channel 49; ST. LOUIS, MO; Owner: THREE ANGELS BROADCASTING NETWORK)
- KPTN-LP (Channel 58; ST. LOUIS, MO; Owner: KURT J. PETERSEN)
- K18BT (Channel 18; ST. LOUIS, MO; Owner: TRINITY BROADCASTING NETWORK)
- K65FN (Channel 65; BATESVILLE, AR; Owner: MS COMMUNICATIONS, LLC)
- WPXS (Channel 13; MT. VERNON, IL; Owner: EBC ST. LOUIS, INC.)
- WRBU (Channel 46; EAST ST. LOUIS, IL; Owner: ROBERTS BROADCASTING COMPANY)
- KNLC (Channel 24; ST. LOUIS, MO; Owner: NEW LIFE EVANGELISTIC CENTER, INC.)
- K38HD (Channel 38; ST. LOUIS, MO; Owner: VENTANA TELEVISION, INC.)
- K62EG (Channel 62; ST. LOUIS, MO; Owner: ETERNAL FAMILY NETWORK)
- National Bridge Inventory (NBI) Statistics
- 17Number of bridges
- 102ft / 31.4mTotal length
- 1,231,950Total average daily traffic
- 41,610Total average daily truck traffic
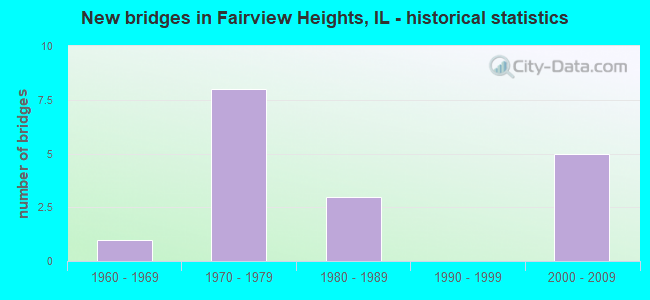
- New bridges - historical statistics
- 11960-1969
- 81970-1979
- 31980-1989
- 52000-2009
FCC Registered Antenna Towers:
33 (See the full list of FCC Registered Antenna Towers in Fairview Heights)FCC Registered Private Land Mobile Towers:
2 (See the full list of FCC Registered Private Land Mobile Towers in Fairview Heights, IL)FCC Registered Broadcast Land Mobile Towers:
17 (See the full list of FCC Registered Broadcast Land Mobile Towers)FCC Registered Microwave Towers:
1- FAIRVIEW HEIGHTS, 100 Ludwig Dr (Lat: 38.600361 Lon: -89.990444), Type: Pole, Structure height: 45.7 m, Overall height: 47.5 m, Call Sign: WMQ576,
Assigned Frequencies: 5974.85 MHz, 6063.80 MHz, 5945.20 MHz, 6004.50 MHz, Grant Date: 01/04/2011, Expiration Date: 02/01/2021, Cancellation Date: 02/26/2014, Certifier: John T Scott Iii, Registrant: Verizon Wireless, 1120 Sanctuary Pkwy, #150 Gasa5reg, Alpharetta, GA 30009-7630, Phone: (770) 797-1070, Fax: (770) 797-1036, Email:
FCC Registered Paging Towers:
5- On Highway 50, 1 Mile East Of Highway 161 (Lat: 38.592528 Lon: -90.034250), Call Sign: KNKJ235,
Assigned Frequencies: 454.575 MHz, Grant Date: 08/03/1998, Expiration Date: 06/15/2008, Cancellation Date: 11/02/2004, Certifier: William Buxbaum, Registrant: Network Services, LLC Debtor-In-Possession, 525 South Douglas Street, El Segundo, CA 90245, Phone: (310) 615-6523, Fax: (310) 615-6581, Email:
- Us 50, 1 Mi. E. Of Sh 161 (Lat: 38.592528 Lon: -90.034250), Overall height: 147.8 m, Call Sign: KNKL889,
Assigned Frequencies: 152.840 MHz, Grant Date: 05/18/1999, Expiration Date: 04/01/2009, Cancellation Date: 03/09/2005, Registrant: Lewis H. Goldman, P.C., 1850 M Street, Nw Suite 1080, Washington, DC 20036, Phone: (202) 659-5353
- 9519 Lincoln Trails (Lat: 38.592528 Lon: -90.034250), Structure height: 148 m, Call Sign: KNKO932,
Assigned Frequencies: 931.262 MHz, Expiration Date: 01/26/2005, Cancellation Date: 05/10/2004, Certifier: Paul H Kuzia, Registrant: Wilkinson Barker Knauer, LLP, 2300 N Street, N.W., 7th Floor, Washington, DC 20037, Phone: (202) 783-4141, Fax: (202) 783-5851, Email:
- 100 Ludwig Drive (Lat: 38.600889 Lon: -89.991500), Type: Nntann, Structure height: 41.5 m, Overall height: 48.8 m, Call Sign: KTS202,
Assigned Frequencies: 459.225 MHz, 459.225 MHz, Grant Date: 08/27/2019, Expiration Date: 07/29/2029, Certifier: J. Roy Pottle, Registrant: Wilkinson Barker Knauer, LLP, 1800 M Street, N.W., Suite 800n, Washington, DC 20036, Phone: (202) 783-4141, Fax: (202) 783-5851, Email:
- Hwy 50, One Mile West Of (Lat: 38.592528 Lon: -90.034250), Call Sign: KWU229,
Assigned Frequencies: 158.100 MHz, Grant Date: 06/03/2008, Expiration Date: 07/01/2018, Cancellation Date: 08/18/2018, Certifier: Glenn E Rauh, Registrant: Hill & Welch, 1330 New Hampshire Ave., Nw #113, Washington, DC 20036, Phone: (202) 775-0070, Fax: (202) 775-9026, Email:
FCC Registered Maritime Coast & Aviation Ground Towers:
1- 10271 Lincoln Trail (Lat: 38.597278 Lon: -90.010944), Type: Building, Overall height: 8 m, Call Sign: WHG607,
Assigned Frequencies: 156.350 MHz, 156.800 MHz, 156.450 MHz, Grant Date: 02/06/2001, Expiration Date: 03/12/2011, Cancellation Date: 05/14/2011, Registrant: Metro East Limousine Service, 10271 Lincoln Trail, Fairview Heights, IL 62208
FCC Registered Amateur Radio Licenses:
88 (See the full list of FCC Registered Amateur Radio Licenses in Fairview Heights)FAA Registered Aircraft:
4- Aircraft: BEECH 95-B55 (T42A) (Category: Land, Engines: 2, Seats: 6, Weight: Up to 12,499 Pounds, Speed: 165 mph), Engine: CONT MOTOR I0-470 SERIES (260 HP) (Reciprocating)
N-Number: 2034A, N2034A, N-2034A, Serial Number: TC-2179, Year manufactured: 1978, Airworthiness Date: 09/18/1978, Certificate Issue Date: 12/31/2019
Registrant (LLC): Pegasus Flight LLC, 690 Pleasant Ridge Rd, Fairview Heights, IL 62208 - Aircraft: BEECH E33A (Category: Land, Seats: 4, Weight: Up to 12,499 Pounds, Speed: 138 mph), Engine: CONT MOTOR I0-470 SERIES (260 HP) (Reciprocating)
N-Number: 3496A, N3496A, N-3496A, Serial Number: CE-288, Year manufactured: 1969, Airworthiness Date: 05/20/1971, Certificate Issue Date: 11/07/2020
Registrant (LLC): M-1 Medical LLC, 351 Jubaka Dr, Fairview Heights, IL 62208 - Aircraft: MOONEY AIRCRAFT CORP. M20K (Category: Land, Seats: 4, Weight: Up to 12,499 Pounds), Engine: CONT MOTOR TSIO-360 SER (225 HP) (Reciprocating)
N-Number: 98184, N98184, N-98184, Serial Number: 25-0529, Year manufactured: 1981, Airworthiness Date: 02/27/1981, Certificate Issue Date: 05/05/2017
Registrant (Individual): Timothy M Gotto, 1050 Saint Clair Rd, Fairview Heights, IL 62208 - Aircraft: SWEENEY K/LEMLEY J ZENITH 701 (Category: Land, Seats: 2, Weight: Up to 12,499 Pounds), Engine: 4 Cycle
N-Number: 2601T, N2601T, N-2601T, Serial Number: 001, Certificate Issue Date: 03/01/2007
Registrant (Corporation): Vulcan Aircraft Engines LLC, 315 Carbon St, Fairview Heights, IL 62208
Deregistered: Cancel Date: 02/22/2017
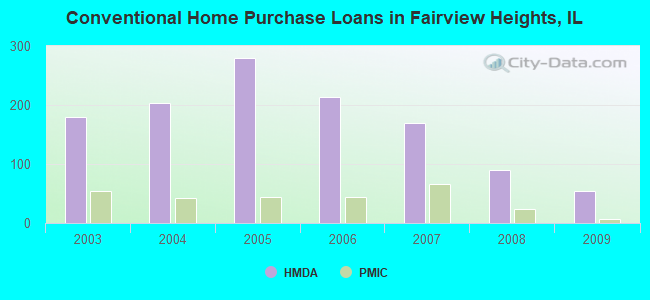
| Home Mortgage Disclosure Act Aggregated Statistics For Year 2009 (Based on 5 partial tracts) | ||||||||||||
| A) FHA, FSA/RHS & VA Home Purchase Loans | B) Conventional Home Purchase Loans | C) Refinancings | D) Home Improvement Loans | F) Non-occupant Loans on < 5 Family Dwellings (A B C & D) | G) Loans On Manufactured Home Dwelling (A B C & D) | |||||||
|---|---|---|---|---|---|---|---|---|---|---|---|---|
| Number | Average Value | Number | Average Value | Number | Average Value | Number | Average Value | Number | Average Value | Number | Average Value | |
| LOANS ORIGINATED | 83 | $132,537 | 54 | $97,333 | 313 | $131,941 | 21 | $43,502 | 32 | $76,586 | 2 | $57,465 |
| APPLICATIONS APPROVED, NOT ACCEPTED | 6 | $88,423 | 8 | $126,536 | 31 | $113,924 | 4 | $40,920 | 2 | $71,185 | 1 | $21,700 |
| APPLICATIONS DENIED | 4 | $111,102 | 9 | $115,470 | 101 | $125,987 | 20 | $31,652 | 4 | $81,130 | 3 | $37,667 |
| APPLICATIONS WITHDRAWN | 12 | $120,242 | 6 | $138,045 | 86 | $134,376 | 6 | $86,568 | 4 | $98,302 | 1 | $32,730 |
| FILES CLOSED FOR INCOMPLETENESS | 1 | $59,650 | 1 | $178,150 | 14 | $147,636 | 1 | $105,230 | 0 | $0 | 0 | $0 |
Detailed HMDA statistics for the following Tracts: 5024.04 , 5034.02, 5034.05, 5034.11, 5034.12
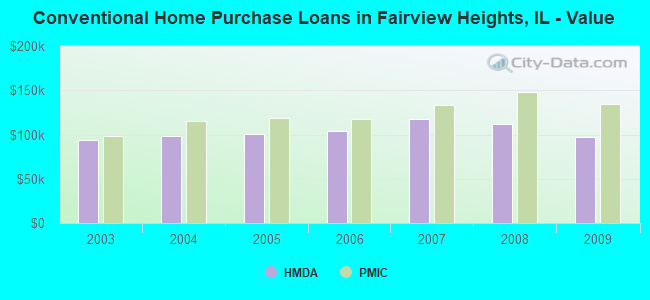
| Private Mortgage Insurance Companies Aggregated Statistics For Year 2009 (Based on 5 partial tracts) | ||||
| A) Conventional Home Purchase Loans | B) Refinancings | |||
|---|---|---|---|---|
| Number | Average Value | Number | Average Value | |
| LOANS ORIGINATED | 7 | $134,840 | 6 | $122,782 |
| APPLICATIONS APPROVED, NOT ACCEPTED | 0 | $0 | 3 | $217,817 |
| APPLICATIONS DENIED | 1 | $207,050 | 1 | $95,150 |
| APPLICATIONS WITHDRAWN | 0 | $0 | 0 | $0 |
| FILES CLOSED FOR INCOMPLETENESS | 0 | $0 | 0 | $0 |
Detailed PMIC statistics for the following Tracts: 5024.04 , 5034.02, 5034.05, 5034.11, 5034.12
2002 - 2018 National Fire Incident Reporting System (NFIRS) incidents
- Fire incident types reported to NFIRS in Fairview Heights, IL
- 64945.0%Structure Fires
- 47132.7%Outside Fires
- 28419.7%Mobile Property/Vehicle Fires
- 372.6%Other
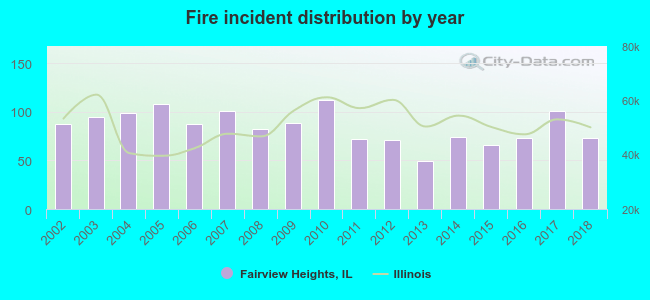 Based on the data from the years 2002 - 2018 the average number of fires per year is 85. The highest number of fire incidents - 112 took place in 2010, and the least - 49 in 2013. The data has a decreasing trend.
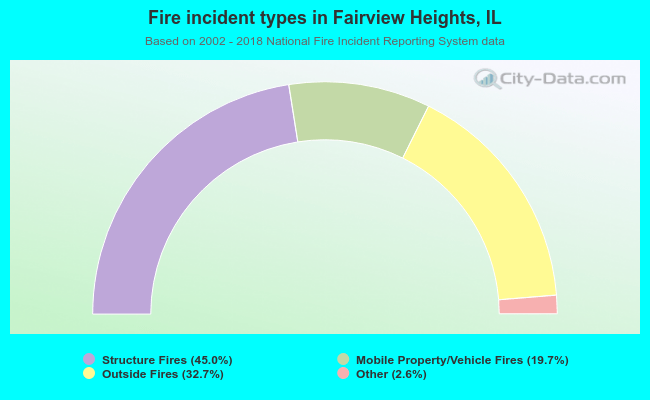 When looking into fire subcategories, the most incidents belonged to: Structure Fires (45.0%), and Outside Fires (32.7%).
Fire-safe hotels and motels in Fairview Heights, Illinois:
- Super 8 Motel, 45 Ludwig Dr, Fairview Heights, Illinois 62208 , Phone: (618) 398-8338
- Hampton Inn Fairview Heights, 150 Ludwig Dr, Fairview Heights, Illinois 62208 , Phone: (618) 397-9705, Fax: (618) 398-7124
- Best Western Camelot Inn, 311 Salem PL, Fairview Heights, Illinois 62208 , Phone: (618) 624-3636
- Drury Inn & Suites St Louis Fairview Heights, 12 Ludwig Dr, Fairview Heights, Illinois 62208 , Phone: (618) 398-8530
- Ramada, 6900 N Illinois St, Fairview Heights, Illinois 62208 , Phone: (618) 632-4747, Fax: (618) 632-9428
- Trailway Motel, 10039 Lincoln Trl, Fairview Heights, Illinois 62208 , Phone: (618) 397-5757, Fax: (618) 688-1008
- Fairfield Inn Fairview Heights, 140 Ludwig Dr, Fairview Heights, Illinois 62208 , Phone: (618) 398-7124
- Sheraton Four Points, 319 Fountains Pkwy, Fairview Heights, Illinois 62208 , Phone: (618) 622-9500, Fax: (618) 622-9548
- 3 other hotels and motels
| Most common first names in Fairview Heights, IL among deceased individuals | ||
| Name | Count | Lived (average) |
|---|---|---|
| Mary | 107 | 80.7 years |
| John | 106 | 71.6 years |
| William | 90 | 74.7 years |
| Robert | 79 | 69.9 years |
| James | 68 | 72.2 years |
| Joseph | 67 | 75.1 years |
| Charles | 61 | 71.5 years |
| Helen | 49 | 77.0 years |
| Frank | 44 | 75.4 years |
| Dorothy | 41 | 75.3 years |
| Most common last names in Fairview Heights, IL among deceased individuals | ||
| Last name | Count | Lived (average) |
|---|---|---|
| Smith | 33 | 77.8 years |
| Williams | 32 | 75.4 years |
| Jones | 26 | 74.0 years |
| Miller | 22 | 78.4 years |
| Johnson | 21 | 79.7 years |
| Brown | 20 | 77.9 years |
| Harris | 16 | 77.2 years |
| Thompson | 13 | 78.6 years |
| Wright | 13 | 77.7 years |
| Thomas | 13 | 76.2 years |
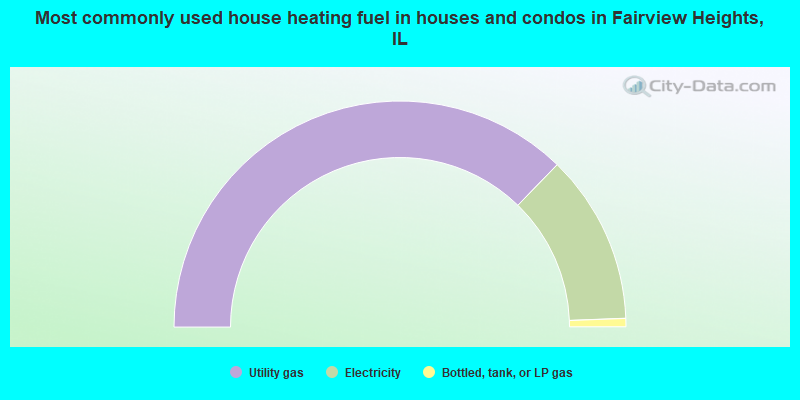
- 74.5%Utility gas
- 24.3%Electricity
- 1.2%Bottled, tank, or LP gas
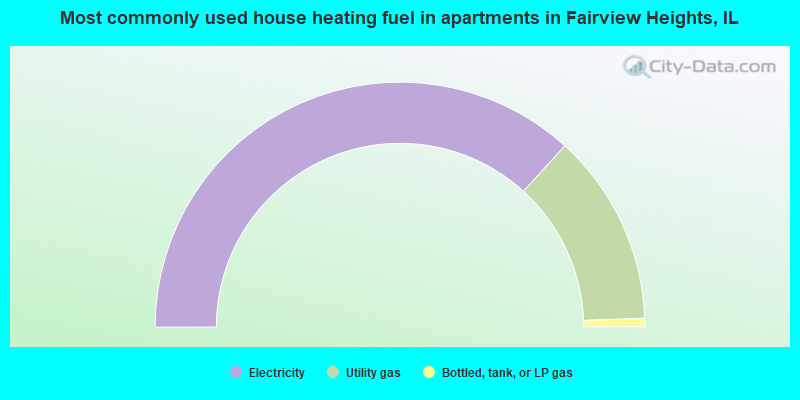
- 73.6%Electricity
- 25.4%Utility gas
- 1.1%Bottled, tank, or LP gas
Fairview Heights compared to Illinois state average:
- Unemployed percentage significantly below state average.
- Black race population percentage above state average.
- Hispanic race population percentage significantly below state average.
- Foreign-born population percentage significantly below state average.
- Length of stay since moving in significantly above state average.

|
|
Total of 43 patent applications in 2008-2024.