Florence, Kentucky Submit your own pictures of this city and show them to the world
OSM Map
General Map
Google Map
MSN Map
OSM Map
General Map
Google Map
MSN Map
OSM Map
General Map
Google Map
MSN Map
OSM Map
General Map
Google Map
MSN Map
Please wait while loading the map...
Population in 2022: 32,618 (100% urban, 0% rural). Population change since 2000: +38.5%Males: 16,126 Females: 16,492
March 2022 cost of living index in Florence: 88.5 (less than average, U.S. average is 100) Percentage of residents living in poverty in 2022: 7.6%for White Non-Hispanic residents , 20.3% for Black residents , 1.0% for Hispanic or Latino residents , 3.0% for other race residents , 0.7% for two or more races residents )
Profiles of local businesses
Business Search - 14 Million verified businesses
Data:
Median household income ($)
Median household income (% change since 2000)
Household income diversity
Ratio of average income to average house value (%)
Ratio of average income to average rent
Median household income ($) - White
Median household income ($) - Black or African American
Median household income ($) - Asian
Median household income ($) - Hispanic or Latino
Median household income ($) - American Indian and Alaska Native
Median household income ($) - Multirace
Median household income ($) - Other Race
Median household income for houses/condos with a mortgage ($)
Median household income for apartments without a mortgage ($)
Races - White alone (%)
Races - White alone (% change since 2000)
Races - Black alone (%)
Races - Black alone (% change since 2000)
Races - American Indian alone (%)
Races - American Indian alone (% change since 2000)
Races - Asian alone (%)
Races - Asian alone (% change since 2000)
Races - Hispanic (%)
Races - Hispanic (% change since 2000)
Races - Native Hawaiian and Other Pacific Islander alone (%)
Races - Native Hawaiian and Other Pacific Islander alone (% change since 2000)
Races - Two or more races (%)
Races - Two or more races (% change since 2000)
Races - Other race alone (%)
Races - Other race alone (% change since 2000)
Racial diversity
Unemployment (%)
Unemployment (% change since 2000)
Unemployment (%) - White
Unemployment (%) - Black or African American
Unemployment (%) - Asian
Unemployment (%) - Hispanic or Latino
Unemployment (%) - American Indian and Alaska Native
Unemployment (%) - Multirace
Unemployment (%) - Other Race
Population density (people per square mile)
Population - Males (%)
Population - Females (%)
Population - Males (%) - White
Population - Males (%) - Black or African American
Population - Males (%) - Asian
Population - Males (%) - Hispanic or Latino
Population - Males (%) - American Indian and Alaska Native
Population - Males (%) - Multirace
Population - Males (%) - Other Race
Population - Females (%) - White
Population - Females (%) - Black or African American
Population - Females (%) - Asian
Population - Females (%) - Hispanic or Latino
Population - Females (%) - American Indian and Alaska Native
Population - Females (%) - Multirace
Population - Females (%) - Other Race
Coronavirus confirmed cases (Jun 16, 2024)
Deaths caused by coronavirus (Jun 16, 2024)
Coronavirus confirmed cases (per 100k population) (Jun 16, 2024)
Deaths caused by coronavirus (per 100k population) (Jun 16, 2024)
Daily increase in number of cases (Jun 16, 2024)
Weekly increase in number of cases (Jun 16, 2024)
Cases doubled (in days) (Jun 16, 2024)
Hospitalized patients (Apr 18, 2022)
Negative test results (Apr 18, 2022)
Total test results (Apr 18, 2022)
COVID Vaccine doses distributed (per 100k population) (Sep 19, 2023)
COVID Vaccine doses administered (per 100k population) (Sep 19, 2023)
COVID Vaccine doses distributed (Sep 19, 2023)
COVID Vaccine doses administered (Sep 19, 2023)
Likely homosexual households (%)
Likely homosexual households (% change since 2000)
Likely homosexual households - Lesbian couples (%)
Likely homosexual households - Lesbian couples (% change since 2000)
Likely homosexual households - Gay men (%)
Likely homosexual households - Gay men (% change since 2000)
Cost of living index
Median gross rent ($)
Median contract rent ($)
Median monthly housing costs ($)
Median house or condo value ($)
Median house or condo value ($ change since 2000)
Mean house or condo value by units in structure - 1, detached ($)
Mean house or condo value by units in structure - 1, attached ($)
Mean house or condo value by units in structure - 2 ($)
Mean house or condo value by units in structure by units in structure - 3 or 4 ($)
Mean house or condo value by units in structure - 5 or more ($)
Mean house or condo value by units in structure - Boat, RV, van, etc. ($)
Mean house or condo value by units in structure - Mobile home ($)
Median house or condo value ($) - White
Median house or condo value ($) - Black or African American
Median house or condo value ($) - Asian
Median house or condo value ($) - Hispanic or Latino
Median house or condo value ($) - American Indian and Alaska Native
Median house or condo value ($) - Multirace
Median house or condo value ($) - Other Race
Median resident age
Resident age diversity
Median resident age - Males
Median resident age - Females
Median resident age - White
Median resident age - Black or African American
Median resident age - Asian
Median resident age - Hispanic or Latino
Median resident age - American Indian and Alaska Native
Median resident age - Multirace
Median resident age - Other Race
Median resident age - Males - White
Median resident age - Males - Black or African American
Median resident age - Males - Asian
Median resident age - Males - Hispanic or Latino
Median resident age - Males - American Indian and Alaska Native
Median resident age - Males - Multirace
Median resident age - Males - Other Race
Median resident age - Females - White
Median resident age - Females - Black or African American
Median resident age - Females - Asian
Median resident age - Females - Hispanic or Latino
Median resident age - Females - American Indian and Alaska Native
Median resident age - Females - Multirace
Median resident age - Females - Other Race
Commute - mean travel time to work (minutes)
Travel time to work - Less than 5 minutes (%)
Travel time to work - Less than 5 minutes (% change since 2000)
Travel time to work - 5 to 9 minutes (%)
Travel time to work - 5 to 9 minutes (% change since 2000)
Travel time to work - 10 to 19 minutes (%)
Travel time to work - 10 to 19 minutes (% change since 2000)
Travel time to work - 20 to 29 minutes (%)
Travel time to work - 20 to 29 minutes (% change since 2000)
Travel time to work - 30 to 39 minutes (%)
Travel time to work - 30 to 39 minutes (% change since 2000)
Travel time to work - 40 to 59 minutes (%)
Travel time to work - 40 to 59 minutes (% change since 2000)
Travel time to work - 60 to 89 minutes (%)
Travel time to work - 60 to 89 minutes (% change since 2000)
Travel time to work - 90 or more minutes (%)
Travel time to work - 90 or more minutes (% change since 2000)
Marital status - Never married (%)
Marital status - Now married (%)
Marital status - Separated (%)
Marital status - Widowed (%)
Marital status - Divorced (%)
Median family income ($)
Median family income (% change since 2000)
Median non-family income ($)
Median non-family income (% change since 2000)
Median per capita income ($)
Median per capita income (% change since 2000)
Median family income ($) - White
Median family income ($) - Black or African American
Median family income ($) - Asian
Median family income ($) - Hispanic or Latino
Median family income ($) - American Indian and Alaska Native
Median family income ($) - Multirace
Median family income ($) - Other Race
Median year house/condo built
Median year apartment built
Year house built - Built 2005 or later (%)
Year house built - Built 2000 to 2004 (%)
Year house built - Built 1990 to 1999 (%)
Year house built - Built 1980 to 1989 (%)
Year house built - Built 1970 to 1979 (%)
Year house built - Built 1960 to 1969 (%)
Year house built - Built 1950 to 1959 (%)
Year house built - Built 1940 to 1949 (%)
Year house built - Built 1939 or earlier (%)
Average household size
Household density (households per square mile)
Average household size - White
Average household size - Black or African American
Average household size - Asian
Average household size - Hispanic or Latino
Average household size - American Indian and Alaska Native
Average household size - Multirace
Average household size - Other Race
Occupied housing units (%)
Vacant housing units (%)
Owner occupied housing units (%)
Renter occupied housing units (%)
Vacancy status - For rent (%)
Vacancy status - For sale only (%)
Vacancy status - Rented or sold, not occupied (%)
Vacancy status - For seasonal, recreational, or occasional use (%)
Vacancy status - For migrant workers (%)
Vacancy status - Other vacant (%)
Residents with income below the poverty level (%)
Residents with income below 50% of the poverty level (%)
Children below poverty level (%)
Poor families by family type - Married-couple family (%)
Poor families by family type - Male, no wife present (%)
Poor families by family type - Female, no husband present (%)
Poverty status for native-born residents (%)
Poverty status for foreign-born residents (%)
Poverty among high school graduates not in families (%)
Poverty among people who did not graduate high school not in families (%)
Residents with income below the poverty level (%) - White
Residents with income below the poverty level (%) - Black or African American
Residents with income below the poverty level (%) - Asian
Residents with income below the poverty level (%) - Hispanic or Latino
Residents with income below the poverty level (%) - American Indian and Alaska Native
Residents with income below the poverty level (%) - Multirace
Residents with income below the poverty level (%) - Other Race
Air pollution - Air Quality Index (AQI)
Air pollution - CO
Air pollution - NO2
Air pollution - SO2
Air pollution - Ozone
Air pollution - PM10
Air pollution - PM25
Air pollution - Pb
Crime - Murders per 100,000 population
Crime - Rapes per 100,000 population
Crime - Robberies per 100,000 population
Crime - Assaults per 100,000 population
Crime - Burglaries per 100,000 population
Crime - Thefts per 100,000 population
Crime - Auto thefts per 100,000 population
Crime - Arson per 100,000 population
Crime - City-data.com crime index
Crime - Violent crime index
Crime - Property crime index
Crime - Murders per 100,000 population (5 year average)
Crime - Rapes per 100,000 population (5 year average)
Crime - Robberies per 100,000 population (5 year average)
Crime - Assaults per 100,000 population (5 year average)
Crime - Burglaries per 100,000 population (5 year average)
Crime - Thefts per 100,000 population (5 year average)
Crime - Auto thefts per 100,000 population (5 year average)
Crime - Arson per 100,000 population (5 year average)
Crime - City-data.com crime index (5 year average)
Crime - Violent crime index (5 year average)
Crime - Property crime index (5 year average)
1996 Presidential Elections Results (%) - Democratic Party (Clinton)
1996 Presidential Elections Results (%) - Republican Party (Dole)
1996 Presidential Elections Results (%) - Other
2000 Presidential Elections Results (%) - Democratic Party (Gore)
2000 Presidential Elections Results (%) - Republican Party (Bush)
2000 Presidential Elections Results (%) - Other
2004 Presidential Elections Results (%) - Democratic Party (Kerry)
2004 Presidential Elections Results (%) - Republican Party (Bush)
2004 Presidential Elections Results (%) - Other
2008 Presidential Elections Results (%) - Democratic Party (Obama)
2008 Presidential Elections Results (%) - Republican Party (McCain)
2008 Presidential Elections Results (%) - Other
2012 Presidential Elections Results (%) - Democratic Party (Obama)
2012 Presidential Elections Results (%) - Republican Party (Romney)
2012 Presidential Elections Results (%) - Other
2016 Presidential Elections Results (%) - Democratic Party (Clinton)
2016 Presidential Elections Results (%) - Republican Party (Trump)
2016 Presidential Elections Results (%) - Other
2020 Presidential Elections Results (%) - Democratic Party (Biden)
2020 Presidential Elections Results (%) - Republican Party (Trump)
2020 Presidential Elections Results (%) - Other
Ancestries Reported - Arab (%)
Ancestries Reported - Czech (%)
Ancestries Reported - Danish (%)
Ancestries Reported - Dutch (%)
Ancestries Reported - English (%)
Ancestries Reported - French (%)
Ancestries Reported - French Canadian (%)
Ancestries Reported - German (%)
Ancestries Reported - Greek (%)
Ancestries Reported - Hungarian (%)
Ancestries Reported - Irish (%)
Ancestries Reported - Italian (%)
Ancestries Reported - Lithuanian (%)
Ancestries Reported - Norwegian (%)
Ancestries Reported - Polish (%)
Ancestries Reported - Portuguese (%)
Ancestries Reported - Russian (%)
Ancestries Reported - Scotch-Irish (%)
Ancestries Reported - Scottish (%)
Ancestries Reported - Slovak (%)
Ancestries Reported - Subsaharan African (%)
Ancestries Reported - Swedish (%)
Ancestries Reported - Swiss (%)
Ancestries Reported - Ukrainian (%)
Ancestries Reported - United States (%)
Ancestries Reported - Welsh (%)
Ancestries Reported - West Indian (%)
Ancestries Reported - Other (%)
Educational Attainment - No schooling completed (%)
Educational Attainment - Less than high school (%)
Educational Attainment - High school or equivalent (%)
Educational Attainment - Less than 1 year of college (%)
Educational Attainment - 1 or more years of college (%)
Educational Attainment - Associate degree (%)
Educational Attainment - Bachelor's degree (%)
Educational Attainment - Master's degree (%)
Educational Attainment - Professional school degree (%)
Educational Attainment - Doctorate degree (%)
School Enrollment - Nursery, preschool (%)
School Enrollment - Kindergarten (%)
School Enrollment - Grade 1 to 4 (%)
School Enrollment - Grade 5 to 8 (%)
School Enrollment - Grade 9 to 12 (%)
School Enrollment - College undergrad (%)
School Enrollment - Graduate or professional (%)
School Enrollment - Not enrolled in school (%)
School enrollment - Public schools (%)
School enrollment - Private schools (%)
School enrollment - Not enrolled (%)
Median number of rooms in houses and condos
Median number of rooms in apartments
Housing units lacking complete plumbing facilities (%)
Housing units lacking complete kitchen facilities (%)
Density of houses
Urban houses (%)
Rural houses (%)
Households with people 60 years and over (%)
Households with people 65 years and over (%)
Households with people 75 years and over (%)
Households with one or more nonrelatives (%)
Households with no nonrelatives (%)
Population in households (%)
Family households (%)
Nonfamily households (%)
Population in families (%)
Family households with own children (%)
Median number of bedrooms in owner occupied houses
Mean number of bedrooms in owner occupied houses
Median number of bedrooms in renter occupied houses
Mean number of bedrooms in renter occupied houses
Median number of vehichles in owner occupied houses
Mean number of vehichles in owner occupied houses
Median number of vehichles in renter occupied houses
Mean number of vehichles in renter occupied houses
Mortgage status - with mortgage (%)
Mortgage status - with second mortgage (%)
Mortgage status - with home equity loan (%)
Mortgage status - with both second mortgage and home equity loan (%)
Mortgage status - without a mortgage (%)
Average family size
Average family size - White
Average family size - Black or African American
Average family size - Asian
Average family size - Hispanic or Latino
Average family size - American Indian and Alaska Native
Average family size - Multirace
Average family size - Other Race
Geographical mobility - Same house 1 year ago (%)
Geographical mobility - Moved within same county (%)
Geographical mobility - Moved from different county within same state (%)
Geographical mobility - Moved from different state (%)
Geographical mobility - Moved from abroad (%)
Place of birth - Born in state of residence (%)
Place of birth - Born in other state (%)
Place of birth - Native, outside of US (%)
Place of birth - Foreign born (%)
Housing units in structures - 1, detached (%)
Housing units in structures - 1, attached (%)
Housing units in structures - 2 (%)
Housing units in structures - 3 or 4 (%)
Housing units in structures - 5 to 9 (%)
Housing units in structures - 10 to 19 (%)
Housing units in structures - 20 to 49 (%)
Housing units in structures - 50 or more (%)
Housing units in structures - Mobile home (%)
Housing units in structures - Boat, RV, van, etc. (%)
House/condo owner moved in on average (years ago)
Renter moved in on average (years ago)
Year householder moved into unit - Moved in 1999 to March 2000 (%)
Year householder moved into unit - Moved in 1995 to 1998 (%)
Year householder moved into unit - Moved in 1990 to 1994 (%)
Year householder moved into unit - Moved in 1980 to 1989 (%)
Year householder moved into unit - Moved in 1970 to 1979 (%)
Year householder moved into unit - Moved in 1969 or earlier (%)
Means of transportation to work - Drove car alone (%)
Means of transportation to work - Carpooled (%)
Means of transportation to work - Public transportation (%)
Means of transportation to work - Bus or trolley bus (%)
Means of transportation to work - Streetcar or trolley car (%)
Means of transportation to work - Subway or elevated (%)
Means of transportation to work - Railroad (%)
Means of transportation to work - Ferryboat (%)
Means of transportation to work - Taxicab (%)
Means of transportation to work - Motorcycle (%)
Means of transportation to work - Bicycle (%)
Means of transportation to work - Walked (%)
Means of transportation to work - Other means (%)
Working at home (%)
Industry diversity
Most Common Industries - Agriculture, forestry, fishing and hunting, and mining (%)
Most Common Industries - Agriculture, forestry, fishing and hunting (%)
Most Common Industries - Mining, quarrying, and oil and gas extraction (%)
Most Common Industries - Construction (%)
Most Common Industries - Manufacturing (%)
Most Common Industries - Wholesale trade (%)
Most Common Industries - Retail trade (%)
Most Common Industries - Transportation and warehousing, and utilities (%)
Most Common Industries - Transportation and warehousing (%)
Most Common Industries - Utilities (%)
Most Common Industries - Information (%)
Most Common Industries - Finance and insurance, and real estate and rental and leasing (%)
Most Common Industries - Finance and insurance (%)
Most Common Industries - Real estate and rental and leasing (%)
Most Common Industries - Professional, scientific, and management, and administrative and waste management services (%)
Most Common Industries - Professional, scientific, and technical services (%)
Most Common Industries - Management of companies and enterprises (%)
Most Common Industries - Administrative and support and waste management services (%)
Most Common Industries - Educational services, and health care and social assistance (%)
Most Common Industries - Educational services (%)
Most Common Industries - Health care and social assistance (%)
Most Common Industries - Arts, entertainment, and recreation, and accommodation and food services (%)
Most Common Industries - Arts, entertainment, and recreation (%)
Most Common Industries - Accommodation and food services (%)
Most Common Industries - Other services, except public administration (%)
Most Common Industries - Public administration (%)
Occupation diversity
Most Common Occupations - Management, business, science, and arts occupations (%)
Most Common Occupations - Management, business, and financial occupations (%)
Most Common Occupations - Management occupations (%)
Most Common Occupations - Business and financial operations occupations (%)
Most Common Occupations - Computer, engineering, and science occupations (%)
Most Common Occupations - Computer and mathematical occupations (%)
Most Common Occupations - Architecture and engineering occupations (%)
Most Common Occupations - Life, physical, and social science occupations (%)
Most Common Occupations - Education, legal, community service, arts, and media occupations (%)
Most Common Occupations - Community and social service occupations (%)
Most Common Occupations - Legal occupations (%)
Most Common Occupations - Education, training, and library occupations (%)
Most Common Occupations - Arts, design, entertainment, sports, and media occupations (%)
Most Common Occupations - Healthcare practitioners and technical occupations (%)
Most Common Occupations - Health diagnosing and treating practitioners and other technical occupations (%)
Most Common Occupations - Health technologists and technicians (%)
Most Common Occupations - Service occupations (%)
Most Common Occupations - Healthcare support occupations (%)
Most Common Occupations - Protective service occupations (%)
Most Common Occupations - Fire fighting and prevention, and other protective service workers including supervisors (%)
Most Common Occupations - Law enforcement workers including supervisors (%)
Most Common Occupations - Food preparation and serving related occupations (%)
Most Common Occupations - Building and grounds cleaning and maintenance occupations (%)
Most Common Occupations - Personal care and service occupations (%)
Most Common Occupations - Sales and office occupations (%)
Most Common Occupations - Sales and related occupations (%)
Most Common Occupations - Office and administrative support occupations (%)
Most Common Occupations - Natural resources, construction, and maintenance occupations (%)
Most Common Occupations - Farming, fishing, and forestry occupations (%)
Most Common Occupations - Construction and extraction occupations (%)
Most Common Occupations - Installation, maintenance, and repair occupations (%)
Most Common Occupations - Production, transportation, and material moving occupations (%)
Most Common Occupations - Production occupations (%)
Most Common Occupations - Transportation occupations (%)
Most Common Occupations - Material moving occupations (%)
People in Group quarters - Institutionalized population (%)
People in Group quarters - Correctional institutions (%)
People in Group quarters - Federal prisons and detention centers (%)
People in Group quarters - Halfway houses (%)
People in Group quarters - Local jails and other confinement facilities (including police lockups) (%)
People in Group quarters - Military disciplinary barracks (%)
People in Group quarters - State prisons (%)
People in Group quarters - Other types of correctional institutions (%)
People in Group quarters - Nursing homes (%)
People in Group quarters - Hospitals/wards, hospices, and schools for the handicapped (%)
People in Group quarters - Hospitals/wards and hospices for chronically ill (%)
People in Group quarters - Hospices or homes for chronically ill (%)
People in Group quarters - Military hospitals or wards for chronically ill (%)
People in Group quarters - Other hospitals or wards for chronically ill (%)
People in Group quarters - Hospitals or wards for drug/alcohol abuse (%)
People in Group quarters - Mental (Psychiatric) hospitals or wards (%)
People in Group quarters - Schools, hospitals, or wards for the mentally retarded (%)
People in Group quarters - Schools, hospitals, or wards for the physically handicapped (%)
People in Group quarters - Institutions for the deaf (%)
People in Group quarters - Institutions for the blind (%)
People in Group quarters - Orthopedic wards and institutions for the physically handicapped (%)
People in Group quarters - Wards in general hospitals for patients who have no usual home elsewhere (%)
People in Group quarters - Wards in military hospitals for patients who have no usual home elsewhere (%)
People in Group quarters - Juvenile institutions (%)
People in Group quarters - Long-term care (%)
People in Group quarters - Homes for abused, dependent, and neglected children (%)
People in Group quarters - Residential treatment centers for emotionally disturbed children (%)
People in Group quarters - Training schools for juvenile delinquents (%)
People in Group quarters - Short-term care, detention or diagnostic centers for delinquent children (%)
People in Group quarters - Type of juvenile institution unknown (%)
People in Group quarters - Noninstitutionalized population (%)
People in Group quarters - College dormitories (includes college quarters off campus) (%)
People in Group quarters - Military quarters (%)
People in Group quarters - On base (%)
People in Group quarters - Barracks, unaccompanied personnel housing (UPH), (Enlisted/Officer), ;and similar group living quarters for military personnel (%)
People in Group quarters - Transient quarters for temporary residents (%)
People in Group quarters - Military ships (%)
People in Group quarters - Group homes (%)
People in Group quarters - Homes or halfway houses for drug/alcohol abuse (%)
People in Group quarters - Homes for the mentally ill (%)
People in Group quarters - Homes for the mentally retarded (%)
People in Group quarters - Homes for the physically handicapped (%)
People in Group quarters - Other group homes (%)
People in Group quarters - Religious group quarters (%)
People in Group quarters - Dormitories (%)
People in Group quarters - Agriculture workers' dormitories on farms (%)
People in Group quarters - Job Corps and vocational training facilities (%)
People in Group quarters - Other workers' dormitories (%)
People in Group quarters - Crews of maritime vessels (%)
People in Group quarters - Other nonhousehold living situations (%)
People in Group quarters - Other noninstitutional group quarters (%)
Residents speaking English at home (%)
Residents speaking English at home - Born in the United States (%)
Residents speaking English at home - Native, born elsewhere (%)
Residents speaking English at home - Foreign born (%)
Residents speaking Spanish at home (%)
Residents speaking Spanish at home - Born in the United States (%)
Residents speaking Spanish at home - Native, born elsewhere (%)
Residents speaking Spanish at home - Foreign born (%)
Residents speaking other language at home (%)
Residents speaking other language at home - Born in the United States (%)
Residents speaking other language at home - Native, born elsewhere (%)
Residents speaking other language at home - Foreign born (%)
Class of Workers - Employee of private company (%)
Class of Workers - Self-employed in own incorporated business (%)
Class of Workers - Private not-for-profit wage and salary workers (%)
Class of Workers - Local government workers (%)
Class of Workers - State government workers (%)
Class of Workers - Federal government workers (%)
Class of Workers - Self-employed workers in own not incorporated business and Unpaid family workers (%)
House heating fuel used in houses and condos - Utility gas (%)
House heating fuel used in houses and condos - Bottled, tank, or LP gas (%)
House heating fuel used in houses and condos - Electricity (%)
House heating fuel used in houses and condos - Fuel oil, kerosene, etc. (%)
House heating fuel used in houses and condos - Coal or coke (%)
House heating fuel used in houses and condos - Wood (%)
House heating fuel used in houses and condos - Solar energy (%)
House heating fuel used in houses and condos - Other fuel (%)
House heating fuel used in houses and condos - No fuel used (%)
House heating fuel used in apartments - Utility gas (%)
House heating fuel used in apartments - Bottled, tank, or LP gas (%)
House heating fuel used in apartments - Electricity (%)
House heating fuel used in apartments - Fuel oil, kerosene, etc. (%)
House heating fuel used in apartments - Coal or coke (%)
House heating fuel used in apartments - Wood (%)
House heating fuel used in apartments - Solar energy (%)
House heating fuel used in apartments - Other fuel (%)
House heating fuel used in apartments - No fuel used (%)
Armed forces status - In Armed Forces (%)
Armed forces status - Civilian (%)
Armed forces status - Civilian - Veteran (%)
Armed forces status - Civilian - Nonveteran (%)
Fatal accidents locations in years 2005-2021
Fatal accidents locations in 2005
Fatal accidents locations in 2006
Fatal accidents locations in 2007
Fatal accidents locations in 2008
Fatal accidents locations in 2009
Fatal accidents locations in 2010
Fatal accidents locations in 2011
Fatal accidents locations in 2012
Fatal accidents locations in 2013
Fatal accidents locations in 2014
Fatal accidents locations in 2015
Fatal accidents locations in 2016
Fatal accidents locations in 2017
Fatal accidents locations in 2018
Fatal accidents locations in 2019
Fatal accidents locations in 2020
Fatal accidents locations in 2021
Alcohol use - People drinking some alcohol every month (%)
Alcohol use - People not drinking at all (%)
Alcohol use - Average days/month drinking alcohol
Alcohol use - Average drinks/week
Alcohol use - Average days/year people drink much
Audiometry - Average condition of hearing (%)
Audiometry - People that can hear a whisper from across a quiet room (%)
Audiometry - People that can hear normal voice from across a quiet room (%)
Audiometry - Ears ringing, roaring, buzzing (%)
Audiometry - Had a job exposure to loud noise (%)
Audiometry - Had off-work exposure to loud noise (%)
Blood Pressure & Cholesterol - Has high blood pressure (%)
Blood Pressure & Cholesterol - Checking blood pressure at home (%)
Blood Pressure & Cholesterol - Frequently checking blood cholesterol (%)
Blood Pressure & Cholesterol - Has high cholesterol level (%)
Consumer Behavior - Money monthly spent on food at supermarket/grocery store
Consumer Behavior - Money monthly spent on food at other stores
Consumer Behavior - Money monthly spent on eating out
Consumer Behavior - Money monthly spent on carryout/delivered foods
Consumer Behavior - Income spent on food at supermarket/grocery store (%)
Consumer Behavior - Income spent on food at other stores (%)
Consumer Behavior - Income spent on eating out (%)
Consumer Behavior - Income spent on carryout/delivered foods (%)
Current Health Status - General health condition (%)
Current Health Status - Blood donors (%)
Current Health Status - Has blood ever tested for HIV virus (%)
Current Health Status - Left-handed people (%)
Dermatology - People using sunscreen (%)
Diabetes - Diabetics (%)
Diabetes - Had a blood test for high blood sugar (%)
Diabetes - People taking insulin (%)
Diet Behavior & Nutrition - Diet health (%)
Diet Behavior & Nutrition - Milk product consumption (# of products/month)
Diet Behavior & Nutrition - Meals not home prepared (#/week)
Diet Behavior & Nutrition - Meals from fast food or pizza place (#/week)
Diet Behavior & Nutrition - Ready-to-eat foods (#/month)
Diet Behavior & Nutrition - Frozen meals/pizza (#/month)
Drug Use - People that ever used marijuana or hashish (%)
Drug Use - Ever used hard drugs (%)
Drug Use - Ever used any form of cocaine (%)
Drug Use - Ever used heroin (%)
Drug Use - Ever used methamphetamine (%)
Health Insurance - People covered by health insurance (%)
Kidney Conditions-Urology - Avg. # of times urinating at night
Medical Conditions - People with asthma (%)
Medical Conditions - People with anemia (%)
Medical Conditions - People with psoriasis (%)
Medical Conditions - People with overweight (%)
Medical Conditions - Elderly people having difficulties in thinking or remembering (%)
Medical Conditions - People who ever received blood transfusion (%)
Medical Conditions - People having trouble seeing even with glass/contacts (%)
Medical Conditions - People with arthritis (%)
Medical Conditions - People with gout (%)
Medical Conditions - People with congestive heart failure (%)
Medical Conditions - People with coronary heart disease (%)
Medical Conditions - People with angina pectoris (%)
Medical Conditions - People who ever had heart attack (%)
Medical Conditions - People who ever had stroke (%)
Medical Conditions - People with emphysema (%)
Medical Conditions - People with thyroid problem (%)
Medical Conditions - People with chronic bronchitis (%)
Medical Conditions - People with any liver condition (%)
Medical Conditions - People who ever had cancer or malignancy (%)
Mental Health - People who have little interest in doing things (%)
Mental Health - People feeling down, depressed, or hopeless (%)
Mental Health - People who have trouble sleeping or sleeping too much (%)
Mental Health - People feeling tired or having little energy (%)
Mental Health - People with poor appetite or overeating (%)
Mental Health - People feeling bad about themself (%)
Mental Health - People who have trouble concentrating on things (%)
Mental Health - People moving or speaking slowly or too fast (%)
Mental Health - People having thoughts they would be better off dead (%)
Oral Health - Average years since last visit a dentist
Oral Health - People embarrassed because of mouth (%)
Oral Health - People with gum disease (%)
Oral Health - General health of teeth and gums (%)
Oral Health - Average days a week using dental floss/device
Oral Health - Average days a week using mouthwash for dental problem
Oral Health - Average number of teeth
Pesticide Use - Households using pesticides to control insects (%)
Pesticide Use - Households using pesticides to kill weeds (%)
Physical Activity - People doing vigorous-intensity work activities (%)
Physical Activity - People doing moderate-intensity work activities (%)
Physical Activity - People walking or bicycling (%)
Physical Activity - People doing vigorous-intensity recreational activities (%)
Physical Activity - People doing moderate-intensity recreational activities (%)
Physical Activity - Average hours a day doing sedentary activities
Physical Activity - Average hours a day watching TV or videos
Physical Activity - Average hours a day using computer
Physical Functioning - People having limitations keeping them from working (%)
Physical Functioning - People limited in amount of work they can do (%)
Physical Functioning - People that need special equipment to walk (%)
Physical Functioning - People experiencing confusion/memory problems (%)
Physical Functioning - People requiring special healthcare equipment (%)
Prescription Medications - Average number of prescription medicines taking
Preventive Aspirin Use - Adults 40+ taking low-dose aspirin (%)
Reproductive Health - Vaginal deliveries (%)
Reproductive Health - Cesarean deliveries (%)
Reproductive Health - Deliveries resulted in a live birth (%)
Reproductive Health - Pregnancies resulted in a delivery (%)
Reproductive Health - Women breastfeeding newborns (%)
Reproductive Health - Women that had a hysterectomy (%)
Reproductive Health - Women that had both ovaries removed (%)
Reproductive Health - Women that have ever taken birth control pills (%)
Reproductive Health - Women taking birth control pills (%)
Reproductive Health - Women that have ever used Depo-Provera or injectables (%)
Reproductive Health - Women that have ever used female hormones (%)
Sexual Behavior - People 18+ that ever had sex (vaginal, anal, or oral) (%)
Sexual Behavior - Males 18+ that ever had vaginal sex with a woman (%)
Sexual Behavior - Males 18+ that ever performed oral sex on a woman (%)
Sexual Behavior - Males 18+ that ever had anal sex with a woman (%)
Sexual Behavior - Males 18+ that ever had any sex with a man (%)
Sexual Behavior - Females 18+ that ever had vaginal sex with a man (%)
Sexual Behavior - Females 18+ that ever performed oral sex on a man (%)
Sexual Behavior - Females 18+ that ever had anal sex with a man (%)
Sexual Behavior - Females 18+ that ever had any kind of sex with a woman (%)
Sexual Behavior - Average age people first had sex
Sexual Behavior - Average number of female sex partners in lifetime (males 18+)
Sexual Behavior - Average number of female vaginal sex partners in lifetime (males 18+)
Sexual Behavior - Average age people first performed oral sex on a woman (18+)
Sexual Behavior - Average number of woman performed oral sex on in lifetime (18+)
Sexual Behavior - Average number of male sex partners in lifetime (males 18+)
Sexual Behavior - Average number of male anal sex partners in lifetime (males 18+)
Sexual Behavior - Average age people first performed oral sex on a man (18+)
Sexual Behavior - Average number of male oral sex partners in lifetime (18+)
Sexual Behavior - People using protection when performing oral sex (%)
Sexual Behavior - Average number of times people have vaginal or anal sex a year
Sexual Behavior - People having sex without condom (%)
Sexual Behavior - Average number of male sex partners in lifetime (females 18+)
Sexual Behavior - Average number of male vaginal sex partners in lifetime (females 18+)
Sexual Behavior - Average number of female sex partners in lifetime (females 18+)
Sexual Behavior - Circumcised males 18+ (%)
Sleep Disorders - Average hours sleeping at night
Sleep Disorders - People that has trouble sleeping (%)
Smoking-Cigarette Use - People smoking cigarettes (%)
Taste & Smell - People 40+ having problems with smell (%)
Taste & Smell - People 40+ having problems with taste (%)
Taste & Smell - People 40+ that ever had wisdom teeth removed (%)
Taste & Smell - People 40+ that ever had tonsils teeth removed (%)
Taste & Smell - People 40+ that ever had a loss of consciousness because of a head injury (%)
Taste & Smell - People 40+ that ever had a broken nose or other serious injury to face or skull (%)
Taste & Smell - People 40+ that ever had two or more sinus infections (%)
Weight - Average height (inches)
Weight - Average weight (pounds)
Weight - Average BMI
Weight - People that are obese (%)
Weight - People that ever were obese (%)
Weight - People trying to lose weight (%)
According to our research of Kentucky and other state lists, there were 68 registered sex offenders living in Florence, Kentucky as of June 16, 2024 . The ratio of all residents to sex offenders in Florence is 469 to 1.The ratio of registered sex offenders to all residents in this city is near the state average.
Officers per 1,000 residents here:
1.98Kentucky average:
1.89
Latest news from Florence, KY collected exclusively by city-data.com from local newspapers, TV, and radio stations
Ancestries: German (19.7%), English (11.8%), American (10.3%), Irish (8.4%), European (6.1%), Scotch-Irish (3.1%).
Current Local Time:
Incorporated on 02/17/1860
Land area: 9.87 square miles.
Population density: 3,304 people per square mile (average).
2,738 residents are foreign born (2.7% Asia , 2.4% Africa , 2.1% Latin America , 0.9% Europe ).
This city:
8.4%Kentucky:
4.1%
Median real estate property taxes paid for housing units with mortgages in 2022: $1,842 (0.9%)Median real estate property taxes paid for housing units with no mortgage in 2022: $1,593 (0.9%)
Nearest city with pop. 50,000+: Cincinnati, OH
Nearest city with pop. 1,000,000+: Chicago, IL
Nearest cities:
Latitude: 38.99 N, Longitude: 84.64 W
Daytime population change due to commuting: +10,103 (+30.8%)Workers who live and work in this city: 4,706 (29.0%)
Florence tourist attractions:
Unemployment in December 2023:
Population change in the 1990s: +4,101 (+21.1%).
Most common occupations in Florence, KY (%)
Both Males Females
Other management occupations, except farmers and farm managers (4.5%)
Other office and administrative support workers, including supervisors (4.3%)
Other production occupations, including supervisors (4.1%)
Other sales and related occupations, including supervisors (4.0%)
Customer service representatives (3.5%)
Material recording, scheduling, dispatching, and distributing workers (3.5%)
Information and record clerks, except customer service representatives (3.3%)
Other production occupations, including supervisors (6.0%)
Metal workers and plastic workers (5.4%)
Other management occupations, except farmers and farm managers (5.0%)
Driver/sales workers and truck drivers (4.9%)
Electrical equipment mechanics and other installation, maintenance, and repair workers, including supervisors (4.0%)
Laborers and material movers, hand (4.0%)
Material recording, scheduling, dispatching, and distributing workers (3.8%)
Secretaries and administrative assistants (6.3%)
Other office and administrative support workers, including supervisors (6.2%)
Customer service representatives (5.3%)
Information and record clerks, except customer service representatives (5.1%)
Cashiers (4.8%)
Other sales and related occupations, including supervisors (4.4%)
Other management occupations, except farmers and farm managers (4.0%)
Tornado activity:
Florence-area historical tornado activity is slightly above Kentucky state average. It is 68% greater than the overall U.S. average.
On 4/3/1974, a category F5 (max. wind speeds 261-318 mph) tornado 12.9 miles away from the Florence city center killed 3 people and injured 210 people .
On 11/22/1992, a category F4 (max. wind speeds 207-260 mph) tornado 9.9 miles away from the city center killed one person and injured 10 people and caused between $500,000 and $5,000,000 in damages.
Earthquake activity:
Florence-area historical earthquake activity is significantly above Kentucky state average. It is 56% greater than the overall U.S. average. On 7/27/1980 at 18:52:21, a magnitude 5.2 (5.1 MB, 4.7 MS, 5.0 UK, 5.2 UK, Class: Moderate, Intensity: VI - VII) earthquake occurred 66.4 miles away from the city center On 4/18/2008 at 09:36:59, a magnitude 5.4 (5.1 MB, 4.8 MS, 5.4 MW, 5.2 MW) earthquake occurred 179.0 miles away from the city center On 4/18/2008 at 09:36:59, a magnitude 5.2 (5.2 MW, Depth: 8.9 mi) earthquake occurred 179.0 miles away from the city center On 6/10/1987 at 23:48:54, a magnitude 5.1 (4.9 MB, 4.4 MS, 4.6 MS, 5.1 LG) earthquake occurred 174.9 miles away from Florence center On 9/7/1988 at 02:28:09, a magnitude 4.6 (4.5 MB, 4.6 LG, Class: Light, Intensity: IV - V) earthquake occurred 71.9 miles away from Florence center On 6/18/2002 at 17:37:15, a magnitude 5.0 (4.3 MB, 4.6 MW, 5.0 LG) earthquake occurred 183.5 miles away from the city center Magnitude types: regional Lg-wave magnitude (LG), body-wave magnitude (MB), surface-wave magnitude (MS), moment magnitude (MW) Natural disasters: The number of natural disasters in Boone County (9) is smaller than the US average (15).Major Disasters (Presidential) Declared: 6Emergencies Declared: 2Floods: 3, Storms: 3, Tornadoes: 2, Winter Storms: 2, Blizzard: 1, Hurricane: 1, Tropical Depression: 1, Wind: 1, Other: 1 (Note: some incidents may be assigned to more than one category). Hospitals in Florence: GATEWAY REHABILITATION HOSPITAL (5940 MERCHANTS STREET) HOSPICE OF NORTHERN KENTUCKY (7388 TURFWAY ROAD) ST ELIZABETH FLORENCE (Voluntary non-profit - Private, 4900 HOUSTON ROAD) Nursing Homes in Florence: BRIDGE POINT CARE AND REHABILITATION CENTER (7300 WOODSPOINT DRIVE) FLORENCE PARK CARE CENTER (6975 BURLINGTON PIKE) WOODSPOINT ICF (7300 WOODSPOINT DRIVE) Dialysis Facilities in Florence: FMC - BOONE COUNTY (7205 DIXIE HIGHWAY) TURFWAY DIALYSIS (11 SPIRAL DRIVE, SUITE 15A) TURFWAY PD TRAINING (11 SPIRAL DRIVE, SUITE 15A) Home Health Centers in Florence: AGENCY HOME CARE,THE (6909A BURLINGTON PIKE) ST ELIZABETH - ANC HOME CARE (7627 EWING BOULEVARD) Airports located in Florence: Amtrak station near Florence: 10 miles: CINCINNATI (1301 WESTERN AVE.) Services: ticket office, fully wheelchair accessible, enclosed waiting area, public restrooms, public payphones, full-service food facilities, free short-term parking, paid long-term parking, taxi stand.
Colleges/Universities in Florence: Gateway Community and Technical College Full-time enrollment: 2,422; Location: 500 Technology Way; Public; Website: www.gateway.kctcs.edu)
Beckfield College-Florence Full-time enrollment: 716; Location: 16 Spiral Drive; Private, for-profit; Website: www.beckfield.edu)
Lincoln College of Technology-Florence Full-time enrollment: 224; Location: 8095 Connector Dr; Private, for-profit; Website: www.lincolnedu.com/campus/florence-ky)
Empire Beauty School-Florence Full-time enrollment: 209; Location: 7285 Turfway Rd; Private, for-profit; Website: www.empire.edu)
Other colleges/universities with over 2000 students near Florence:
College of Mount St Joseph (about 8 miles; Cincinnati, OH ; Full-time enrollment: 2,073)
Northern Kentucky University (about 10 miles; Highland Heights, KY ; FT enrollment: 12,059)
University of Cincinnati-Main Campus (about 12 miles; Cincinnati, OH ; FT enrollment: 28,747)
Cincinnati State Technical and Community College (about 13 miles; Cincinnati, OH ; FT enrollment: 8,757)
Xavier University (about 14 miles; Cincinnati, OH ; FT enrollment: 6,143)
University of Cincinnati-Blue Ash College (about 22 miles; Blue Ash, OH ; FT enrollment: 3,711)
University of Cincinnati-Clermont College (about 25 miles; Batavia, OH ; FT enrollment: 2,739)
Public high schools in Florence: BOONE COUNTY HIGH SCHOOL Students: 1,485, Location: 7056 BURLINGTON PK, Grades: 9-12)BOONE COUNTY ALTERNATIVE CENTER Location: 99 CENTER DR., Grades: 6-12)
Private high school in Florence:
Public elementary/middle schools in Florence: ERPENBECK ELEMENTARY SCHOOL Students: 1,108, Location: US 42 9001 WETHERINGTON BLVD, Grades: PK-5)OCKERMAN MIDDLE SCHOOL Students: 739, Location: 8300 US 42, Grades: 6-8)OCKERMAN ELEMENTARY SCHOOL Students: 704, Location: 8250 US 42, Grades: PK-5)A M YEALEY ELEMENTARY SCHOOL Students: 701, Location: 10 YEALEY DR, Grades: PK-5)RECTOR A. JONES MIDDLE SCHOOL Students: 615, Location: 8000 SPRUCE DR, Grades: 6-8)HILLARD COLLINS ELEMENTARY SCHOOL Students: 545, Location: 9000 SPRUCE DR, Grades: PK-5)FLORENCE ELEMENTARY SCHOOL Students: 528, Location: 103 CENTER ST, Grades: PK-5)Private elementary/middle schools in Florence: ST PAUL SCHOOL Students: 402, Location: 7303 DIXIE HWY, Grades: KG-8)
ZION CHRISTIAN ACADEMY Students: 73, Location: 10310 DIXIE HWY, Grades: PK-5)
See full list of schools located in Florence
Notable locations in Florence: (A) , Turfway Commercial Park (B) , Turfway Business Park (C) , Boone County Community Center (D) , Boone County Public Library (E) , Florence Fire Department Station 3 (F) , Florence Fire Department Station 1 (G) , Florence Fire Department Station 2 (H) , Florence Park Care Center (I) , Rosebrook Art Center (J) , Woodspoint Geriatric Center (K) . Display/hide their locations on the map
Shopping Centers: (1) , Village At The Mall Shopping Center (2) , Turfway Square Shopping Center (3) , Merchants Square Shopping Center (4) , Mall Road Square Shopping Center (5) , Mall Road Center Shopping Center (6) , Florence Square Shopping Center (7) , Florence Plaza Shopping Center (8) , Florence Discount Center Shopping Center (9) . Display/hide their locations on the map
Churches in Florence include: (A) , Heritage Assembly of God Church (B) , Victory Baptist Church (C) , Saint Paul Church (D) , Kento-Boo Baptist Church (E) , Hopeful Lutheran Church (F) , Grace Episcopal Church (G) , Florence Christian Church (H) , Florence Baptist Church (I) . Display/hide their locations on the map
Cemeteries: (1) , Florence Cemetery (2) . Display/hide their locations on the map
Streams, rivers, and creeks: (A) , Fowlers Fork (B) . Display/hide their locations on the map
Parks in Florence include: (1) , Stringtown Park (2) , South Fork Park (3) . Display/hide their locations on the map
Tourist attractions:
Hotels:
Birthplace of: Curtis Gates Lloyd - Mycologist, Shaun Alexander - 2005 NFL player (Seattle Seahawks, born : Aug 30, 1977).
Boone County has a predicted average indoor radon screening level between 2 and 4 pCi/L (pico curies per liter) - Moderate Potential Drinking water stations with addresses in Florence and their reported violations in the past:
CITY OF FLORENCE (Population served: 29,351, Purch surface water):
Past monitoring violations:
Monitoring of Treatment (SWTR-Filter) - In NOV-2012. Follow-up actions: St Public Notif requested (JAN-20-2013), St Formal NOV issued (JAN-20-2013), St Compliance achieved (MAR-27-2013), St Public Notif received (JUN-24-2013)
Population served: 429, Groundwater):
Past monitoring violations:
One routine major monitoring violation
Population served: 355, Groundwater):
Past monitoring violations:
Monitoring and Reporting (DBP) - Between JAN-2009 and DEC-2009, Contaminant: TTHM. Follow-up actions: St Public Notif requested (FEB-05-2010), St Formal NOV issued (FEB-05-2010), St Compliance achieved (MAY-18-2010), St Public Notif received (AUG-23-2011)
Monitoring and Reporting (DBP) - Between JAN-2009 and DEC-2009, Contaminant: Total Haloacetic Acids (HAA5). Follow-up actions: St Public Notif requested (FEB-05-2010), St Formal NOV issued (FEB-05-2010), St Compliance achieved (MAY-18-2010), St Public Notif received (AUG-23-2011)
Monitoring and Reporting (DBP) - Between JAN-2007 and DEC-2007, Contaminant: TTHM. Follow-up actions: St Public Notif requested (FEB-04-2008), St Formal NOV issued (FEB-04-2008), St Public Notif received (FEB-04-2008), St Compliance achieved (SEP-04-2008)
Monitoring and Reporting (DBP) - Between JAN-2007 and DEC-2007, Contaminant: Total Haloacetic Acids (HAA5). Follow-up actions: St Public Notif requested (FEB-04-2008), St Formal NOV issued (FEB-04-2008), St Public Notif received (FEB-04-2008), St Compliance achieved (SEP-04-2008)
Monitoring and Reporting (DBP) - In FEB-01-2004, Contaminant: DBP Stage 1. Follow-up actions: St Public Notif requested (JUN-07-2005), St Formal NOV issued (JUN-07-2005), St Compliance achieved (SEP-26-2005), St Public Notif received (SEP-26-2005)
5 minor monitoring violations
One regular monitoring violation
Average household size: This city:
2.4 peopleKentucky:
2.5 people
Percentage of family households: This city:
60.9%Whole state:
66.9%
Percentage of households with unmarried partners: This city:
7.1%Whole state:
6.4%
Likely homosexual households (counted as self-reported same-sex unmarried-partner households)
Lesbian couples: 0.3% of all households Gay men: 0.3% of all households
265 people in nursing facilities/skilled-nursing facilities in 2010people in other noninstitutional facilities in 2010People in group quarters in Florence in 2000:
295 people in nursing homes
15 people in homes for the mentally retarded
2 people in other nonhousehold living situations
Banks with most branches in Florence (2011 data):
The Bank of Kentucky, Inc.: Burlington Branch, Mt. Zion Branch, Us42 Branch, Houston Road Branch. Info updated 2011/11/10: Bank assets: $1,743.6 mil, Deposits: $1,499.3 mil, headquarters in Crestview Hills, KY, positive income , Commercial Lending Specialization, 33 total offices , Holding Company: Bank Of Kentucky Financial Corporation, The
Fifth Third Bank: Florence Mall Branch, Mt. Zion Branch, Florence Branch, Florence Main Branch. Info updated 2009/10/05: Bank assets: $114,540.4 mil, Deposits: $89,689.1 mil, headquarters in Cincinnati, OH, positive income , Commercial Lending Specialization, 1378 total offices , Holding Company: Fifth Third Bancorp
PNC Bank, National Association: Florence Branch, Turfway Financial Center, Mt. Zion Road Branch, Union At Terrace Village. Info updated 2012/03/20: Bank assets: $263,309.6 mil, Deposits: $197,343.0 mil, headquarters in Wilmington, DE, positive income , Commercial Lending Specialization, 3085 total offices , Holding Company: Pnc Financial Services Group, Inc., The
The Huntington National Bank: Houston Road Branch, Plantation Pointe Branch, Colonial Heights Branch. Info updated 2012/04/02: Bank assets: $54,183.4 mil, Deposits: $44,300.3 mil, headquarters in Columbus, OH, positive income , Commercial Lending Specialization, 878 total offices , Holding Company: Huntington Bancshares Incorporated
U.S. Bank National Association: Turfway Remkes Branch, Florence Branch, Florence Meijer Branch. Info updated 2012/01/30: Bank assets: $330,470.8 mil, Deposits: $236,091.5 mil, headquarters in Cincinnati, OH, positive income , 3121 total offices , Holding Company: U.S. Bancorp
JPMorgan Chase Bank, National Association: Us 42 Branch at 8480 U.S. 42, branch established on 1988/08/01; Turfway Branch at 4899 Houston Road, branch established on 1999/11/19. Info updated 2011/11/10: Bank assets: $1,811,678.0 mil, Deposits: $1,190,738.0 mil, headquarters in Columbus, OH, positive income , International Specialization, 5577 total offices , Holding Company: Jpmorgan Chase & Co.
KeyBank National Association: Florence Branch at 4790 Houston Road, branch established on 2004/11/29; Florence Branch at 8545 Us Highway 42, branch established on 2005/05/09. Info updated 2008/03/03: Bank assets: $86,198.8 mil, Deposits: $64,214.8 mil, headquarters in Cleveland, OH, positive income , Commercial Lending Specialization, 1067 total offices , Holding Company: Keycorp
First Security Trust Bank, Inc.: at 7135 Houston Road, branch established on 1999/06/14. Info updated 2010/09/16: Bank assets: $116.6 mil, Deposits: $98.5 mil, local headquarters , negative income in the last year , Commercial Lending Specialization, 3 total offices , Holding Company: Commonwealth Bancshares, Inc.
Kentucky Federal Savings and Loan Association: 6890 Dixie Highway Branch at 6890 Dixie Highway, branch established on 1885/01/01. Info updated 2011/07/21: Bank assets: $41.5 mil, Deposits: $35.5 mil, headquarters in Covington, KY, positive income , Mortgage Lending Specialization, 3 total offices
10 other banks with 10 local branches
For population 15 years and over in Florence:
Never married: 30.7%Now married: 44.1%Separated: 0.6%Widowed: 6.7%Divorced: 17.9% For population 25 years and over in Florence:
High school or higher: 92.4%Bachelor's degree or higher: 26.7%Graduate or professional degree: 10.1%Unemployed: 3.4%Mean travel time to work (commute): 21.6 minutes
Education Gini index (Inequality in education) Here:
9.8Kentucky average:
11.7
Religion statistics for Florence, KY (based on Boone County data)
Religion Adherents Congregations Evangelical Protestant 34,355 52 Catholic 19,500 6 Mainline Protestant 4,674 13 Other 783 4 Orthodox 3 1 None 59,496 -
Source: Clifford Grammich, Kirk Hadaway, Richard Houseal, Dale E.Jones, Alexei Krindatch, Richie Stanley and Richard H.Taylor. 2012. 2010 U.S.Religion Census: Religious Congregations & Membership Study. Association of Statisticians of American Religious Bodies. Jones, Dale E., et al. 2002. Congregations and Membership in the United States 2000. Nashville, TN: Glenmary Research Center. Graphs represent county-level data
Food Environment Statistics: Number of grocery stores : 13This county :
1.16 / 10,000 pop.Kentucky :
2.19 / 10,000 pop.
Number of supercenters and club stores : 3This county :
0.27 / 10,000 pop.Kentucky :
0.25 / 10,000 pop.
Number of convenience stores (no gas) : 9Here :
0.80 / 10,000 pop.Kentucky :
0.74 / 10,000 pop.
Number of convenience stores (with gas) : 37Boone County :
3.30 / 10,000 pop.Kentucky :
4.36 / 10,000 pop.
Number of full-service restaurants : 91Boone County :
8.12 / 10,000 pop.Kentucky :
5.74 / 10,000 pop.
Adult diabetes rate : Boone County :
8.2%State :
11.0%
Adult obesity rate : Boone County :
29.4%Kentucky :
30.0%
Low-income preschool obesity rate : Boone County :
15.2%Kentucky :
15.9%
Health and Nutrition:
Average overall health of teeth and gums : Average BMI : Florence:
28.4Kentucky:
28.6
People feeling badly about themselves : Florence:
20.8%Kentucky:
21.0%
People not drinking alcohol at all : Average hours sleeping at night : This city:
6.8Kentucky:
6.8
Overweight people : Florence:
32.1%Kentucky:
33.8%
General health condition : This city:
56.7%Kentucky:
56.8%
Average condition of hearing : This city:
79.3%State:
78.9%
More about Health and Nutrition of Florence, KY Residents
Local government employment and payroll (March 2022)
Function
Full-time employees
Monthly full-time payroll
Average yearly full-time wage
Part-time employees
Monthly part-time payroll
Police Protection - Officers
64 $474,087 $88,891 0 $0 Firefighters
63 $449,088 $85,541 1 $903 Other and Unallocable
27 $162,830 $72,369 3 $1,450 Parks and Recreation
12 $55,703 $55,703 1 $850 Streets and Highways
10 $49,806 $59,767 0 $0 Sewerage
9 $44,904 $59,872 0 $0 Water Supply
9 $42,269 $56,359 0 $0 Financial Administration
6 $40,242 $80,484 1 $1,151 Other Government Administration
5 $28,356 $68,054 6 $7,905 Police - Other
3 $12,757 $51,028 0 $0 Fire - Other
2 $8,038 $48,228 0 $0
Totals for Government
210 $1,368,079 $78,176 12 $12,260
Florence government finances - Expenditure in 2021 (per resident):
Construction - Regular Highways: $7,691,000 ($235.79)
Current Operations - Local Fire Protection: $5,780,000 ($177.20)
Police Protection: $5,777,000 ($177.11)Water Utilities: $5,458,000 ($167.33)Regular Highways: $4,278,000 ($131.15)Central Staff Services: $2,430,000 ($74.50)Parks and Recreation: $1,146,000 ($35.13)Sewerage: $994,000 ($30.47)General - Interest on Debt: $290,000 ($8.89)
Other Capital Outlay - Local Fire Protection: $2,108,000 ($64.63)
Regular Highways: $690,000 ($21.15)Police Protection: $596,000 ($18.27)Central Staff Services: $232,000 ($7.11)Total Salaries and Wages: $16,007,000 ($490.74)
Water Utilities - Interest on Debt: $43,000 ($1.32)
Florence government finances - Revenue in 2021 (per resident):
Charges - Other: $5,199,000 ($159.39)
Sewerage: $2,698,000 ($82.72)Parks and Recreation: $1,470,000 ($45.07)Federal Intergovernmental - Other: $887,000 ($27.19)
Miscellaneous - Rents: $1,246,000 ($38.20)
Interest Earnings: $598,000 ($18.33)Fines and Forfeits: $50,000 ($1.53)Revenue - Water Utilities: $6,002,000 ($184.01)
State Intergovernmental - Other: $690,000 ($21.15)
Highways: $603,000 ($18.49)General Local Government Support: $22,000 ($0.67)Public Welfare: $16,000 ($0.49)Tax - Individual Income: $21,000,000 ($643.82)
Property: $9,231,000 ($283.00)Insurance Premiums Sales: $3,377,000 ($103.53)Corporation Net Income: $2,574,000 ($78.91)Public Utilities Sales: $551,000 ($16.89)Alcoholic Beverage License: $129,000 ($3.95)
Florence government finances - Debt in 2021 (per resident):
Long Term Debt - Beginning Outstanding - Unspecified Public Purpose: $14,385,000 ($441.01)
Outstanding Unspecified Public Purpose: $7,840,000 ($240.36)Retired Unspecified Public Purpose: $6,545,000 ($200.66)
Florence government finances - Cash and Securities in 2021 (per resident):
Other Funds - Cash and Securities: $129,412,000 ($3967.50)
Sinking Funds - Cash and Securities: $634,000 ($19.44)
Businesses in Florence, KY
Name Count Name Count
AT&T 3 Little Caesars Pizza 2 Abercrombie & Fitch 1 Long John Silver's 1 Abercrombie Kids 1 Lowe's 1 Ace Hardware 1 Macy's 1 Advance Auto Parts 1 Marriott 2 Aeropostale 1 MasterBrand Cabinets 5 American Eagle Outfitters 1 Mazda 1 Applebee's 1 McDonald's 4 Arby's 1 Meijer 1 AutoZone 1 Men's Wearhouse 1 Barnes & Noble 1 Microtel 1 Baskin-Robbins 2 Motel 6 1 Bath & Body Works 1 Motherhood Maternity 2 Best Western 1 New York & Co 1 Buffalo Wild Wings 1 Nike 13 Burger King 3 Nissan 1 CVS 2 Office Depot 1 Casual Male XL 1 Old Navy 1 Catherines 1 Olive Garden 1 Charlotte Russe 1 Panera Bread 1 Chevrolet 1 Papa John's Pizza 2 Chick-Fil-A 1 Payless 2 Chipotle 2 Penske 1 Chuck E. Cheese's 1 PetSmart 1 Clarion 1 Pier 1 Imports 1 Cold Stone Creamery 1 Pizza Hut 1 Cracker Barrel 1 Plato's Closet 1 Cricket Wireless 2 Popeyes 1 Curves 1 Qdoba Mexican Grill 1 Dairy Queen 2 Quality 1 Days Inn 1 Quiznos 2 Deb 1 RadioShack 2 Domino's Pizza 1 Ramada 1 DressBarn 1 Red Lobster 1 Dressbarn 1 Red Robin 1 Dunkin Donuts 2 SONIC Drive-In 2 Express 1 Sam's Club 1 Extended Stay America 1 Sears 3 Fashion Bug 1 Sephora 2 FedEx 11 Shoe Carnival 1 Finish Line 1 Skechers USA 1 Foot Locker 1 Spencer Gifts 1 Ford 1 Sprint Nextel 3 Forever 21 1 Staples 1 GNC 1 Starbucks 1 GameStop 3 Steak 'n Shake 2 Gap 1 Studio Plus Deluxe Studios 1 Goodwill 2 Subaru 1 Gymboree 1 Subway 9 H&M 1 Super 8 2 H&R Block 5 T-Mobile 5 Havertys Furniture 1 T.J.Maxx 1 Hilton 2 Taco Bell 3 Hobby Lobby 1 Target 1 Holiday Inn 1 The Room Place 1 Home Depot 1 Torrid 1 Honda 1 Toyota 1 Hot Topic 1 Toys"R"Us 3 Hyundai 1 Travelodge 1 IHOP 1 U-Haul 4 JCPenney 1 UPS 22 Jimmy John's 1 Value City Furniture 1 Journeys 1 Vans 2 Justice 2 Verizon Wireless 1 KFC 1 Victoria's Secret 1 Kmart 1 Volkswagen 1 Knights Inn 1 Waffle House 2 Kohl's 1 Walgreens 3 Kroger 2 Walmart 1 La Quinta 1 Wendy's 3 La-Z-Boy 1 Wet Seal 1 LensCrafters 1 White Castle 1
Strongest AM radio stations in Florence:
WSAI (1530 AM; 50 kW; CINCINNATI, OH; Owner: JACOR BROADCASTING CORPORATION)
WBOB (1160 AM; 5 kW; FLORENCE, KY; Owner: CARON BROADCASTING, INC.)
WLW (700 AM; 50 kW; CINCINNATI, OH; Owner: JACOR BROADCASTING CORPORATION)
WKRC (550 AM; 5 kW; CINCINNATI, OH; Owner: JACOR BROADCASTING CORPORATION)
WNOP (740 AM; 1 kW; NEWPORT, KY; Owner: SACRED HEART RADIO, INC.)
WHAS (840 AM; 50 kW; LOUISVILLE, KY; Owner: CLEAR CHANNEL BROADCASTING LICENSES, INC.)
WTSJ (1050 AM; 1 kW; CINCINNATI, OH; Owner: CARON BROADCASTING, INC.)
WCIN (1480 AM; 5 kW; CINCINNATI, OH)
WCKY (1360 AM; 5 kW; CINCINNATI, OH; Owner: JACOR BROADCASTING CORPORATION)
WTVN (610 AM; 50 kW; COLUMBUS, OH; Owner: CITICASTERS LICENSES, L.P.)
WDBZ (1230 AM; 1 kW; CINCINNATI, OH; Owner: BLUE CHIP COMMUNICATIONS, INC.)
WCVG (1320 AM; 0 kW; COVINGTON, KY; Owner: RICHARD L. PLESSINGER SR.)
WCNW (1560 AM; daytime; 5 kW; FAIRFIELD, OH)
Strongest FM radio stations in Florence:
WEBN (102.7 FM; CINCINNATI, OH; Owner: JACOR BROADCASTING CORPORATION)
WVMX (94.1 FM; CINCINNATI, OH; Owner: CITICASTERS LICENSES, L.P.)
WOFX-FM (92.5 FM; CINCINNATI, OH; Owner: JACOR BROADCASTING CORPORATION)
WGUC (90.9 FM; CINCINNATI, OH; Owner: CINCINNATI CLASSICAL PUBLIC RADIO, INC.)
WKRQ (101.9 FM; CINCINNATI, OH; Owner: INFINITY RADIO OPERATIONS INC.)
WKFS (107.1 FM; MILFORD, OH; Owner: JACOR BROADCASTING CORPORATION)
WUBE-FM (105.1 FM; CINCINNATI, OH; Owner: INFINITY RADIO OPERATIONS INC.)
WIZF (100.9 FM; ERLANGER, KY; Owner: BLUE CHIP BROADCASTING LICENSES II, LTD.)
WGRR (103.5 FM; HAMILTON, OH; Owner: INFINITY RADIO OPERATIONS INC.)
WVXU (91.7 FM; CINCINNATI, OH; Owner: XAVIER UNIVERSITY)
WRRM (98.5 FM; CINCINNATI, OH; Owner: WRRM LICO, INC)
WMOJ (94.9 FM; FAIRFIELD, OH; Owner: WVAE LICO, INC.)
WNKU (89.7 FM; HIGHLAND HEIGHTS, KY; Owner: BD. OF REGENTS ON N. KY UNIV.)
WAIF (88.3 FM; CINCINNATI, OH; Owner: STEPCHILD RADIO OF CINCINNATI, INC.)
WAKW (93.3 FM; CINCINNATI, OH; Owner: PILLAR OF FIRE)
WSCH (99.3 FM; AURORA, IN; Owner: COLUMBUS RADIO, INC.)
WYGY (96.5 FM; LEBANON, OH; Owner: WVAE LICO, INC.)
WNKR (106.5 FM; WILLIAMSTOWN, KY; Owner: GRANT COUNTY BROADCASTERS, INC)
WNLT (104.3 FM; HARRISON, OH; Owner: VERNON R. BALDWIN, INC.)
WIOK (107.5 FM; FALMOUTH, KY; Owner: HAMMOND BROADCASTING, INC.)
TV broadcast stations around Florence:
WLWT (Channel 5; CINCINNATI, OH; Owner: OHIO/OKLAHOMA HEARST-ARGYLE TV, INC)
WXIX-TV (Channel 19; NEWPORT, KY; Owner: RAYCOM NATIONAL, INC.)
WCPO-TV (Channel 9; CINCINNATI, OH; Owner: SCRIPPS HOWARD BROADCASTING COMPANY)
WSTR-TV (Channel 64; CINCINNATI, OH; Owner: WSTR LICENSEE, INC.)
WCET (Channel 48; CINCINNATI, OH; Owner: THE GREATER CINCINNATI TV EDUC'L. FOUNDATION)
WKRC-TV (Channel 12; CINCINNATI, OH; Owner: CITICASTERS CO.)
WOTH-LP (Channel 35; CINCINNATI, OH; Owner: ELLIOTT B. BLOCK)
WBQC-CA (Channel 25; CINCINNATI, OH; Owner: ELLIOTT B. BLOCK)
WCVN-TV (Channel 54; COVINGTON, KY; Owner: KENTUCKY AUTHORITY FOR EDUCATIONAL TV)
WAVE (Channel 3; LOUISVILLE, KY; Owner: LIBCO, INC.)
WPTO (Channel 14; OXFORD, OH; Owner: GREATER DAYTON PUBLIC TELEVISION, INC.)
WKOI (Channel 43; RICHMOND, IN; Owner: TRINITY BROADCASTING OF INDIANA, INC.)
WKON (Channel 52; OWENTON, KY; Owner: KENTUCKY AUTHORITY FOR EDUCATIONAL TV)
National Bridge Inventory (NBI) Statistics 55 Number of bridges505ft / 154m Total length $16,292,000 Total costs3,260,194 Total average daily traffic549,628 Total average daily truck traffic
New bridges - historical statistics
1 1900-1909 1 1950-1959 15 1960-1969 3 1980-1989 31 1990-1999 3 2000-2009 1 2010-2019
See full National Bridge Inventory statistics for Florence, KY
Home Mortgage Disclosure Act Aggregated Statistics For Year 2009(Based on 1 full and 5 partial tracts) A) FHA, FSA/RHS & VA B) Conventional C) Refinancings D) Home Improvement Loans F) Non-occupant Loans on G) Loans On Manufactured Number Average Value Number Average Value Number Average Value Number Average Value Number Average Value Number Average Value
LOANS ORIGINATED 141 $130,223 92 $122,895 584 $136,213 19 $47,914 40 $128,518 1 $22,910 APPLICATIONS APPROVED, NOT ACCEPTED 8 $128,982 8 $123,102 36 $130,667 3 $14,673 2 $89,475 1 $25,110 APPLICATIONS DENIED 25 $118,184 16 $88,440 155 $138,911 15 $24,585 9 $93,237 3 $24,040 APPLICATIONS WITHDRAWN 12 $125,838 7 $135,253 103 $136,470 4 $77,790 3 $95,357 0 $0 FILES CLOSED FOR INCOMPLETENESS 2 $153,025 1 $158,310 16 $146,021 1 $8,890 0 $0 0 $0
Aggregated Statistics For Year 2008(Based on 1 full and 5 partial tracts) A) FHA, FSA/RHS & VA B) Conventional C) Refinancings D) Home Improvement Loans E) Loans on Dwellings For 5+ Families F) Non-occupant Loans on G) Loans On Manufactured Number Average Value Number Average Value Number Average Value Number Average Value Number Average Value Number Average Value Number Average Value
LOANS ORIGINATED 121 $137,175 176 $123,857 279 $132,302 27 $37,776 2 $1,119,865 60 $105,278 7 $23,251 APPLICATIONS APPROVED, NOT ACCEPTED 8 $125,915 21 $94,712 42 $124,690 8 $24,488 0 $0 8 $88,065 7 $34,796 APPLICATIONS DENIED 13 $130,104 25 $92,725 206 $131,372 30 $49,696 0 $0 5 $131,838 9 $25,403 APPLICATIONS WITHDRAWN 12 $143,090 21 $136,863 75 $142,753 2 $46,805 0 $0 9 $128,860 0 $0 FILES CLOSED FOR INCOMPLETENESS 1 $166,440 2 $197,910 15 $150,824 2 $49,770 0 $0 1 $141,400 0 $0
Aggregated Statistics For Year 2007(Based on 1 full and 5 partial tracts) A) FHA, FSA/RHS & VA B) Conventional C) Refinancings D) Home Improvement Loans E) Loans on Dwellings For 5+ Families F) Non-occupant Loans on G) Loans On Manufactured Number Average Value Number Average Value Number Average Value Number Average Value Number Average Value Number Average Value Number Average Value
LOANS ORIGINATED 46 $137,946 314 $127,218 319 $115,859 42 $31,973 3 $586,600 54 $125,404 8 $37,399 APPLICATIONS APPROVED, NOT ACCEPTED 3 $125,103 38 $90,425 79 $114,521 13 $35,882 1 $345,410 7 $105,837 11 $24,695 APPLICATIONS DENIED 10 $142,932 63 $86,123 322 $124,098 66 $55,660 0 $0 17 $86,917 16 $27,094 APPLICATIONS WITHDRAWN 11 $122,785 21 $117,279 98 $129,437 4 $58,630 0 $0 7 $94,933 0 $0 FILES CLOSED FOR INCOMPLETENESS 1 $69,170 7 $147,330 21 $135,324 1 $136,580 0 $0 0 $0 0 $0
Aggregated Statistics For Year 2006(Based on 1 full and 5 partial tracts) A) FHA, FSA/RHS & VA B) Conventional C) Refinancings D) Home Improvement Loans E) Loans on Dwellings For 5+ Families F) Non-occupant Loans on G) Loans On Manufactured Number Average Value Number Average Value Number Average Value Number Average Value Number Average Value Number Average Value Number Average Value
LOANS ORIGINATED 52 $130,420 443 $109,419 373 $103,960 59 $30,291 1 $3,754,780 79 $104,167 9 $26,408 APPLICATIONS APPROVED, NOT ACCEPTED 4 $125,668 53 $91,772 100 $104,354 20 $19,774 0 $0 8 $91,022 11 $22,142 APPLICATIONS DENIED 9 $102,722 70 $89,097 297 $113,883 68 $39,352 0 $0 22 $88,109 15 $35,262 APPLICATIONS WITHDRAWN 4 $109,185 37 $115,556 137 $125,792 13 $43,201 0 $0 5 $96,844 0 $0 FILES CLOSED FOR INCOMPLETENESS 1 $92,420 8 $134,401 30 $120,105 2 $66,020 0 $0 1 $133,240 0 $0
Aggregated Statistics For Year 2005(Based on 1 full and 5 partial tracts) A) FHA, FSA/RHS & VA B) Conventional C) Refinancings D) Home Improvement Loans E) Loans on Dwellings For 5+ Families F) Non-occupant Loans on G) Loans On Manufactured Number Average Value Number Average Value Number Average Value Number Average Value Number Average Value Number Average Value Number Average Value
LOANS ORIGINATED 70 $128,422 506 $111,969 435 $110,759 61 $41,839 2 $1,886,585 69 $112,936 5 $52,652 APPLICATIONS APPROVED, NOT ACCEPTED 6 $85,927 53 $101,577 91 $99,041 19 $22,882 0 $0 7 $91,140 12 $42,357 APPLICATIONS DENIED 12 $107,213 104 $80,776 278 $117,496 60 $21,648 0 $0 19 $81,305 29 $39,460 APPLICATIONS WITHDRAWN 4 $117,030 40 $100,030 138 $116,636 22 $111,721 0 $0 10 $100,508 4 $34,960 FILES CLOSED FOR INCOMPLETENESS 4 $95,575 22 $118,886 36 $132,224 3 $63,153 0 $0 3 $101,137 0 $0
Aggregated Statistics For Year 2004(Based on 1 full and 5 partial tracts) A) FHA, FSA/RHS & VA B) Conventional C) Refinancings D) Home Improvement Loans E) Loans on Dwellings For 5+ Families F) Non-occupant Loans on G) Loans On Manufactured Number Average Value Number Average Value Number Average Value Number Average Value Number Average Value Number Average Value Number Average Value
LOANS ORIGINATED 99 $130,678 477 $116,869 625 $107,225 46 $28,840 1 $2,470 90 $102,086 10 $35,414 APPLICATIONS APPROVED, NOT ACCEPTED 6 $107,288 58 $91,482 112 $106,993 12 $24,377 0 $0 6 $71,383 12 $36,541 APPLICATIONS DENIED 20 $118,578 95 $90,755 291 $117,303 71 $26,060 0 $0 14 $96,535 25 $34,070 APPLICATIONS WITHDRAWN 11 $127,425 57 $133,543 207 $113,990 11 $45,048 0 $0 11 $123,575 1 $105,480 FILES CLOSED FOR INCOMPLETENESS 1 $157,260 10 $133,388 49 $119,588 3 $41,353 0 $0 2 $118,860 0 $0
Aggregated Statistics For Year 2003(Based on 1 full and 5 partial tracts) A) FHA, FSA/RHS & VA B) Conventional C) Refinancings D) Home Improvement Loans E) Loans on Dwellings For 5+ Families F) Non-occupant Loans on Number Average Value Number Average Value Number Average Value Number Average Value Number Average Value Number Average Value
LOANS ORIGINATED 119 $122,426 471 $114,035 1,201 $106,678 44 $16,891 2 $3,287,955 103 $93,695 APPLICATIONS APPROVED, NOT ACCEPTED 9 $69,787 56 $84,249 150 $106,594 12 $18,952 1 $2,313,020 4 $102,978 APPLICATIONS DENIED 14 $74,860 86 $70,775 296 $105,977 43 $28,392 0 $0 13 $73,027 APPLICATIONS WITHDRAWN 7 $132,441 34 $103,645 167 $115,749 3 $37,733 0 $0 8 $85,309 FILES CLOSED FOR INCOMPLETENESS 2 $84,735 12 $105,182 70 $111,173 1 $24,370 0 $0 6 $81,360
Aggregated Statistics For Year 2002(Based on 1 full and 2 partial tracts) A) FHA, FSA/RHS & VA B) Conventional C) Refinancings D) Home Improvement Loans E) Loans on Dwellings For 5+ Families F) Non-occupant Loans on Number Average Value Number Average Value Number Average Value Number Average Value Number Average Value Number Average Value
LOANS ORIGINATED 56 $96,774 120 $81,753 337 $81,169 35 $16,731 2 $168,180 40 $83,262 APPLICATIONS APPROVED, NOT ACCEPTED 0 $0 16 $70,149 55 $79,353 7 $25,773 0 $0 1 $70,390 APPLICATIONS DENIED 3 $75,397 36 $57,304 133 $92,195 36 $11,578 0 $0 12 $83,282 APPLICATIONS WITHDRAWN 5 $88,526 18 $104,243 70 $94,175 2 $14,390 0 $0 5 $102,072 FILES CLOSED FOR INCOMPLETENESS 1 $100,790 7 $107,701 17 $99,796 0 $0 0 $0 2 $106,665
Aggregated Statistics For Year 2001(Based on 1 full and 2 partial tracts) A) FHA, FSA/RHS & VA B) Conventional C) Refinancings D) Home Improvement Loans E) Loans on Dwellings For 5+ Families F) Non-occupant Loans on Number Average Value Number Average Value Number Average Value Number Average Value Number Average Value Number Average Value
LOANS ORIGINATED 66 $95,652 108 $69,583 309 $80,050 44 $13,332 2 $1,114,765 29 $81,893 APPLICATIONS APPROVED, NOT ACCEPTED 1 $129,560 25 $50,222 48 $76,980 18 $9,230 1 $322,380 3 $52,140 APPLICATIONS DENIED 8 $97,304 59 $38,156 137 $76,427 49 $14,478 0 $0 6 $63,760 APPLICATIONS WITHDRAWN 7 $111,411 14 $84,395 49 $91,062 10 $13,979 1 $292,770 1 $73,120 FILES CLOSED FOR INCOMPLETENESS 9 $103,990 5 $61,434 18 $74,017 0 $0 0 $0 0 $0
Aggregated Statistics For Year 2000(Based on 1 full and 2 partial tracts) A) FHA, FSA/RHS & VA B) Conventional C) Refinancings D) Home Improvement Loans E) Loans on Dwellings For 5+ Families F) Non-occupant Loans on Number Average Value Number Average Value Number Average Value Number Average Value Number Average Value Number Average Value
LOANS ORIGINATED 66 $89,198 114 $75,813 105 $63,174 53 $9,808 1 $1,042,800 17 $89,084 APPLICATIONS APPROVED, NOT ACCEPTED 6 $56,885 33 $48,101 50 $70,838 17 $14,326 0 $0 5 $66,580 APPLICATIONS DENIED 9 $74,898 82 $43,283 98 $54,303 57 $12,253 0 $0 2 $84,370 APPLICATIONS WITHDRAWN 6 $81,980 12 $64,592 28 $54,395 6 $31,722 0 $0 1 $85,870 FILES CLOSED FOR INCOMPLETENESS 2 $77,305 3 $48,310 8 $75,436 0 $0 0 $0 0 $0
Aggregated Statistics For Year 1999(Based on 5 partial tracts) A) FHA, FSA/RHS & VA B) Conventional C) Refinancings D) Home Improvement Loans F) Non-occupant Loans on Number Average Value Number Average Value Number Average Value Number Average Value Number Average Value
LOANS ORIGINATED 114 $96,900 266 $99,341 331 $80,488 75 $13,060 29 $98,134 APPLICATIONS APPROVED, NOT ACCEPTED 6 $89,633 36 $61,296 88 $76,231 23 $13,385 4 $84,440 APPLICATIONS DENIED 8 $85,698 114 $52,206 147 $71,758 62 $13,873 12 $75,346 APPLICATIONS WITHDRAWN 7 $86,864 35 $94,993 83 $75,623 3 $50,790 2 $70,035 FILES CLOSED FOR INCOMPLETENESS 1 $95,260 5 $109,124 18 $86,036 1 $4,100 0 $0
Detailed HMDA statistics for the following Tracts:
0701.00
, 0702.00 , 0703.01 , 0703.06 , 0703.07 , 0703.08
Private Mortgage Insurance Companies Aggregated Statistics For Year 2009(Based on 1 full and 5 partial tracts) A) Conventional B) Refinancings Number Average Value Number Average Value
LOANS ORIGINATED 18 $181,666 18 $158,705 APPLICATIONS APPROVED, NOT ACCEPTED 5 $179,840 7 $142,636 APPLICATIONS DENIED 3 $208,350 6 $145,327 APPLICATIONS WITHDRAWN 2 $174,090 1 $141,130 FILES CLOSED FOR INCOMPLETENESS 1 $69,700 1 $155,330
Aggregated Statistics For Year 2008(Based on 1 full and 5 partial tracts) A) Conventional B) Refinancings C) Non-occupant Loans on Number Average Value Number Average Value Number Average Value
LOANS ORIGINATED 64 $144,110 30 $147,132 5 $122,308 APPLICATIONS APPROVED, NOT ACCEPTED 14 $151,666 11 $174,380 1 $111,210 APPLICATIONS DENIED 4 $157,560 1 $134,700 2 $139,320 APPLICATIONS WITHDRAWN 1 $226,340 0 $0 0 $0 FILES CLOSED FOR INCOMPLETENESS 2 $126,665 1 $137,710 1 $172,880
Aggregated Statistics For Year 2007(Based on 1 full and 5 partial tracts) A) Conventional B) Refinancings C) Non-occupant Loans on Number Average Value Number Average Value Number Average Value
LOANS ORIGINATED 111 $139,790 34 $148,984 7 $106,794 APPLICATIONS APPROVED, NOT ACCEPTED 14 $147,301 12 $125,834 4 $84,350 APPLICATIONS DENIED 2 $175,760 1 $69,700 1 $108,940 APPLICATIONS WITHDRAWN 4 $136,015 0 $0 0 $0 FILES CLOSED FOR INCOMPLETENESS 0 $0 1 $97,580 1 $97,580
Aggregated Statistics For Year 2006(Based on 1 full and 5 partial tracts) A) Conventional B) Refinancings C) Non-occupant Loans on Number Average Value Number Average Value Number Average Value
LOANS ORIGINATED 87 $133,763 26 $146,479 6 $106,688 APPLICATIONS APPROVED, NOT ACCEPTED 8 $141,218 8 $139,504 1 $96,220 APPLICATIONS DENIED 1 $111,020 0 $0 0 $0 APPLICATIONS WITHDRAWN 3 $133,683 3 $111,707 0 $0 FILES CLOSED FOR INCOMPLETENESS 0 $0 1 $128,040 0 $0
Aggregated Statistics For Year 2005(Based on 1 full and 5 partial tracts) A) Conventional B) Refinancings C) Non-occupant Loans on Number Average Value Number Average Value Number Average Value
LOANS ORIGINATED 72 $137,054 38 $133,073 7 $89,853 APPLICATIONS APPROVED, NOT ACCEPTED 13 $165,238 7 $158,933 2 $156,020 APPLICATIONS DENIED 1 $112,530 1 $99,000 0 $0 APPLICATIONS WITHDRAWN 3 $154,237 2 $117,015 1 $56,790 FILES CLOSED FOR INCOMPLETENESS 1 $98,100 0 $0 0 $0
Aggregated Statistics For Year 2004(Based on 1 full and 5 partial tracts) A) Conventional B) Refinancings C) Non-occupant Loans on Number Average Value Number Average Value Number Average Value
LOANS ORIGINATED 81 $137,766 49 $126,529 9 $113,546 APPLICATIONS APPROVED, NOT ACCEPTED 15 $147,130 20 $128,214 1 $163,810 APPLICATIONS DENIED 0 $0 2 $134,890 0 $0 APPLICATIONS WITHDRAWN 3 $140,923 6 $117,433 1 $66,090 FILES CLOSED FOR INCOMPLETENESS 1 $159,670 0 $0 0 $0
Aggregated Statistics For Year 2003(Based on 1 full and 5 partial tracts) A) Conventional B) Refinancings C) Non-occupant Loans on Number Average Value Number Average Value Number Average Value
LOANS ORIGINATED 107 $136,465 140 $130,246 7 $104,474 APPLICATIONS APPROVED, NOT ACCEPTED 19 $138,635 43 $126,129 0 $0 APPLICATIONS DENIED 1 $76,500 2 $160,835 1 $65,050 APPLICATIONS WITHDRAWN 7 $118,250 12 $139,032 3 $102,207 FILES CLOSED FOR INCOMPLETENESS 1 $69,900 0 $0 0 $0
Aggregated Statistics For Year 2002(Based on 1 full and 2 partial tracts) A) Conventional B) Refinancings C) Non-occupant Loans on Number Average Value Number Average Value Number Average Value
LOANS ORIGINATED 30 $91,728 40 $106,013 3 $86,520 APPLICATIONS APPROVED, NOT ACCEPTED 5 $154,928 12 $100,330 0 $0 APPLICATIONS DENIED 1 $87,170 0 $0 0 $0 APPLICATIONS WITHDRAWN 2 $137,650 8 $109,566 0 $0 FILES CLOSED FOR INCOMPLETENESS 0 $0 0 $0 0 $0
Aggregated Statistics For Year 2001(Based on 1 full and 2 partial tracts) A) Conventional B) Refinancings C) Non-occupant Loans on Number Average Value Number Average Value Number Average Value
LOANS ORIGINATED 28 $96,189 37 $92,447 3 $74,767 APPLICATIONS APPROVED, NOT ACCEPTED 8 $94,396 6 $93,715 1 $85,530 APPLICATIONS DENIED 0 $0 0 $0 0 $0 APPLICATIONS WITHDRAWN 1 $100,790 0 $0 0 $0 FILES CLOSED FOR INCOMPLETENESS 0 $0 0 $0 0 $0
Aggregated Statistics For Year 2000(Based on 1 full and 2 partial tracts) A) Conventional B) Refinancings C) Non-occupant Loans on Number Average Value Number Average Value Number Average Value
LOANS ORIGINATED 36 $82,892 4 $83,180 3 $68,363 APPLICATIONS APPROVED, NOT ACCEPTED 3 $73,793 2 $76,430 0 $0 APPLICATIONS DENIED 0 $0 1 $77,070 1 $83,720 APPLICATIONS WITHDRAWN 0 $0 0 $0 0 $0 FILES CLOSED FOR INCOMPLETENESS 1 $67,440 0 $0 0 $0
Aggregated Statistics For Year 1999(Based on 5 partial tracts) A) Conventional B) Refinancings C) Non-occupant Loans on Number Average Value Number Average Value Number Average Value
LOANS ORIGINATED 108 $114,035 51 $99,985 1 $112,930 APPLICATIONS APPROVED, NOT ACCEPTED 8 $138,619 11 $105,946 1 $77,600 APPLICATIONS DENIED 2 $118,570 5 $90,524 0 $0 APPLICATIONS WITHDRAWN 2 $116,630 1 $146,120 0 $0 FILES CLOSED FOR INCOMPLETENESS 2 $89,820 2 $62,605 0 $0
Detailed PMIC statistics for the following Tracts:
0701.00
, 0702.00 , 0703.01 , 0703.06 , 0703.07 , 0703.08 Fire-safe hotels and motels in Florence, Kentucky:
Devon Motor Lodge, 8318 Dixie Hwy, Florence, Kentucky 41042 Phone: (859) 371-6763
Hampton Inn, I-75 & Ex 182, Florence, Kentucky 41042 Phone: (859) 283-1600
Hilton Cincinnati Airport, 7373 Turfway Rd, Florence, Kentucky 41018 Phone: (859) 372-9663, Fax: (859) 371-3361
Fairfield Inn, 50 Cavalier CT, Florence, Kentucky 41042 Phone: (859) 371-4800, Fax: (859) 371-4800
Clarion Inn & Suites, 30 Cavalier Ct, Florence, Kentucky 41042 Phone: (859) 371-0081, Fax: (859) 746-3324
Super 8 Motel, 7928 Dream St, Florence, Kentucky 41042 Phone: (859) 283-1221, Fax: (859) 283-1490
Turfside Motel, 6501 Dixie Hwy, Florence, Kentucky 41042 Phone: (859) 371-6181
Howard Johnson Florence/Cincinnati, 7809 US 42, Florence, Kentucky 41042 Phone: (859) 371-6300, Fax: (859) 538-1459
16 other hotels and motels
All 24 fire-safe hotels and motels in Florence, Kentucky
Most common first names in Florence, KY among deceased individuals Name Count Lived (average)
Mary 199 78.8 years William 179 71.9 years John 167 74.1 years Robert 163 70.1 years James 141 70.0 years Charles 133 73.2 years Dorothy 88 75.4 years Helen 80 81.7 years Joseph 75 71.4 years Margaret 75 77.4 years
Most common last names in Florence, KY among deceased individuals Last name Count Lived (average)
Smith 64 73.2 years Jones 47 77.7 years Johnson 39 75.1 years Miller 39 68.2 years Martin 38 72.9 years Wilson 35 69.4 years Baker 32 68.5 years Brown 30 76.9 years Tanner 28 79.4 years Williams 27 67.8 years
Florence compared to Kentucky state average:
Unemployed percentage significantly below state average. Median age below state average. Foreign-born population percentage significantly above state average. Renting percentage above state average. Length of stay since moving in significantly above state average.
#72 on the list of "Top 101 cities with the most residents born in Japan (population 500+)"
#22 on the list of "Top 101 counties with the lowest total withdrawal of fresh water for public supply"
#64 on the list of "Top 101 counties with the lowest ground withdrawal of fresh water for public supply"
#91 on the list of "Top 101 counties with the lowest percentage of residents relocating from foreign countries between 2010 and 2011"
#100 on the list of "Top 101 counties with the lowest number of deaths per 1000 residents 2007-2013 (pop. 50,000+)"
Top Patent Applicants
Rong Luo (36)
Kamlesh P. Nair (34)
Ticona Llc (30)
David P. Camp, Ii (20)
Eric Cady (17)
Joseph J. Grenci (16)
Christopher Mcgrady (15)
Lon Montgomery Gray (13)
Steven D. Gray (9)
Mukul Kaushik (8)
Total of 330 patent applications in 2008-2024.


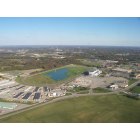
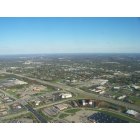
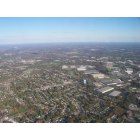
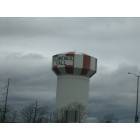
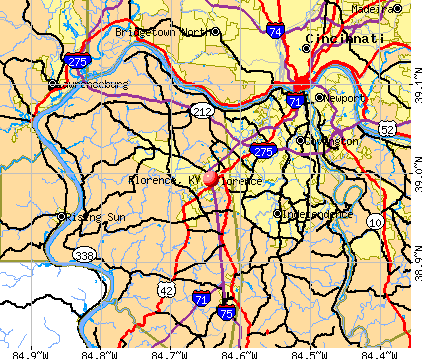


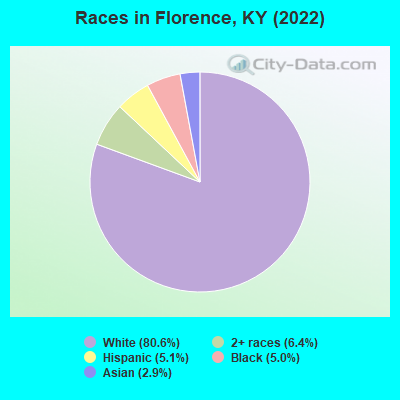
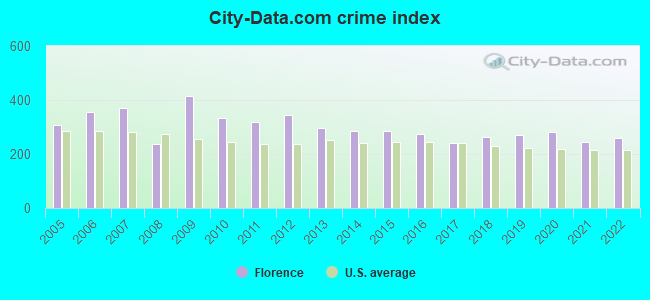
 Recent articles from our blog. Our writers, many of them Ph.D. graduates or candidates, create easy-to-read articles on a wide variety of topics.

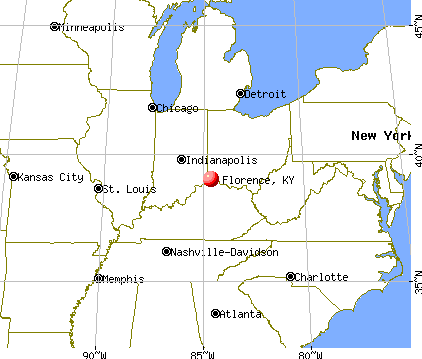
 (12.4 miles
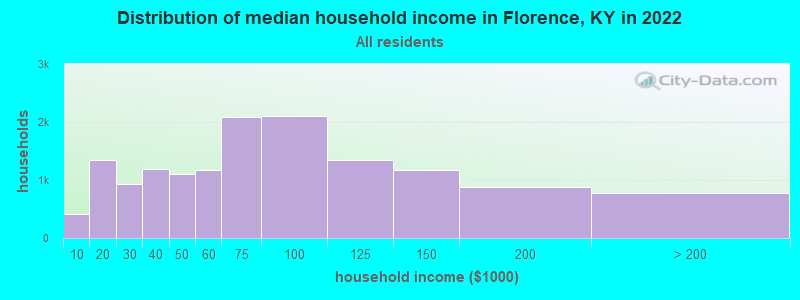
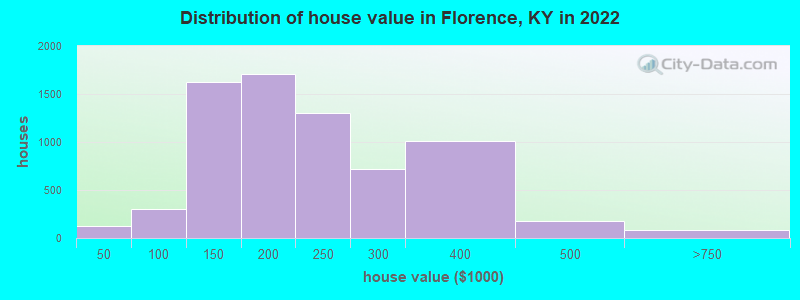

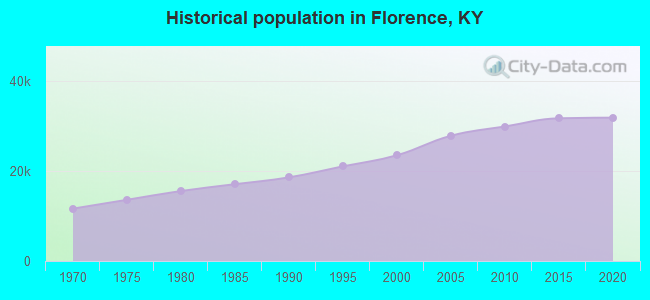
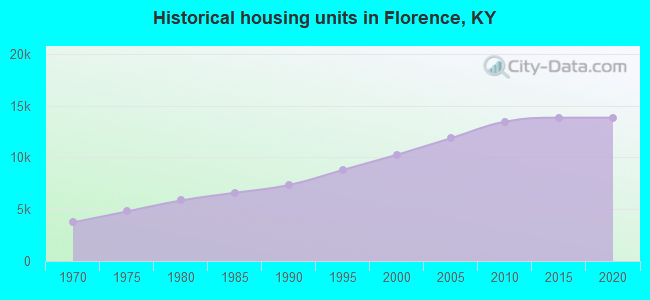
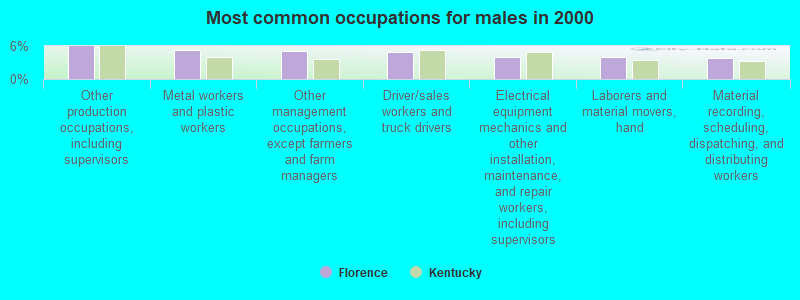
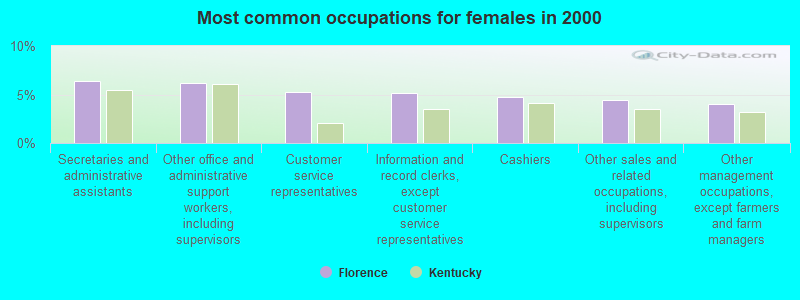


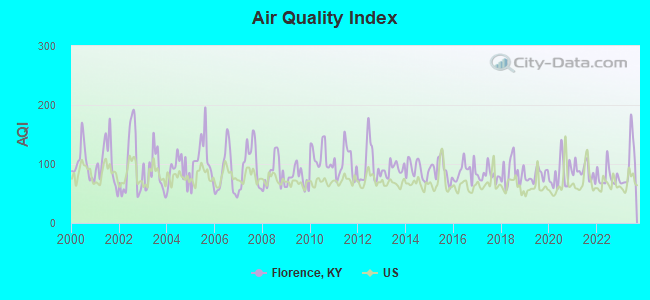
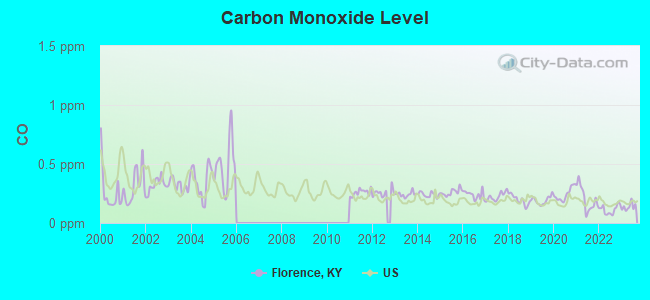
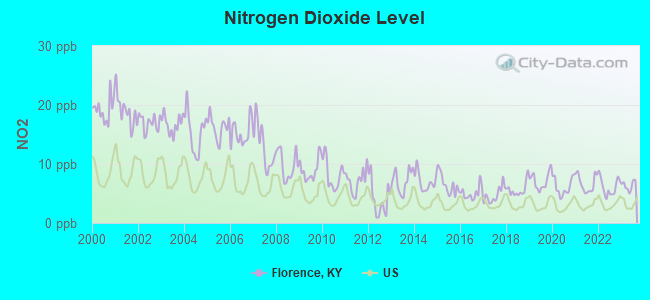
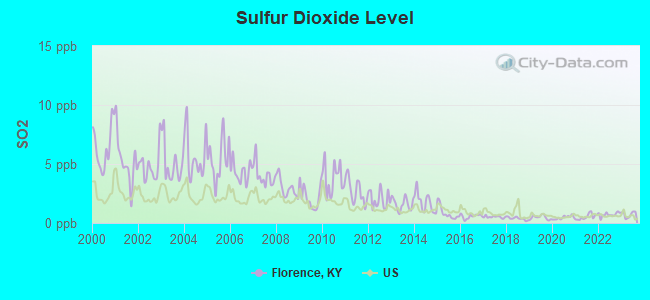
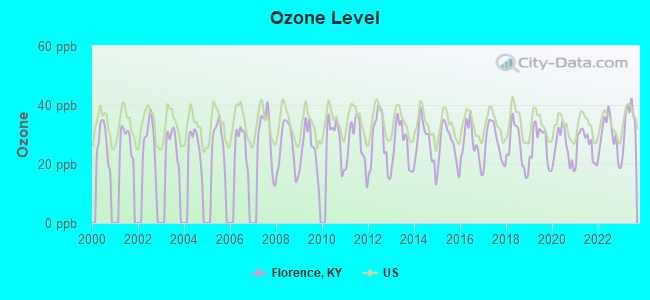
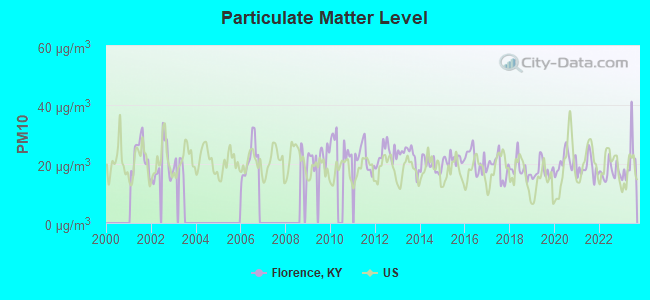
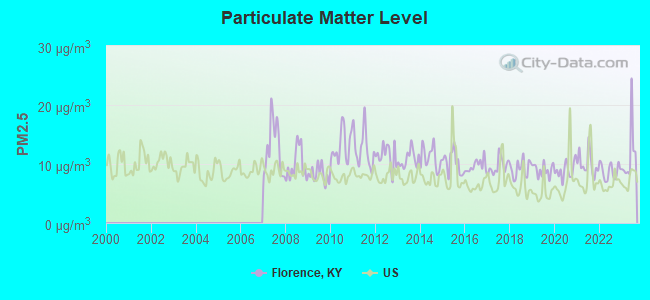
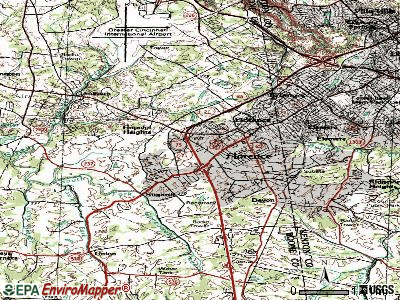
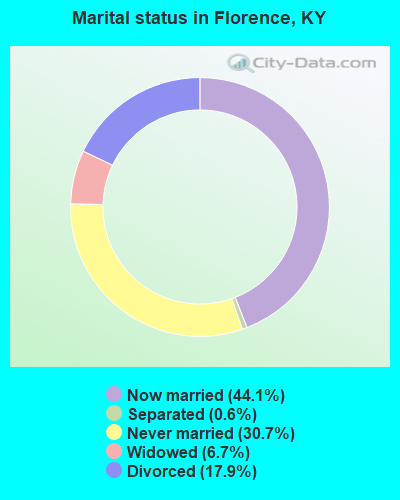
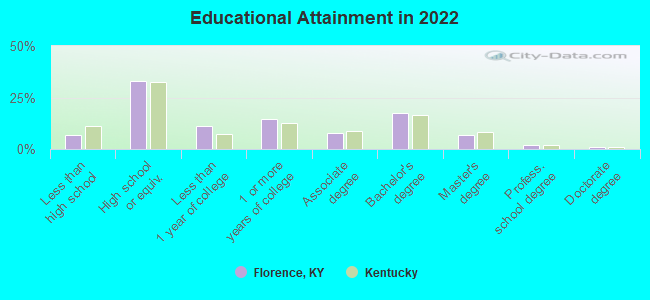
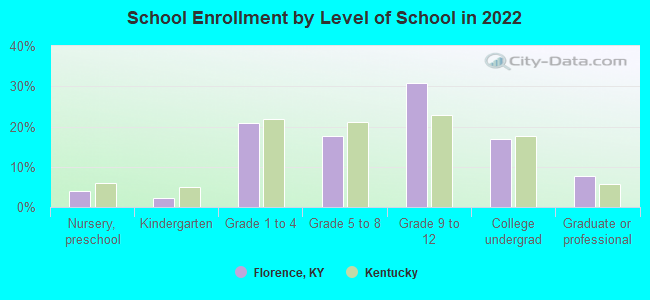
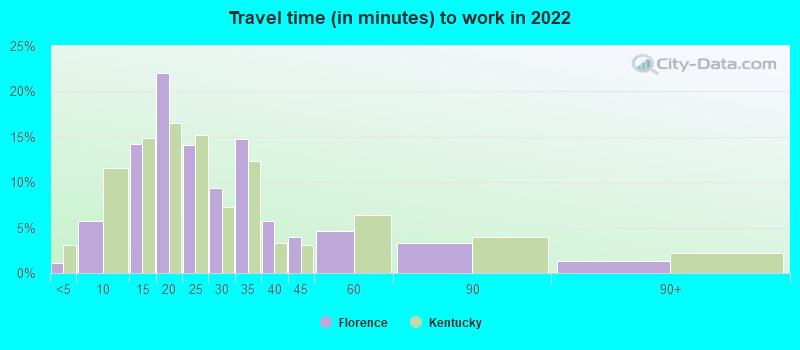
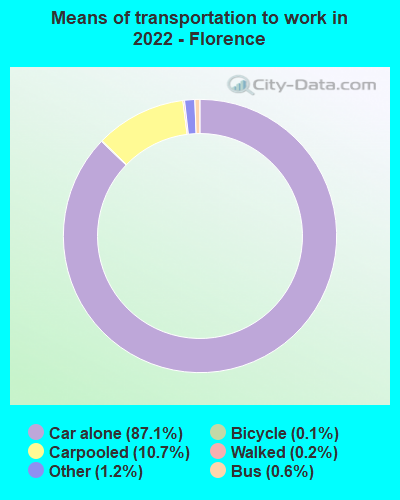

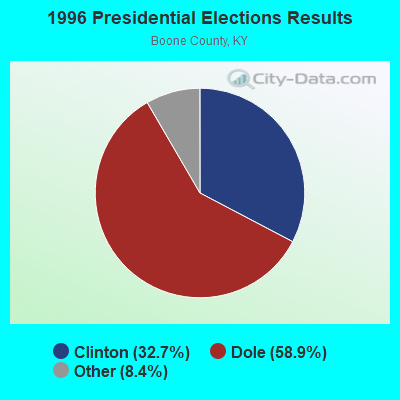


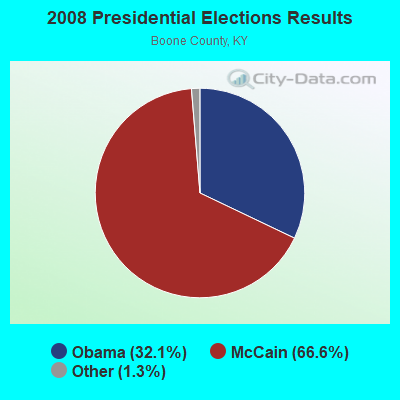
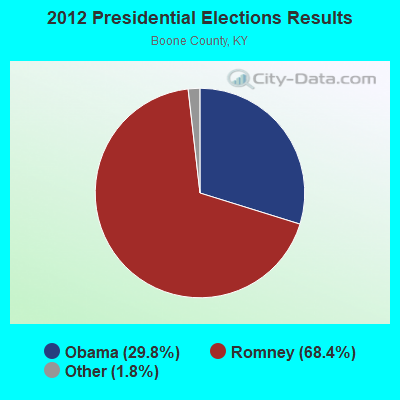
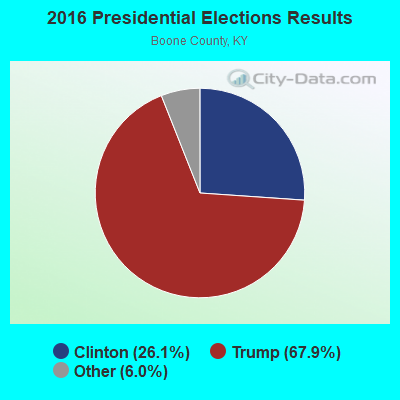

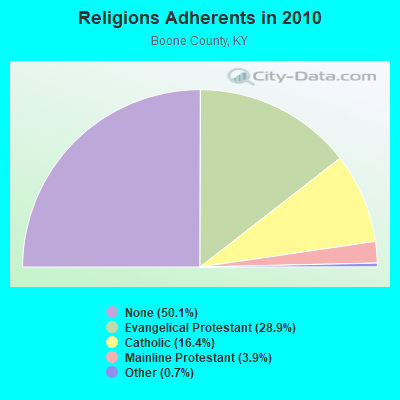

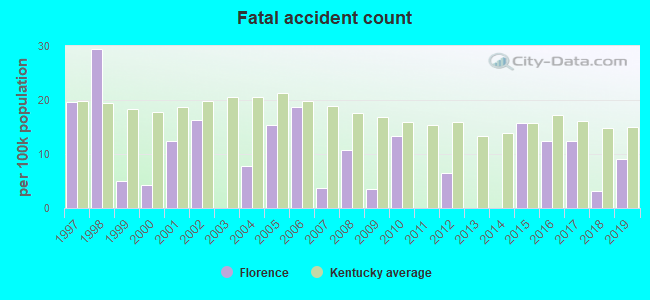
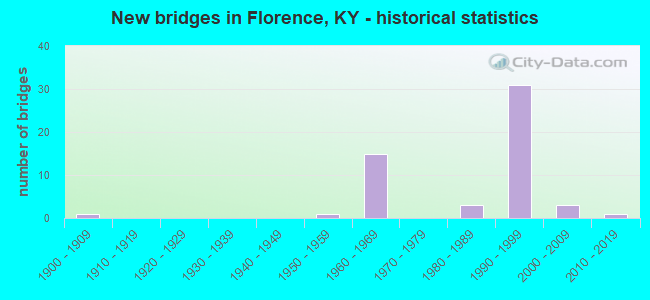
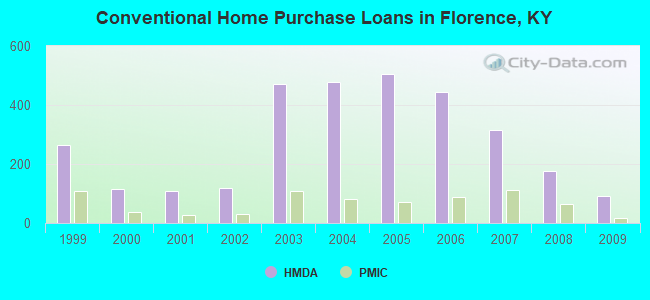
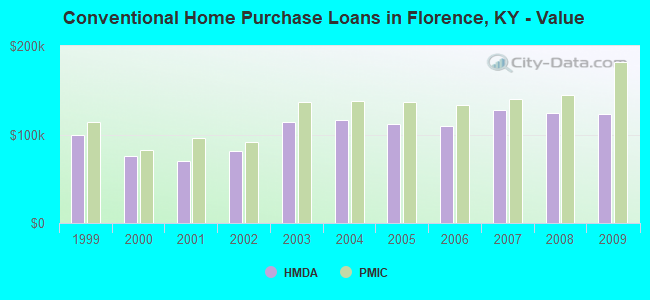
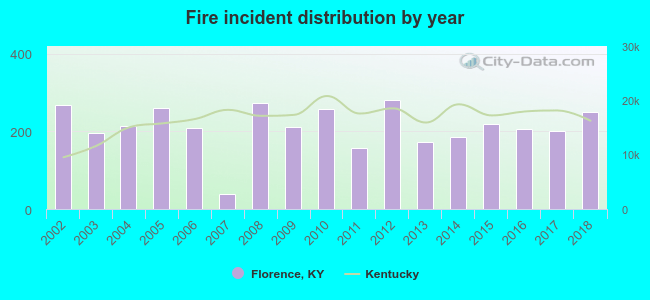 According to the data from the years 2002 - 2018 the average number of fires per year is 212. The highest number of reported fires - 280 took place in 2012, and the least - 39 in 2007. The data has a declining trend.
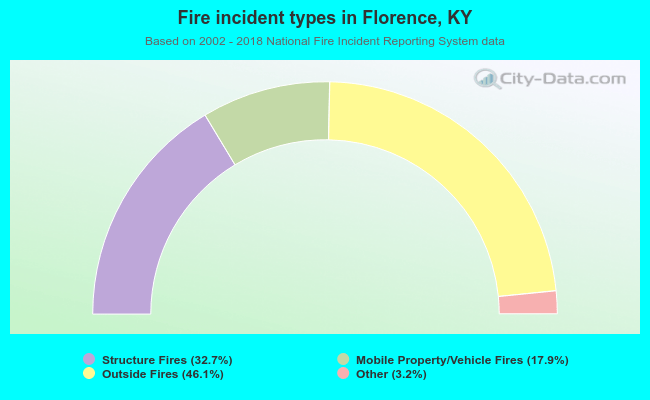 When looking into fire subcategories, the most reports belonged to: Outside Fires (46.1%), and Structure Fires (32.7%).