According to our research of Illinois and other state lists, there were 4 registered sex offenders living in Fox River Grove, Illinois as of June 16, 2024. The ratio of all residents to sex offenders in Fox River Grove is 1,201 to 1. The ratio of registered sex offenders to all residents in this city is lower than the state average.
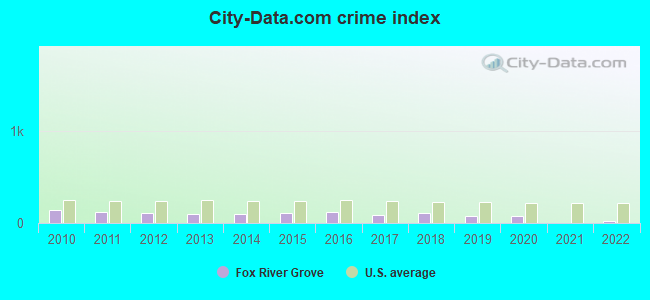
Crime rates in Fox River Grove by year
Type
2010
2011
2012
2013
2014
2015
2016
2017
2018
2019
2020
2021
2022
Murders (per 100,000)
1 (20.6)
0 (0.0)
0 (0.0)
0 (0.0)
0 (0.0)
0 (0.0)
0 (0.0)
0 (0.0)
0 (0.0)
0 (0.0)
0 (0.0)
0 (0.0)
0 (0.0)
Rapes (per 100,000)
0 (0.0)
0 (0.0)
0 (0.0)
2 (42.2)
1 (21.3)
2 (42.7)
1 (21.4)
0 (0.0)
1 (21.6)
2 (43.4)
1 (22.0)
0 (0.0)
0 (0.0)
Robberies (per 100,000)
0 (0.0)
3 (61.6)
1 (20.8)
1 (21.1)
0 (0.0)
0 (0.0)
1 (21.4)
2 (43.2)
0 (0.0)
0 (0.0)
0 (0.0)
0 (0.0)
0 (0.0)
Assaults (per 100,000)
4 (82.4)
4 (82.2)
1 (20.8)
2 (42.2)
5 (106.4)
5 (106.8)
8 (171.5)
6 (129.6)
8 (172.5)
0 (0.0)
1 (22.0)
0 (0.0)
0 (0.0)
Burglaries (per 100,000)
15 (309.0)
19 (390.2)
28 (583.7)
1 (21.1)
12 (255.4)
11 (234.9)
4 (85.7)
6 (129.6)
9 (194.0)
2 (43.4)
3 (65.9)
0 (0.0)
1 (21.3)
Thefts (per 100,000)
71 (1,463)
69 (1,417)
72 (1,501)
52 (1,097)
40 (851.4)
43 (918.2)
54 (1,158)
35 (756.3)
51 (1,099)
43 (932.8)
55 (1,208)
2 (44.5)
29 (619.1)
Auto thefts (per 100,000)
1 (20.6)
1 (20.5)
0 (0.0)
1 (21.1)
2 (42.6)
1 (21.4)
2 (42.9)
3 (64.8)
2 (43.1)
3 (65.1)
3 (65.9)
0 (0.0)
0 (0.0)
Arson (per 100,000)
1 (20.6)
0 (0.0)
0 (0.0)
0 (0.0)
2 (42.6)
1 (21.4)
1 (21.4)
0 (0.0)
3 (64.7)
1 (21.7)
2 (43.9)
0 (0.0)
0 (0.0)
City-Data.com crime index
139.5
120.6
111.3
95.6
93.7
110.4
113.6
83.4
112.7
80.3
80.2
1.8
26.3
The City-Data.com crime index weighs serious crimes and violent crimes more heavily. Higher means more crime, U.S. average is 246.1. It adjusts for the number of visitors and daily workers commuting into cities.
Latest news from Fox River Grove, IL collected exclusively by city-data.com from local newspapers, TV, and radio stations
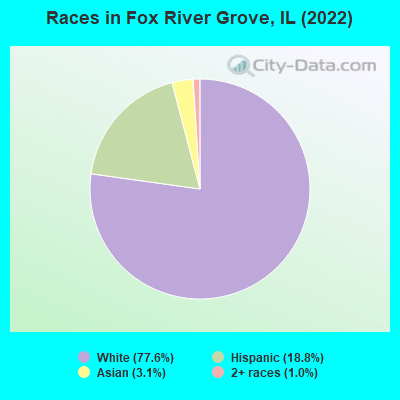
Ancestries: German (17.0%), English (10.6%), Polish (8.6%), Ukrainian (7.8%), Italian (6.9%), Irish (5.5%).
Current Local Time: CST time zone
Incorporated on 11/24/1919
Elevation: 760 feet
Land area: 1.66 square miles.
Population density: 2,796 people per square mile (average).
414 residents are foreign born (4.1% Europe, 2.8% Latin America, 1.8% Asia).
This village:
9.0%
Illinois:
14.1%
Median real estate property taxes paid for housing units with mortgages in 2022: $7,327 (2.8%) Median real estate property taxes paid for housing units with no mortgage in 2022: $7,832 (2.7%)
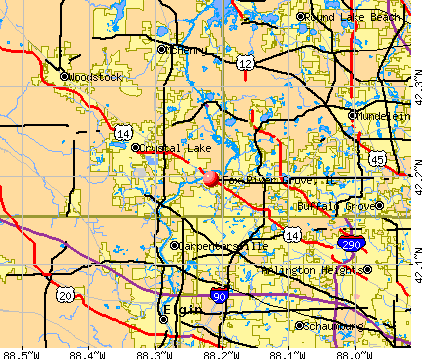
Nearest city with pop. 50,000+: Palatine, IL (10.5 miles , pop. 65,479).
Nearest city with pop. 200,000+: Chicago, IL (36.9 miles , pop. 2,896,016).
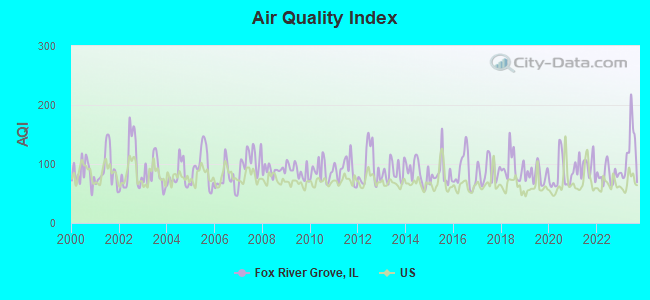
Air Quality Index (AQI) level in 2023 was 119. This is significantly worse than average.
City:
119
U.S.:
73
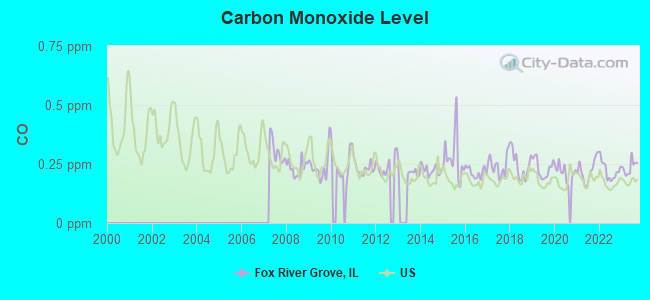
Carbon Monoxide (CO) [ppm] level in 2023 was 0.237. This is about average.Closest monitor was 21.7 miles away from the city center.
City:
0.237
U.S.:
0.251
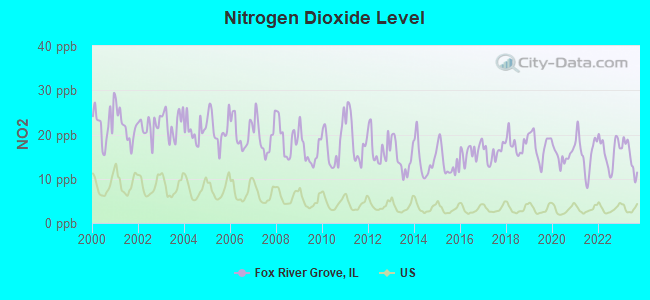
Nitrogen Dioxide (NO2) [ppb] level in 2023 was 15.1. This is significantly worse than average.Closest monitor was 17.1 miles away from the city center.
City:
15.1
U.S.:
5.1
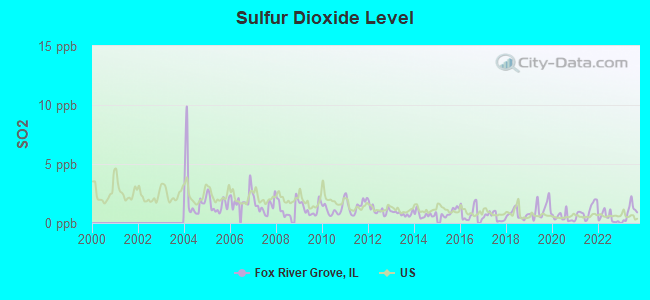
Sulfur Dioxide (SO2) [ppb] level in 2023 was 0.912. This is significantly better than average.Closest monitor was 10.5 miles away from the city center.
City:
0.912
U.S.:
1.515
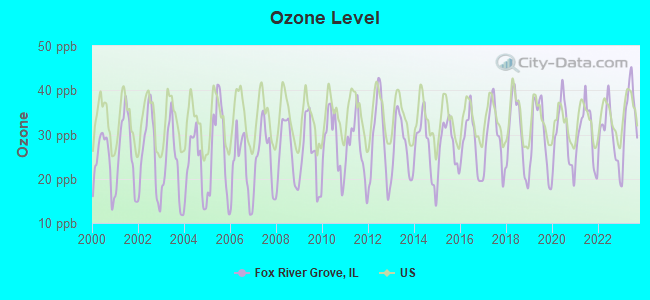
Ozone [ppb] level in 2023 was 34.4. This is about average.Closest monitor was 2.2 miles away from the city center.
City:
34.4
U.S.:
33.3
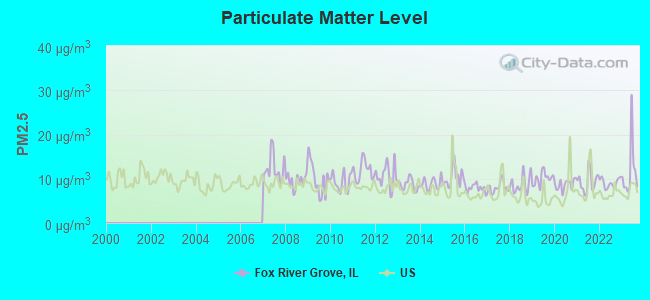
Particulate Matter (PM2.5) [µg/m3] level in 2023 was 11.6. This is significantly worse than average.Closest monitor was 2.2 miles away from the city center.
City:
11.6
U.S.:
8.1
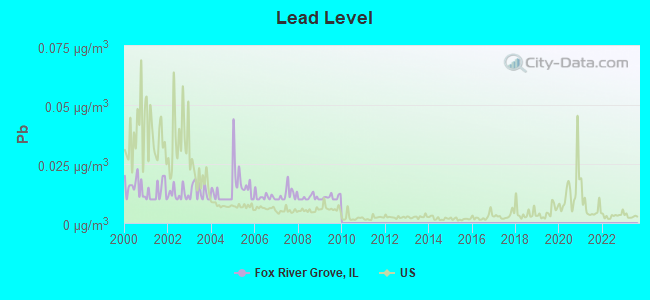
Lead (Pb) [µg/m3] level in 2009 was 0.0109. This is about average.Closest monitor was 2.2 miles away from the city center.
City:
0.0109
U.S.:
0.0093
Tornado activity:
Fox River Grove-area historical tornado activity is slightly below Illinois state average. It is 39% greater than the overall U.S. average.
On 4/21/1967, a category F4 (max. wind speeds 207-260 mph) tornado 4.2 miles away from the Fox River Grove village center killed one personand injured 100 peopleand causedbetween $500,000 and $5,000,000 in damages.
On 4/11/1965, a category F4 tornado 6.1 miles away from the village center killed 6 peopleand injured 75 people.
Earthquake activity:
Fox River Grove-area historical earthquake activity is significantly above Illinois state average. It is 39% greater than the overall U.S. average.
On 4/18/2008 at 09:36:59, a magnitude 5.4 (5.1 MB, 4.8 MS, 5.4 MW, 5.2 MW, Class: Moderate, Intensity: VI - VII) earthquake occurred 259.5 miles away from the city center On 6/10/1987 at 23:48:54, a magnitude 5.1 (4.9 MB, 4.4 MS, 4.6 MS, 5.1 LG) earthquake occurred 234.1 miles away from Fox River Grove center On 4/18/2008 at 09:36:59, a magnitude 5.2 (5.2 MW, Depth: 8.9 mi) earthquake occurred 259.6 miles away from Fox River Grove center On 6/28/2004 at 06:10:52, a magnitude 4.2 (4.2 MW, Depth: 6.2 mi, Class: Light, Intensity: IV - V) earthquake occurred 61.9 miles away from the city center On 2/10/2010 at 09:59:35, a magnitude 3.8 (3.8 MW, Depth: 6.2 mi, Class: Light, Intensity: II - III) earthquake occurred 21.3 miles away from the city center On 6/18/2002 at 17:37:15, a magnitude 5.0 (4.3 MB, 4.6 MW, 5.0 LG) earthquake occurred 292.0 miles away from Fox River Grove center Magnitude types: regional Lg-wave magnitude (LG), body-wave magnitude (MB), surface-wave magnitude (MS), moment magnitude (MW)
Natural disasters:
The number of natural disasters in McHenry County (15) is near the US average (15). Major Disasters (Presidential) Declared: 8 Emergencies Declared: 6
Causes of natural disasters: Storms: 7, Floods: 6, Snows: 3, Snowstorms: 2, Tornadoes: 2, Winter Storms: 2, Blizzard: 1, Hurricane: 1, Wind: 1, Other: 1 (Note: some incidents may be assigned to more than one category).
Hospitals and medical centers in Fox River Grove:
BOWES IN-HOME CARE, INC (906 ROUTE 22)
Other hospitals and medical centers near Fox River Grove:
NORTHWEST HOME HEALTH AND REHAB (Home Health Center, about 4 miles away; LAKE IN THE HILLS, IL)
DAVITA - CRYSTAL SPRINGS DIALYSIS (Dialysis Facility, about 5 miles away; CRYSTAL LAKE, IL)
HOSPICE OF NORTHEASTERN ILLINOIS INC (Hospital, about 5 miles away; BARRINGTON, IL)
PRAIRIEVIEW NURSING UNIT (Nursing Home, about 6 miles away; BARRINGTON, IL)
CARE CENTRE OF WAUCONDA (Nursing Home, about 6 miles away; WAUCONDA, IL)
WAUCONDA HEALTHCARE AND REHAB (Nursing Home, about 6 miles away; WAUCONDA, IL)
LEXINGTON OF LAKE ZURICH (Nursing Home, about 6 miles away; LAKE ZURICH, IL)
FOX RIVER GROVE PUBLIC LIBRARY DISTRICT (Operating income: $525,322; Location: 407 LINCOLN AVENUE; 25,507 books; 2,267 audio materials; 3,064 video materials; 16 local licensed databases; 16 other licensed databases; 99 print serial subscriptions; 2 electronic serial subscriptions)
Notable locations in Fox River Grove: Fox River Grove Fire Protection District Station 1 (A), Fox River Grove Fire Protection District Station 2 (B). Display/hide their locations on the map
McHenry County has a predicted average indoor radon screening level between 2 and 4 pCi/L (pico curies per liter) - Moderate Potential
Average household size:
This village:
2.8 people
Illinois:
2.6 people
Percentage of family households:
This village:
75.2%
Whole state:
65.8%
Percentage of households with unmarried partners:
This village:
4.3%
Whole state:
6.3%
Likely homosexual households (counted as self-reported same-sex unmarried-partner households)
Lesbian couples: 0.4% of all households
Gay men: 0.1% of all households
Banks with branches in Fox River Grove (2011 data):
JPMorgan Chase Bank, National Association: Fox River Grove Branch at 712 Northwest Highway, branch established on 2007/08/31; Fox River Grove Dominicks at 800 Route 14, branch established on 2000/03/02. Info updated 2011/11/10: Bank assets: $1,811,678.0 mil, Deposits: $1,190,738.0 mil, headquarters in Columbus, OH, positive income, International Specialization, 5577 total offices, Holding Company: Jpmorgan Chase & Co.
BMO Harris Bank National Association: Fox River Grove Facility at 860 Northwest Highway, branch established on 1979/10/08. Info updated 2011/07/14: Bank assets: $97,264.0 mil, Deposits: $75,624.6 mil, headquarters in Chicago, IL, positive income, 717 total offices, Holding Company: Bank Of Montreal
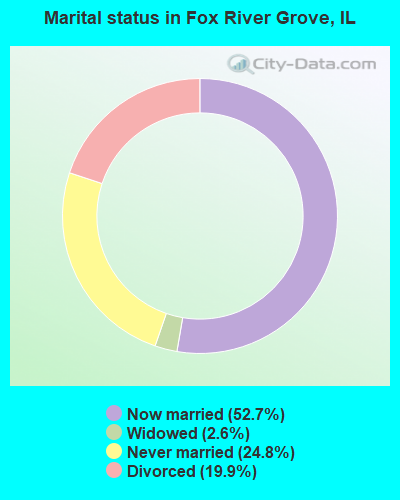
For population 15 years and over in Fox River Grove:
Never married: 24.8%
Now married: 52.7%
Separated: 0.0%
Widowed: 2.6%
Divorced: 19.9%
For population 25 years and over in Fox River Grove:
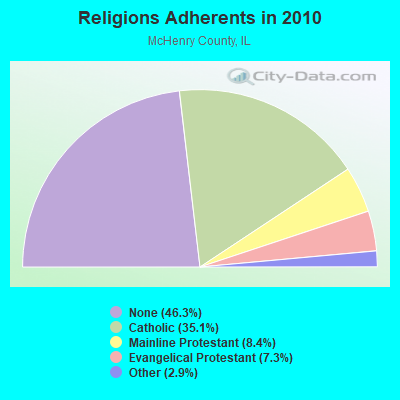
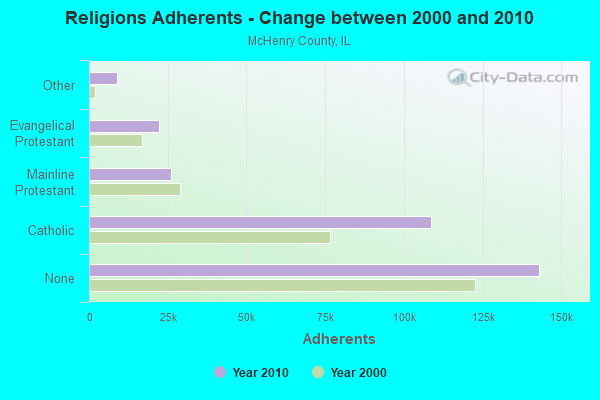
Religion statistics for Fox River Grove, IL (based on McHenry County data)
Religion
Adherents
Congregations
Catholic
108,465
17
Mainline Protestant
25,985
46
Evangelical Protestant
22,386
76
Other
8,809
20
Orthodox
54
1
None
143,061
-
Source: Clifford Grammich, Kirk Hadaway, Richard Houseal, Dale E.Jones, Alexei Krindatch, Richie Stanley and Richard H.Taylor. 2012. 2010 U.S.Religion Census: Religious Congregations & Membership Study. Association of Statisticians of American Religious Bodies. Jones, Dale E., et al. 2002. Congregations and Membership in the United States 2000. Nashville, TN: Glenmary Research Center. Graphs represent county-level data
Lat: 42.196250 Lon: -88.213444, Call Sign: WQGA389, Licensee ID: L00012213, Assigned Frequencies: 462.237 MHz, Grant Date: 10/19/2016, Expiration Date: 11/27/2026, Certifier: Tim Mahaffy, Registrant: Fox River Grove School District # 3, 403 Orchard, Fox River Grove, IL 60021, Phone: (847) 516-5100
Lat: 42.197778 Lon: -88.221389, Call Sign: WQJF524, Assigned Frequencies: 159.232 MHz, Grant Date: 07/18/2018, Expiration Date: 08/20/2028, Certifier: Robert W Kreher, Registrant: Fox River Grove Fire Protection District, 411 Algonquin Rd, Fox River Grove, IL 60021, Phone: (847) 639-9232, Fax: (847) 639-3336, Email:
Aircraft: PIPER PA-28-151 (Category: Land, Seats: 4, Weight: Up to 12,499 Pounds, Speed: 80 mph), Engine: Reciprocating N-Number: 1047H, N1047H, N-1047H, Serial Number: 28-7715303, Airworthiness Date: 12/16/1976, Certificate Issue Date: 12/17/2020 Registrant (Co-Owned): James Magel, 106 Grace Ln, Fox River Grove, IL 60021, Other Owners: Heather Magel
Aircraft: PIPER PA-15 (Category: Land, Seats: 2, Weight: Up to 12,499 Pounds, Speed: 75 mph), Engine: LYCOMING 0-145B SERIES (65 HP) (Reciprocating) N-Number: 4159H, N4159H, N-4159H, Serial Number: 15-42, Year manufactured: 1948, Certificate Issue Date: 12/16/2019 Registrant (Individual): Frederic L Sponsler, 930 Ski Hill Rd, Fox River Grove, IL 60021
Aircraft: CESSNA 150J (Category: Land, Seats: 2, Weight: Up to 12,499 Pounds, Speed: 90 mph), Engine: CONT MOTOR 0-200 SERIES (100 HP) (Reciprocating) N-Number: 50793, N50793, N-50793, Serial Number: 15069558, Year manufactured: 1968, Airworthiness Date: 09/16/1968 Registrant (Individual): Pending Registration, 8814 Gardner Rd, Fox River Grove, IL 60021
Aircraft: CESSNA 172C (Category: Land, Seats: 4, Weight: Up to 12,499 Pounds, Speed: 105 mph), Engine: CONT MOTOR 0-300 SER (145 HP) (Reciprocating) N-Number: 8354X, N8354X, N-8354X, Serial Number: 17248854, Year manufactured: 1961, Airworthiness Date: 10/24/1961, Certificate Issue Date: 09/30/2019 Registrant (LLC): Willow Equip LLC, Po Box 83, Fox River Grove, IL 60021
Home Mortgage Disclosure Act Aggregated Statistics For Year 2009 (Based on 1 partial tract)
A) FHA, FSA/RHS & VA Home Purchase Loans
B) Conventional Home Purchase Loans
C) Refinancings
D) Home Improvement Loans
F) Non-occupant Loans on < 5 Family Dwellings (A B C & D)
Number
Average Value
Number
Average Value
Number
Average Value
Number
Average Value
Number
Average Value
LOANS ORIGINATED
3
$201,577
4
$212,345
40
$237,520
1
$118,050
1
$150,950
APPLICATIONS APPROVED, NOT ACCEPTED
0
$0
0
$0
5
$244,756
0
$0
0
$0
APPLICATIONS DENIED
1
$87,190
1
$138,870
12
$342,227
1
$189,800
0
$0
APPLICATIONS WITHDRAWN
0
$0
0
$0
6
$241,020
0
$0
0
$0
FILES CLOSED FOR INCOMPLETENESS
0
$0
0
$0
1
$295,020
0
$0
0
$0
Aggregated Statistics For Year 2008 (Based on 1 partial tract)
A) FHA, FSA/RHS & VA Home Purchase Loans
B) Conventional Home Purchase Loans
C) Refinancings
D) Home Improvement Loans
F) Non-occupant Loans on < 5 Family Dwellings (A B C & D)
Number
Average Value
Number
Average Value
Number
Average Value
Number
Average Value
Number
Average Value
LOANS ORIGINATED
2
$182,370
8
$324,465
30
$260,334
2
$121,020
2
$304,785
APPLICATIONS APPROVED, NOT ACCEPTED
0
$0
1
$370,130
4
$351,582
1
$92,580
0
$0
APPLICATIONS DENIED
1
$97,040
3
$693,963
11
$343,965
1
$161,730
1
$440,580
APPLICATIONS WITHDRAWN
0
$0
1
$743,230
6
$236,032
1
$60,050
0
$0
FILES CLOSED FOR INCOMPLETENESS
0
$0
0
$0
2
$396,990
0
$0
0
$0
Aggregated Statistics For Year 2007 (Based on 1 partial tract)
B) Conventional Home Purchase Loans
C) Refinancings
D) Home Improvement Loans
F) Non-occupant Loans on < 5 Family Dwellings (A B C & D)
Number
Average Value
Number
Average Value
Number
Average Value
Number
Average Value
LOANS ORIGINATED
16
$326,882
31
$284,307
2
$84,305
3
$402,163
APPLICATIONS APPROVED, NOT ACCEPTED
3
$283,373
4
$367,152
1
$55,210
1
$236,460
APPLICATIONS DENIED
5
$646,932
13
$520,663
1
$39,970
2
$281,915
APPLICATIONS WITHDRAWN
3
$417,657
5
$255,724
0
$0
0
$0
FILES CLOSED FOR INCOMPLETENESS
0
$0
4
$365,712
0
$0
0
$0
Aggregated Statistics For Year 2006 (Based on 1 partial tract)
A) FHA, FSA/RHS & VA Home Purchase Loans
B) Conventional Home Purchase Loans
C) Refinancings
D) Home Improvement Loans
F) Non-occupant Loans on < 5 Family Dwellings (A B C & D)
Number
Average Value
Number
Average Value
Number
Average Value
Number
Average Value
Number
Average Value
LOANS ORIGINATED
1
$118,230
19
$385,889
40
$303,147
3
$113,893
4
$419,158
APPLICATIONS APPROVED, NOT ACCEPTED
0
$0
3
$386,177
5
$249,218
1
$17,660
0
$0
APPLICATIONS DENIED
0
$0
6
$395,905
15
$257,819
2
$70,365
1
$184,410
APPLICATIONS WITHDRAWN
0
$0
2
$373,565
9
$257,884
1
$150,950
0
$0
FILES CLOSED FOR INCOMPLETENESS
0
$0
0
$0
2
$316,030
0
$0
0
$0
Aggregated Statistics For Year 2005 (Based on 1 partial tract)
A) FHA, FSA/RHS & VA Home Purchase Loans
B) Conventional Home Purchase Loans
C) Refinancings
D) Home Improvement Loans
F) Non-occupant Loans on < 5 Family Dwellings (A B C & D)
Number
Average Value
Number
Average Value
Number
Average Value
Number
Average Value
Number
Average Value
LOANS ORIGINATED
1
$129,010
30
$267,975
42
$242,843
2
$222,710
5
$294,056
APPLICATIONS APPROVED, NOT ACCEPTED
0
$0
6
$194,575
6
$293,382
1
$19,890
1
$220,290
APPLICATIONS DENIED
0
$0
8
$192,755
16
$295,326
1
$195,940
1
$148,160
APPLICATIONS WITHDRAWN
0
$0
2
$254,590
14
$241,484
1
$184,040
1
$81,800
FILES CLOSED FOR INCOMPLETENESS
0
$0
0
$0
4
$296,602
0
$0
0
$0
Aggregated Statistics For Year 2004 (Based on 1 partial tract)
A) FHA, FSA/RHS & VA Home Purchase Loans
B) Conventional Home Purchase Loans
C) Refinancings
D) Home Improvement Loans
F) Non-occupant Loans on < 5 Family Dwellings (A B C & D)
Number
Average Value
Number
Average Value
Number
Average Value
Number
Average Value
Number
Average Value
LOANS ORIGINATED
1
$149,840
25
$238,495
49
$251,739
4
$119,115
2
$193,615
APPLICATIONS APPROVED, NOT ACCEPTED
0
$0
3
$284,240
7
$278,133
2
$81,515
0
$0
APPLICATIONS DENIED
0
$0
3
$212,857
18
$205,512
2
$107,450
1
$107,450
APPLICATIONS WITHDRAWN
0
$0
3
$245,017
13
$183,068
1
$102,250
0
$0
FILES CLOSED FOR INCOMPLETENESS
0
$0
1
$103,170
4
$201,282
0
$0
0
$0
Aggregated Statistics For Year 2003 (Based on 1 partial tract)
A) FHA, FSA/RHS & VA Home Purchase Loans
B) Conventional Home Purchase Loans
C) Refinancings
D) Home Improvement Loans
E) Loans on Dwellings For 5+ Families
F) Non-occupant Loans on < 5 Family Dwellings (A B C & D)
Number
Average Value
Number
Average Value
Number
Average Value
Number
Average Value
Number
Average Value
Number
Average Value
LOANS ORIGINATED
1
$218,060
23
$248,670
129
$204,888
2
$165,730
1
$521,080
4
$158,990
APPLICATIONS APPROVED, NOT ACCEPTED
0
$0
2
$201,610
15
$172,515
0
$0
0
$0
0
$0
APPLICATIONS DENIED
1
$162,480
1
$316,400
21
$184,430
2
$50,195
0
$0
1
$256,170
APPLICATIONS WITHDRAWN
0
$0
2
$165,730
22
$164,319
0
$0
0
$0
1
$77,890
FILES CLOSED FOR INCOMPLETENESS
0
$0
1
$98,160
4
$179,812
0
$0
0
$0
0
$0
Aggregated Statistics For Year 2002 (Based on 1 partial tract)
A) FHA, FSA/RHS & VA Home Purchase Loans
B) Conventional Home Purchase Loans
C) Refinancings
D) Home Improvement Loans
E) Loans on Dwellings For 5+ Families
F) Non-occupant Loans on < 5 Family Dwellings (A B C & D)
Number
Average Value
Number
Average Value
Number
Average Value
Number
Average Value
Number
Average Value
Number
Average Value
LOANS ORIGINATED
2
$181,160
21
$216,051
99
$210,769
2
$182,180
1
$207,840
2
$191,105
APPLICATIONS APPROVED, NOT ACCEPTED
0
$0
3
$186,890
12
$177,597
1
$45,550
0
$0
0
$0
APPLICATIONS DENIED
0
$0
2
$150,670
10
$216,555
1
$26,210
0
$0
0
$0
APPLICATIONS WITHDRAWN
0
$0
2
$247,245
12
$203,437
0
$0
0
$0
1
$84,030
FILES CLOSED FOR INCOMPLETENESS
0
$0
1
$282,570
3
$261,067
0
$0
0
$0
0
$0
Aggregated Statistics For Year 2001 (Based on 1 partial tract)
A) FHA, FSA/RHS & VA Home Purchase Loans
B) Conventional Home Purchase Loans
C) Refinancings
D) Home Improvement Loans
F) Non-occupant Loans on < 5 Family Dwellings (A B C & D)
Number
Average Value
Number
Average Value
Number
Average Value
Number
Average Value
Number
Average Value
LOANS ORIGINATED
3
$132,423
25
$197,522
69
$191,698
3
$49,947
2
$135,985
APPLICATIONS APPROVED, NOT ACCEPTED
0
$0
3
$250,037
6
$157,828
1
$20,820
0
$0
APPLICATIONS DENIED
1
$75,480
2
$231,630
12
$129,015
1
$29,370
0
$0
APPLICATIONS WITHDRAWN
0
$0
2
$320,215
9
$182,079
1
$199,840
0
$0
FILES CLOSED FOR INCOMPLETENESS
0
$0
0
$0
1
$194,080
0
$0
0
$0
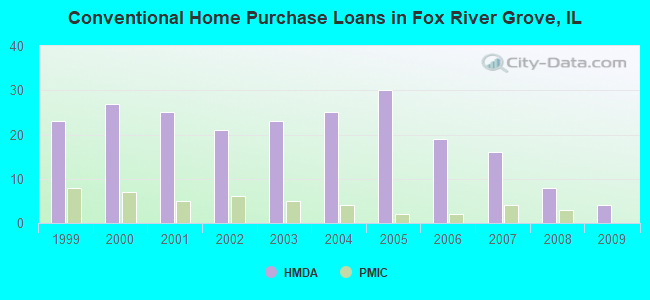
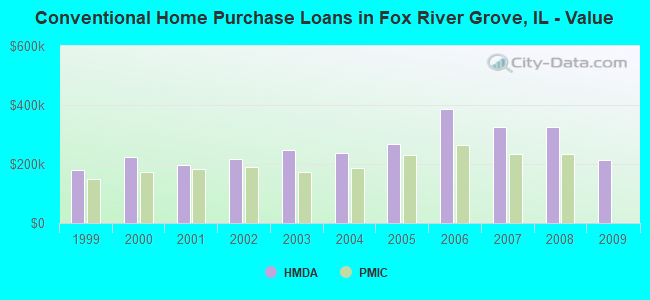
Aggregated Statistics For Year 2000 (Based on 1 partial tract)
A) FHA, FSA/RHS & VA Home Purchase Loans
B) Conventional Home Purchase Loans
C) Refinancings
D) Home Improvement Loans
F) Non-occupant Loans on < 5 Family Dwellings (A B C & D)
Number
Average Value
Number
Average Value
Number
Average Value
Number
Average Value
Number
Average Value
LOANS ORIGINATED
2
$138,030
27
$223,514
17
$186,064
5
$31,008
2
$224,290
APPLICATIONS APPROVED, NOT ACCEPTED
1
$87,000
3
$135,337
3
$198,047
2
$29,000
0
$0
APPLICATIONS DENIED
0
$0
3
$192,903
7
$281,771
1
$47,220
0
$0
APPLICATIONS WITHDRAWN
0
$0
3
$170,470
3
$136,883
1
$25,100
0
$0
FILES CLOSED FOR INCOMPLETENESS
0
$0
1
$274,390
4
$123,530
0
$0
0
$0
Aggregated Statistics For Year 1999 (Based on 1 partial tract)
A) FHA, FSA/RHS & VA Home Purchase Loans
B) Conventional Home Purchase Loans
C) Refinancings
D) Home Improvement Loans
F) Non-occupant Loans on < 5 Family Dwellings (A B C & D)
Detailed PMIC statistics for the following Tracts:8714.02
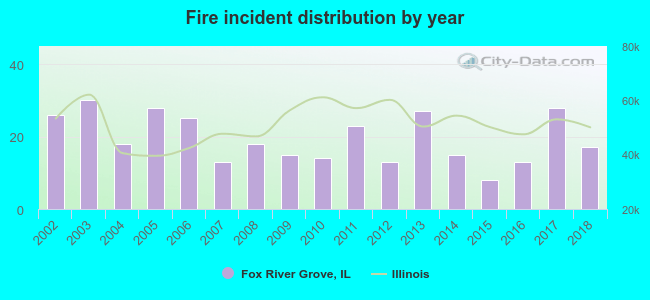
2002 - 2018 National Fire Incident Reporting System (NFIRS) incidents
Based on the data from the years 2002 - 2018 the average number of fire incidents per year is 19. The highest number of reported fire incidents - 30 took place in 2003, and the least - 8 in 2015. The data has a decreasing trend.
When looking into fire subcategories, the most reports belonged to: Structure Fires (50.8%), and Outside Fires (37.2%).
Fire incident types reported to NFIRS in Fox River Grove, IL
#39 on the list of "Top 100 high-educated but low-earning cities"
#6 on the list of "Top 101 counties with the largest decrease in the number of births per 1000 residents 2000-2006 to 2007-2013 (pop 50,000+)"
#10 on the list of "Top 101 counties with the lowest number of infant deaths per 1000 residents 2007-2013 (pop. 50,000+)"
#10 on the list of "Top 101 counties with the largest decrease in the number of infant deaths per 1000 residents 2000-2006 to 2007-2013 (pop. 50,000+)"
#30 on the list of "Top 101 counties with the lowest percentage of residents relocating to foreign countries in 2011"
#36 on the list of "Top 101 counties with the largest number of people moving out compared to moving in (pop. 50,000+)"


 Recent articles from our blog. Our writers, many of them Ph.D. graduates or candidates, create easy-to-read articles on a wide variety of topics.

 (10.5 miles


 Based on the data from the years 2002 - 2018 the average number of fire incidents per year is 19. The highest number of reported fire incidents - 30 took place in 2003, and the least - 8 in 2015. The data has a decreasing trend.
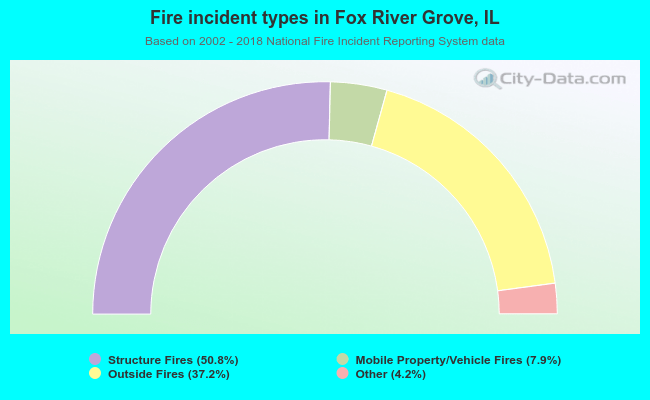 When looking into fire subcategories, the most reports belonged to: Structure Fires (50.8%), and Outside Fires (37.2%).