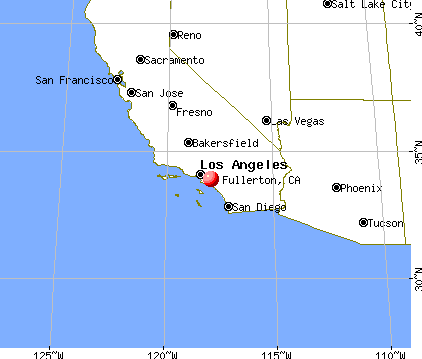
Fullerton, California
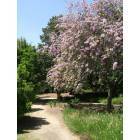
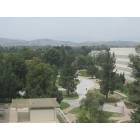
Fullerton: Duck Pond at Fullerton Arboretum
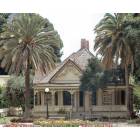
Fullerton: Fullerton Arboretum
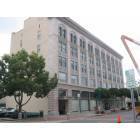
Fullerton: Fullerton, CA - October 2002. User comment: CHANEYS DEPT. STORE DOWNTOWN FULLERTON
Fullerton: Fullerton Arboretum
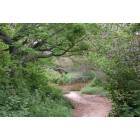
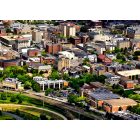
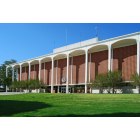
Fullerton: Fullerton campus and nearby hills
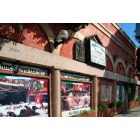
Fullerton: Angelos & Vinci's
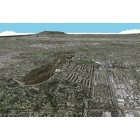
Fullerton: the last remaining open space in Fullerton, it should be saved!!
Fullerton

Fullerton: Backyard Sunset
Fullerton: City Hall

Fullerton: Branagan's
- see
18
more - add
your
Submit your own pictures of this city and show them to the world
- OSM Map
- General Map
- Google Map
- MSN Map
Population change since 2000: +11.5%
 |
| Males: 66,114 | |
| Females: 74,427 |
| Median resident age: | 38.2 years |
| California median age: | 37.9 years |
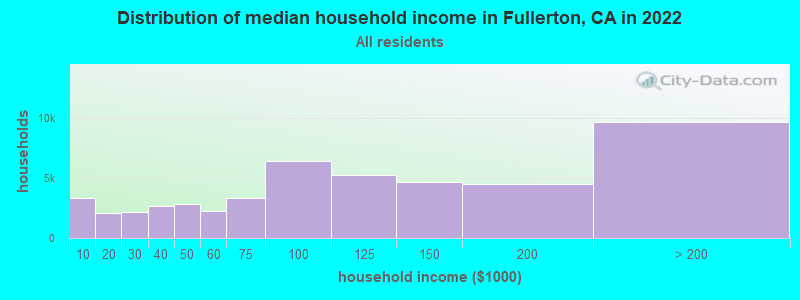
| Fullerton: | $97,004 |
| CA: | $91,551 |
Estimated per capita income in 2022: $47,740 (it was $23,370 in 2000)
Fullerton city income, earnings, and wages data
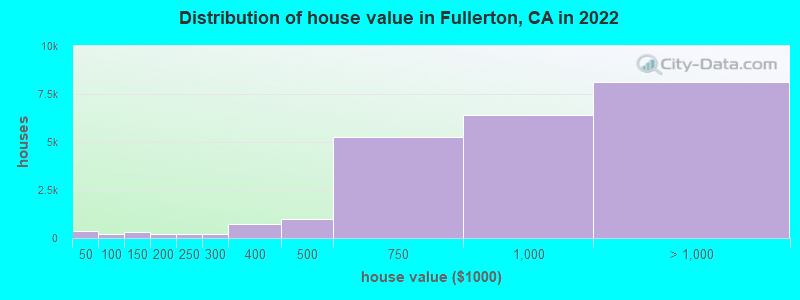
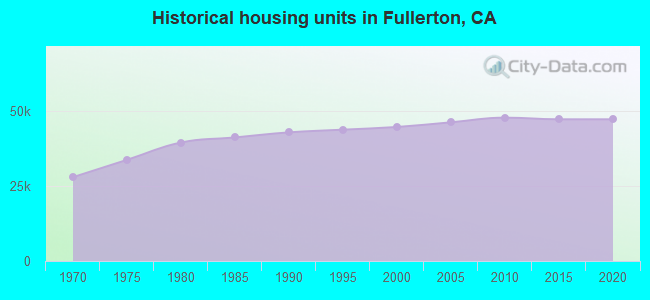
Estimated median house or condo value in 2022: $901,600 (it was $230,500 in 2000)
| Fullerton: | $901,600 |
| CA: | $715,900 |
Mean prices in 2022: all housing units: $885,997; detached houses: $976,816; townhouses or other attached units: $649,740; in 3-to-4-unit structures: $511,940; in 5-or-more-unit structures: $524,003; mobile homes: $182,480
Median gross rent in 2022: $2,038.
(8.0% for White Non-Hispanic residents, 22.4% for Black residents, 12.4% for Hispanic or Latino residents, 18.8% for American Indian residents, 9.9% for Native Hawaiian and other Pacific Islander residents, 24.9% for other race residents, 15.5% for two or more races residents)
Detailed information about poverty and poor residents in Fullerton, CA


Compare current foreclosures in Fullerton, CA:
| Photo | Address | Area | Beds / Baths | Price | Details |
|---|---|---|---|---|---|

|
#1
Evans St
Fullerton, CA 92833
|
3,229 sq. feet
|
4 baths 5 beds |
show details | |

|
#2
Colt Way Unit 211
Fullerton, CA 92833
|
1,016 sq. feet
|
3 baths 2 beds |
show details | |

|
#3
W Olive Ave
Fullerton, CA 92833
|
1,050 sq. feet
|
2 baths 3 beds |
show details | |

|
#4
N Lincoln Ave
Fullerton, CA 92831
|
774 sq. feet
|
1 baths 1 beds |
show details | |

|
#5
W Truslow Ave
Fullerton, CA 92832
|
1,132 sq. feet
|
1 baths 2 beds |
show details | |

|
#6
Avenida Selva # 189
Fullerton, CA 92833
|
1,320 sq. feet
|
2 baths 3 beds |
show details | |

|
#7
Carol Dr
Fullerton, CA 92833
|
1,528 sq. feet
|
2 baths 4 beds |
show details | |

|
#8
W Houston Ave
Fullerton, CA 92833
|
1,322 sq. feet
|
2 baths 3 beds |
show details | |

|
#9
S Newell Ave
Fullerton, CA 92832
|
1,092 sq. feet
|
2 baths 3 beds |
show details | |

|
#10
E Sunny Hills Rd
Fullerton, CA 92835
|
2,370 sq. feet
|
3 baths 4 beds |
show details |
| Photo | Address | Area | Beds / Baths | Price | Details |
|---|---|---|---|---|---|

|
#11
N Acacia Ave Unit B15
Fullerton, CA 92831
|
677 sq. feet
|
1 baths 1 beds |
show details | |

|
#12
Vista Del Oro
Fullerton, CA 92831
|
1,970 sq. feet
|
3 baths 3 beds |
show details | |

|
#13
Edward Ave
Fullerton, CA 92833
|
1,430 sq. feet
|
3 baths 4 beds |
show details | |

|
#14
Nicolas Dr
Fullerton, CA 92833
|
1,778 sq. feet
|
2 baths 4 beds |
show details | |

|
#15
W Valencia Dr
Fullerton, CA 92833
|
896 sq. feet
|
2 baths 4 beds |
show details | |

|
#16
W Ash Ave
Fullerton, CA 92833
|
992 sq. feet
|
1 baths 2 beds |
show details | |

|
#17
W Roberta Ave
Fullerton, CA 92832
|
1,505 sq. feet
|
2 baths 4 beds |
show details | |

|
#18
Stephens Ave
Fullerton, CA 92833
|
1,802 sq. feet
|
2 baths 2 beds |
show details | |

|
#19
W Gage Ave
Fullerton, CA 92833
|
1,257 sq. feet
|
3 baths 3 beds |
show details | |

|
#20
Clear Creek Dr
Fullerton, CA 92833
|
2,750 sq. feet
|
3 baths 4 beds |
show details |
| Photo | Address | Area | Beds / Baths | Price | Details |
|---|---|---|---|---|---|

|
#21
E Fern Dr
Fullerton, CA 92831
|
1,673 sq. feet
|
3 baths 2 beds |
show details | |

|
#22
Altura Dr
Fullerton, CA 92835
|
2,808 sq. feet
|
4 baths 3 beds |
show details | |

|
#23
W Olive Ave
Fullerton, CA 92833
|
1,227 sq. feet
|
2 baths 4 beds |
show details | |

|
#24
E Rosslynn Ave
Fullerton, CA 92832
|
1,213 sq. feet
|
2 baths 3 beds |
show details | |

|
#25
Brea Blvd # 129
Fullerton, CA 92835
|
955 sq. feet
|
2 baths 2 beds |
show details | |

|
#26
E Truslow Ave
Fullerton, CA 92832
|
842 sq. feet
|
1 baths 2 beds |
show details | |

|
#27
W Roberta Ave
Fullerton, CA 92832
|
1,305 sq. feet
|
2 baths 4 beds |
show details | |

|
#28
N Lincoln Ave
Fullerton, CA 92831
|
720 sq. feet
|
1 baths 2 beds |
show details | |

|
#29
W Jacaranda Pl
Fullerton, CA 92833
|
1,246 sq. feet
|
1 baths 3 beds |
show details | |

|
#30
Laurel Ave
Fullerton, CA 92835
|
1,400 sq. feet
|
2 baths 4 beds |
show details |
| Photo | Address | Area | Beds / Baths | Price | Details |
|---|---|---|---|---|---|

|
#31
N Raymond Ave
Fullerton, CA 92831
|
1,080 sq. feet
|
1 baths 1 beds |
show details | |

|
#32
E Alm Ave
Fullerton, CA 92832
|
1,279 sq. feet
|
2 baths 3 beds |
show details | |

|
#33
W Flower Ave
Fullerton, CA 92833
|
1,202 sq. feet
|
2 baths 3 beds |
show details | |

|
#34
Franklin Ave
Fullerton, CA 92833
|
1,379 sq. feet
|
2 baths 4 beds |
show details | |

|
#35
Colt Way Unit 196
Fullerton, CA 92833
|
1,016 sq. feet
|
3 baths 2 beds |
show details | |

|
#36
W Houston Ave
Fullerton, CA 92833
|
1,213 sq. feet
|
2 baths 3 beds |
show details | |

|
#37
N Raymond Ave
Fullerton, CA 92831
|
1,080 sq. feet
|
1 baths 1 beds |
show details | |

|
#38
W Elm Ave
Fullerton, CA 92833
|
1,756 sq. feet
|
2 baths 3 beds |
show details | |

|
#39
E Elm Ave
Fullerton, CA 92832
|
1,094 sq. feet
|
1 baths 2 beds |
show details | |

|
#40
Page Ave
Fullerton, CA 92833
|
1,640 sq. feet
|
2 baths 3 beds |
show details |
| Photo | Address | Area | Beds / Baths | Price | Details |
|---|---|---|---|---|---|

|
#41
W Oak Ave
Fullerton, CA 92833
|
1,580 sq. feet
|
2 baths 3 beds |
show details | |

|
#42
Seaview Dr
Fullerton, CA 92833
|
1,877 sq. feet
|
2 baths 3 beds |
show details | |

|
#43
Paseo Dorado
Fullerton, CA 92833
|
1,178 sq. feet
|
2 baths 2 beds |
show details | |

|
#44
W Hill Ave
Fullerton, CA 92832
|
1,220 sq. feet
|
1 baths 3 beds |
show details | |

|
#45
Newkirk Ave
Fullerton, CA 92832
|
1,303 sq. feet
|
2 baths 3 beds |
show details | |

|
#46
E Wilshire Ave
Fullerton, CA 92831
|
1,077 sq. feet
|
1 baths 3 beds |
show details | |

|
#47
W Elm Ave
Fullerton, CA 92833
|
1,267 sq. feet
|
2 baths 3 beds |
show details | |

|
#48
S Pine Dr
Fullerton, CA 92833
|
1,222 sq. feet
|
2 baths 3 beds |
show details | |

|
#49
E Elm Ave
Fullerton, CA 92832
|
1,279 sq. feet
|
2 baths 3 beds |
show details | |

|
Check over 1 million property listings on Foreclosure.com!
|
browse all offers | |||


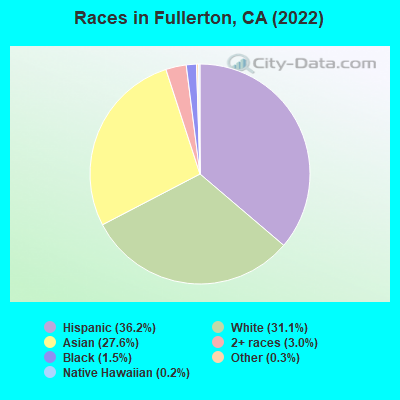
- 50,83036.2%Hispanic
- 43,74131.1%White alone
- 38,79827.6%Asian alone
- 4,2243.0%Two or more races
- 2,0701.5%Black alone
- 4700.3%Other race alone
- 3200.2%Native Hawaiian and Other
Pacific Islander alone - 990.07%American Indian alone
According to our research of California and other state lists, there were 115 registered sex offenders living in Fullerton, California as of June 15, 2024.
The ratio of all residents to sex offenders in Fullerton is 1,224 to 1.
The ratio of registered sex offenders to all residents in this city is lower than the state average.
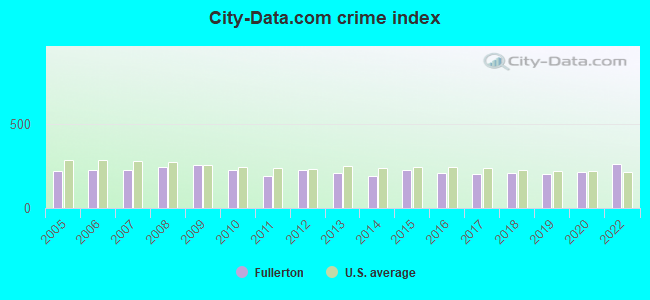
The City-Data.com crime index weighs serious crimes and violent crimes more heavily. Higher means more crime, U.S. average is 246.1. It adjusts for the number of visitors and daily workers commuting into cities.
- means the value is smaller than the state average.- means the value is about the same as the state average.
- means the value is bigger than the state average.
- means the value is much bigger than the state average.
Crime rate in Fullerton detailed stats: murders, rapes, robberies, assaults, burglaries, thefts, arson
Full-time law enforcement employees in 2021, including police officers: 169 (114 officers - 100 male; 14 female).
| Officers per 1,000 residents here: | 0.81 |
| California average: | 2.30 |
 Recent articles from our blog. Our writers, many of them Ph.D. graduates or candidates, create easy-to-read articles on a wide variety of topics.

 | Fullerton vs Yorba Linda? (4 replies) |
| How is the Fullerton area? (2 replies) |
| Fullerton/Brea home owners (9 replies) |
| Save the Fullerton Arboretum (0 replies) |
| Commute from Fullerton or Yorba Linda to Rosemead (1 reply) |
| Fullerton Schools (0 replies) |
Latest news from Fullerton, CA collected exclusively by city-data.com from local newspapers, TV, and radio stations
Fullerton, CA City Guides:
Ancestries: American (3.7%), English (3.0%), Irish (2.8%), German (2.4%), European (1.8%), Italian (1.3%).
Current Local Time: PST time zone
Elevation: 155 feet
Land area: 22.2 square miles.
Population density: 6,331 people per square mile (high).
41,817 residents are foreign born (16.0% Asia, 10.8% Latin America).
| This city: | 29.6% |
| California: | 26.5% |
Median real estate property taxes paid for housing units with mortgages in 2022: $6,136 (0.7%)
Median real estate property taxes paid for housing units with no mortgage in 2022: $4,107 (0.5%)
Nearest city with pop. 200,000+: Anaheim, CA  (3.8 miles , pop. 328,014).
Nearest city with pop. 1,000,000+: Los Angeles, CA (29.4 miles , pop. 3,694,820).
Nearest cities:
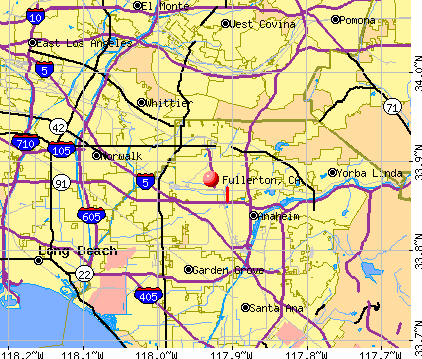
), )Latitude: 33.88 N, Longitude: 117.93 W
Daytime population change due to commuting: -4,899 (-3.5%)
Workers who live and work in this city: 19,669 (28.1%)
Area code: 714
Fullerton, California accommodation & food services, waste management - Economy and Business Data
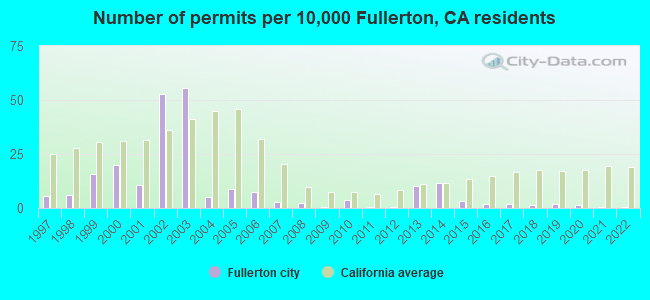
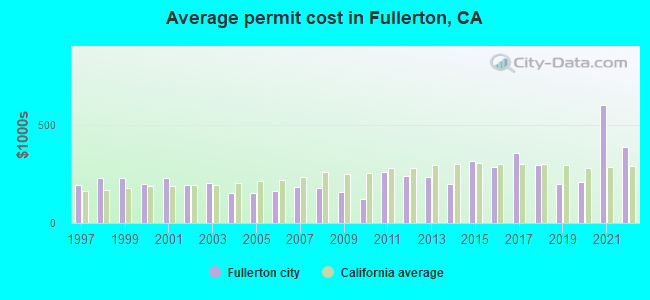
Single-family new house construction building permits:
- 2022: 3 buildings, average cost: $388,500
- 2021: 7 buildings, average cost: $602,500
- 2020: 19 buildings, average cost: $206,800
- 2019: 23 buildings, average cost: $197,600
- 2018: 19 buildings, average cost: $296,200
- 2017: 21 buildings, average cost: $358,100
- 2016: 25 buildings, average cost: $288,000
- 2015: 40 buildings, average cost: $313,500
- 2014: 147 buildings, average cost: $200,200
- 2013: 127 buildings, average cost: $233,700
- 2012: 6 buildings, average cost: $241,400
- 2011: 7 buildings, average cost: $258,200
- 2010: 48 buildings, average cost: $120,000
- 2009: 4 buildings, average cost: $157,900
- 2008: 31 buildings, average cost: $177,700
- 2007: 35 buildings, average cost: $186,400
- 2006: 91 buildings, average cost: $162,400
- 2005: 108 buildings, average cost: $154,000
- 2004: 64 buildings, average cost: $155,100
- 2003: 698 buildings, average cost: $204,300
- 2002: 664 buildings, average cost: $196,300
- 2001: 137 buildings, average cost: $228,100
- 2000: 248 buildings, average cost: $199,700
- 1999: 199 buildings, average cost: $231,100
- 1998: 78 buildings, average cost: $228,000
- 1997: 68 buildings, average cost: $195,900
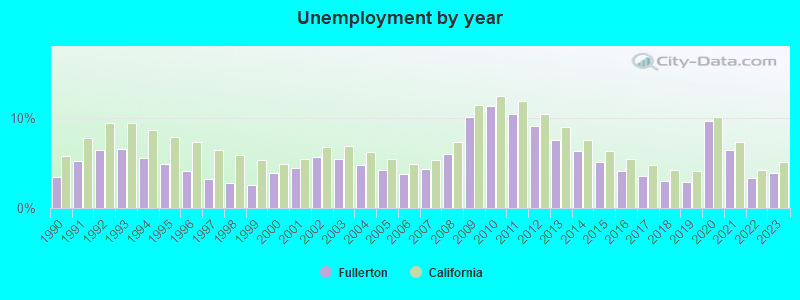
| Here: | 3.9% |
| California: | 5.1% |
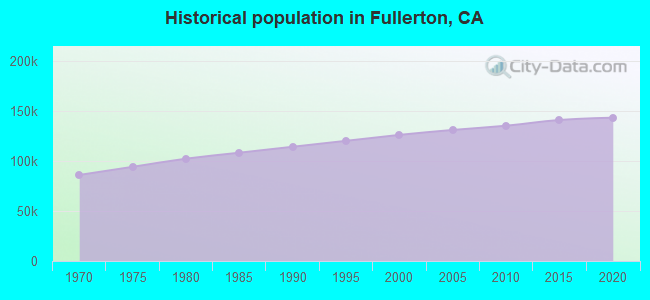
Population change in the 1990s: +12,260 (+10.8%).
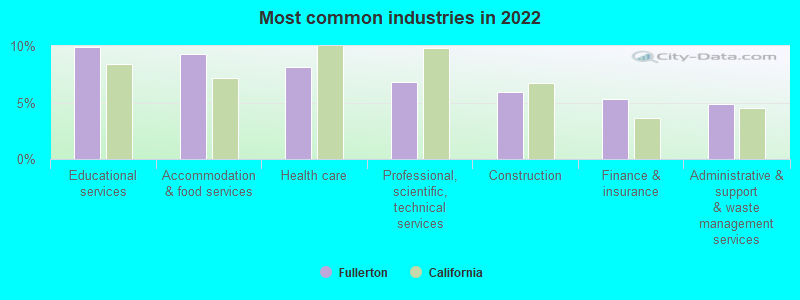
- Educational services (9.9%)
- Accommodation & food services (9.3%)
- Health care (8.1%)
- Professional, scientific, technical services (6.8%)
- Construction (6.0%)
- Finance & insurance (5.3%)
- Administrative & support & waste management services (4.9%)
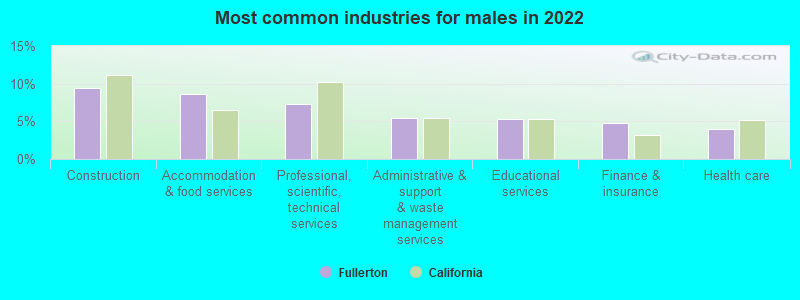
- Construction (9.4%)
- Accommodation & food services (8.7%)
- Professional, scientific, technical services (7.2%)
- Administrative & support & waste management services (5.4%)
- Educational services (5.3%)
- Finance & insurance (4.7%)
- Health care (4.0%)
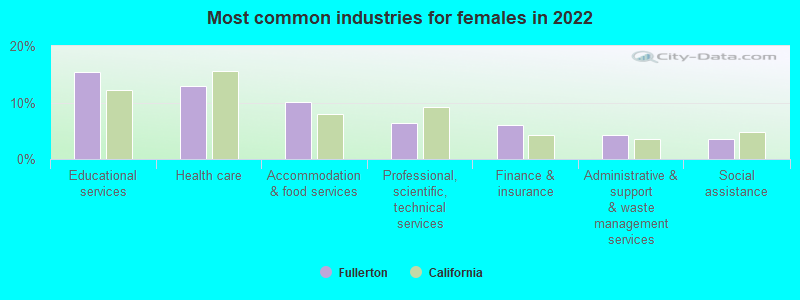
- Educational services (15.5%)
- Health care (12.9%)
- Accommodation & food services (10.1%)
- Professional, scientific, technical services (6.4%)
- Finance & insurance (6.0%)
- Administrative & support & waste management services (4.2%)
- Social assistance (3.6%)
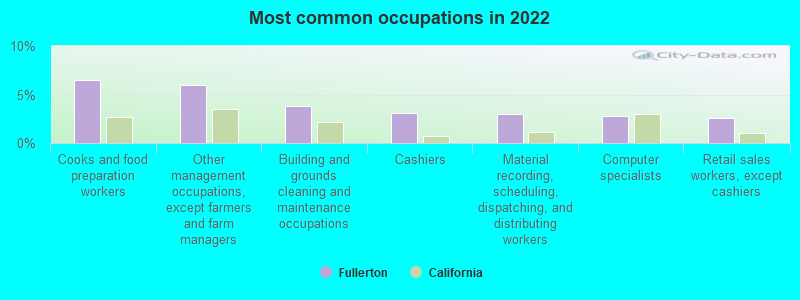
- Cooks and food preparation workers (6.5%)
- Other management occupations, except farmers and farm managers (5.9%)
- Building and grounds cleaning and maintenance occupations (3.8%)
- Cashiers (3.1%)
- Material recording, scheduling, dispatching, and distributing workers (3.0%)
- Computer specialists (2.8%)
- Retail sales workers, except cashiers (2.6%)
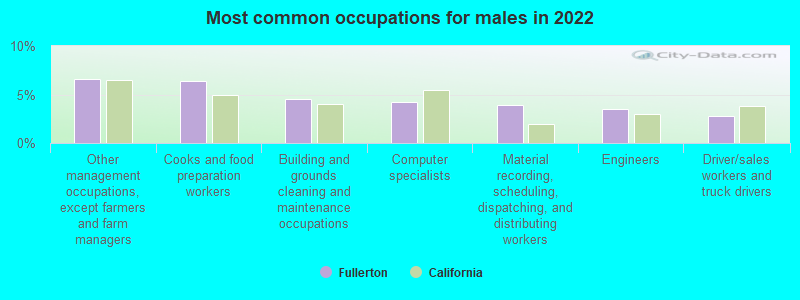
- Other management occupations, except farmers and farm managers (6.6%)
- Cooks and food preparation workers (6.4%)
- Building and grounds cleaning and maintenance occupations (4.6%)
- Computer specialists (4.2%)
- Material recording, scheduling, dispatching, and distributing workers (3.9%)
- Engineers (3.5%)
- Driver/sales workers and truck drivers (2.8%)
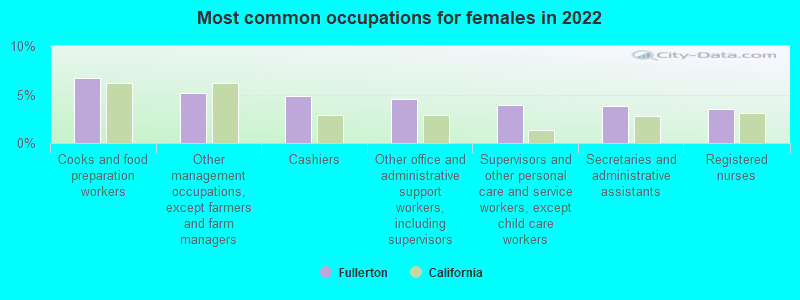
- Cooks and food preparation workers (6.7%)
- Other management occupations, except farmers and farm managers (5.2%)
- Cashiers (4.8%)
- Other office and administrative support workers, including supervisors (4.5%)
- Supervisors and other personal care and service workers, except child care workers (3.9%)
- Secretaries and administrative assistants (3.8%)
- Registered nurses (3.5%)
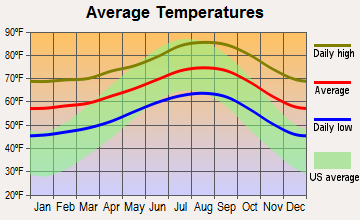
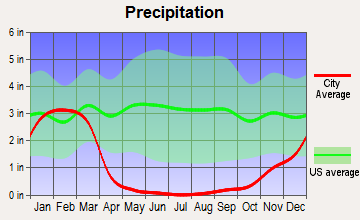
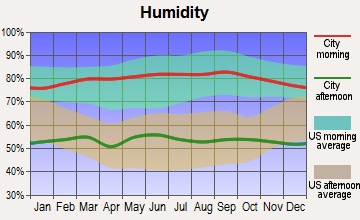
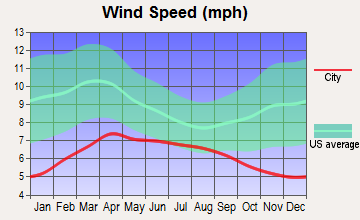
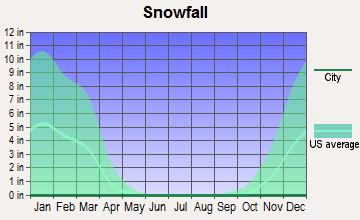
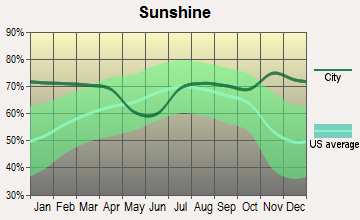
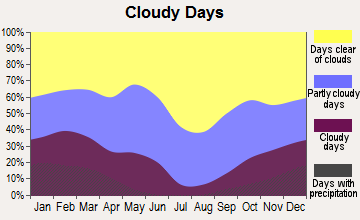
Average climate in Fullerton, California
Based on data reported by over 4,000 weather stations
|
|

(lower is better)
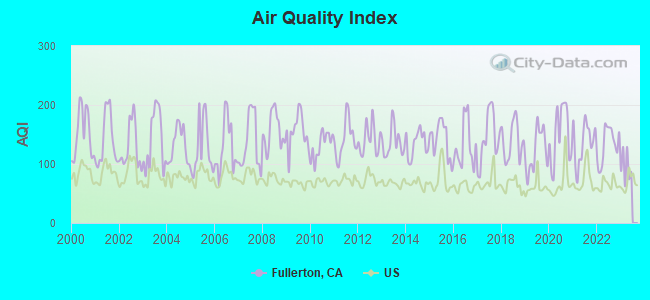
Air Quality Index (AQI) level in 2022 was 133. This is significantly worse than average.
| City: | 133 |
| U.S.: | 73 |
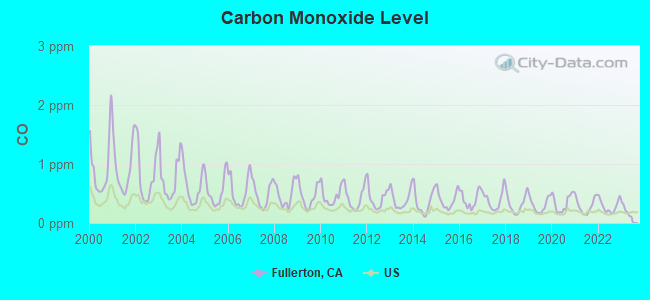
Carbon Monoxide (CO) [ppm] level in 2022 was 0.287. This is about average. Closest monitor was 3.4 miles away from the city center.
| City: | 0.287 |
| U.S.: | 0.251 |
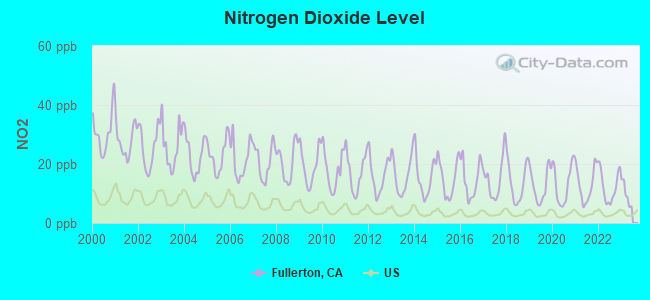
Nitrogen Dioxide (NO2) [ppb] level in 2022 was 12.4. This is significantly worse than average. Closest monitor was 3.4 miles away from the city center.
| City: | 12.4 |
| U.S.: | 5.1 |
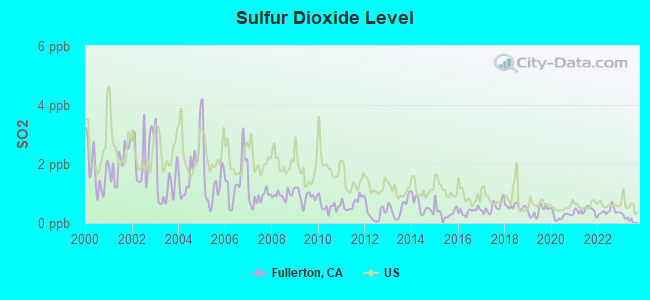
Sulfur Dioxide (SO2) [ppb] level in 2022 was 0.398. This is significantly better than average. Closest monitor was 3.4 miles away from the city center.
| City: | 0.398 |
| U.S.: | 1.515 |
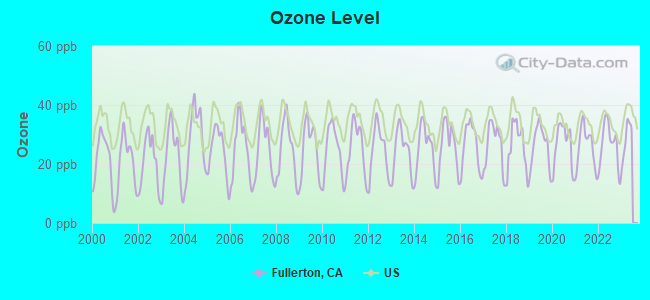
Ozone [ppb] level in 2022 was 26.6. This is better than average. Closest monitor was 3.4 miles away from the city center.
| City: | 26.6 |
| U.S.: | 33.3 |
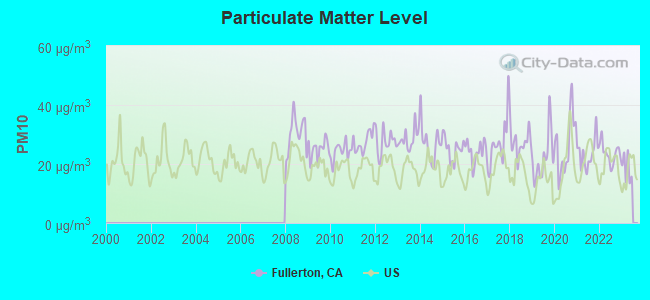
Particulate Matter (PM10) [µg/m3] level in 2022 was 23.6. This is worse than average. Closest monitor was 3.5 miles away from the city center.
| City: | 23.6 |
| U.S.: | 19.2 |
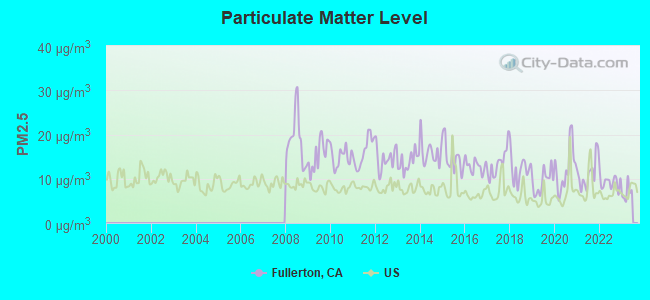
Particulate Matter (PM2.5) [µg/m3] level in 2022 was 9.21. This is about average. Closest monitor was 3.5 miles away from the city center.
| City: | 9.21 |
| U.S.: | 8.11 |
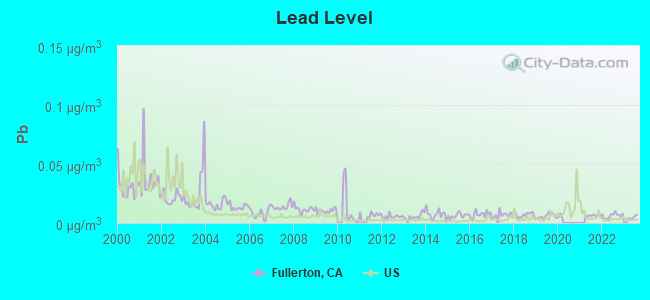
Lead (Pb) [µg/m3] level in 2022 was 0.00616. This is significantly better than average. Closest monitor was 3.4 miles away from the city center.
| City: | 0.00616 |
| U.S.: | 0.00931 |
Earthquake activity:
Fullerton-area historical earthquake activity is significantly above California state average. It is 6972% greater than the overall U.S. average.On 7/21/1952 at 11:52:14, a magnitude 7.7 (7.7 UK, Class: Major, Intensity: VIII - XII) earthquake occurred 98.7 miles away from Fullerton center, causing $50,000,000 total damage
On 6/28/1992 at 11:57:34, a magnitude 7.6 (6.2 MB, 7.6 MS, 7.3 MW, Depth: 0.7 mi) earthquake occurred 82.8 miles away from Fullerton center, causing 3 deaths (1 shaking deaths, 2 other deaths) and 400 injuries, causing $100,000,000 total damage and $40,000,000 insured losses
On 10/16/1999 at 09:46:44, a magnitude 7.4 (6.3 MB, 7.4 MS, 7.2 MW, 7.3 ML) earthquake occurred 96.1 miles away from Fullerton center
On 11/4/1927 at 13:51:53, a magnitude 7.5 (7.5 UK) earthquake occurred 191.0 miles away from the city center
On 4/21/1918 at 22:32:30, a magnitude 6.8 (6.8 UK, Class: Strong, Intensity: VII - IX) earthquake occurred 28.5 miles away from the city center
On 5/19/1940 at 04:36:40, a magnitude 7.2 (7.2 UK) earthquake occurred 136.5 miles away from the city center, causing $33,000,000 total damage
Magnitude types: body-wave magnitude (MB), local magnitude (ML), surface-wave magnitude (MS), moment magnitude (MW)
Natural disasters:
The number of natural disasters in Orange County (32) is a lot greater than the US average (15).Major Disasters (Presidential) Declared: 22
Emergencies Declared: 2
Causes of natural disasters: Floods: 15, Fires: 13, Storms: 9, Landslides: 6, Winter Storms: 6, Mudslides: 5, Earthquakes: 2, Heavy Rain: 1, Hurricane: 1, Snow: 1, Tornado: 1, Wind: 1, Other: 1 (Note: some incidents may be assigned to more than one category).
Main business address for: BECKMAN COULTER INC (LABORATORY ANALYTICAL INSTRUMENTS).
Hospitals in Fullerton:
- CARE MORE HOSPICE, INC (2495 E ORANGETHORPE AVENUE, SUITE 200)
- CRISTINA'S HOME (1455 WOODCREST AVENUE)
- FULLERTON COMM HOSP (provides emergency services, 100 E VALLEY VIEW DRIVE)
- FULLERTON OUTPATIENT SURGERY MED CTR (1835 SUNNYCREST DRIVE)
- IND OPTS-SHERWOOD HOUSE (2625 E SHERWOOD AVENUE)
- ST JUDE MEDICAL CENTER (Voluntary non-profit - Church, 101 E VALENCIA MESA DRIVE)
- WASHINGTON AVENUE HOME (604 WASHINGTON AVENUE)
Nursing Homes in Fullerton:
- FULLERTON POST ACUTE CARE (2222 N. HARBOR BLVD.)
- GORDON LANE CARE CENTER (1821 E CHAPMAN AVE)
- GREENFIELD CARE CENTER OF FULLERTON, LLC (330 W. BASTANCHURY ROAD)
- PARK VISTA AT MORNINGSIDE (2525 BREA BLVD.)
- ST ELIZABETH HEALTHCARE CENTER (2800 N. HARBOR BLVD.)
- TERRACE VIEW CARE CENTER (201 EAST BASTANCHURY)
- WINDSOR GARDENS CARE CENTER OF FULLERTON (245 E WILSHIRE AVENUE)
Dialysis Facilities in Fullerton:
Home Health Centers in Fullerton:
Airports located in Fullerton:
- Fullerton Municipal Airport (FUL) (Runways: 2, Air Taxi Ops: 14, Itinerant Ops: 40,478, Local Ops: 20,688)
Colleges/Universities in Fullerton:
- California State University-Fullerton (Full-time enrollment: 28,947; Location: 800 N State College Blvd; Public; Website: www.fullerton.edu; Offers Doctor's degree)
- Fullerton College (Full-time enrollment: 11,124; Location: 321 E Chapman Avenue; Public; Website: www.fullcoll.edu)
- Hope International University (Full-time enrollment: 1,027; Location: 2500 E Nutwood Ave; Private, not-for-profit; Website: www.hiu.edu; Offers Master's degree)
- Grace Mission University (Full-time enrollment: 121; Location: 1645 West Valencia Drive; Private, not-for-profit; Website: www.gm.edu; Offers Doctor's degree)
- Marshall B Ketchum University (Full-time enrollment: 4; Location: 2575 Yorba Linda Blvd; Private, not-for-profit; Website: www.ketchum.edu; Offers Doctor's degree)
- Western State College of Law at Argosy University (Location: 1111 N State College Blvd; Private, for-profit; Website: www.wsulaw.edu; Offers Doctor's degree)
Other colleges/universities with over 2000 students near Fullerton:
- West Coast University-Orange County (about 5 miles; Anaheim, CA; Full-time enrollment: 2,464)
- Biola University (about 6 miles; La Mirada, CA; FT enrollment: 5,325)
- Cypress College (about 7 miles; Cypress, CA; FT enrollment: 8,732)
- Chapman University (about 8 miles; Orange, CA; FT enrollment: 7,089)
- Trident University International (about 8 miles; Cypress, CA; FT enrollment: 5,974)
- Santa Ana College (about 9 miles; Santa Ana, CA; FT enrollment: 11,756)
- Hacienda La Puente Adult Education (about 10 miles; La Puente, CA; FT enrollment: 2,750)
Public high schools in Fullerton:
- TROY HIGH (Students: 1,901, Location: 2200 E. DOROTHY LN., Grades: 9-12)
- SUNNY HILLS HIGH (Students: 1,820, Location: 1801 WARBURTON WAY, Grades: 9-12)
- FULLERTON UNION HIGH (Students: 1,398, Location: 201 E. CHAPMAN AVE., Grades: 9-12)
- LA SIERRA HIGH (ALTERNATIVE) (Students: 324, Location: 951 N. STATE COLLEGE BLVD., Grades: 9-12)
- LA VISTA HIGH (CONTINUATION) (Students: 79, Location: 909 N. STATE COLLEGE BLVD., Grades: 9-12)
- ORANGE COUNTY CONSERVATION CORPS CHARTER (Location: 1548 E. WALNUT AVE., Grades: 9-12, Charter school)
Private high schools in Fullerton:
Biggest public elementary/middle schools in Fullerton:
- D. RUSSELL PARKS JUNIOR HIGH (Students: 974, Location: 1710 ROSECRANS AVE., Grades: 7-8)
- LADERA VISTA JUNIOR HIGH (Students: 911, Location: 1700 E. WILSHIRE DR., Grades: 7-8)
- NICOLAS JUNIOR HIGH (Students: 833, Location: 1100 W. OLIVE AVE., Grades: 7-8)
- ROBERT C. FISLER ELEMENTARY (Students: 681, Location: 1350 STARBUCK ST., Grades: KG-8)
- BEECHWOOD ELEMENTARY (Students: 583, Location: 780 BEECHWOOD AVE., Grades: KG-8)
- SUNSET LANE ELEMENTARY (Students: 532, Location: 2030 SUNSET LN., Grades: KG-6)
- ORANGETHORPE ELEMENTARY (Students: 528, Location: 1400 S. BROOKHURST RD., Grades: KG-6)
- RICHMAN ELEMENTARY (Students: 513, Location: 700 S. RICHMAN AVE., Grades: KG-6)
- GOLDEN HILL ELEMENTARY (Students: 505, Location: 732 BARRIS DR., Grades: KG-6)
- PACIFIC DRIVE ELEMENTARY (Students: 469, Location: 1501 W. VALENCIA DR., Grades: KG-6)
Private elementary/middle schools in Fullerton:
- ST JULIANA FALCONIERI SCHOOL (Students: 290, Location: 1320 N ACACIA AVE, Grades: KG-8)
- ANNUNCIATION CATHOLIC SCHOOL (Students: 141, Location: 215 S PINE DR, Grades: PK-8)
- ARBORLAND MONTESSORI & EDUCATION CENTER (Students: 113, Location: 2121 HUGHES DR, Grades: PK-6)
- ARBORLAND MONTESSORI CHILDREN'S ACADEMY (Students: 76, Location: 1700 W VALENCIA DR, Grades: PK-6)
- BERKELEY SCHOOL (Students: 19, Location: 306 N POMONA AVE, Grades: KG-6)
Library in Fullerton:
Points of interest:
Notable locations in Fullerton: Fullerton Arboretum (A), Fullerton Municipal Golf Course (B), Fullerton Union Pacific Depot (C), Hunt Public Library (D), Fullerton Public Library (E), Fullerton Museum Center (F), Fullerton City Hall (G), North Orange County Municipal Court (H), Muckenthaler Cultural Center (I), Loma Vista Mausoleum (J), Orange County Fire Authority Station 41 (K), University Hall (L), Titan Student Union (M), Titan House (N), Titan Gymnasium (O), Ruby Gerontology Center (P), Portola Pavilion (Q), Pollack Library (R), Nutwood Parking Structure (S), McCarthy Hall (T). Display/hide their locations on the map
Shopping Centers: Orange Fair Shopping Center (1), Sunrise Valley Shopping Center (2), La Mancha Shopping Center (3), Camino Del Sol Shopping Center (4), Metrocenter Fullerton Shopping Center (5), Fullerton Town Center Shopping Center (6), East Fullerton Shopping Center (7), College Plaza Shopping Center (8), West Fullerton Shopping Center (9). Display/hide their locations on the map
Churches in Fullerton include: California Martus Church (A), Church of Jesus Christ of Latter Day Saints (B), Dongshin Presbyterian Church (C), First Baptist Church of Fullerton (D), First Christian Church (E), First Church of Religious Science (F), First Presbyterian Church (G), Fullerton First Lutheran Church (H), Fullerton First United Methodist Church (I). Display/hide their locations on the map
Cemetery: Loma Vista Memorial Park (1). Display/hide its location on the map
Lakes and reservoirs: Laguna Lake (A), Fullerton Reservoir (B), Brea Reservoir (C). Display/hide their locations on the map
Parks in Fullerton include: Sherbeck Field (1), Goodwin Field (2), Adlena Park (3), Amerige Park (4), Chapman Park (5), Hillcrest Park (6), Hiltscher Park (7), San Juan Park (8), Simpson Park (9). Display/hide their locations on the map
Tourist attractions: California State University- Fullerton (Cultural Attractions- Events- & Facilities; PO Box 6850) (1), A M F Bowling Centers (Amusement & Theme Parks; 1501 South Lemon Street) (2), American Youth Hostel (1700 North Harbor Boulevard) (3), Carter Bowl Professional Shop (1501 South Lemon Street) (4). Display/hide their approximate locations on the map
Hotels: AKUA Motor Inn (1018 East Orangethorpe Avenue) (1), Ambassador Inn (2100 West Commonwealth Avenue) (2), Anaheim Park Hotel (222 W Houston Ave) (3). Display/hide their approximate locations on the map
Birthplace of: Nadya Suleman - Mother of octuplets, Gwen Stefani - (born 1969), singer-songwriter, Chris Norby - California State Assemblyman, Stacey Q - Singer, Janet Evans - Swimmer, Adam Snyder - 2005 NFL player (San Francisco 49ers, born: Jan 30, 1982), Skip Stellrecht - Film actor, James Harder - Professor of Engineering and UFOlogist, Jeff Soto - Artist, Travis Kirschke - 2005 NFL player (Pittsburgh Steelers, born: Sep 6, 1974).
| This city: | 2.9 people |
| California: | 2.9 people |
| This city: | 68.8% |
| Whole state: | 68.7% |
| This city: | 5.9% |
| Whole state: | 7.2% |
Likely homosexual households (counted as self-reported same-sex unmarried-partner households)
- Lesbian couples: 0.4% of all households
- Gay men: 0.3% of all households
People in group quarters in Fullerton in 2010:
- 1,231 people in college/university student housing
- 629 people in nursing facilities/skilled-nursing facilities
- 352 people in group homes intended for adults
- 341 people in emergency and transitional shelters (with sleeping facilities) for people experiencing homelessness
- 333 people in other noninstitutional facilities
- 121 people in residential treatment centers for juveniles (non-correctional)
- 31 people in workers' group living quarters and job corps centers
- 30 people in residential treatment centers for adults
- 9 people in group homes for juveniles (non-correctional)
People in group quarters in Fullerton in 2000:
- 876 people in college dormitories (includes college quarters off campus)
- 846 people in nursing homes
- 593 people in other noninstitutional group quarters
- 236 people in homes or halfway houses for drug/alcohol abuse
- 66 people in homes for the mentally retarded
- 49 people in other group homes
- 32 people in homes for the mentally ill
- 24 people in other nonhousehold living situations
- 22 people in residential treatment centers for emotionally disturbed children
- 16 people in homes for abused, dependent, and neglected children
- 10 people in religious group quarters
Banks with most branches in Fullerton (2011 data):
- Opus Bank: Fullerton Community Bank Branch, Fullerton Office, 2400 E Chapman Av Branch, 1805 W Orangethorpe Branch. Info updated 2011/11/08: Bank assets: $2,404.2 mil, Deposits: $1,831.2 mil, headquarters in Irvine, CA, negative income in the last year, Commercial Lending Specialization, 38 total offices
- JPMorgan Chase Bank, National Association: Harbor Blvd Branch, Fullerton Branch, Fullerton Branch, Orangethorpe Branch. Info updated 2011/11/10: Bank assets: $1,811,678.0 mil, Deposits: $1,190,738.0 mil, headquarters in Columbus, OH, positive income, International Specialization, 5577 total offices, Holding Company: Jpmorgan Chase & Co.
- Bank of America, National Association: Sunny Hills Branch, Fullerton Main Branch, Fullerton Metro Center, East Fullerton Branch. Info updated 2009/11/18: Bank assets: $1,451,969.3 mil, Deposits: $1,077,176.8 mil, headquarters in Charlotte, NC, positive income, 5782 total offices, Holding Company: Bank Of America Corporation
- U.S. Bank National Association: Fullerton Albertsons Branch, California State University Branch, Sunny Hills Branch, Fullerton Branch. Info updated 2012/01/30: Bank assets: $330,470.8 mil, Deposits: $236,091.5 mil, headquarters in Cincinnati, OH, positive income, 3121 total offices, Holding Company: U.S. Bancorp
- Wells Fargo Bank, National Association: Fullerton Branch, Fullerton Yorba Linda Branch, Ameriage Heights Branch. Info updated 2011/04/05: Bank assets: $1,161,490.0 mil, Deposits: $905,653.0 mil, headquarters in Sioux Falls, SD, positive income, 6395 total offices, Holding Company: Wells Fargo & Company
- Union Bank, National Association: Sunny Hills Branch, University Branch, Fullerton Branch. Info updated 2011/09/01: Bank assets: $88,967.5 mil, Deposits: $65,286.4 mil, headquarters in San Francisco, CA, positive income, Commercial Lending Specialization, 403 total offices, Holding Company: Mitsubishi Ufj Financial Group, Inc.
- Citibank, National Association: North Harbor Boulevard Branch at 320 North Harbor Boulevard, branch established on 1934/10/01. Info updated 2012/01/10: Bank assets: $1,288,658.0 mil, Deposits: $882,541.0 mil, headquarters in Sioux Falls, SD, positive income, International Specialization, 1048 total offices, Holding Company: Citigroup Inc.
- Citizens Business Bank: Fullerton Business Financial Center at 301 N. Harbor Blvd Suite 101, branch established on 1981/05/14. Info updated 2011/03/30: Bank assets: $6,475.4 mil, Deposits: $4,625.6 mil, headquarters in Ontario, CA, positive income, Commercial Lending Specialization, 46 total offices, Holding Company: Cvb Financial Corp.
- Farmers and Merchants Bank of Long Beach: West Fullerton Branch at 315 North Harbor Boulevard, branch established on 1971/11/01. Info updated 2006/11/03: Bank assets: $4,659.3 mil, Deposits: $3,393.5 mil, headquarters in Long Beach, CA, positive income, Commercial Lending Specialization, 22 total offices, Holding Company: Palomar Enterprises, Llc
- 3 other banks with 3 local branches
For population 15 years and over in Fullerton:
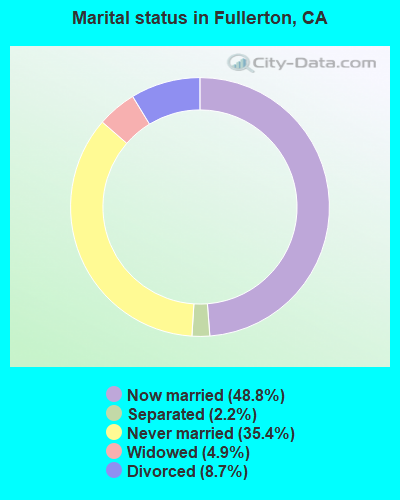
- Never married: 35.4%
- Now married: 48.8%
- Separated: 2.2%
- Widowed: 4.9%
- Divorced: 8.7%
For population 25 years and over in Fullerton:
- High school or higher: 87.6%
- Bachelor's degree or higher: 46.2%
- Graduate or professional degree: 17.7%
- Unemployed: 5.7%
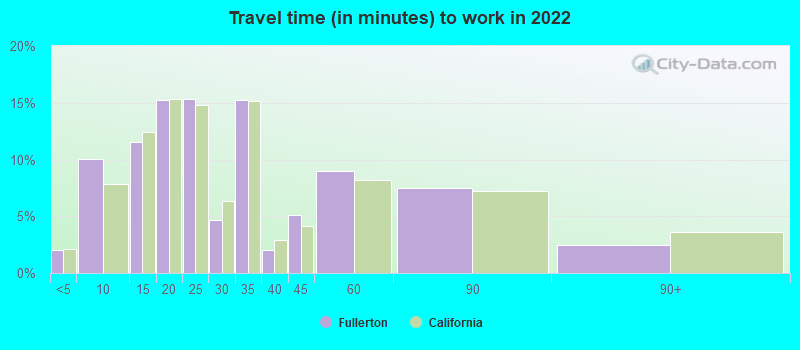
- Mean travel time to work (commute): 25.9 minutes

| Here: | 14.4 |
| California average: | 15.5 |


Graphs represent county-level data. Detailed 2008 Election Results
Religion statistics for Fullerton, CA (based on Orange County data)


| Religion | Adherents | Congregations |
|---|---|---|
| Catholic | 797,473 | 67 |
| Evangelical Protestant | 345,893 | 894 |
| Other | 141,815 | 329 |
| Mainline Protestant | 76,574 | 202 |
| Orthodox | 13,406 | 19 |
| Black Protestant | 2,424 | 8 |
| None | 1,632,647 | - |
Food Environment Statistics:
| This county: | 1.78 / 10,000 pop. |
| California: | 2.14 / 10,000 pop. |
| Here: | 0.06 / 10,000 pop. |
| State: | 0.04 / 10,000 pop. |
| Orange County: | 0.49 / 10,000 pop. |
| California: | 0.62 / 10,000 pop. |
| Here: | 1.46 / 10,000 pop. |
| California: | 1.49 / 10,000 pop. |
| Here: | 8.19 / 10,000 pop. |
| California: | 7.42 / 10,000 pop. |
| This county: | 6.3% |
| State: | 7.3% |
| This county: | 18.5% |
| California: | 21.3% |
| This county: | 16.4% |
| State: | 17.9% |
Health and Nutrition:
| Fullerton: | 50.7% |
| California: | 49.4% |
| Here: | 49.5% |
| State: | 48.0% |
| Fullerton: | 27.7 |
| California: | 28.1 |
| This city: | 19.0% |
| California: | 20.2% |
| Fullerton: | 11.9% |
| California: | 11.2% |
| This city: | 6.8 |
| California: | 6.8 |
| Here: | 30.8% |
| California: | 31.5% |
| Fullerton: | 57.8% |
| California: | 56.4% |
| This city: | 81.3% |
| California: | 80.9% |
More about Health and Nutrition of Fullerton, CA Residents
| Local government employment and payroll (March 2022) | |||||
| Function | Full-time employees | Monthly full-time payroll | Average yearly full-time wage | Part-time employees | Monthly part-time payroll |
|---|---|---|---|---|---|
| Police Protection - Officers | 121 | $1,481,698 | $146,945 | 12 | $19,681 |
| Firefighters | 67 | $908,995 | $162,805 | 1 | $979 |
| Streets and Highways | 55 | $311,461 | $67,955 | 2 | $3,924 |
| Water Supply | 41 | $235,797 | $69,014 | 1 | $1,594 |
| Police - Other | 40 | $271,237 | $81,371 | 2 | $3,625 |
| Financial Administration | 33 | $178,641 | $64,960 | 0 | $0 |
| Other and Unallocable | 27 | $157,622 | $70,054 | 1 | $2,385 |
| Housing and Community Development (Local) | 22 | $166,302 | $90,710 | 6 | $33,356 |
| Local Libraries | 16 | $85,168 | $63,876 | 8 | $8,244 |
| Sewerage | 14 | $78,065 | $66,913 | 1 | $2,905 |
| Other Government Administration | 13 | $85,425 | $78,854 | 10 | $32,696 |
| Parks and Recreation | 12 | $70,144 | $70,144 | 36 | $51,396 |
| Airports | 6 | $31,983 | $63,966 | 0 | $0 |
| Fire - Other | 1 | $8,928 | $107,136 | 3 | $1,701 |
| Totals for Government | 468 | $4,071,466 | $104,397 | 83 | $162,485 |
Fullerton government finances - Expenditure in 2021 (per resident):
- Construction - Regular Highways: $14,227,000 ($101.23)
General - Other: $556,000 ($3.96)
Housing and Community Development: $488,000 ($3.47)
Police Protection: $380,000 ($2.70)
Parks and Recreation: $152,000 ($1.08)
Sewerage: $102,000 ($0.73)
Health - Other: $87,000 ($0.62)
Miscellaneous Commercial Activities - Other: $85,000 ($0.60)
Central Staff Services: $76,000 ($0.54)
Hospitals: $74,000 ($0.53)
Solid Waste Management: $70,000 ($0.50)
Air Transportation: $68,000 ($0.48)
Parking Facilities: $61,000 ($0.43)
Transit Utilities: $53,000 ($0.38)
Gas Utilities: $48,000 ($0.34)
Electric Utilities: $47,000 ($0.33)
Public Welfare - Other: $47,000 ($0.33)
Water Utilities: $45,000 ($0.32)
General Public Buildings: $43,000 ($0.31)
Judicial and Legal Services: $42,000 ($0.30)
Financial Administration: $40,000 ($0.28)
Libraries: $27,000 ($0.19)
Protective Inspection and Regulation - Other: $15,000 ($0.11)
Local Fire Protection: $5,000 ($0.04)
Natural Resources - Other: $4,000 ($0.03)
Correctional Institutions: $2,000 ($0.01)
- Current Operations - Police Protection: $48,785,000 ($347.12)
Water Utilities: $30,268,000 ($215.37)
General - Other: $29,976,000 ($213.29)
Local Fire Protection: $24,185,000 ($172.09)
Solid Waste Management: $18,822,000 ($133.93)
Central Staff Services: $10,464,000 ($74.46)
Parks and Recreation: $7,452,000 ($53.02)
Regular Highways: $6,654,000 ($47.35)
Protective Inspection and Regulation - Other: $5,104,000 ($36.32)
Libraries: $3,760,000 ($26.75)
Housing and Community Development: $2,886,000 ($20.53)
Sewerage: $2,633,000 ($18.73)
Air Transportation: $1,452,000 ($10.33)
Judicial and Legal Services: $500,000 ($3.56)
Gas Utilities: $169,000 ($1.20)
Transit Utilities: $101,000 ($0.72)
Financial Administration: $100,000 ($0.71)
Parking Facilities: $96,000 ($0.68)
- General - Interest on Debt: $2,117,000 ($15.06)
- Other Capital Outlay - General - Other: $283,000 ($2.01)
Parks and Recreation: $153,000 ($1.09)
Sewerage: $102,000 ($0.73)
Housing and Community Development: $91,000 ($0.65)
Health - Other: $88,000 ($0.63)
Miscellaneous Commercial Activities - Other: $85,000 ($0.60)
Central Staff Services: $76,000 ($0.54)
Hospitals: $74,000 ($0.53)
Regular Highways: $70,000 ($0.50)
Solid Waste Management: $70,000 ($0.50)
Air Transportation: $68,000 ($0.48)
Parking Facilities: $61,000 ($0.43)
Transit Utilities: $53,000 ($0.38)
Gas Utilities: $48,000 ($0.34)
Electric Utilities: $47,000 ($0.33)
Public Welfare - Other: $47,000 ($0.33)
Water Utilities: $45,000 ($0.32)
General Public Building: $43,000 ($0.31)
Judicial and Legal Services: $42,000 ($0.30)
Financial Administration: $40,000 ($0.28)
Libraries: $27,000 ($0.19)
Protective Inspection and Regulation - Other: $15,000 ($0.11)
Local Fire Protection: $5,000 ($0.04)
Natural Resources - Other: $4,000 ($0.03)
Correctional Institutions: $2,000 ($0.01)
Police Protection: $1,000 ($0.01)
- Water Utilities - Interest on Debt: $227,000 ($1.62)
Fullerton government finances - Revenue in 2021 (per resident):
- Charges - Other: $36,524,000 ($259.88)
Sewerage: $6,182,000 ($43.99)
Parks and Recreation: $4,423,000 ($31.47)
Air Transportation: $1,824,000 ($12.98)
Solid Waste Management: $972,000 ($6.92)
Natural Resources - Other: $1,000 ($0.01)
- Federal Intergovernmental - Housing and Community Development: $1,373,000 ($9.77)
Other: $681,000 ($4.85)
Water Utilities: $290,000 ($2.06)
Air Transportation: $258,000 ($1.84)
- Local Intergovernmental - Other: $4,302,000 ($30.61)
- Miscellaneous - General Revenue - Other: $3,495,000 ($24.87)
Rents: $2,427,000 ($17.27)
Interest Earnings: $1,350,000 ($9.61)
Fines and Forfeits: $1,014,000 ($7.21)
Special Assessments: $448,000 ($3.19)
Donations From Private Sources: $444,000 ($3.16)
- Revenue - Water Utilities: $43,858,000 ($312.07)
Gas Utilities: $169,000 ($1.20)
- State Intergovernmental - Other: $6,448,000 ($45.88)
Highways: $5,592,000 ($39.79)
Water Utilities: $689,000 ($4.90)
General Local Government Support: $138,000 ($0.98)
- Tax - Property: $50,011,000 ($355.85)
General Sales and Gross Receipts: $31,962,000 ($227.42)
Public Utilities Sales: $4,382,000 ($31.18)
Other License: $2,850,000 ($20.28)
Other Selective Sales: $1,330,000 ($9.46)
Occupation and Business License - Other: $1,126,000 ($8.01)
Documentary and Stock Transfer: $931,000 ($6.62)
Other: $7,000 ($0.05)
Fullerton government finances - Debt in 2021 (per resident):
- Long Term Debt - Beginning Outstanding - Unspecified Public Purpose: $89,316,000 ($635.52)
Retired Unspecified Public Purpose: $50,376,000 ($358.44)
Outstanding Unspecified Public Purpose: $43,976,000 ($312.91)
Issue, Unspecified Public Purpose: $5,035,000 ($35.83)
Outstanding Nonguaranteed - Industrial Revenue: $269,000 ($1.91)
Beginning Outstanding - Public Debt for Private Purpose: $269,000 ($1.91)
Fullerton government finances - Cash and Securities in 2021 (per resident):
- Bond Funds - Cash and Securities: $7,638,000 ($54.35)
- Other Funds - Cash and Securities: $89,720,000 ($638.39)
- Sinking Funds - Cash and Securities: $9,123,000 ($64.91)
4.86% of this county's 2021 resident taxpayers lived in other counties in 2020 ($95,983 average adjusted gross income)
| Here: | 4.86% |
| California average: | 5.19% |
0.01% of residents moved from foreign countries ($132 average AGI)
Orange County: 0.01% California average: 0.03%
Top counties from which taxpayers relocated into this county between 2020 and 2021:
| from Los Angeles County, CA | |
| from Riverside County, CA | |
| from San Diego County, CA |
5.71% of this county's 2020 resident taxpayers moved to other counties in 2021 ($106,828 average adjusted gross income)
| Here: | 5.71% |
| California average: | 6.14% |
0.01% of residents moved to foreign countries ($180 average AGI)
Orange County: 0.01% California average: 0.02%
Top counties to which taxpayers relocated from this county between 2020 and 2021:
| to Los Angeles County, CA | |
| to Riverside County, CA | |
| to San Diego County, CA |
| Businesses in Fullerton, CA | ||||
| Name | Count | Name | Count | |
|---|---|---|---|---|
| 7-Eleven | 6 | Jack In The Box | 6 | |
| 99 Cents Only Stores | 2 | Jamba Juice | 1 | |
| AMF Bowling | 1 | Jones New York | 4 | |
| AT&T | 1 | KFC | 3 | |
| Ace Hardware | 1 | Kohl's | 1 | |
| Albertsons | 4 | Kroger | 3 | |
| AutoZone | 4 | LA Fitness | 1 | |
| Avenue | 1 | Little Caesars Pizza | 2 | |
| Baja Fresh Mexican Grill | 1 | Marriott | 1 | |
| Bally Total Fitness | 1 | Marshalls | 1 | |
| Barnes & Noble | 1 | MasterBrand Cabinets | 12 | |
| Baskin-Robbins | 2 | McDonald's | 3 | |
| Bath & Body Works | 1 | Nike | 9 | |
| Big O Tires | 1 | Office Depot | 2 | |
| Blockbuster | 1 | Old Navy | 1 | |
| Burger King | 2 | Panda Express | 2 | |
| Burlington Coat Factory | 1 | Panera Bread | 2 | |
| CVS | 5 | Papa John's Pizza | 2 | |
| Carl\s Jr. | 5 | Payless | 3 | |
| Casual Male XL | 1 | PetSmart | 1 | |
| Catherines | 1 | Pizza Hut | 1 | |
| Chipotle | 1 | Quiznos | 2 | |
| Chuck E. Cheese's | 1 | RadioShack | 2 | |
| Circle K | 3 | Rite Aid | 3 | |
| Cold Stone Creamery | 1 | Sam's Club | 1 | |
| Costco | 1 | Skechers USA | 1 | |
| Curves | 1 | Sprint Nextel | 1 | |
| DHL | 3 | Staples | 1 | |
| Decora Cabinetry | 3 | Starbucks | 10 | |
| Dennys | 2 | Subaru | 1 | |
| Discount Tire | 1 | Subway | 11 | |
| Domino's Pizza | 2 | Taco Bell | 5 | |
| El Pollo Loco | 3 | Target | 3 | |
| FedEx | 13 | Toys"R"Us | 1 | |
| Firestone Complete Auto Care | 1 | U-Haul | 3 | |
| GNC | 3 | UPS | 16 | |
| GameStop | 3 | Vans | 1 | |
| H&R Block | 3 | Verizon Wireless | 2 | |
| Holiday Inn | 2 | Walgreens | 2 | |
| Home Depot | 1 | Wendy's | 1 | |
| IHOP | 1 | YMCA | 1 | |
Strongest AM radio stations in Fullerton:
- KFI (640 AM; 50 kW; LOS ANGELES, CA; Owner: CAPSTAR TX LIMITED PARTNERSHIP)
- KTNQ (1020 AM; 50 kW; LOS ANGELES, CA; Owner: KTNQ-AM LICENSE CORP.)
- KXTA (1150 AM; 50 kW; LOS ANGELES, CA; Owner: CITICASTERS LICENSES, L.P.)
- KLAC (570 AM; 50 kW; LOS ANGELES, CA; Owner: AMFM RADIO LICENSES, L.L.C.)
- KPLS (830 AM; 50 kW; ORANGE, CA; Owner: CRN LICENSES, LLC)
- KDIS (1110 AM; 50 kW; PASADENA, CA; Owner: ABC,INC.)
- KFWB (980 AM; 50 kW; LOS ANGELES, CA; Owner: INFINITY BROADCASTING OPERATIONS, INC.)
- KMPC (1540 AM; 50 kW; LOS ANGELES, CA; Owner: ROSE CITY RADIO CORPORATION)
- KNX (1070 AM; 50 kW; LOS ANGELES, CA; Owner: INFINITY BROADCASTING OPERATIONS, INC.)
- KALI (900 AM; 6 kW; WEST COVINA, CA; Owner: MULTICULTURAL RADIO BROADCASTING, INC.)
- KBLA (1580 AM; 50 kW; SANTA MONICA, CA)
- KSPN (710 AM; 50 kW; LOS ANGELES, CA; Owner: KABC-AM RADIO, INC.)
- KXMX (1190 AM; 25 kW; ANAHEIM, CA; Owner: NEW INSPIRATION BROADCASTING COMPANY)
Strongest FM radio stations in Fullerton:
- KCBS-FM (93.1 FM; LOS ANGELES, CA; Owner: INFINITY BROADCASTING OPERATIONS, INC.)
- KZLA-FM (93.9 FM; LOS ANGELES, CA; Owner: EMMIS RADIO LICENSE CORPORATION)
- KSCA (101.9 FM; GLENDALE, CA; Owner: HBC LICENSE CORPORATION)
- KLOS (95.5 FM; LOS ANGELES, CA; Owner: KLOS-FM RADIO, INC.)
- K212FA (90.3 FM; TEMPLE CITY, CA; Owner: EDUCATIONAL MEDIA FOUNDATION)
- KOST (103.5 FM; LOS ANGELES, CA; Owner: CAPSTAR TX LIMITED PARTNERSHIP)
- KPWR (105.9 FM; LOS ANGELES, CA; Owner: EMMIS RADIO LICENSE CORPORATION)
- KLSX (97.1 FM; LOS ANGELES, CA; Owner: INFINITY BROADCASTING OPERATIONS, INC.)
- KUSC (91.5 FM; LOS ANGELES, CA; Owner: UNIVERSITY OF SOUTHERN CALIFORNIA)
- KIIS-FM (102.7 FM; LOS ANGELES, CA; Owner: CITICASTERS LICENSES, L.P.)
- KLVE (107.5 FM; LOS ANGELES, CA; Owner: KLVE-FM LICENSE CORP.)
- KKLA-FM (99.5 FM; LOS ANGELES, CA; Owner: NEW INSPIRATION BROADCASTING CO., INC.)
- KPCC (89.3 FM; PASADENA, CA; Owner: PASADENA AREA COMMUNITY COLLEGE DISTRICT)
- KHHT (92.3 FM; LOS ANGELES, CA; Owner: AMFM RADIO LICENSES, L.L.C.)
- KBIG-FM (104.3 FM; LOS ANGELES, CA; Owner: AMFM RADIO LICENSES, L.L.C.)
- KTWV (94.7 FM; LOS ANGELES, CA; Owner: INFINITY BROADCASTING OPERATIONS, INC.)
- KMZT-FM (105.1 FM; LOS ANGELES, CA; Owner: MOUNT WILSON FM BROADCASTERS, INC.)
- KPFK (90.7 FM; LOS ANGELES, CA; Owner: PACIFICA FOUNDATION, INC)
- K216EM (91.1 FM; ARCADIA, CA; Owner: LIFE ON THE WAY COMMUNICATIONS, INC.)
- KRTH-FM (101.1 FM; LOS ANGELES, CA; Owner: INFINITY BROADCASTING OPERATIONS, INC.)
TV broadcast stations around Fullerton:
- KTRO-LP (Channel 50; LANCASTER, CA; Owner: ROBERT D. ADELMAN)
- KCBS-TV (Channel 2; LOS ANGELES, CA; Owner: CBS BROADCASTING INC.)
- KHIZ (Channel 64; BARSTOW, CA; Owner: SUNBELT TELEVISION, INC.)
- KTLA-TV (Channel 5; LOS ANGELES, CA; Owner: KTLA INC.)
- KABC-TV (Channel 7; LOS ANGELES, CA; Owner: ABC HOLDING COMPANY, INC.)
- KCAL-TV (Channel 9; LOS ANGELES, CA; Owner: VIACOM TELEVISION STATIONS GROUP OF LOS ANGELES LLC)
- KNBC (Channel 4; LOS ANGELES, CA; Owner: NBC SUBSIDIARY (KNBC-TV), INC.)
- KMEX-TV (Channel 34; LOS ANGELES, CA; Owner: KMEX LICENSE PARTNERSHIP, G.P.)
- KAZA-TV (Channel 54; AVALON, CA; Owner: PAPPAS SOUTHERN CALIFORNIA LICENSE LLC)
- KDOC-TV (Channel 56; ANAHEIM, CA; Owner: GOLDEN ORANGE BROADCASTING CO., INC.)
- KOCE-TV (Channel 50; HUNTINGTON BEACH, CA; Owner: BD. OF TRUSTEES, COAST COMMUNITY COLLEGE DIST.)
- KSCI (Channel 18; LONG BEACH, CA; Owner: KSLS, INC.)
- KXLA (Channel 44; RANCHO PALOS VERDES, CA; Owner: RANCHO PALOS VERDES BROADCASTERS, INC.)
- KCET (Channel 28; LOS ANGELES, CA; Owner: COMMUNITY TELEVISION OF SOUTHERN CALIFORNIA)
- KFTR (Channel 46; ONTARIO, CA; Owner: TELEFUTURA LOS ANGELES LLC)
- National Bridge Inventory (NBI) Statistics
- 99Number of bridges
- 1,358ft / 414mTotal length
- $1,652,000Total costs
- 4,989,788Total average daily traffic
- 223,359Total average daily truck traffic
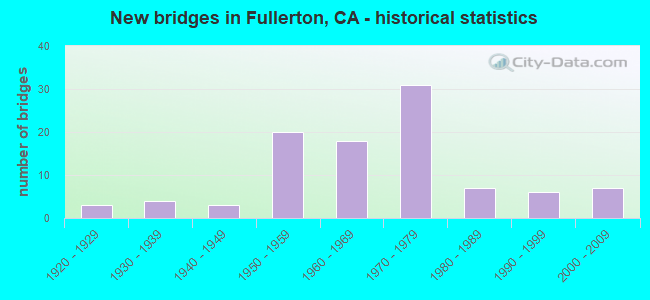
- New bridges - historical statistics
- 31920-1929
- 41930-1939
- 31940-1949
- 201950-1959
- 181960-1969
- 311970-1979
- 71980-1989
- 61990-1999
- 72000-2009
FCC Registered Private Land Mobile Towers: 5 (See the full list of FCC Registered Private Land Mobile Towers in Fullerton, CA)
FCC Registered Broadcast Land Mobile Towers: 64 (See the full list of FCC Registered Broadcast Land Mobile Towers)
FCC Registered Microwave Towers: 59 (See the full list of FCC Registered Microwave Towers in this town)
FCC Registered Paging Towers: 7 (See the full list of FCC Registered Paging Towers)
FCC Registered Maritime Coast & Aviation Ground Towers: 5 (See the full list of FCC Registered Maritime Coast & Aviation Ground Towers)
FCC Registered Amateur Radio Licenses: 1,350 (See the full list of FCC Registered Amateur Radio Licenses in Fullerton)
FAA Registered Aircraft Manufacturers and Dealers: 6 (See the full list of FAA Registered Manufacturers and Dealers in Fullerton)
FAA Registered Aircraft: 98 (See the full list of FAA Registered Aircraft)
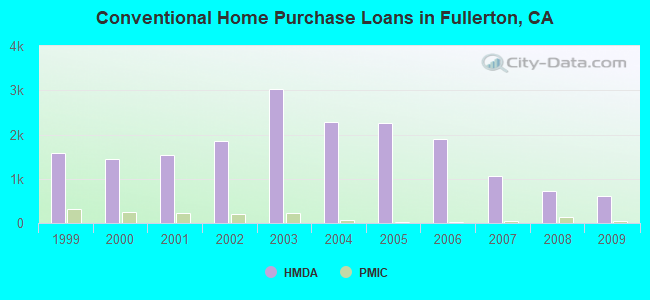
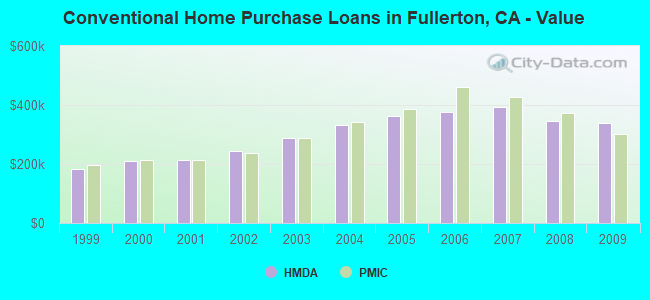
| Home Mortgage Disclosure Act Aggregated Statistics For Year 2009 (Based on 21 full and 11 partial tracts) | ||||||||||||||
| A) FHA, FSA/RHS & VA Home Purchase Loans | B) Conventional Home Purchase Loans | C) Refinancings | D) Home Improvement Loans | E) Loans on Dwellings For 5+ Families | F) Non-occupant Loans on < 5 Family Dwellings (A B C & D) | G) Loans On Manufactured Home Dwelling (A B C & D) | ||||||||
|---|---|---|---|---|---|---|---|---|---|---|---|---|---|---|
| Number | Average Value | Number | Average Value | Number | Average Value | Number | Average Value | Number | Average Value | Number | Average Value | Number | Average Value | |
| LOANS ORIGINATED | 299 | $334,571 | 605 | $339,600 | 2,367 | $321,888 | 107 | $251,326 | 15 | $8,424,274 | 155 | $261,709 | 17 | $157,845 |
| APPLICATIONS APPROVED, NOT ACCEPTED | 27 | $315,790 | 76 | $313,168 | 272 | $356,519 | 19 | $138,084 | 0 | $0 | 24 | $260,402 | 4 | $146,632 |
| APPLICATIONS DENIED | 71 | $323,963 | 146 | $311,551 | 711 | $348,999 | 37 | $174,708 | 2 | $820,000 | 65 | $245,300 | 15 | $129,335 |
| APPLICATIONS WITHDRAWN | 50 | $332,970 | 123 | $335,132 | 441 | $341,173 | 19 | $217,819 | 0 | $0 | 45 | $258,543 | 0 | $0 |
| FILES CLOSED FOR INCOMPLETENESS | 15 | $386,481 | 31 | $351,536 | 134 | $357,571 | 8 | $238,244 | 2 | $710,545 | 12 | $241,552 | 2 | $73,325 |
Detailed mortgage data for all 32 tracts in Fullerton, CA
| Private Mortgage Insurance Companies Aggregated Statistics For Year 2009 (Based on 19 full and 11 partial tracts) | ||||||
| A) Conventional Home Purchase Loans | B) Refinancings | C) Non-occupant Loans on < 5 Family Dwellings (A & B) | ||||
|---|---|---|---|---|---|---|
| Number | Average Value | Number | Average Value | Number | Average Value | |
| LOANS ORIGINATED | 51 | $303,121 | 7 | $373,564 | 0 | $0 |
| APPLICATIONS APPROVED, NOT ACCEPTED | 20 | $382,246 | 13 | $376,131 | 0 | $0 |
| APPLICATIONS DENIED | 15 | $367,089 | 6 | $389,235 | 0 | $0 |
| APPLICATIONS WITHDRAWN | 2 | $452,280 | 3 | $486,080 | 0 | $0 |
| FILES CLOSED FOR INCOMPLETENESS | 3 | $330,317 | 0 | $0 | 1 | $180,950 |
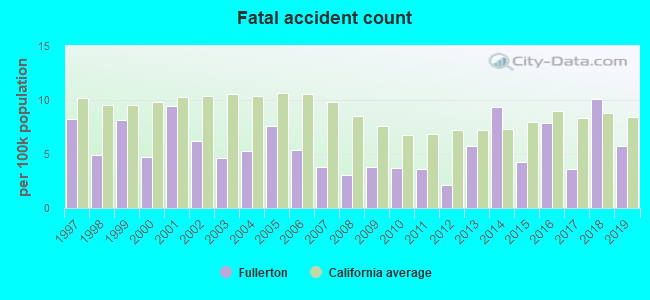
2005 - 2018 National Fire Incident Reporting System (NFIRS) incidents
- Fire incident types reported to NFIRS in Fullerton, CA
- 83142.1%Outside Fires
- 60930.9%Structure Fires
- 33416.9%Mobile Property/Vehicle Fires
- 19810.0%Other
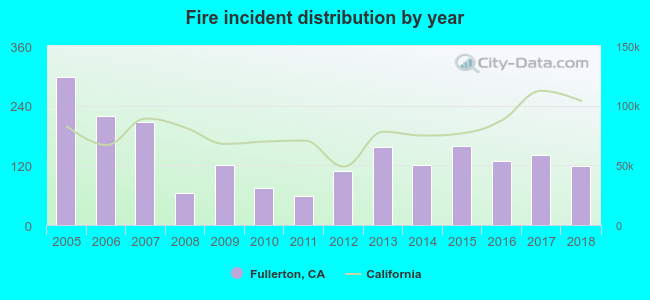 According to the data from the years 2005 - 2018 the average number of fires per year is 141. The highest number of fire incidents - 297 took place in 2005, and the least - 59 in 2011. The data has a dropping trend.
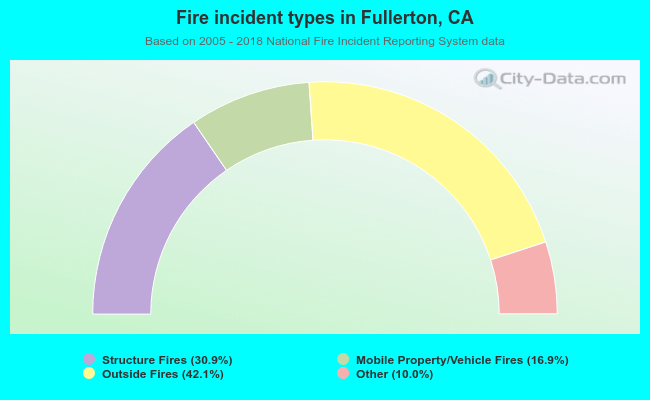 When looking into fire subcategories, the most reports belonged to: Outside Fires (42.1%), and Structure Fires (30.9%).
Fire-safe hotels and motels in Fullerton, California:
- Anaheim Park Hotel, 222 W Houston Ave, Fullerton, California 92832 , Phone: (714) 992-1700, Fax: (714) 992-4843
- Travelodge Fullerton Anaheim, 1415 S Euclid St, Fullerton, California 92832 , Phone: (714) 578-7950
- The Hotel Fullerton Anaheim, 1500 S Raymond Ave, Fullerton, California 92831 , Phone: (714) 635-9000, Fax: (714) 520-4622
- Holiday Inn & Suites, 2932 E Nutwood Ave, Fullerton, California 92831 , Phone: (714) 579-7400, Fax: (714) 528-7945
- Days Inn & Suites, 333 E Imperial Hwy, Fullerton, California 92835 , Phone: (714) 447-9200, Fax: (714) 773-0685
- Holiday Inn Express Fullerton/Anaheim, 212 W Houston Ave, Fullerton, California 92832 , Phone: (714) 853-1700
| Most common first names in Fullerton, CA among deceased individuals | ||
| Name | Count | Lived (average) |
|---|---|---|
| Robert | 192 | 76.6 years |
| Mary | 177 | 81.2 years |
| John | 154 | 78.5 years |
| William | 134 | 78.1 years |
| James | 110 | 74.9 years |
| Dorothy | 107 | 83.7 years |
| Helen | 98 | 85.9 years |
| George | 86 | 81.0 years |
| Richard | 80 | 74.4 years |
| Donald | 78 | 75.0 years |
| Most common last names in Fullerton, CA among deceased individuals | ||
| Last name | Count | Lived (average) |
|---|---|---|
| Smith | 56 | 79.4 years |
| Miller | 49 | 76.5 years |
| Johnson | 48 | 74.8 years |
| Kim | 41 | 76.7 years |
| Williams | 32 | 82.3 years |
| Anderson | 29 | 84.6 years |
| Lee | 29 | 78.5 years |
| Brown | 29 | 79.0 years |
| Jones | 27 | 82.6 years |
| Martinez | 26 | 76.4 years |
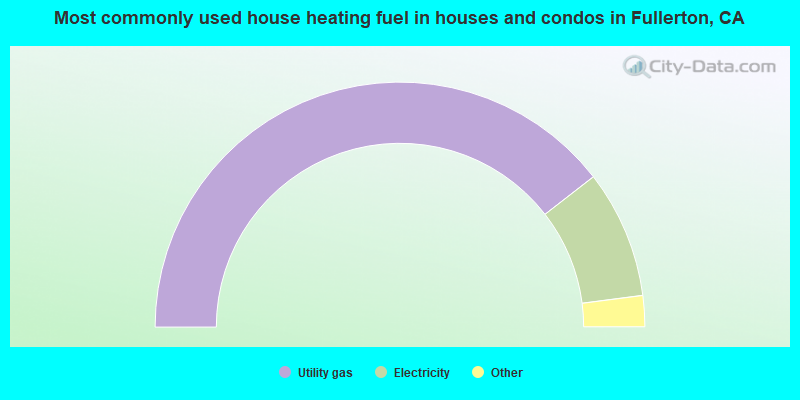
- 79.0%Utility gas
- 16.9%Electricity
- 1.7%No fuel used
- 1.4%Bottled, tank, or LP gas
- 0.7%Solar energy
- 0.3%Wood
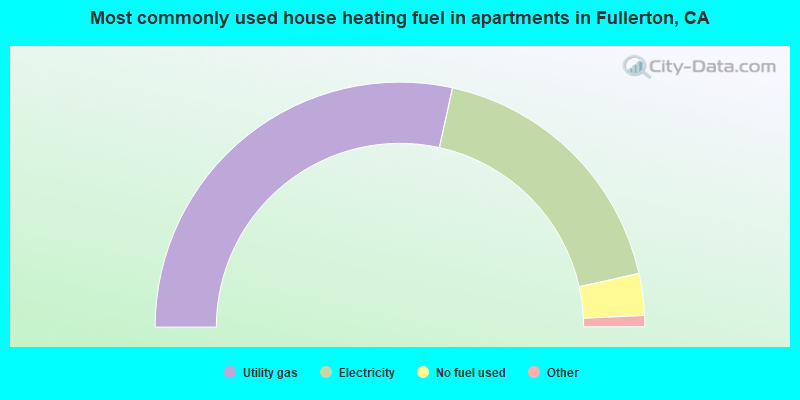
- 56.9%Utility gas
- 36.1%Electricity
- 5.5%No fuel used
- 1.4%Bottled, tank, or LP gas
- 0.1%Coal or coke
Fullerton compared to California state average:
- Unemployed percentage below state average.
- Black race population percentage significantly below state average.
- Percentage of population with a bachelor's degree or higher above state average.
Fullerton, CA compared to other similar cities:
Fullerton on our top lists:
- #16 on the list of "Top 101 cities with largest percentage of males in occupations: arts, design, entertainment, sports, and media occupations (population 50,000+)"
- #29 on the list of "Top 101 cities with the largest city-data.com crime index increase from 2011 to 2012 (population 50,000+)"
- #31 on the list of "Top 101 cities with largest percentage of males in industries: wholesale trade (population 50,000+)"
- #36 on the list of "Top 101 cities with the lowest average snowfall in a year (population 50,000+)"
- #38 on the list of "Top 101 cities with the most residents born in Korea (population 500+)"
- #40 on the list of "Top 101 cities with largest percentage of females in industries: wholesale trade (population 50,000+)"
- #60 on the list of "Top 101 cities with fewest building permits per 10,000 residents (population 50,000+)"
- #67 on the list of "Top 101 cities with the lowest number of murders per 100,000 residents (population 50,000+)"
- #71 on the list of "Top 101 cities with the lowest number of police officers per 1000 residents (population 50,000+)"
- #76 on the list of "Top 100 cities with highest median household income and median resident age less than 35 (pop. 50,000+)"
- #79 on the list of "Top 101 cities with largest percentage of females in industries: construction (population 50,000+)"
- #79 on the list of "Top 100 cities with highest ratio of median house value to median household income (pop. 50,000+)"
- #83 on the list of "Top 101 larger cities with the highest increase in house/condo value from 2000 (population 50,000+)"
- #90 on the list of "Top 101 cities with largest percentage of females in occupations: sales and related occupations (population 50,000+)"
- #96 on the list of "Top 101 cities with the lowest average yearly precipitation (population 50,000+)"
- #97 on the list of "Top 100 cities with highest median house value (pop. 50,000+)"
- #4 on the list of "Top 101 counties with the highest total withdrawal of fresh water for public supply"
- #5 on the list of "Top 101 counties with the most Catholic adherents"
- #6 on the list of "Top 101 counties with the highest ground withdrawal of fresh water for public supply"
- #7 on the list of "Top 101 counties with the most Evangelical Protestant adherents"
- #8 on the list of "Top 101 counties with the highest Particulate Matter (PM2.5) Annual air pollution readings in 2012 (µg/m3)"

|
|
Total of 1068 patent applications in 2008-2024.