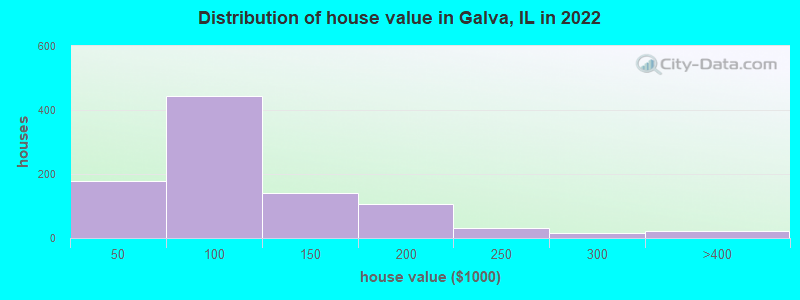
Estimated median house or condo value in 2022: $81,341 (it was $58,000 in 2000)
Galva:
$81,341
IL:
$251,600
Mean prices in 2022:all housing units: $176,702; detached houses: $172,999; townhouses or other attached units: $178,408; in 2-unit structures: $179,505; in 5-or-more-unit structures: over $1,000,000; mobile homes: $58,249
Median gross rent in 2022: $744.
March 2022 cost of living index in Galva: 83.8 (less than average, U.S. average is 100)
Percentage of residents living in poverty in 2022: 15.4%
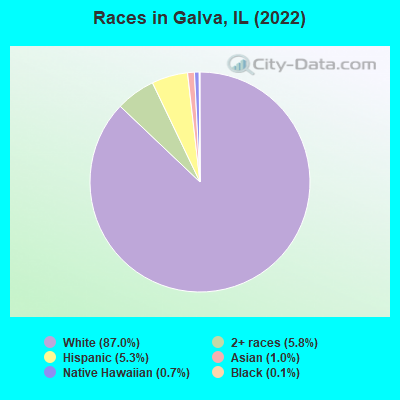
(16.5% for White Non-Hispanic residents, 7.0% for Hispanic or Latino residents, 5.3% for two or more races residents)
Latest news from Galva, IL collected exclusively by city-data.com from local newspapers, TV, and radio stations
Ancestries: English (17.0%), Irish (14.0%), German (13.9%), Swedish (13.0%), American (6.4%), Belgian (4.3%).
Current Local Time: CST time zone
Incorporated on 04/14/1879
Elevation: 845 feet
Land area: 1.71 square miles.
Population density: 1,410 people per square mile (low).
31 residents are foreign born
This city:
1.3%
Illinois:
14.1%
Median real estate property taxes paid for housing units with mortgages in 2022: $1,823 (1.9%) Median real estate property taxes paid for housing units with no mortgage in 2022: $1,228 (1.7%)
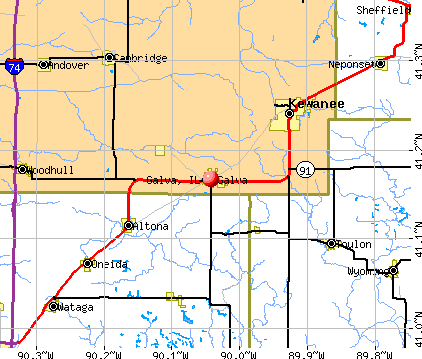
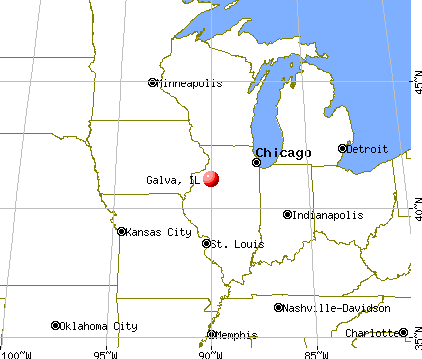
Nearest city with pop. 50,000+: Peoria, IL (38.2 miles , pop. 112,936).
Nearest city with pop. 200,000+: Chicago, IL (131.0 miles , pop. 2,896,016).
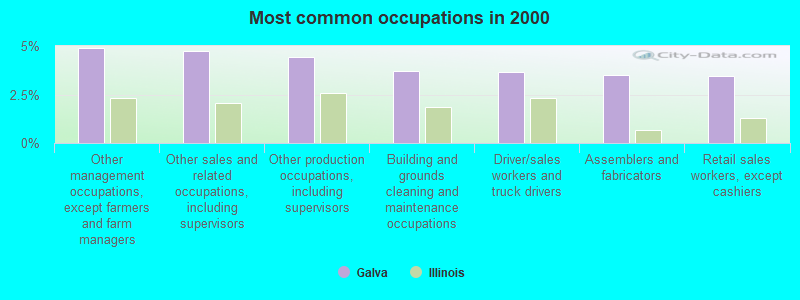
Other management occupations, except farmers and farm managers (4.9%)
Other sales and related occupations, including supervisors (4.8%)
Other production occupations, including supervisors (4.4%)
Building and grounds cleaning and maintenance occupations (3.7%)
Driver/sales workers and truck drivers (3.7%)
Assemblers and fabricators (3.5%)
Retail sales workers, except cashiers (3.5%)
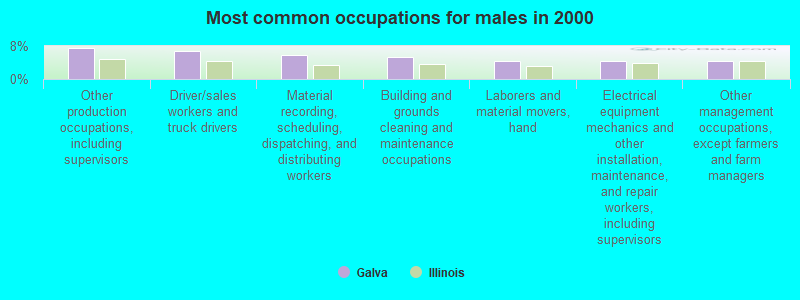
Other production occupations, including supervisors (7.5%)
Driver/sales workers and truck drivers (6.8%)
Material recording, scheduling, dispatching, and distributing workers (5.8%)
Building and grounds cleaning and maintenance occupations (5.3%)
Laborers and material movers, hand (4.5%)
Electrical equipment mechanics and other installation, maintenance, and repair workers, including supervisors (4.5%)
Other management occupations, except farmers and farm managers (4.3%)
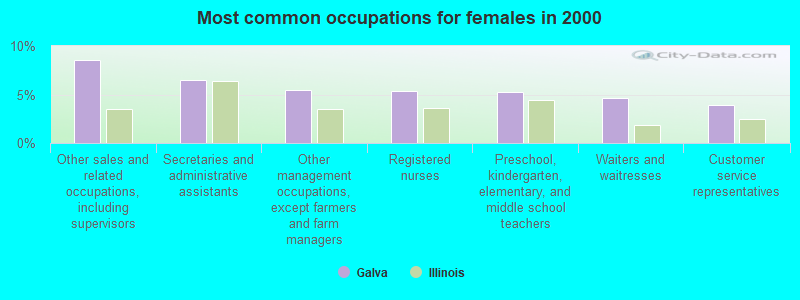
Other sales and related occupations, including supervisors (8.6%)
Secretaries and administrative assistants (6.5%)
Other management occupations, except farmers and farm managers (5.5%)
Registered nurses (5.4%)
Preschool, kindergarten, elementary, and middle school teachers (5.2%)
Waiters and waitresses (4.6%)
Customer service representatives (3.9%)
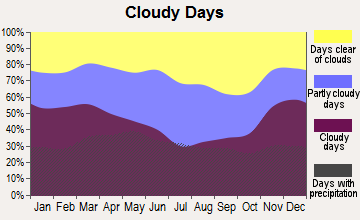
Average climate in Galva, Illinois
Based on data reported by over 4,000 weather stations
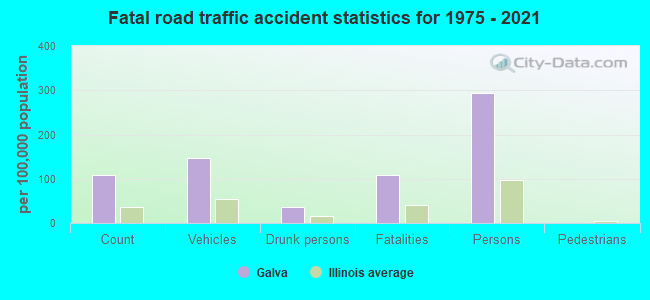
Tornado activity:
Galva-area historical tornado activity is near Illinois state average. It is 70% greater than the overall U.S. average.
On 6/29/1976, a category F4 (max. wind speeds 207-260 mph) tornado 29.6 miles away from the Galva city center causedbetween $50,000 and $500,000 in damages.
On 3/29/1981, a category F4 tornado 35.8 miles away from the city center causedbetween $500,000 and $5,000,000 in damages.
Earthquake activity:
Galva-area historical earthquake activity is significantly above Illinois state average. It is 126% greater than the overall U.S. average.
On 4/18/2008 at 09:36:59, a magnitude 5.4 (5.1 MB, 4.8 MS, 5.4 MW, 5.2 MW, Class: Moderate, Intensity: VI - VII) earthquake occurred 219.9 miles away from Galva center On 6/10/1987 at 23:48:54, a magnitude 5.1 (4.9 MB, 4.4 MS, 4.6 MS, 5.1 LG) earthquake occurred 198.5 miles away from Galva center On 4/18/2008 at 09:36:59, a magnitude 5.2 (5.2 MW, Depth: 8.9 mi) earthquake occurred 220.0 miles away from Galva center On 6/28/2004 at 06:10:52, a magnitude 4.2 (4.2 MW, Depth: 6.2 mi, Class: Light, Intensity: IV - V) earthquake occurred 62.7 miles away from the city center On 6/18/2002 at 17:37:15, a magnitude 5.0 (4.3 MB, 4.6 MW, 5.0 LG) earthquake occurred 250.8 miles away from the city center On 4/18/2008 at 15:14:16, a magnitude 4.8 (4.5 MB, 4.8 MW, 4.6 MW) earthquake occurred 219.6 miles away from the city center Magnitude types: regional Lg-wave magnitude (LG), body-wave magnitude (MB), surface-wave magnitude (MS), moment magnitude (MW)
Natural disasters:
The number of natural disasters in Henry County (14) is near the US average (15). Major Disasters (Presidential) Declared: 7 Emergencies Declared: 5
Causes of natural disasters: Storms: 8, Floods: 6, Snows: 2, Snowstorms: 2, Tornadoes: 2, Winter Storms: 2, Blizzard: 1, Hurricane: 1, Wind: 1, Other: 1 (Note: some incidents may be assigned to more than one category).
Hospitals and medical centers near Galva:
KEWANEE HOSPITAL Critical Access Hospitals (about 7 miles away; KEWANEE, IL)
KEWANEE CARE HOME (Nursing Home, about 7 miles away; KEWANEE, IL)
FMC - MIDWEST - KEWANEE (Dialysis Facility, about 7 miles away; KEWANEE, IL)
KEWANEE HOSPITAL ASSOC (Nursing Home, about 8 miles away; KEWANEE, IL)
ROYAL OAKS CARE CENTER (Nursing Home, about 8 miles away; KEWANEE, IL)
HILLCREST HOME (Nursing Home, about 16 miles away; GENESEO, IL)
GALVA PUBLIC LIBRARY DISTRICT (Operating income: $222,666; Location: 120 NORTHWEST THIRD AVENUE; 22,537 books; 333 e-books; 667 audio materials; 1,696 video materials; 1 local licensed databases; 11 state licensed databases; 71 print serial subscriptions)
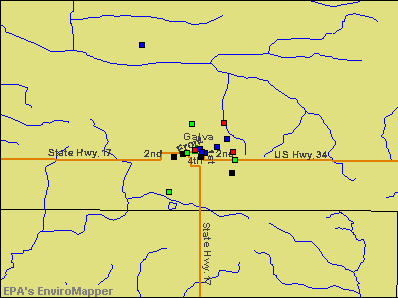
Notable locations in Galva: Galva Public Library (A), Galva Bishop Hills Emergency Medical Services (B), Galva Fire Department (C). Display/hide their locations on the map
Churches in Galva include: Trinity Baptist Church (A), First United Methodist Church (B), First Congregational Church (C), First Baptist Church of Galva (D), Saint Johns Catholic Church (E), Assembly of God Church (F), Grace United Methodist Church (G), Foursquare Church (H), Messiah Lutheran Church (I). Display/hide their locations on the map
Tourist attraction: Galva Historical Society (Museums; 906 West Division Street).
Birthplace of: George Helgesen Fitch - Politician.
Henry County has a predicted average indoor radon screening level greater than 4 pCi/L (pico curies per liter) - Highest Potential
Drinking water stations with addresses in Galva and their reported violations in the past:
BLACKHAWK COLLEGE EAST CAMPUS (Population served: 80, Groundwater):
Past monitoring violations:
Monitoring and Reporting (DBP) - Between OCT-2011 and DEC-2011, Contaminant: Chlorine. Follow-up actions: St Compliance achieved (DEC-12-2011), St Public Notif requested (DEC-19-2011), St Violation/Reminder Notice (DEC-19-2011), St Public Notif received (JAN-24-2012)
Average household size:
This city:
2.3 people
Illinois:
2.6 people
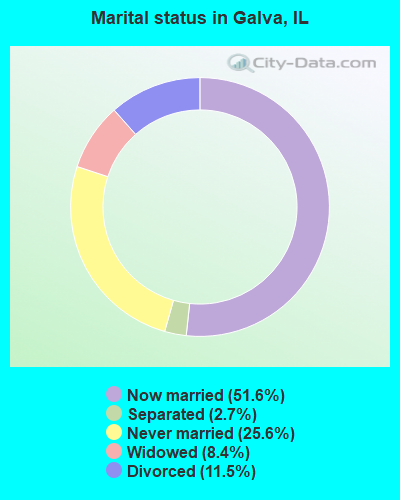
Percentage of family households:
This city:
62.2%
Whole state:
65.8%
Percentage of households with unmarried partners:
This city:
9.0%
Whole state:
6.3%
Likely homosexual households (counted as self-reported same-sex unmarried-partner households)
Lesbian couples: 0.1% of all households
Gay men: 0.3% of all households
4 people in nursing homes in 2000
Banks with branches in Galva (2011 data):
Community State Bank: Galva Branch at 300 Main, branch established on 1882/01/01; at 625 S.E. 2nd Street, branch established on 1980/11/24. Info updated 2010/06/22: Bank assets: $127.5 mil, Deposits: $111.1 mil, local headquarters, positive income, Commercial Lending Specialization, 5 total offices, Holding Company: Galva Investment, Inc.
State Bank of Toulon: Galva Facility at 112 North Exchange Street, branch established on 1934/05/26. Info updated 2006/11/03: Bank assets: $185.1 mil, Deposits: $156.1 mil, headquarters in Toulon, IL, positive income, Agricultural Specialization, 3 total offices, Holding Company: Stark County Bancorp, Inc.
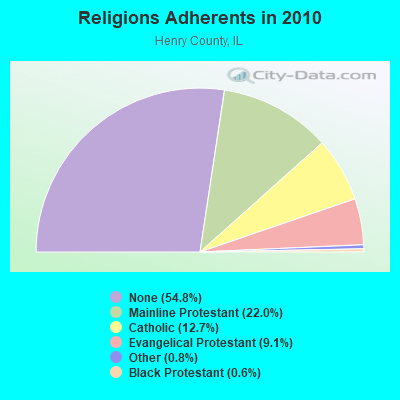
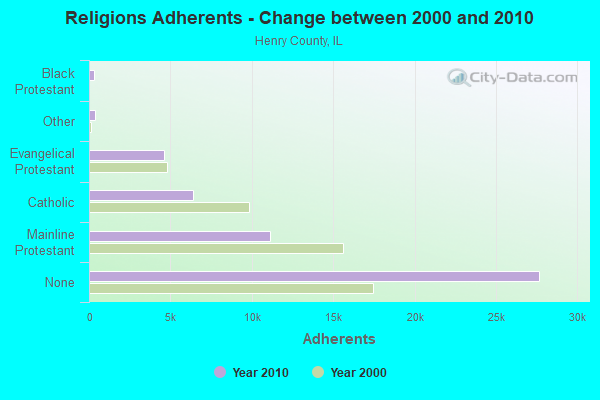
Religion statistics for Galva, IL (based on Henry County data)
Religion
Adherents
Congregations
Mainline Protestant
11,117
35
Catholic
6,390
11
Evangelical Protestant
4,617
38
Other
390
4
Black Protestant
305
2
None
27,667
-
Source: Clifford Grammich, Kirk Hadaway, Richard Houseal, Dale E.Jones, Alexei Krindatch, Richie Stanley and Richard H.Taylor. 2012. 2010 U.S.Religion Census: Religious Congregations & Membership Study. Association of Statisticians of American Religious Bodies. Jones, Dale E., et al. 2002. Congregations and Membership in the United States 2000. Nashville, TN: Glenmary Research Center. Graphs represent county-level data
818 Se 1st St (Lat: 41.166694 Lon: -90.041778), Structure height: 12 m, Call Sign: WPBS683, Assigned Frequencies: 47.0200 MHz, 47.0600 MHz, 47.1000 MHz, 47.1400 MHz, 47.1800 MHz, 47.3800 MHz, Grant Date: 11/29/2012, Expiration Date: 02/23/2023, Cancellation Date: 01/20/2015, Registrant: Illinois State Police, 801 S 7th St - Csb Ste 201-N, Springfield, IL 62703, Phone: (217) 782-7347, Fax: (217) 782-9920, Email:
S Side Ew Township Rd 3 Mi Se (Lat: 41.121694 Lon: -90.014833), Type: Tower, Structure height: 61 m, Call Sign: WNKZ807, Assigned Frequencies: 935.887 MHz, 935.937 MHz, 935.987 MHz, 936.887 MHz, 936.937 MHz, 936.987 MHz, Grant Date: 02/11/1998, Expiration Date: 02/11/2003, Cancellation Date: 05/18/2003, Certifier: Robert Vandeberg, Registrant: Transportation Technology Center Inc, 55500 Dot Rd, Pueblo, CO 81001, Fax: (719) 584-7145
GALVA MW SITE, Galva Mw - S Side Of W-Wv Township Rd. 3mi Se Of (Lat: 41.121944 Lon: -90.014722), Type: Gtower, Structure height: 61 m, Overall height: 62.5 m, Call Sign: WQPE818, Assigned Frequencies: 44.5800 MHz, Grant Date: 03/16/2022, Expiration Date: 04/25/2032, Certifier: Robert Leedham, Registrant: Bnsf Railway Co., 4515 Kansas Avenue, Kansas City, KS 66106, Phone: (913) 551-4015, Email:
Aircraft: LOVE JAMES E RV 9A (Category: Land, Seats: 2, Weight: Up to 12,499 Pounds), Engine: LYCOMING O-320-D2A (160 HP) (4 Cycle) N-Number: 96YR, N96YR, N-96YR, Serial Number: 90742, Year manufactured: 2009, Airworthiness Date: 07/25/2009, Certificate Issue Date: 06/23/2014 Registrant (Individual): James E Love, 2993 Knox Road 2000 E, Galva, IL 61434
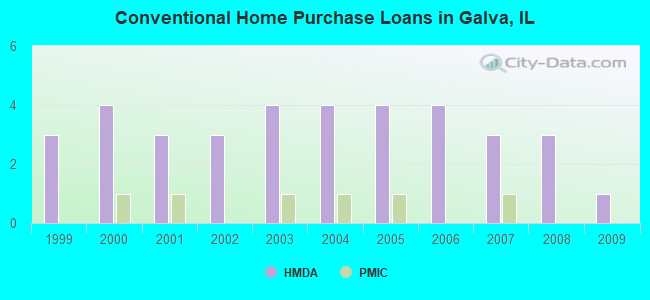
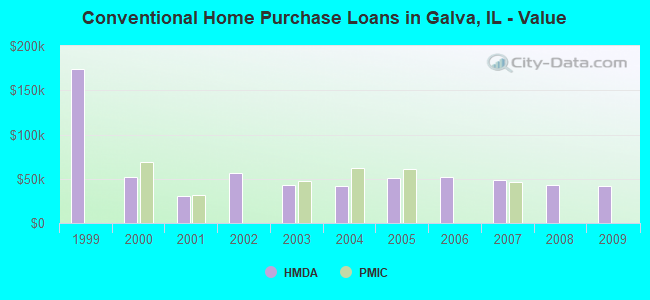
Home Mortgage Disclosure Act Aggregated Statistics For Year 2009 (Based on 1 partial tract)
A) FHA, FSA/RHS & VA Home Purchase Loans
B) Conventional Home Purchase Loans
C) Refinancings
D) Home Improvement Loans
F) Non-occupant Loans on < 5 Family Dwellings (A B C & D)
Number
Average Value
Number
Average Value
Number
Average Value
Number
Average Value
Number
Average Value
LOANS ORIGINATED
1
$57,580
1
$41,280
4
$69,392
1
$49,390
1
$28,690
APPLICATIONS APPROVED, NOT ACCEPTED
0
$0
0
$0
1
$64,220
0
$0
0
$0
APPLICATIONS DENIED
0
$0
1
$32,310
2
$61,585
0
$0
0
$0
APPLICATIONS WITHDRAWN
0
$0
0
$0
1
$69,200
0
$0
0
$0
FILES CLOSED FOR INCOMPLETENESS
0
$0
0
$0
0
$0
0
$0
0
$0
Aggregated Statistics For Year 2008 (Based on 1 partial tract)
B) Conventional Home Purchase Loans
C) Refinancings
D) Home Improvement Loans
F) Non-occupant Loans on < 5 Family Dwellings (A B C & D)
Number
Average Value
Number
Average Value
Number
Average Value
Number
Average Value
LOANS ORIGINATED
3
$43,140
4
$69,100
1
$58,460
1
$22,740
APPLICATIONS APPROVED, NOT ACCEPTED
0
$0
0
$0
0
$0
0
$0
APPLICATIONS DENIED
0
$0
3
$71,900
1
$38,550
0
$0
APPLICATIONS WITHDRAWN
0
$0
1
$41,380
0
$0
0
$0
FILES CLOSED FOR INCOMPLETENESS
0
$0
0
$0
0
$0
0
$0
Aggregated Statistics For Year 2007 (Based on 1 partial tract)
A) FHA, FSA/RHS & VA Home Purchase Loans
B) Conventional Home Purchase Loans
C) Refinancings
D) Home Improvement Loans
F) Non-occupant Loans on < 5 Family Dwellings (A B C & D)
Number
Average Value
Number
Average Value
Number
Average Value
Number
Average Value
Number
Average Value
LOANS ORIGINATED
1
$44,210
3
$48,733
4
$58,000
1
$47,920
1
$24,500
APPLICATIONS APPROVED, NOT ACCEPTED
0
$0
0
$0
0
$0
0
$0
0
$0
APPLICATIONS DENIED
0
$0
1
$41,380
2
$68,420
1
$33,570
0
$0
APPLICATIONS WITHDRAWN
0
$0
0
$0
1
$157,230
0
$0
0
$0
FILES CLOSED FOR INCOMPLETENESS
0
$0
0
$0
0
$0
0
$0
0
$0
Aggregated Statistics For Year 2006 (Based on 1 partial tract)
A) FHA, FSA/RHS & VA Home Purchase Loans
B) Conventional Home Purchase Loans
C) Refinancings
D) Home Improvement Loans
F) Non-occupant Loans on < 5 Family Dwellings (A B C & D)
Number
Average Value
Number
Average Value
Number
Average Value
Number
Average Value
Number
Average Value
LOANS ORIGINATED
1
$31,130
4
$51,948
4
$57,048
2
$21,765
2
$36,745
APPLICATIONS APPROVED, NOT ACCEPTED
0
$0
0
$0
0
$0
0
$0
0
$0
APPLICATIONS DENIED
0
$0
1
$67,640
3
$67,733
1
$41,870
0
$0
APPLICATIONS WITHDRAWN
0
$0
0
$0
2
$69,880
0
$0
0
$0
FILES CLOSED FOR INCOMPLETENESS
0
$0
0
$0
0
$0
0
$0
0
$0
Aggregated Statistics For Year 2005 (Based on 1 partial tract)
B) Conventional Home Purchase Loans
C) Refinancings
D) Home Improvement Loans
F) Non-occupant Loans on < 5 Family Dwellings (A B C & D)
Number
Average Value
Number
Average Value
Number
Average Value
Number
Average Value
LOANS ORIGINATED
4
$50,630
5
$60,044
1
$39,330
1
$44,600
APPLICATIONS APPROVED, NOT ACCEPTED
0
$0
1
$76,420
0
$0
0
$0
APPLICATIONS DENIED
1
$33,670
4
$67,880
1
$50,650
0
$0
APPLICATIONS WITHDRAWN
0
$0
2
$66,805
0
$0
0
$0
FILES CLOSED FOR INCOMPLETENESS
0
$0
1
$21,180
0
$0
0
$0
Aggregated Statistics For Year 2004 (Based on 1 partial tract)
A) FHA, FSA/RHS & VA Home Purchase Loans
B) Conventional Home Purchase Loans
C) Refinancings
D) Home Improvement Loans
F) Non-occupant Loans on < 5 Family Dwellings (A B C & D)
Number
Average Value
Number
Average Value
Number
Average Value
Number
Average Value
Number
Average Value
LOANS ORIGINATED
1
$32,790
4
$41,992
7
$52,983
2
$27,620
1
$46,160
APPLICATIONS APPROVED, NOT ACCEPTED
0
$0
0
$0
1
$40,700
0
$0
0
$0
APPLICATIONS DENIED
0
$0
1
$34,060
3
$59,080
1
$14,540
0
$0
APPLICATIONS WITHDRAWN
0
$0
0
$0
2
$38,160
0
$0
0
$0
FILES CLOSED FOR INCOMPLETENESS
0
$0
0
$0
0
$0
0
$0
0
$0
Aggregated Statistics For Year 2003 (Based on 1 partial tract)
B) Conventional Home Purchase Loans
C) Refinancings
D) Home Improvement Loans
F) Non-occupant Loans on < 5 Family Dwellings (A B C & D)
Number
Average Value
Number
Average Value
Number
Average Value
Number
Average Value
LOANS ORIGINATED
4
$42,480
8
$58,170
1
$25,280
2
$40,990
APPLICATIONS APPROVED, NOT ACCEPTED
0
$0
1
$74,660
0
$0
0
$0
APPLICATIONS DENIED
1
$45,580
3
$53,877
0
$0
0
$0
APPLICATIONS WITHDRAWN
0
$0
3
$68,223
0
$0
0
$0
FILES CLOSED FOR INCOMPLETENESS
0
$0
0
$0
0
$0
0
$0
Aggregated Statistics For Year 2002 (Based on 1 partial tract)
A) FHA, FSA/RHS & VA Home Purchase Loans
B) Conventional Home Purchase Loans
C) Refinancings
D) Home Improvement Loans
F) Non-occupant Loans on < 5 Family Dwellings (A B C & D)
Number
Average Value
Number
Average Value
Number
Average Value
Number
Average Value
Number
Average Value
LOANS ORIGINATED
1
$61,590
3
$56,447
6
$45,742
1
$26,060
1
$32,400
APPLICATIONS APPROVED, NOT ACCEPTED
0
$0
0
$0
1
$51,730
0
$0
0
$0
APPLICATIONS DENIED
0
$0
0
$0
3
$51,110
1
$9,170
0
$0
APPLICATIONS WITHDRAWN
0
$0
0
$0
2
$66,515
0
$0
0
$0
FILES CLOSED FOR INCOMPLETENESS
0
$0
0
$0
0
$0
0
$0
0
$0
Aggregated Statistics For Year 2001 (Based on 1 partial tract)
B) Conventional Home Purchase Loans
C) Refinancings
D) Home Improvement Loans
F) Non-occupant Loans on < 5 Family Dwellings (A B C & D)
Number
Average Value
Number
Average Value
Number
Average Value
Number
Average Value
LOANS ORIGINATED
3
$30,450
7
$54,474
2
$19,080
1
$23,910
APPLICATIONS APPROVED, NOT ACCEPTED
0
$0
1
$60,320
0
$0
0
$0
APPLICATIONS DENIED
0
$0
4
$45,090
1
$13,960
0
$0
APPLICATIONS WITHDRAWN
0
$0
2
$53,385
0
$0
0
$0
FILES CLOSED FOR INCOMPLETENESS
0
$0
0
$0
0
$0
0
$0
Aggregated Statistics For Year 2000 (Based on 1 partial tract)
B) Conventional Home Purchase Loans
C) Refinancings
D) Home Improvement Loans
F) Non-occupant Loans on < 5 Family Dwellings (A B C & D)
Number
Average Value
Number
Average Value
Number
Average Value
Number
Average Value
LOANS ORIGINATED
4
$52,410
5
$39,684
2
$25,520
1
$19,810
APPLICATIONS APPROVED, NOT ACCEPTED
0
$0
0
$0
0
$0
0
$0
APPLICATIONS DENIED
0
$0
2
$54,705
1
$13,860
0
$0
APPLICATIONS WITHDRAWN
0
$0
2
$36,745
0
$0
0
$0
FILES CLOSED FOR INCOMPLETENESS
0
$0
0
$0
0
$0
0
$0
Aggregated Statistics For Year 1999 (Based on 1 partial tract)
B) Conventional Home Purchase Loans
C) Refinancings
D) Home Improvement Loans
F) Non-occupant Loans on < 5 Family Dwellings (A B C & D)
Detailed PMIC statistics for the following Tracts:0311.00
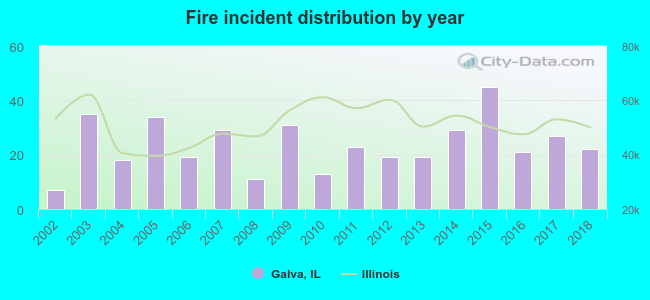
2002 - 2018 National Fire Incident Reporting System (NFIRS) incidents
According to the data from the years 2002 - 2018 the average number of fire incidents per year is 24. The highest number of fire incidents - 45 took place in 2015, and the least - 7 in 2002. The data has a rising trend.
When looking into fire subcategories, the most reports belonged to: Structure Fires (40.3%), and Outside Fires (37.8%).
Fire incident types reported to NFIRS in Galva, IL


 Recent articles from our blog. Our writers, many of them Ph.D. graduates or candidates, create easy-to-read articles on a wide variety of topics.

 (38.2 miles


 According to the data from the years 2002 - 2018 the average number of fire incidents per year is 24. The highest number of fire incidents - 45 took place in 2015, and the least - 7 in 2002. The data has a rising trend.
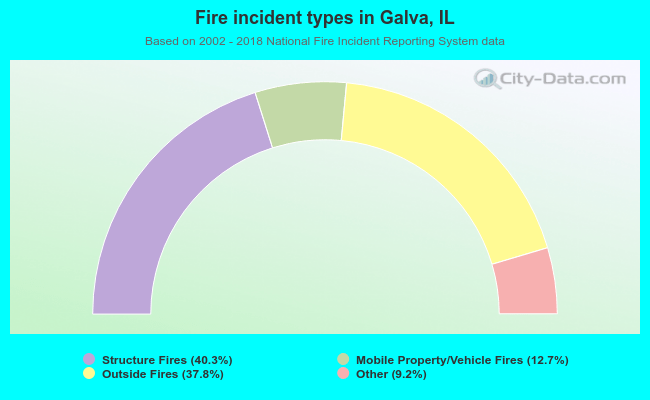 When looking into fire subcategories, the most reports belonged to: Structure Fires (40.3%), and Outside Fires (37.8%).