Glencoe, Alabama Submit your own pictures of this city and show them to the world
OSM Map
General Map
Google Map
MSN Map
OSM Map
General Map
Google Map
MSN Map
OSM Map
General Map
Google Map
MSN Map
OSM Map
General Map
Google Map
MSN Map
Please wait while loading the map...
Population in 2022: 5,370 (54% urban, 46% rural). Population change since 2000: +4.2%Males: 2,483 Females: 2,887
March 2022 cost of living index in Glencoe: 80.7 (low, U.S. average is 100) Percentage of residents living in poverty in 2022: 6.1%for White Non-Hispanic residents , 4.0% for Black residents , 6.6% for two or more races residents )Business Search - 14 Million verified businesses
Data:
Median household income ($)
Median household income (% change since 2000)
Household income diversity
Ratio of average income to average house value (%)
Ratio of average income to average rent
Median household income ($) - White
Median household income ($) - Black or African American
Median household income ($) - Asian
Median household income ($) - Hispanic or Latino
Median household income ($) - American Indian and Alaska Native
Median household income ($) - Multirace
Median household income ($) - Other Race
Median household income for houses/condos with a mortgage ($)
Median household income for apartments without a mortgage ($)
Races - White alone (%)
Races - White alone (% change since 2000)
Races - Black alone (%)
Races - Black alone (% change since 2000)
Races - American Indian alone (%)
Races - American Indian alone (% change since 2000)
Races - Asian alone (%)
Races - Asian alone (% change since 2000)
Races - Hispanic (%)
Races - Hispanic (% change since 2000)
Races - Native Hawaiian and Other Pacific Islander alone (%)
Races - Native Hawaiian and Other Pacific Islander alone (% change since 2000)
Races - Two or more races (%)
Races - Two or more races (% change since 2000)
Races - Other race alone (%)
Races - Other race alone (% change since 2000)
Racial diversity
Unemployment (%)
Unemployment (% change since 2000)
Unemployment (%) - White
Unemployment (%) - Black or African American
Unemployment (%) - Asian
Unemployment (%) - Hispanic or Latino
Unemployment (%) - American Indian and Alaska Native
Unemployment (%) - Multirace
Unemployment (%) - Other Race
Population density (people per square mile)
Population - Males (%)
Population - Females (%)
Population - Males (%) - White
Population - Males (%) - Black or African American
Population - Males (%) - Asian
Population - Males (%) - Hispanic or Latino
Population - Males (%) - American Indian and Alaska Native
Population - Males (%) - Multirace
Population - Males (%) - Other Race
Population - Females (%) - White
Population - Females (%) - Black or African American
Population - Females (%) - Asian
Population - Females (%) - Hispanic or Latino
Population - Females (%) - American Indian and Alaska Native
Population - Females (%) - Multirace
Population - Females (%) - Other Race
Coronavirus confirmed cases (Jun 16, 2024)
Deaths caused by coronavirus (Jun 16, 2024)
Coronavirus confirmed cases (per 100k population) (Jun 16, 2024)
Deaths caused by coronavirus (per 100k population) (Jun 16, 2024)
Daily increase in number of cases (Jun 16, 2024)
Weekly increase in number of cases (Jun 16, 2024)
Cases doubled (in days) (Jun 16, 2024)
Hospitalized patients (Apr 18, 2022)
Negative test results (Apr 18, 2022)
Total test results (Apr 18, 2022)
COVID Vaccine doses distributed (per 100k population) (Sep 19, 2023)
COVID Vaccine doses administered (per 100k population) (Sep 19, 2023)
COVID Vaccine doses distributed (Sep 19, 2023)
COVID Vaccine doses administered (Sep 19, 2023)
Likely homosexual households (%)
Likely homosexual households (% change since 2000)
Likely homosexual households - Lesbian couples (%)
Likely homosexual households - Lesbian couples (% change since 2000)
Likely homosexual households - Gay men (%)
Likely homosexual households - Gay men (% change since 2000)
Cost of living index
Median gross rent ($)
Median contract rent ($)
Median monthly housing costs ($)
Median house or condo value ($)
Median house or condo value ($ change since 2000)
Mean house or condo value by units in structure - 1, detached ($)
Mean house or condo value by units in structure - 1, attached ($)
Mean house or condo value by units in structure - 2 ($)
Mean house or condo value by units in structure by units in structure - 3 or 4 ($)
Mean house or condo value by units in structure - 5 or more ($)
Mean house or condo value by units in structure - Boat, RV, van, etc. ($)
Mean house or condo value by units in structure - Mobile home ($)
Median house or condo value ($) - White
Median house or condo value ($) - Black or African American
Median house or condo value ($) - Asian
Median house or condo value ($) - Hispanic or Latino
Median house or condo value ($) - American Indian and Alaska Native
Median house or condo value ($) - Multirace
Median house or condo value ($) - Other Race
Median resident age
Resident age diversity
Median resident age - Males
Median resident age - Females
Median resident age - White
Median resident age - Black or African American
Median resident age - Asian
Median resident age - Hispanic or Latino
Median resident age - American Indian and Alaska Native
Median resident age - Multirace
Median resident age - Other Race
Median resident age - Males - White
Median resident age - Males - Black or African American
Median resident age - Males - Asian
Median resident age - Males - Hispanic or Latino
Median resident age - Males - American Indian and Alaska Native
Median resident age - Males - Multirace
Median resident age - Males - Other Race
Median resident age - Females - White
Median resident age - Females - Black or African American
Median resident age - Females - Asian
Median resident age - Females - Hispanic or Latino
Median resident age - Females - American Indian and Alaska Native
Median resident age - Females - Multirace
Median resident age - Females - Other Race
Commute - mean travel time to work (minutes)
Travel time to work - Less than 5 minutes (%)
Travel time to work - Less than 5 minutes (% change since 2000)
Travel time to work - 5 to 9 minutes (%)
Travel time to work - 5 to 9 minutes (% change since 2000)
Travel time to work - 10 to 19 minutes (%)
Travel time to work - 10 to 19 minutes (% change since 2000)
Travel time to work - 20 to 29 minutes (%)
Travel time to work - 20 to 29 minutes (% change since 2000)
Travel time to work - 30 to 39 minutes (%)
Travel time to work - 30 to 39 minutes (% change since 2000)
Travel time to work - 40 to 59 minutes (%)
Travel time to work - 40 to 59 minutes (% change since 2000)
Travel time to work - 60 to 89 minutes (%)
Travel time to work - 60 to 89 minutes (% change since 2000)
Travel time to work - 90 or more minutes (%)
Travel time to work - 90 or more minutes (% change since 2000)
Marital status - Never married (%)
Marital status - Now married (%)
Marital status - Separated (%)
Marital status - Widowed (%)
Marital status - Divorced (%)
Median family income ($)
Median family income (% change since 2000)
Median non-family income ($)
Median non-family income (% change since 2000)
Median per capita income ($)
Median per capita income (% change since 2000)
Median family income ($) - White
Median family income ($) - Black or African American
Median family income ($) - Asian
Median family income ($) - Hispanic or Latino
Median family income ($) - American Indian and Alaska Native
Median family income ($) - Multirace
Median family income ($) - Other Race
Median year house/condo built
Median year apartment built
Year house built - Built 2005 or later (%)
Year house built - Built 2000 to 2004 (%)
Year house built - Built 1990 to 1999 (%)
Year house built - Built 1980 to 1989 (%)
Year house built - Built 1970 to 1979 (%)
Year house built - Built 1960 to 1969 (%)
Year house built - Built 1950 to 1959 (%)
Year house built - Built 1940 to 1949 (%)
Year house built - Built 1939 or earlier (%)
Average household size
Household density (households per square mile)
Average household size - White
Average household size - Black or African American
Average household size - Asian
Average household size - Hispanic or Latino
Average household size - American Indian and Alaska Native
Average household size - Multirace
Average household size - Other Race
Occupied housing units (%)
Vacant housing units (%)
Owner occupied housing units (%)
Renter occupied housing units (%)
Vacancy status - For rent (%)
Vacancy status - For sale only (%)
Vacancy status - Rented or sold, not occupied (%)
Vacancy status - For seasonal, recreational, or occasional use (%)
Vacancy status - For migrant workers (%)
Vacancy status - Other vacant (%)
Residents with income below the poverty level (%)
Residents with income below 50% of the poverty level (%)
Children below poverty level (%)
Poor families by family type - Married-couple family (%)
Poor families by family type - Male, no wife present (%)
Poor families by family type - Female, no husband present (%)
Poverty status for native-born residents (%)
Poverty status for foreign-born residents (%)
Poverty among high school graduates not in families (%)
Poverty among people who did not graduate high school not in families (%)
Residents with income below the poverty level (%) - White
Residents with income below the poverty level (%) - Black or African American
Residents with income below the poverty level (%) - Asian
Residents with income below the poverty level (%) - Hispanic or Latino
Residents with income below the poverty level (%) - American Indian and Alaska Native
Residents with income below the poverty level (%) - Multirace
Residents with income below the poverty level (%) - Other Race
Air pollution - Air Quality Index (AQI)
Air pollution - CO
Air pollution - NO2
Air pollution - SO2
Air pollution - Ozone
Air pollution - PM10
Air pollution - PM25
Air pollution - Pb
Crime - Murders per 100,000 population
Crime - Rapes per 100,000 population
Crime - Robberies per 100,000 population
Crime - Assaults per 100,000 population
Crime - Burglaries per 100,000 population
Crime - Thefts per 100,000 population
Crime - Auto thefts per 100,000 population
Crime - Arson per 100,000 population
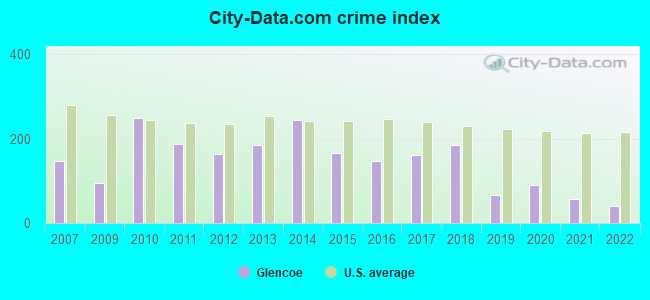
Crime - City-data.com crime index
Crime - Violent crime index
Crime - Property crime index
Crime - Murders per 100,000 population (5 year average)
Crime - Rapes per 100,000 population (5 year average)
Crime - Robberies per 100,000 population (5 year average)
Crime - Assaults per 100,000 population (5 year average)
Crime - Burglaries per 100,000 population (5 year average)
Crime - Thefts per 100,000 population (5 year average)
Crime - Auto thefts per 100,000 population (5 year average)
Crime - Arson per 100,000 population (5 year average)
Crime - City-data.com crime index (5 year average)
Crime - Violent crime index (5 year average)
Crime - Property crime index (5 year average)
1996 Presidential Elections Results (%) - Democratic Party (Clinton)
1996 Presidential Elections Results (%) - Republican Party (Dole)
1996 Presidential Elections Results (%) - Other
2000 Presidential Elections Results (%) - Democratic Party (Gore)
2000 Presidential Elections Results (%) - Republican Party (Bush)
2000 Presidential Elections Results (%) - Other
2004 Presidential Elections Results (%) - Democratic Party (Kerry)
2004 Presidential Elections Results (%) - Republican Party (Bush)
2004 Presidential Elections Results (%) - Other
2008 Presidential Elections Results (%) - Democratic Party (Obama)
2008 Presidential Elections Results (%) - Republican Party (McCain)
2008 Presidential Elections Results (%) - Other
2012 Presidential Elections Results (%) - Democratic Party (Obama)
2012 Presidential Elections Results (%) - Republican Party (Romney)
2012 Presidential Elections Results (%) - Other
2016 Presidential Elections Results (%) - Democratic Party (Clinton)
2016 Presidential Elections Results (%) - Republican Party (Trump)
2016 Presidential Elections Results (%) - Other
2020 Presidential Elections Results (%) - Democratic Party (Biden)
2020 Presidential Elections Results (%) - Republican Party (Trump)
2020 Presidential Elections Results (%) - Other
Ancestries Reported - Arab (%)
Ancestries Reported - Czech (%)
Ancestries Reported - Danish (%)
Ancestries Reported - Dutch (%)
Ancestries Reported - English (%)
Ancestries Reported - French (%)
Ancestries Reported - French Canadian (%)
Ancestries Reported - German (%)
Ancestries Reported - Greek (%)
Ancestries Reported - Hungarian (%)
Ancestries Reported - Irish (%)
Ancestries Reported - Italian (%)
Ancestries Reported - Lithuanian (%)
Ancestries Reported - Norwegian (%)
Ancestries Reported - Polish (%)
Ancestries Reported - Portuguese (%)
Ancestries Reported - Russian (%)
Ancestries Reported - Scotch-Irish (%)
Ancestries Reported - Scottish (%)
Ancestries Reported - Slovak (%)
Ancestries Reported - Subsaharan African (%)
Ancestries Reported - Swedish (%)
Ancestries Reported - Swiss (%)
Ancestries Reported - Ukrainian (%)
Ancestries Reported - United States (%)
Ancestries Reported - Welsh (%)
Ancestries Reported - West Indian (%)
Ancestries Reported - Other (%)
Educational Attainment - No schooling completed (%)
Educational Attainment - Less than high school (%)
Educational Attainment - High school or equivalent (%)
Educational Attainment - Less than 1 year of college (%)
Educational Attainment - 1 or more years of college (%)
Educational Attainment - Associate degree (%)
Educational Attainment - Bachelor's degree (%)
Educational Attainment - Master's degree (%)
Educational Attainment - Professional school degree (%)
Educational Attainment - Doctorate degree (%)
School Enrollment - Nursery, preschool (%)
School Enrollment - Kindergarten (%)
School Enrollment - Grade 1 to 4 (%)
School Enrollment - Grade 5 to 8 (%)
School Enrollment - Grade 9 to 12 (%)
School Enrollment - College undergrad (%)
School Enrollment - Graduate or professional (%)
School Enrollment - Not enrolled in school (%)
School enrollment - Public schools (%)
School enrollment - Private schools (%)
School enrollment - Not enrolled (%)
Median number of rooms in houses and condos
Median number of rooms in apartments
Housing units lacking complete plumbing facilities (%)
Housing units lacking complete kitchen facilities (%)
Density of houses
Urban houses (%)
Rural houses (%)
Households with people 60 years and over (%)
Households with people 65 years and over (%)
Households with people 75 years and over (%)
Households with one or more nonrelatives (%)
Households with no nonrelatives (%)
Population in households (%)
Family households (%)
Nonfamily households (%)
Population in families (%)
Family households with own children (%)
Median number of bedrooms in owner occupied houses
Mean number of bedrooms in owner occupied houses
Median number of bedrooms in renter occupied houses
Mean number of bedrooms in renter occupied houses
Median number of vehichles in owner occupied houses
Mean number of vehichles in owner occupied houses
Median number of vehichles in renter occupied houses
Mean number of vehichles in renter occupied houses
Mortgage status - with mortgage (%)
Mortgage status - with second mortgage (%)
Mortgage status - with home equity loan (%)
Mortgage status - with both second mortgage and home equity loan (%)
Mortgage status - without a mortgage (%)
Average family size
Average family size - White
Average family size - Black or African American
Average family size - Asian
Average family size - Hispanic or Latino
Average family size - American Indian and Alaska Native
Average family size - Multirace
Average family size - Other Race
Geographical mobility - Same house 1 year ago (%)
Geographical mobility - Moved within same county (%)
Geographical mobility - Moved from different county within same state (%)
Geographical mobility - Moved from different state (%)
Geographical mobility - Moved from abroad (%)
Place of birth - Born in state of residence (%)
Place of birth - Born in other state (%)
Place of birth - Native, outside of US (%)
Place of birth - Foreign born (%)
Housing units in structures - 1, detached (%)
Housing units in structures - 1, attached (%)
Housing units in structures - 2 (%)
Housing units in structures - 3 or 4 (%)
Housing units in structures - 5 to 9 (%)
Housing units in structures - 10 to 19 (%)
Housing units in structures - 20 to 49 (%)
Housing units in structures - 50 or more (%)
Housing units in structures - Mobile home (%)
Housing units in structures - Boat, RV, van, etc. (%)
House/condo owner moved in on average (years ago)
Renter moved in on average (years ago)
Year householder moved into unit - Moved in 1999 to March 2000 (%)
Year householder moved into unit - Moved in 1995 to 1998 (%)
Year householder moved into unit - Moved in 1990 to 1994 (%)
Year householder moved into unit - Moved in 1980 to 1989 (%)
Year householder moved into unit - Moved in 1970 to 1979 (%)
Year householder moved into unit - Moved in 1969 or earlier (%)
Means of transportation to work - Drove car alone (%)
Means of transportation to work - Carpooled (%)
Means of transportation to work - Public transportation (%)
Means of transportation to work - Bus or trolley bus (%)
Means of transportation to work - Streetcar or trolley car (%)
Means of transportation to work - Subway or elevated (%)
Means of transportation to work - Railroad (%)
Means of transportation to work - Ferryboat (%)
Means of transportation to work - Taxicab (%)
Means of transportation to work - Motorcycle (%)
Means of transportation to work - Bicycle (%)
Means of transportation to work - Walked (%)
Means of transportation to work - Other means (%)
Working at home (%)
Industry diversity
Most Common Industries - Agriculture, forestry, fishing and hunting, and mining (%)
Most Common Industries - Agriculture, forestry, fishing and hunting (%)
Most Common Industries - Mining, quarrying, and oil and gas extraction (%)
Most Common Industries - Construction (%)
Most Common Industries - Manufacturing (%)
Most Common Industries - Wholesale trade (%)
Most Common Industries - Retail trade (%)
Most Common Industries - Transportation and warehousing, and utilities (%)
Most Common Industries - Transportation and warehousing (%)
Most Common Industries - Utilities (%)
Most Common Industries - Information (%)
Most Common Industries - Finance and insurance, and real estate and rental and leasing (%)
Most Common Industries - Finance and insurance (%)
Most Common Industries - Real estate and rental and leasing (%)
Most Common Industries - Professional, scientific, and management, and administrative and waste management services (%)
Most Common Industries - Professional, scientific, and technical services (%)
Most Common Industries - Management of companies and enterprises (%)
Most Common Industries - Administrative and support and waste management services (%)
Most Common Industries - Educational services, and health care and social assistance (%)
Most Common Industries - Educational services (%)
Most Common Industries - Health care and social assistance (%)
Most Common Industries - Arts, entertainment, and recreation, and accommodation and food services (%)
Most Common Industries - Arts, entertainment, and recreation (%)
Most Common Industries - Accommodation and food services (%)
Most Common Industries - Other services, except public administration (%)
Most Common Industries - Public administration (%)
Occupation diversity
Most Common Occupations - Management, business, science, and arts occupations (%)
Most Common Occupations - Management, business, and financial occupations (%)
Most Common Occupations - Management occupations (%)
Most Common Occupations - Business and financial operations occupations (%)
Most Common Occupations - Computer, engineering, and science occupations (%)
Most Common Occupations - Computer and mathematical occupations (%)
Most Common Occupations - Architecture and engineering occupations (%)
Most Common Occupations - Life, physical, and social science occupations (%)
Most Common Occupations - Education, legal, community service, arts, and media occupations (%)
Most Common Occupations - Community and social service occupations (%)
Most Common Occupations - Legal occupations (%)
Most Common Occupations - Education, training, and library occupations (%)
Most Common Occupations - Arts, design, entertainment, sports, and media occupations (%)
Most Common Occupations - Healthcare practitioners and technical occupations (%)
Most Common Occupations - Health diagnosing and treating practitioners and other technical occupations (%)
Most Common Occupations - Health technologists and technicians (%)
Most Common Occupations - Service occupations (%)
Most Common Occupations - Healthcare support occupations (%)
Most Common Occupations - Protective service occupations (%)
Most Common Occupations - Fire fighting and prevention, and other protective service workers including supervisors (%)
Most Common Occupations - Law enforcement workers including supervisors (%)
Most Common Occupations - Food preparation and serving related occupations (%)
Most Common Occupations - Building and grounds cleaning and maintenance occupations (%)
Most Common Occupations - Personal care and service occupations (%)
Most Common Occupations - Sales and office occupations (%)
Most Common Occupations - Sales and related occupations (%)
Most Common Occupations - Office and administrative support occupations (%)
Most Common Occupations - Natural resources, construction, and maintenance occupations (%)
Most Common Occupations - Farming, fishing, and forestry occupations (%)
Most Common Occupations - Construction and extraction occupations (%)
Most Common Occupations - Installation, maintenance, and repair occupations (%)
Most Common Occupations - Production, transportation, and material moving occupations (%)
Most Common Occupations - Production occupations (%)
Most Common Occupations - Transportation occupations (%)
Most Common Occupations - Material moving occupations (%)
People in Group quarters - Institutionalized population (%)
People in Group quarters - Correctional institutions (%)
People in Group quarters - Federal prisons and detention centers (%)
People in Group quarters - Halfway houses (%)
People in Group quarters - Local jails and other confinement facilities (including police lockups) (%)
People in Group quarters - Military disciplinary barracks (%)
People in Group quarters - State prisons (%)
People in Group quarters - Other types of correctional institutions (%)
People in Group quarters - Nursing homes (%)
People in Group quarters - Hospitals/wards, hospices, and schools for the handicapped (%)
People in Group quarters - Hospitals/wards and hospices for chronically ill (%)
People in Group quarters - Hospices or homes for chronically ill (%)
People in Group quarters - Military hospitals or wards for chronically ill (%)
People in Group quarters - Other hospitals or wards for chronically ill (%)
People in Group quarters - Hospitals or wards for drug/alcohol abuse (%)
People in Group quarters - Mental (Psychiatric) hospitals or wards (%)
People in Group quarters - Schools, hospitals, or wards for the mentally retarded (%)
People in Group quarters - Schools, hospitals, or wards for the physically handicapped (%)
People in Group quarters - Institutions for the deaf (%)
People in Group quarters - Institutions for the blind (%)
People in Group quarters - Orthopedic wards and institutions for the physically handicapped (%)
People in Group quarters - Wards in general hospitals for patients who have no usual home elsewhere (%)
People in Group quarters - Wards in military hospitals for patients who have no usual home elsewhere (%)
People in Group quarters - Juvenile institutions (%)
People in Group quarters - Long-term care (%)
People in Group quarters - Homes for abused, dependent, and neglected children (%)
People in Group quarters - Residential treatment centers for emotionally disturbed children (%)
People in Group quarters - Training schools for juvenile delinquents (%)
People in Group quarters - Short-term care, detention or diagnostic centers for delinquent children (%)
People in Group quarters - Type of juvenile institution unknown (%)
People in Group quarters - Noninstitutionalized population (%)
People in Group quarters - College dormitories (includes college quarters off campus) (%)
People in Group quarters - Military quarters (%)
People in Group quarters - On base (%)
People in Group quarters - Barracks, unaccompanied personnel housing (UPH), (Enlisted/Officer), ;and similar group living quarters for military personnel (%)
People in Group quarters - Transient quarters for temporary residents (%)
People in Group quarters - Military ships (%)
People in Group quarters - Group homes (%)
People in Group quarters - Homes or halfway houses for drug/alcohol abuse (%)
People in Group quarters - Homes for the mentally ill (%)
People in Group quarters - Homes for the mentally retarded (%)
People in Group quarters - Homes for the physically handicapped (%)
People in Group quarters - Other group homes (%)
People in Group quarters - Religious group quarters (%)
People in Group quarters - Dormitories (%)
People in Group quarters - Agriculture workers' dormitories on farms (%)
People in Group quarters - Job Corps and vocational training facilities (%)
People in Group quarters - Other workers' dormitories (%)
People in Group quarters - Crews of maritime vessels (%)
People in Group quarters - Other nonhousehold living situations (%)
People in Group quarters - Other noninstitutional group quarters (%)
Residents speaking English at home (%)
Residents speaking English at home - Born in the United States (%)
Residents speaking English at home - Native, born elsewhere (%)
Residents speaking English at home - Foreign born (%)
Residents speaking Spanish at home (%)
Residents speaking Spanish at home - Born in the United States (%)
Residents speaking Spanish at home - Native, born elsewhere (%)
Residents speaking Spanish at home - Foreign born (%)
Residents speaking other language at home (%)
Residents speaking other language at home - Born in the United States (%)
Residents speaking other language at home - Native, born elsewhere (%)
Residents speaking other language at home - Foreign born (%)
Class of Workers - Employee of private company (%)
Class of Workers - Self-employed in own incorporated business (%)
Class of Workers - Private not-for-profit wage and salary workers (%)
Class of Workers - Local government workers (%)
Class of Workers - State government workers (%)
Class of Workers - Federal government workers (%)
Class of Workers - Self-employed workers in own not incorporated business and Unpaid family workers (%)
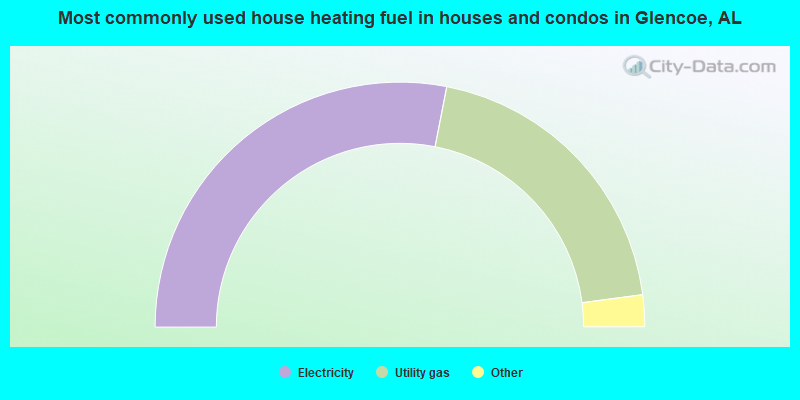
House heating fuel used in houses and condos - Utility gas (%)
House heating fuel used in houses and condos - Bottled, tank, or LP gas (%)
House heating fuel used in houses and condos - Electricity (%)
House heating fuel used in houses and condos - Fuel oil, kerosene, etc. (%)
House heating fuel used in houses and condos - Coal or coke (%)
House heating fuel used in houses and condos - Wood (%)
House heating fuel used in houses and condos - Solar energy (%)
House heating fuel used in houses and condos - Other fuel (%)
House heating fuel used in houses and condos - No fuel used (%)
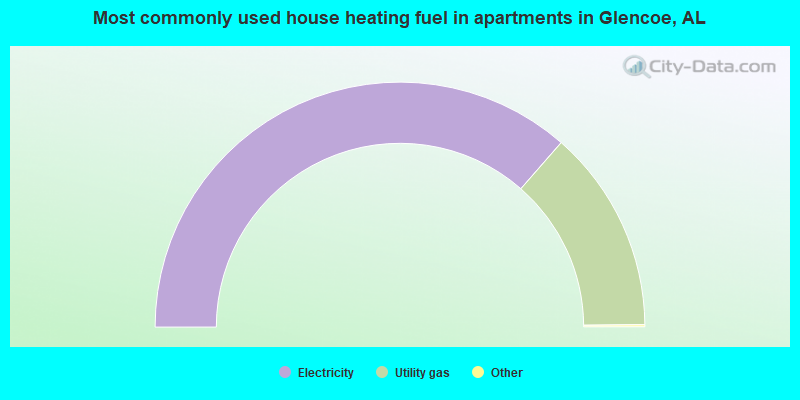
House heating fuel used in apartments - Utility gas (%)
House heating fuel used in apartments - Bottled, tank, or LP gas (%)
House heating fuel used in apartments - Electricity (%)
House heating fuel used in apartments - Fuel oil, kerosene, etc. (%)
House heating fuel used in apartments - Coal or coke (%)
House heating fuel used in apartments - Wood (%)
House heating fuel used in apartments - Solar energy (%)
House heating fuel used in apartments - Other fuel (%)
House heating fuel used in apartments - No fuel used (%)
Armed forces status - In Armed Forces (%)
Armed forces status - Civilian (%)
Armed forces status - Civilian - Veteran (%)
Armed forces status - Civilian - Nonveteran (%)
Fatal accidents locations in years 2005-2021
Fatal accidents locations in 2005
Fatal accidents locations in 2006
Fatal accidents locations in 2007
Fatal accidents locations in 2008
Fatal accidents locations in 2009
Fatal accidents locations in 2010
Fatal accidents locations in 2011
Fatal accidents locations in 2012
Fatal accidents locations in 2013
Fatal accidents locations in 2014
Fatal accidents locations in 2015
Fatal accidents locations in 2016
Fatal accidents locations in 2017
Fatal accidents locations in 2018
Fatal accidents locations in 2019
Fatal accidents locations in 2020
Fatal accidents locations in 2021
Alcohol use - People drinking some alcohol every month (%)
Alcohol use - People not drinking at all (%)
Alcohol use - Average days/month drinking alcohol
Alcohol use - Average drinks/week
Alcohol use - Average days/year people drink much
Audiometry - Average condition of hearing (%)
Audiometry - People that can hear a whisper from across a quiet room (%)
Audiometry - People that can hear normal voice from across a quiet room (%)
Audiometry - Ears ringing, roaring, buzzing (%)
Audiometry - Had a job exposure to loud noise (%)
Audiometry - Had off-work exposure to loud noise (%)
Blood Pressure & Cholesterol - Has high blood pressure (%)
Blood Pressure & Cholesterol - Checking blood pressure at home (%)
Blood Pressure & Cholesterol - Frequently checking blood cholesterol (%)
Blood Pressure & Cholesterol - Has high cholesterol level (%)
Consumer Behavior - Money monthly spent on food at supermarket/grocery store
Consumer Behavior - Money monthly spent on food at other stores
Consumer Behavior - Money monthly spent on eating out
Consumer Behavior - Money monthly spent on carryout/delivered foods
Consumer Behavior - Income spent on food at supermarket/grocery store (%)
Consumer Behavior - Income spent on food at other stores (%)
Consumer Behavior - Income spent on eating out (%)
Consumer Behavior - Income spent on carryout/delivered foods (%)
Current Health Status - General health condition (%)
Current Health Status - Blood donors (%)
Current Health Status - Has blood ever tested for HIV virus (%)
Current Health Status - Left-handed people (%)
Dermatology - People using sunscreen (%)
Diabetes - Diabetics (%)
Diabetes - Had a blood test for high blood sugar (%)
Diabetes - People taking insulin (%)
Diet Behavior & Nutrition - Diet health (%)
Diet Behavior & Nutrition - Milk product consumption (# of products/month)
Diet Behavior & Nutrition - Meals not home prepared (#/week)
Diet Behavior & Nutrition - Meals from fast food or pizza place (#/week)
Diet Behavior & Nutrition - Ready-to-eat foods (#/month)
Diet Behavior & Nutrition - Frozen meals/pizza (#/month)
Drug Use - People that ever used marijuana or hashish (%)
Drug Use - Ever used hard drugs (%)
Drug Use - Ever used any form of cocaine (%)
Drug Use - Ever used heroin (%)
Drug Use - Ever used methamphetamine (%)
Health Insurance - People covered by health insurance (%)
Kidney Conditions-Urology - Avg. # of times urinating at night
Medical Conditions - People with asthma (%)
Medical Conditions - People with anemia (%)
Medical Conditions - People with psoriasis (%)
Medical Conditions - People with overweight (%)
Medical Conditions - Elderly people having difficulties in thinking or remembering (%)
Medical Conditions - People who ever received blood transfusion (%)
Medical Conditions - People having trouble seeing even with glass/contacts (%)
Medical Conditions - People with arthritis (%)
Medical Conditions - People with gout (%)
Medical Conditions - People with congestive heart failure (%)
Medical Conditions - People with coronary heart disease (%)
Medical Conditions - People with angina pectoris (%)
Medical Conditions - People who ever had heart attack (%)
Medical Conditions - People who ever had stroke (%)
Medical Conditions - People with emphysema (%)
Medical Conditions - People with thyroid problem (%)
Medical Conditions - People with chronic bronchitis (%)
Medical Conditions - People with any liver condition (%)
Medical Conditions - People who ever had cancer or malignancy (%)
Mental Health - People who have little interest in doing things (%)
Mental Health - People feeling down, depressed, or hopeless (%)
Mental Health - People who have trouble sleeping or sleeping too much (%)
Mental Health - People feeling tired or having little energy (%)
Mental Health - People with poor appetite or overeating (%)
Mental Health - People feeling bad about themself (%)
Mental Health - People who have trouble concentrating on things (%)
Mental Health - People moving or speaking slowly or too fast (%)
Mental Health - People having thoughts they would be better off dead (%)
Oral Health - Average years since last visit a dentist
Oral Health - People embarrassed because of mouth (%)
Oral Health - People with gum disease (%)
Oral Health - General health of teeth and gums (%)
Oral Health - Average days a week using dental floss/device
Oral Health - Average days a week using mouthwash for dental problem
Oral Health - Average number of teeth
Pesticide Use - Households using pesticides to control insects (%)
Pesticide Use - Households using pesticides to kill weeds (%)
Physical Activity - People doing vigorous-intensity work activities (%)
Physical Activity - People doing moderate-intensity work activities (%)
Physical Activity - People walking or bicycling (%)
Physical Activity - People doing vigorous-intensity recreational activities (%)
Physical Activity - People doing moderate-intensity recreational activities (%)
Physical Activity - Average hours a day doing sedentary activities
Physical Activity - Average hours a day watching TV or videos
Physical Activity - Average hours a day using computer
Physical Functioning - People having limitations keeping them from working (%)
Physical Functioning - People limited in amount of work they can do (%)
Physical Functioning - People that need special equipment to walk (%)
Physical Functioning - People experiencing confusion/memory problems (%)
Physical Functioning - People requiring special healthcare equipment (%)
Prescription Medications - Average number of prescription medicines taking
Preventive Aspirin Use - Adults 40+ taking low-dose aspirin (%)
Reproductive Health - Vaginal deliveries (%)
Reproductive Health - Cesarean deliveries (%)
Reproductive Health - Deliveries resulted in a live birth (%)
Reproductive Health - Pregnancies resulted in a delivery (%)
Reproductive Health - Women breastfeeding newborns (%)
Reproductive Health - Women that had a hysterectomy (%)
Reproductive Health - Women that had both ovaries removed (%)
Reproductive Health - Women that have ever taken birth control pills (%)
Reproductive Health - Women taking birth control pills (%)
Reproductive Health - Women that have ever used Depo-Provera or injectables (%)
Reproductive Health - Women that have ever used female hormones (%)
Sexual Behavior - People 18+ that ever had sex (vaginal, anal, or oral) (%)
Sexual Behavior - Males 18+ that ever had vaginal sex with a woman (%)
Sexual Behavior - Males 18+ that ever performed oral sex on a woman (%)
Sexual Behavior - Males 18+ that ever had anal sex with a woman (%)
Sexual Behavior - Males 18+ that ever had any sex with a man (%)
Sexual Behavior - Females 18+ that ever had vaginal sex with a man (%)
Sexual Behavior - Females 18+ that ever performed oral sex on a man (%)
Sexual Behavior - Females 18+ that ever had anal sex with a man (%)
Sexual Behavior - Females 18+ that ever had any kind of sex with a woman (%)
Sexual Behavior - Average age people first had sex
Sexual Behavior - Average number of female sex partners in lifetime (males 18+)
Sexual Behavior - Average number of female vaginal sex partners in lifetime (males 18+)
Sexual Behavior - Average age people first performed oral sex on a woman (18+)
Sexual Behavior - Average number of woman performed oral sex on in lifetime (18+)
Sexual Behavior - Average number of male sex partners in lifetime (males 18+)
Sexual Behavior - Average number of male anal sex partners in lifetime (males 18+)
Sexual Behavior - Average age people first performed oral sex on a man (18+)
Sexual Behavior - Average number of male oral sex partners in lifetime (18+)
Sexual Behavior - People using protection when performing oral sex (%)
Sexual Behavior - Average number of times people have vaginal or anal sex a year
Sexual Behavior - People having sex without condom (%)
Sexual Behavior - Average number of male sex partners in lifetime (females 18+)
Sexual Behavior - Average number of male vaginal sex partners in lifetime (females 18+)
Sexual Behavior - Average number of female sex partners in lifetime (females 18+)
Sexual Behavior - Circumcised males 18+ (%)
Sleep Disorders - Average hours sleeping at night
Sleep Disorders - People that has trouble sleeping (%)
Smoking-Cigarette Use - People smoking cigarettes (%)
Taste & Smell - People 40+ having problems with smell (%)
Taste & Smell - People 40+ having problems with taste (%)
Taste & Smell - People 40+ that ever had wisdom teeth removed (%)
Taste & Smell - People 40+ that ever had tonsils teeth removed (%)
Taste & Smell - People 40+ that ever had a loss of consciousness because of a head injury (%)
Taste & Smell - People 40+ that ever had a broken nose or other serious injury to face or skull (%)
Taste & Smell - People 40+ that ever had two or more sinus infections (%)
Weight - Average height (inches)
Weight - Average weight (pounds)
Weight - Average BMI
Weight - People that are obese (%)
Weight - People that ever were obese (%)
Weight - People trying to lose weight (%)
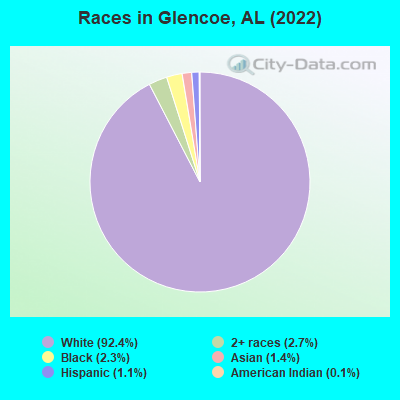
4,925 92.4% White alone 146 2.7% Two or more races 122 2.3% Black alone 72 1.4% Asian alone 57 1.1% Hispanic 6 0.1% American Indian alone
According to our research of Alabama and other state lists, there were 14 registered sex offenders living in Glencoe, Alabama as of June 16, 2024 . The ratio of all residents to sex offenders in Glencoe is 368 to 1.The ratio of registered sex offenders to all residents in this city is near the state average.
Officers per 1,000 residents here:
1.97Alabama average:
2.40
Latest news from Glencoe, AL collected exclusively by city-data.com from local newspapers, TV, and radio stations
Ancestries: American (58.8%), English (5.8%), Irish (4.7%), German (2.3%), Welsh (1.2%).
Current Local Time:
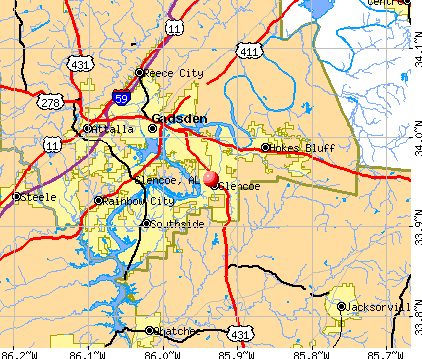
Land area: 16.1 square miles.
Population density: 334 people per square mile (very low).
94 residents are foreign born
This city:
1.8%Alabama:
3.5%
Median real estate property taxes paid for housing units with mortgages in 2022: $615 (0.3%)Median real estate property taxes paid for housing units with no mortgage in 2022: $748 (0.5%)
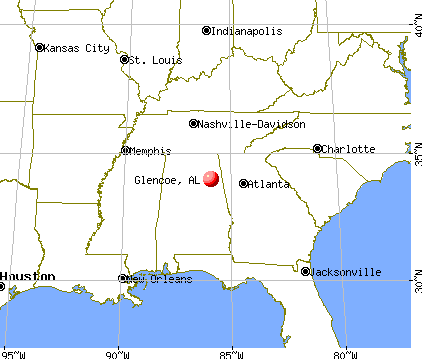
Nearest city with pop. 50,000+: Birmingham, AL
Nearest city with pop. 1,000,000+: Chicago, IL
Nearest cities:
Latitude: 33.95 N, Longitude: 85.94 W
Area code commonly used in this area: 256
Single-family new house construction building permits:
2022: 21 buildings , average cost: $287,9002021: 14 buildings , average cost: $213,6002020: 11 buildings , average cost: $81,1002019: 7 buildings , average cost: $163,1002018: 4 buildings , average cost: $62,5002017: 5 buildings , average cost: $190,0002016: 10 buildings , average cost: $119,9002015: 9 buildings , average cost: $119,9002014: 7 buildings , average cost: $119,9002013: 7 buildings , average cost: $119,9002012: 9 buildings , average cost: $110,1002011: 16 buildings , average cost: $73,5002010: 16 buildings , average cost: $73,5002009: 16 buildings , average cost: $73,5002008: 23 buildings , average cost: $110,0002007: 31 buildings , average cost: $130,0002006: 28 buildings , average cost: $84,6002005: 31 buildings , average cost: $105,0002004: 23 buildings , average cost: $85,3002003: 13 buildings , average cost: $79,5002002: 29 buildings , average cost: $92,9002001: 18 buildings , average cost: $99,3002000: 16 buildings , average cost: $98,5001999: 18 buildings , average cost: $92,7001998: 25 buildings , average cost: $102,4001997: 14 buildings , average cost: $84,600Unemployment in December 2023:
Population change in the 1990s: +427 (+9.0%).
Most common occupations in Glencoe, AL (%)
Both Males Females
Driver/sales workers and truck drivers (6.3%)
Other production occupations, including supervisors (5.9%)
Preschool, kindergarten, elementary, and middle school teachers (5.8%)
Secretaries and administrative assistants (5.3%)
Other sales and related occupations, including supervisors (5.2%)
Electrical equipment mechanics and other installation, maintenance, and repair workers, including supervisors (4.0%)
Material recording, scheduling, dispatching, and distributing workers (4.0%)
Driver/sales workers and truck drivers (10.5%)
Other production occupations, including supervisors (7.8%)
Other sales and related occupations, including supervisors (6.8%)
Electrical equipment mechanics and other installation, maintenance, and repair workers, including supervisors (6.7%)
Construction traders workers except carpenters, electricians, painters, plumbers, and construction laborers (5.5%)
Laborers and material movers, hand (5.1%)
Other management occupations, except farmers and farm managers (5.1%)
Preschool, kindergarten, elementary, and middle school teachers (11.9%)
Secretaries and administrative assistants (11.6%)
Registered nurses (6.7%)
Other office and administrative support workers, including supervisors (6.3%)
Health technologists and technicians (4.6%)
Cashiers (4.6%)
Customer service representatives (4.2%)
Air pollution and air quality trends(lower is better)
AQI Ozone PM2.5
Tornado activity:
Glencoe-area historical tornado activity is slightly above Alabama state average. It is 144% greater than the overall U.S. average.
On 3/27/1994, a category F4 (max. wind speeds 207-260 mph) tornado 20.3 miles away from the Glencoe city center killed 22 people and injured 150 people and caused between $5,000,000 and $50,000,000 in damages.
On 11/24/2001, a category F4 tornado 21.5 miles away from the city center injured 22 people and caused $1 million in damages.
Earthquake activity:
Glencoe-area historical earthquake activity is significantly above Alabama state average. It is 111% greater than the overall U.S. average. On 4/29/2003 at 08:59:39, a magnitude 4.9 (4.4 MB, 4.6 MW, 4.9 LG, Class: Light, Intensity: IV - V) earthquake occurred 41.3 miles away from Glencoe center On 4/29/2003 at 08:59:39, a magnitude 4.6 (4.6 MW, Depth: 12.3 mi) earthquake occurred 41.3 miles away from the city center On 1/18/1999 at 07:00:53, a magnitude 4.8 (4.8 MB, 4.0 LG, Depth: 0.6 mi) earthquake occurred 84.9 miles away from Glencoe center On 6/24/1975 at 11:11:36, a magnitude 4.5 (4.5 MB) earthquake occurred 110.6 miles away from the city center On 8/2/1974 at 08:52:09, a magnitude 4.9 (4.3 MB, 4.9 LG) earthquake occurred 198.0 miles away from Glencoe center On 11/30/1973 at 07:48:41, a magnitude 4.7 (4.7 MB, 4.6 ML) earthquake occurred 169.8 miles away from Glencoe center Magnitude types: regional Lg-wave magnitude (LG), body-wave magnitude (MB), local magnitude (ML), moment magnitude (MW) Natural disasters: The number of natural disasters in Etowah County (25) is a lot greater than the US average (15).Major Disasters (Presidential) Declared: 16Emergencies Declared: 5Storms: 14, Tornadoes: 11, Floods: 10, Hurricanes: 4, Winds: 4, Winter Storms: 2, Drought: 1, Fire: 1, Freeze: 1, Snowfall: 1, Other: 1 (Note: some incidents may be assigned to more than one category). Hospitals and medical centers in Glencoe: COOSA VALLEY HEALTH CARE (513 PINEVIEW AVENUE)
Other hospitals and medical centers near Glencoe: GADSDEN REGIONAL MEDICAL CENTER (about 5 miles away; GADSDEN, AL)
PCD OF GADSDEN (Dialysis Facility, about 5 miles away; GADSDEN, AL)
MCGUFFEY HEALTH AND REHABILITATION CENTER (Nursing Home, about 5 miles away; GADSDEN, AL)
MCGUFFEY HEALTH CARE CENTER (Nursing Home, about 5 miles away; GADSDEN, AL)
SOUTHERNCARE GADSDEN (Hospital, about 6 miles away; GADSDEN, AL)
RAINBOW CITY DIALYSIS (Dialysis Facility, about 6 miles away; RAINBOW CITY, AL)
GADSDEN HEALTH AND REHAB CENTER (Nursing Home, about 6 miles away; GADSDEN, AL)
Colleges/universities with over 2000 students nearest to Glencoe:
Gadsden State Community College (about 5 miles; Gadsden, AL ; Full-time enrollment: 4,650)
Jacksonville State University (about 14 miles; Jacksonville, AL ; FT enrollment: 7,566)
Snead State Community College (about 22 miles; Boaz, AL ; FT enrollment: 2,023)
Northeast Alabama Community College (about 41 miles; Rainsville, AL ; FT enrollment: 2,409)
Georgia Highlands College (about 45 miles; Rome, GA ; FT enrollment: 4,071)
West Georgia Technical College (about 47 miles; Waco, GA ; FT enrollment: 4,768)
Georgia Northwestern Technical College (about 48 miles; Rome, GA ; FT enrollment: 4,629)
Public high school in Glencoe:
Public elementary/middle schools in Glencoe:
See full list of schools located in Glencoe
Notable locations in Glencoe: (A) , Rock Spring Junction (B) , Walker Gap (C) , Glencoe Fire Department (D) . Display/hide their locations on the map
Churches in Glencoe include: (A) , Heath Missionary Baptist Church (B) , Smiths Temple Holiness Church (C) , North Glencoe Baptist Church (D) , Holy Ghost Revival Center (E) , Green Valley Christian Holiness Church (F) , Goodyear Heights Baptist Church (G) , Glencoe First Methodist Church (H) , Glencoe First Baptist Church (I) . Display/hide their locations on the map
Cemetery: (1) . Display/hide its location on the map
Etowah County has a predicted average indoor radon screening level between 2 and 4 pCi/L (pico curies per liter) - Moderate Potential Drinking water stations with addresses in Glencoe and their reported violations in the past:
GLENCOE WATER WORKS BOARD (Address: 203 W. CHASTAIN BLVD. Population served: 6,450, Groundwater):
Past monitoring violations:
22 regular monitoring violations
Average household size: This city:
2.4 peopleAlabama:
2.5 people
Percentage of family households: This city:
69.9%Whole state:
67.8%
Percentage of households with unmarried partners: This city:
4.3%Whole state:
4.7%
Likely homosexual households (counted as self-reported same-sex unmarried-partner households)
Lesbian couples: 0.3% of all households Gay men: 0.5% of all households
112 people in nursing homes in 2000people in other noninstitutional group quarters in 2000
Banks with branches in Glencoe (2011 data):
Regions Bank: Glencoe Branch at 510 West Main Street, branch established on 1974/04/30. Info updated 2011/02/24: Bank assets: $123,368.2 mil, Deposits: $98,301.3 mil, headquarters in Birmingham, AL, positive income , Commercial Lending Specialization, 1778 total offices , Holding Company: Regions Financial Corporation
For population 15 years and over in Glencoe:
Never married: 18.8%Now married: 62.8%Separated: 0.4%Widowed: 8.1%Divorced: 9.9% For population 25 years and over in Glencoe:
High school or higher: 94.5%Bachelor's degree or higher: 23.4%Graduate or professional degree: 12.1%Unemployed: 3.7%Mean travel time to work (commute): 25.0 minutes
Education Gini index (Inequality in education) Here:
10.7Alabama average:
11.5
Religion statistics for Glencoe, AL (based on Etowah County data)
Religion Adherents Congregations Evangelical Protestant 64,316 193 Catholic 7,624 1 Mainline Protestant 5,816 35 Black Protestant 4,813 21 Other 1,437 6 None 20,424 -
Source: Clifford Grammich, Kirk Hadaway, Richard Houseal, Dale E.Jones, Alexei Krindatch, Richie Stanley and Richard H.Taylor. 2012. 2010 U.S.Religion Census: Religious Congregations & Membership Study. Association of Statisticians of American Religious Bodies. Jones, Dale E., et al. 2002. Congregations and Membership in the United States 2000. Nashville, TN: Glenmary Research Center. Graphs represent county-level data
Food Environment Statistics: Number of grocery stores : 25This county :
2.43 / 10,000 pop.Alabama :
1.89 / 10,000 pop.
Number of convenience stores (no gas) : 8This county :
0.78 / 10,000 pop.Alabama :
0.65 / 10,000 pop.
Number of convenience stores (with gas) : 64Etowah County :
6.21 / 10,000 pop.Alabama :
6.32 / 10,000 pop.
Number of full-service restaurants : 51Etowah County :
4.95 / 10,000 pop.Alabama :
5.75 / 10,000 pop.
Adult diabetes rate : This county :
10.7%Alabama :
11.8%
Adult obesity rate : Etowah County :
32.5%Alabama :
31.7%
Low-income preschool obesity rate : Etowah County :
20.2%State :
13.5%
Health and Nutrition:
Average overall health of teeth and gums : Glencoe:
57.5%Alabama:
45.7%
People feeling badly about themselves : This city:
17.3%Alabama:
20.7%
Average hours sleeping at night : Overweight people : This city:
31.7%Alabama:
34.4%
General health condition : Glencoe:
64.2%Alabama:
55.2%
Average condition of hearing : Glencoe:
78.9%Alabama:
79.3%
More about Health and Nutrition of Glencoe, AL Residents
Local government employment and payroll (March 2022)
Function
Full-time employees
Monthly full-time payroll
Average yearly full-time wage
Part-time employees
Monthly part-time payroll
Police Protection - Officers
9 $40,118 $53,491 2 $2,392 Streets and Highways
7 $24,890 $42,669 0 $0 Financial Administration
2 $7,949 $47,694 1 $670 Parks and Recreation
1 $3,162 $37,944 1 $256 Welfare
0 $0 4 $4,224 Firefighters
0 $0 2 $2,579 Local Libraries
0 $0 1 $886 Other Government Administration
0 $0 6 $3,550 Judicial and Legal
0 $0 1 $2,925
Totals for Government
19 $76,119 $48,075 18 $17,482
Glencoe government finances - Expenditure in 2017 (per resident):
Current Operations - Police Protection: $575,000 ($107.08)
General - Other: $572,000 ($106.52)Regular Highways: $484,000 ($90.13)Solid Waste Management: $248,000 ($46.18)Parks and Recreation: $201,000 ($37.43)Financial Administration: $123,000 ($22.91)Judicial and Legal Services: $67,000 ($12.48)Protective Inspection and Regulation - Other: $29,000 ($5.40)Local Fire Protection: $18,000 ($3.35)Health - Other: $13,000 ($2.42)Libraries: $9,000 ($1.68)Correctional Institutions: $8,000 ($1.49)General - Interest on Debt: $165,000 ($30.73)
Total Salaries and Wages: $209,000 ($38.92)
Glencoe government finances - Revenue in 2017 (per resident):
Charges - Solid Waste Management: $369,000 ($68.72)
Parks and Recreation: $5,000 ($0.93)Local Intergovernmental - Other: $10,000 ($1.86)
Miscellaneous - Interest Earnings: $1,000 ($0.19)
State Intergovernmental - Other: $18,000 ($3.35)
Tax - Occupation and Business License - Other: $921,000 ($171.51)
General Sales and Gross Receipts: $863,000 ($160.71)Property: $197,000 ($36.69)Motor Fuels Sales: $75,000 ($13.97)Tobacco Products Sales: $29,000 ($5.40)Motor Vehicle License: $19,000 ($3.54)Alcoholic Beverage Sales: $10,000 ($1.86)
Glencoe government finances - Debt in 2017 (per resident):
Long Term Debt - Outstanding Unspecified Public Purpose: $4,131,000 ($769.27)
Beginning Outstanding - Unspecified Public Purpose: $4,131,000 ($769.27)
Glencoe government finances - Cash and Securities in 2017 (per resident):
Other Funds - Cash and Securities: $2,376,000 ($442.46)
Businesses in Glencoe, AL
Strongest AM radio stations in Glencoe:
WAAX (570 AM; 5 kW; GADSDEN, AL; Owner: CAPSTAR TX LIMITED PARTNERSHIP)
WNSI (810 AM; 50 kW; JACKSONVILLE, AL; Owner: UNITED BROADCASTING NETWORK, INC.)
WJBY (930 AM; 5 kW; RAINBOW CITY, AL; Owner: GADSDEN BROADCASTING COMPANY, INC.)
WGAD (1350 AM; 5 kW; GADSDEN, AL; Owner: DEKALB COUNTY COMMUNITY RADIO, INC.)
WKNG (1060 AM; daytime; 50 kW; TALLAPOOSA, GA; Owner: WKNG, INC.)
WDJC (850 AM; 50 kW; BIRMINGHAM, AL; Owner: KIMTRON, INC.)
WMGJ (1240 AM; 1 kW; GADSDEN, AL; Owner: FLOYD L. DONALD BROADCASTING CO. INC)
WJOX (690 AM; 50 kW; BIRMINGHAM, AL; Owner: CITADEL BROADCASTING COMPANY)
WAPI (1070 AM; 50 kW; BIRMINGHAM, AL; Owner: CITADEL BROADCASTING COMPANY)
WHMA (1390 AM; 5 kW; ANNISTON, AL; Owner: CASEY NETWORK, LLC)
WGST (640 AM; 50 kW; ATLANTA, GA; Owner: CITICASTERS LICENSES, L.P.)
WWAM (820 AM; daytime; 50 kW; JASPER, TN; Owner: SHELTON BROADCASTING SYSTEM)
WFTD (1080 AM; daytime; 50 kW; MARIETTA, GA; Owner: PRIETO ENTERPRISES, INC.)
Strongest FM radio stations in Glencoe:
WGMZ (93.1 FM; GLENCOE, AL; Owner: CAPSTAR TX LIMITED PARTNERSHIP)
WLJS-FM (91.9 FM; JACKSONVILLE, AL; Owner: BD. OF TRUSTEES/JACKSONVILLE STATE UNIVERSITY)
WQSB (105.1 FM; ALBERTVILLE, AL; Owner: SAND MOUNTAIN BROADCASTING SERVICE, INC.)
WSGN (91.5 FM; GADSDEN, AL; Owner: GADSDEN STATE COMMUNITY COLLEGE)
WRHY (105.9 FM; CENTRE, AL; Owner: WILLIAMS COMMUNICATIONS, INC.)
WTBB (89.9 FM; GADSDEN, AL; Owner: TRINITY CHRISTIAN ACADEMY)
WKXX (102.9 FM; ATTALLA, AL; Owner: BROADCAST MEDIA LLC)
WTBJ (91.3 FM; OXFORD, AL; Owner: TRINITY CHRISTIAN ACADEMY)
WVOK-FM (97.9 FM; OXFORD, AL; Owner: WOODARD BROADCASTING CO. INC.)
WGRW (90.7 FM; ANNISTON, AL; Owner: WORD WORKS, INC.)
WRAX (107.7 FM; BIRMINGHAM, AL; Owner: CITADEL BROADCASTING COMPANY)
W269AX (101.7 FM; ANNISTON, AL; Owner: BIBLE BROADCASTING NETWORK, INC.)
WJCK (88.3 FM; PIEDMONT, AL; Owner: IMMANUEL BROADCASTING NETWORK, INC.)
WMAX-FM (105.3 FM; BOWDON, GA; Owner: CLEAR CHANNEL BROADCASTING LICENSES, INC.)
WCKS (102.7 FM; FRUITHURST, AL; Owner: WCKS, INC.)
WTDR (92.7 FM; TALLADEGA, AL; Owner: JACOBS BROADCAST GROUP, INC.)
W269AN (101.7 FM; GADSDEN, AL; Owner: JOHN S. LA TOUR/J & J B/C)
TV broadcast stations around Glencoe:
WPXH (Channel 44; GADSDEN, AL; Owner: PAXSON COMMUNICATIONS LICENSE COMPANY, LLC)
WTJP (Channel 60; GADSDEN, AL; Owner: TRINITY BROADCASTING NETWORK)
W15AP (Channel 15; GADSDEN, AL; Owner: WBRC LICENSE, INC.)
National Bridge Inventory (NBI) Statistics 13 Number of bridges121ft / 37.2m Total length $13,692,000 Total costs69,633 Total average daily traffic5,846 Total average daily truck traffic
New bridges - historical statistics
1 1920-1929 1 1930-1939 2 1950-1959 5 1960-1969 1 1990-1999 2 2000-2009 1 2010-2019
See full National Bridge Inventory statistics for Glencoe, AL
FCC Registered Antenna Towers: 25 (
See the full list of FCC Registered Antenna Towers in Glencoe )
FCC Registered Commercial Land Mobile Towers: 1
.5 Km W Of Colvin Gap 6.9 Km E (Lat: 33.954556 Lon: -85.861083), Call Sign: KPM486, Assigned Frequencies: 455.250 MHz, Grant Date: 07/12/1995, Expiration Date: 04/01/2028, Registrant: Iheartmedia, Inc., 7136 S. Yale Avenue, Suite 501, Tulsa, OK 74136, Phone: (918) 664-4581, Fax: (918) 664-3066, Email:
FCC Registered Broadcast Land Mobile Towers: 2
Lat: 33.886972 Lon: -85.927889, Call Sign: WPVW208, Assigned Frequencies: 463.312 MHz, Grant Date: 08/26/2002, Expiration Date: 08/26/2012, Cancellation Date: 10/27/2012, Certifier: George Brooke-Powell, Registrant: Mccord Communications Inc, 2700 Wills Creek Rd, Gadsden, AL 35904, Phone: (256) 237-6697, Fax: (256) 237-6631Lat: 33.885278 Lon: -85.920722, Call Sign: WQOQ513, Assigned Frequencies: 451.912 MHz, 456.912 MHz, 461.662 MHz, 466.662 MHz, 467.387 MHz, Grant Date: 12/22/2011, Expiration Date: 12/22/2021, Cancellation Date: 02/26/2022, Certifier: Robert Edmonson, Registrant: Cara Enterprises Inc, Las Vegas, NV 89140-0124, Phone: (702) 838-9728, Fax: (702) 363-4607, Email:
FCC Registered Microwave Towers: 4
ROCK SPRING, 2800 E Of Us 431 & 2500 Sse Of Rock Springs (Lat: 33.932500 Lon: -85.903611), Type: Mast, Structure height: 103 m, Call Sign: WMM897, Assigned Frequencies: 6093.45 MHz, 6063.80 MHz, 6123.10 MHz, 6152.75 MHz, 5945.20 MHz, 6063.80 MHz, 6123.10 MHz, 6004.50 MHz, Grant Date: 01/25/2011, Expiration Date: 02/01/2021, Cancellation Date: 11/23/2020, Registrant: Verizon Wireless, 5055 North Point Pkwy, Np2ne Network Engineering, Alpharetta, GA 30022, Phone: (770) 797-1070, Email:
AL0137, 227 Parkwood Lane (Lat: 33.950500 Lon: -85.935417), Type: Tower, Structure height: 58.2 m, Overall height: 60.7 m, Call Sign: WQMH991, Assigned Frequencies: 11075.0 MHz, 17770.0 MHz, Grant Date: 08/12/2010, Expiration Date: 08/12/2020, Cancellation Date: 02/16/2012, Certifier: Dan Mieszala, Registrant: Open Range Communications Inc., 6430 S. Fiddlers Green Circle, Suite 500, Greenwood Village, CO 80111, Phone: (303) 376-2112, Fax: (303) 376-2109, Email:
ROCK SPRINGS, 102 Cellular Tower Road (Birmingham) (9bh0169a) (Lat: 33.933139 Lon: -85.903389), Type: Ltower, Structure height: 80.8 m, Call Sign: WQNG942, Assigned Frequencies: 5974.85 MHz, 5974.85 MHz, 5974.85 MHz, 5974.85 MHz, 5974.85 MHz, 5974.85 MHz, 5974.85 MHz, Grant Date: 11/13/2020, Expiration Date: 02/03/2031, Certifier: Bill Brodeur, Registrant: Mobile Communications America, 4116 1st Ave N,, Birmingham, AL 35222, Phone: (205) 591-8804, Email:
9BH0169A, 102 Cellular Tower Road (Birmingham) (9bh0169a) (Lat: 33.933139 Lon: -85.903389), Type: Ltower, Structure height: 80.8 m, Call Sign: WQPR770, Assigned Frequencies: 10815.0 MHz, 10815.0 MHz, 10815.0 MHz, 10815.0 MHz, 10815.0 MHz, 10815.0 MHz, 10855.0 MHz, 10815.0 MHz, 10855.0 MHz, 10815.0 MHz... (+8 more), Grant Date: 09/13/2022, Expiration Date: 07/31/2032, Cancellation Date: 11/14/2023, Certifier: Dan Menser, Registrant: T-Mobile Usa, Inc., 12920 Se 38th St, Bellevue, WA 98006, Phone: (425) 383-8401, Fax: (425) 383-4040, Email:
FCC Registered Amateur Radio Licenses: 18 (
See the full list of FCC Registered Amateur Radio Licenses in Glencoe )
FAA Registered Aircraft: 7
Aircraft: PIPER PA-28-140 (Category: Land, Seats: 4, Weight: Up to 12,499 Pounds, Speed: 107 mph), Engine: LYCOMING 0-320 SERIES (180 HP) (Reciprocating)N-Number: 1769T, N1769T, N-1769T, Serial Number: 28-7125088, Year manufactured: 1970, Airworthiness Date: 11/25/1970, Certificate Issue Date: 02/11/2019Registrant (Individual): Steve W Caudle, 414 Wallace St, Glencoe, AL 35905Aircraft: CESSNA 172M (Category: Land, Seats: 4, Weight: Up to 12,499 Pounds, Speed: 108 mph), Engine: LYCOMING 0-320 SERIES (180 HP) (4 Cycle)N-Number: 20032, N20032, N-20032, Serial Number: 17260947, Year manufactured: 1972, Airworthiness Date: 09/13/1972, Certificate Issue Date: 02/09/2010Registrant (Individual): Robert T Noone, 7 Silver Lakes Blvd, Glencoe, AL 35905Aircraft: CESSNA 172N (Category: Land, Seats: 4, Weight: Up to 12,499 Pounds, Speed: 105 mph), Engine: LYCOMING 0-320 SERIES (180 HP) (Reciprocating)N-Number: 4698D, N4698D, N-4698D, Serial Number: 17272333, Year manufactured: 1979, Airworthiness Date: 11/21/1990, Certificate Issue Date: 08/06/2014Registrant (LLC): Drm Aviation LLC, 1204 Walker Dr, Glencoe, AL 35905Aircraft: CESSNA 172N (Category: Land, Seats: 4, Weight: Up to 12,499 Pounds, Speed: 105 mph), Engine: LYCOMING 0-320 SERIES (180 HP) (Reciprocating)N-Number: 6198F, N6198F, N-6198F, Serial Number: 17273163, Year manufactured: 1979, Airworthiness Date: 08/25/1979, Certificate Issue Date: 10/13/2020Registrant (LLC): Fox Aviation LLC, 1927 Rabbittown Rd, Glencoe, AL 35905Aircraft: CESSNA 210B (Category: Land, Seats: 4, Weight: Up to 12,499 Pounds, Speed: 141 mph), Engine: CONT MOTOR I0-470 SERIES (260 HP) (Reciprocating)N-Number: 9688X, N9688X, N-9688X, Serial Number: 21057988, Year manufactured: 1962, Airworthiness Date: 04/10/1962, Certificate Issue Date: 02/07/2017Registrant (LLC): Drm Aviation LLC, 1204 Walker Dr, Glencoe, AL 35905Aircraft: CESSNA 172N (Category: Land, Seats: 4, Weight: Up to 12,499 Pounds, Speed: 105 mph), Engine: LYCOMING 0-320 SERIES (180 HP) (Reciprocating)N-Number: 733SP, N733SP, N-733SP, Serial Number: 17268515, Year manufactured: 1977, Airworthiness Date: 01/19/1977Registrant (Individual): Reported Sale, 1204 Walker Dr, Glencoe, AL 35905Deregistered: Cancel Date: 09/06/2019Aircraft: CESSNA 152 (Category: Land, Seats: 2, Weight: Up to 12,499 Pounds), Engine: LYCOMING 0-235 SERIES (115 HP) (4 Cycle)N-Number: 757PM, N757PM, N-757PM, Serial Number: 15279896, Year manufactured: 1977, Airworthiness Date: 06/29/1977, Certificate Issue Date: 02/21/2008Registrant (Corporation): Drm Aviation Inc, 1204 Walker Dr, Glencoe, AL 35905Deregistered: Cancel Date: 02/28/2018
Home Mortgage Disclosure Act Aggregated Statistics For Year 2009(Based on 2 partial tracts) A) FHA, FSA/RHS & VA B) Conventional C) Refinancings D) Home Improvement Loans F) Non-occupant Loans on G) Loans On Manufactured Number Average Value Number Average Value Number Average Value Number Average Value Number Average Value Number Average Value
LOANS ORIGINATED 14 $106,450 9 $100,347 65 $138,607 6 $24,932 6 $75,518 1 $60,830 APPLICATIONS APPROVED, NOT ACCEPTED 0 $0 0 $0 4 $173,020 2 $12,105 0 $0 0 $0 APPLICATIONS DENIED 1 $130,970 2 $75,105 18 $143,554 4 $61,450 1 $15,520 1 $31,040 APPLICATIONS WITHDRAWN 1 $75,730 2 $101,485 17 $132,538 0 $0 0 $0 1 $6,830 FILES CLOSED FOR INCOMPLETENESS 1 $101,790 0 $0 2 $191,795 0 $0 0 $0 0 $0
Aggregated Statistics For Year 2008(Based on 2 partial tracts) A) FHA, FSA/RHS & VA B) Conventional C) Refinancings D) Home Improvement Loans E) Loans on Dwellings For 5+ Families F) Non-occupant Loans on G) Loans On Manufactured Number Average Value Number Average Value Number Average Value Number Average Value Number Average Value Number Average Value Number Average Value
LOANS ORIGINATED 15 $96,912 17 $131,369 42 $133,480 11 $44,916 0 $0 4 $83,018 0 $0 APPLICATIONS APPROVED, NOT ACCEPTED 0 $0 4 $135,158 3 $100,347 0 $0 1 $65,790 1 $40,350 1 $47,790 APPLICATIONS DENIED 3 $98,483 9 $123,381 27 $117,956 6 $35,587 0 $0 1 $104,900 3 $55,657 APPLICATIONS WITHDRAWN 1 $47,170 4 $96,052 10 $144,437 2 $86,275 0 $0 0 $0 0 $0 FILES CLOSED FOR INCOMPLETENESS 1 $46,550 2 $159,520 1 $209,180 0 $0 0 $0 0 $0 0 $0
Aggregated Statistics For Year 2007(Based on 2 partial tracts) A) FHA, FSA/RHS & VA B) Conventional C) Refinancings D) Home Improvement Loans F) Non-occupant Loans on G) Loans On Manufactured Number Average Value Number Average Value Number Average Value Number Average Value Number Average Value Number Average Value
LOANS ORIGINATED 9 $83,519 42 $104,972 50 $93,291 11 $77,024 6 $96,105 4 $40,655 APPLICATIONS APPROVED, NOT ACCEPTED 1 $63,930 2 $85,345 9 $92,691 2 $47,795 0 $0 1 $37,240 APPLICATIONS DENIED 1 $90,000 16 $103,036 29 $115,386 6 $40,242 3 $62,897 7 $51,961 APPLICATIONS WITHDRAWN 0 $0 3 $156,003 17 $131,625 1 $96,210 1 $106,760 0 $0 FILES CLOSED FOR INCOMPLETENESS 0 $0 4 $161,382 6 $128,898 0 $0 0 $0 0 $0
Aggregated Statistics For Year 2006(Based on 2 partial tracts) A) FHA, FSA/RHS & VA B) Conventional C) Refinancings D) Home Improvement Loans F) Non-occupant Loans on G) Loans On Manufactured Number Average Value Number Average Value Number Average Value Number Average Value Number Average Value Number Average Value
LOANS ORIGINATED 1 $111,110 47 $93,871 58 $90,804 7 $57,193 7 $43,981 5 $44,938 APPLICATIONS APPROVED, NOT ACCEPTED 0 $0 2 $72,620 9 $83,657 2 $61,140 1 $45,930 2 $33,830 APPLICATIONS DENIED 0 $0 9 $80,277 34 $116,418 6 $22,138 4 $116,538 9 $51,587 APPLICATIONS WITHDRAWN 0 $0 6 $62,173 13 $104,803 2 $81,310 1 $82,550 1 $52,760 FILES CLOSED FOR INCOMPLETENESS 0 $0 2 $63,000 11 $128,824 0 $0 1 $37,240 0 $0
Aggregated Statistics For Year 2005(Based on 2 partial tracts) A) FHA, FSA/RHS & VA B) Conventional C) Refinancings D) Home Improvement Loans F) Non-occupant Loans on G) Loans On Manufactured Number Average Value Number Average Value Number Average Value Number Average Value Number Average Value Number Average Value
LOANS ORIGINATED 1 $39,720 43 $84,978 58 $108,858 6 $31,655 6 $54,725 4 $39,260 APPLICATIONS APPROVED, NOT ACCEPTED 0 $0 6 $65,795 9 $90,001 4 $77,122 1 $28,550 4 $73,088 APPLICATIONS DENIED 0 $0 12 $66,208 40 $89,102 11 $45,819 2 $108,310 8 $53,612 APPLICATIONS WITHDRAWN 0 $0 4 $106,915 30 $95,753 3 $110,900 2 $105,210 1 $106,140 FILES CLOSED FOR INCOMPLETENESS 0 $0 1 $334,560 8 $105,751 0 $0 0 $0 1 $37,860
Aggregated Statistics For Year 2004(Based on 2 partial tracts) A) FHA, FSA/RHS & VA B) Conventional C) Refinancings D) Home Improvement Loans F) Non-occupant Loans on G) Loans On Manufactured Number Average Value Number Average Value Number Average Value Number Average Value Number Average Value Number Average Value
LOANS ORIGINATED 2 $91,865 29 $105,005 71 $96,200 7 $28,020 7 $38,306 2 $30,415 APPLICATIONS APPROVED, NOT ACCEPTED 0 $0 2 $79,450 22 $71,268 1 $12,410 2 $31,035 0 $0 APPLICATIONS DENIED 1 $76,350 8 $56,406 30 $80,319 5 $32,028 1 $78,210 4 $71,845 APPLICATIONS WITHDRAWN 1 $60,830 2 $67,035 16 $86,510 1 $52,760 1 $34,140 0 $0 FILES CLOSED FOR INCOMPLETENESS 0 $0 1 $129,730 20 $114,022 1 $46,550 1 $35,380 2 $77,590
Aggregated Statistics For Year 2003(Based on 2 partial tracts) A) FHA, FSA/RHS & VA B) Conventional C) Refinancings D) Home Improvement Loans E) Loans on Dwellings For 5+ Families F) Non-occupant Loans on Number Average Value Number Average Value Number Average Value Number Average Value Number Average Value Number Average Value
LOANS ORIGINATED 2 $126,000 35 $95,286 111 $102,740 9 $40,277 1 $65,170 6 $80,588 APPLICATIONS APPROVED, NOT ACCEPTED 0 $0 7 $47,173 20 $80,722 1 $1,860 0 $0 1 $42,830 APPLICATIONS DENIED 1 $52,140 10 $51,953 37 $80,523 4 $29,638 0 $0 1 $28,550 APPLICATIONS WITHDRAWN 1 $40,970 2 $85,345 19 $88,924 0 $0 0 $0 1 $86,280 FILES CLOSED FOR INCOMPLETENESS 0 $0 0 $0 5 $69,642 1 $18,620 0 $0 0 $0
Aggregated Statistics For Year 2002(Based on 2 partial tracts) A) FHA, FSA/RHS & VA B) Conventional C) Refinancings D) Home Improvement Loans E) Loans on Dwellings For 5+ Families F) Non-occupant Loans on Number Average Value Number Average Value Number Average Value Number Average Value Number Average Value Number Average Value
LOANS ORIGINATED 1 $60,830 44 $74,244 75 $89,753 3 $31,863 1 $427,040 9 $35,862 APPLICATIONS APPROVED, NOT ACCEPTED 0 $0 6 $73,138 12 $88,760 1 $18,620 0 $0 1 $52,760 APPLICATIONS DENIED 0 $0 11 $56,992 26 $70,187 4 $14,275 0 $0 4 $22,965 APPLICATIONS WITHDRAWN 1 $47,170 2 $61,140 10 $110,609 0 $0 0 $0 1 $34,140 FILES CLOSED FOR INCOMPLETENESS 0 $0 0 $0 7 $104,544 0 $0 0 $0 0 $0
Aggregated Statistics For Year 2001(Based on 2 partial tracts) A) FHA, FSA/RHS & VA B) Conventional C) Refinancings D) Home Improvement Loans F) Non-occupant Loans on Number Average Value Number Average Value Number Average Value Number Average Value Number Average Value
LOANS ORIGINATED 4 $80,380 29 $68,748 89 $89,750 6 $29,897 6 $54,312 APPLICATIONS APPROVED, NOT ACCEPTED 1 $39,720 7 $26,336 9 $84,622 1 $9,310 0 $0 APPLICATIONS DENIED 1 $43,450 19 $44,886 38 $82,602 1 $8,070 0 $0 APPLICATIONS WITHDRAWN 0 $0 1 $160,140 14 $69,296 1 $24,830 0 $0 FILES CLOSED FOR INCOMPLETENESS 0 $0 1 $47,790 4 $141,675 0 $0 0 $0
Aggregated Statistics For Year 2000(Based on 2 partial tracts) A) FHA, FSA/RHS & VA B) Conventional C) Refinancings D) Home Improvement Loans E) Loans on Dwellings For 5+ Families F) Non-occupant Loans on Number Average Value Number Average Value Number Average Value Number Average Value Number Average Value Number Average Value
LOANS ORIGINATED 3 $109,037 44 $56,470 42 $77,676 9 $16,277 1 $57,730 4 $22,500 APPLICATIONS APPROVED, NOT ACCEPTED 0 $0 12 $45,673 9 $66,139 1 $3,100 0 $0 1 $27,930 APPLICATIONS DENIED 2 $49,345 32 $31,326 19 $58,117 6 $10,552 0 $0 1 $46,550 APPLICATIONS WITHDRAWN 0 $0 3 $66,000 5 $44,442 1 $3,100 0 $0 1 $15,520 FILES CLOSED FOR INCOMPLETENESS 0 $0 0 $0 7 $77,676 0 $0 0 $0 0 $0
Aggregated Statistics For Year 1999(Based on 2 partial tracts) A) FHA, FSA/RHS & VA B) Conventional C) Refinancings D) Home Improvement Loans E) Loans on Dwellings For 5+ Families F) Non-occupant Loans on Number Average Value Number Average Value Number Average Value Number Average Value Number Average Value Number Average Value
LOANS ORIGINATED 4 $86,022 45 $80,771 63 $68,124 6 $11,697 1 $1,276,980 6 $241,815 APPLICATIONS APPROVED, NOT ACCEPTED 1 $55,900 15 $37,763 3 $36,437 1 $74,530 0 $0 1 $18,630 APPLICATIONS DENIED 0 $0 36 $35,213 19 $61,489 2 $9,315 0 $0 3 $46,997 APPLICATIONS WITHDRAWN 0 $0 7 $56,876 7 $82,429 0 $0 0 $0 1 $15,530 FILES CLOSED FOR INCOMPLETENESS 0 $0 2 $33,230 11 $55,955 0 $0 0 $0 0 $0
Detailed HMDA statistics for the following Tracts:
0105.02
Private Mortgage Insurance Companies Aggregated Statistics For Year 2009(Based on 2 partial tracts) A) Conventional B) Refinancings Number Average Value Number Average Value
LOANS ORIGINATED 2 $153,625 4 $157,502 APPLICATIONS APPROVED, NOT ACCEPTED 0 $0 1 $356,900 APPLICATIONS DENIED 0 $0 1 $31,660 APPLICATIONS WITHDRAWN 0 $0 0 $0 FILES CLOSED FOR INCOMPLETENESS 0 $0 0 $0
Aggregated Statistics For Year 2008(Based on 2 partial tracts) A) Conventional B) Refinancings C) Non-occupant Loans on Number Average Value Number Average Value Number Average Value
LOANS ORIGINATED 6 $133,553 7 $201,550 0 $0 APPLICATIONS APPROVED, NOT ACCEPTED 3 $125,587 2 $246,110 0 $0 APPLICATIONS DENIED 1 $64,550 1 $209,800 0 $0 APPLICATIONS WITHDRAWN 1 $181,870 1 $235,870 1 $181,870 FILES CLOSED FOR INCOMPLETENESS 0 $0 0 $0 0 $0
Aggregated Statistics For Year 2007(Based on 2 partial tracts) A) Conventional B) Refinancings C) Non-occupant Loans on D) Loans On Manufactured Number Average Value Number Average Value Number Average Value Number Average Value
LOANS ORIGINATED 22 $112,714 9 $172,692 1 $238,970 1 $88,140 APPLICATIONS APPROVED, NOT ACCEPTED 2 $95,590 2 $179,380 0 $0 0 $0 APPLICATIONS DENIED 1 $46,550 0 $0 0 $0 0 $0 APPLICATIONS WITHDRAWN 1 $62,070 0 $0 0 $0 0 $0 FILES CLOSED FOR INCOMPLETENESS 0 $0 1 $153,310 1 $39,100 0 $0
Aggregated Statistics For Year 2006(Based on 2 partial tracts) A) Conventional B) Refinancings C) Non-occupant Loans on Number Average Value Number Average Value Number Average Value
LOANS ORIGINATED 12 $110,588 8 $146,874 0 $0 APPLICATIONS APPROVED, NOT ACCEPTED 1 $106,760 2 $274,970 1 $53,380 APPLICATIONS DENIED 0 $0 0 $0 0 $0 APPLICATIONS WITHDRAWN 0 $0 1 $139,660 0 $0 FILES CLOSED FOR INCOMPLETENESS 0 $0 0 $0 0 $0
Aggregated Statistics For Year 2005(Based on 2 partial tracts) A) Conventional B) Refinancings C) Non-occupant Loans on Number Average Value Number Average Value Number Average Value
LOANS ORIGINATED 16 $108,079 8 $122,122 2 $105,830 APPLICATIONS APPROVED, NOT ACCEPTED 1 $22,970 2 $112,035 1 $22,970 APPLICATIONS DENIED 0 $0 1 $299,800 0 $0 APPLICATIONS WITHDRAWN 1 $29,790 0 $0 0 $0 FILES CLOSED FOR INCOMPLETENESS 0 $0 0 $0 0 $0
Aggregated Statistics For Year 2004(Based on 2 partial tracts) A) Conventional B) Refinancings C) Non-occupant Loans on Number Average Value Number Average Value Number Average Value
LOANS ORIGINATED 7 $82,287 6 $109,553 1 $37,860 APPLICATIONS APPROVED, NOT ACCEPTED 1 $72,000 2 $172,865 0 $0 APPLICATIONS DENIED 0 $0 0 $0 0 $0 APPLICATIONS WITHDRAWN 1 $28,550 1 $353,800 0 $0 FILES CLOSED FOR INCOMPLETENESS 1 $58,970 0 $0 0 $0
Aggregated Statistics For Year 2003(Based on 2 partial tracts) A) Conventional B) Refinancings C) Non-occupant Loans on Number Average Value Number Average Value Number Average Value
LOANS ORIGINATED 14 $97,229 15 $130,802 1 $143,380 APPLICATIONS APPROVED, NOT ACCEPTED 6 $51,932 4 $178,295 2 $35,380 APPLICATIONS DENIED 1 $21,720 0 $0 0 $0 APPLICATIONS WITHDRAWN 1 $94,350 1 $67,660 0 $0 FILES CLOSED FOR INCOMPLETENESS 0 $0 0 $0 0 $0
Aggregated Statistics For Year 2002(Based on 2 partial tracts) A) Conventional B) Refinancings C) Non-occupant Loans on Number Average Value Number Average Value Number Average Value
LOANS ORIGINATED 12 $83,691 15 $95,919 2 $52,760 APPLICATIONS APPROVED, NOT ACCEPTED 2 $76,345 4 $158,432 0 $0 APPLICATIONS DENIED 0 $0 1 $32,280 0 $0 APPLICATIONS WITHDRAWN 1 $29,790 0 $0 0 $0 FILES CLOSED FOR INCOMPLETENESS 0 $0 0 $0 0 $0
Aggregated Statistics For Year 2001(Based on 2 partial tracts) A) Conventional B) Refinancings C) Non-occupant Loans on Number Average Value Number Average Value Number Average Value
LOANS ORIGINATED 9 $104,553 11 $101,907 0 $0 APPLICATIONS APPROVED, NOT ACCEPTED 1 $62,690 2 $98,380 1 $27,930 APPLICATIONS DENIED 0 $0 0 $0 0 $0 APPLICATIONS WITHDRAWN 0 $0 1 $80,070 0 $0 FILES CLOSED FOR INCOMPLETENESS 0 $0 0 $0 0 $0
Aggregated Statistics For Year 2000(Based on 2 partial tracts) A) Conventional B) Refinancings Number Average Value Number Average Value
LOANS ORIGINATED 11 $90,905 4 $106,140 APPLICATIONS APPROVED, NOT ACCEPTED 1 $34,140 1 $135,930 APPLICATIONS DENIED 0 $0 0 $0 APPLICATIONS WITHDRAWN 0 $0 0 $0 FILES CLOSED FOR INCOMPLETENESS 0 $0 0 $0
Aggregated Statistics For Year 1999(Based on 2 partial tracts) A) Conventional B) Refinancings Number Average Value Number Average Value
LOANS ORIGINATED 11 $89,890 7 $88,640 APPLICATIONS APPROVED, NOT ACCEPTED 1 $37,270 1 $93,160 APPLICATIONS DENIED 1 $27,330 1 $30,430 APPLICATIONS WITHDRAWN 1 $130,430 0 $0 FILES CLOSED FOR INCOMPLETENESS 0 $0 0 $0
Detailed PMIC statistics for the following Tracts:
0105.02
Glencoe compared to Alabama state average:
Unemployed percentage significantly below state average. Black race population percentage significantly below state average. Hispanic race population percentage significantly below state average. Foreign-born population percentage below state average. Renting percentage below state average. Length of stay since moving in above state average. Number of college students below state average.
#45 on the list of "Top 101 cities with the highest percentage of English-only speaking households, population 5,000+"
#13 on the list of "Top 101 counties with the highest number of deaths per 1000 residents 2007-2013 (pop. 50,000+)"
#23 on the list of "Top 101 counties with the smallest number of children under 18 without health insurance coverage in 2000 (pop. 50,000+)"
#53 on the list of "Top 101 counties with the smallest number of people without health insurance coverage in 2000 (pop. 50,000+)"
Top Patent Applicants
Grover Parrish (1)
Patrick Allan Mcnew (1)
Cleve Franklin, Jr. (1)
Total of 3 patent applications in 2008-2024.


 Recent articles from our blog. Our writers, many of them Ph.D. graduates or candidates, create easy-to-read articles on a wide variety of topics.

 (58.5 miles
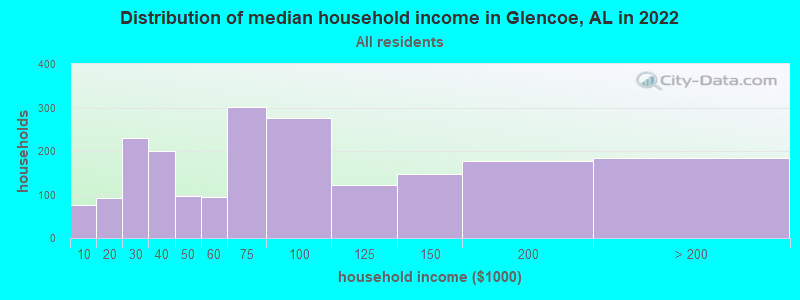
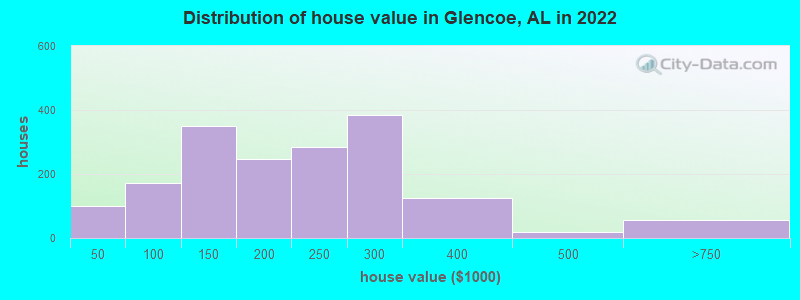

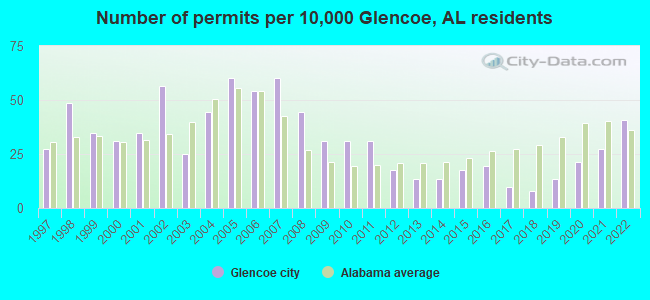
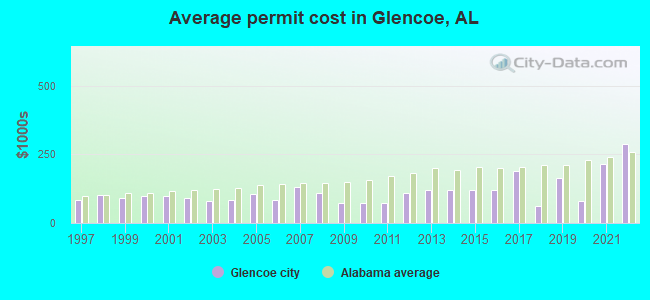
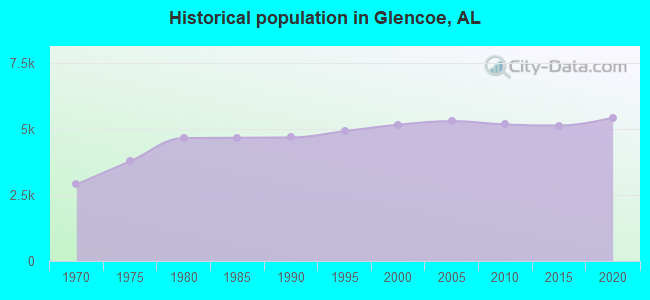
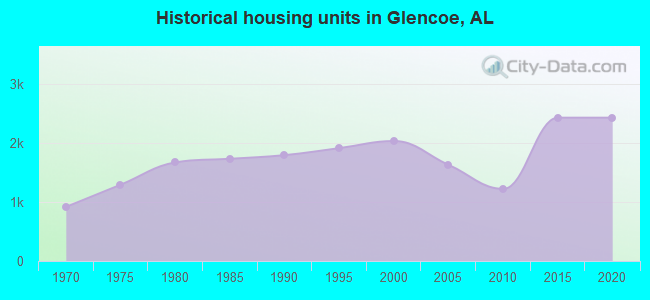
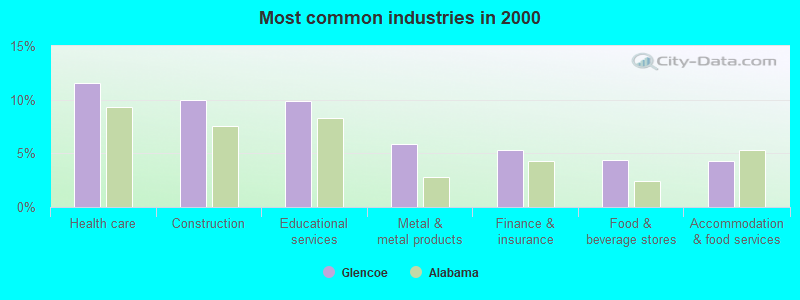
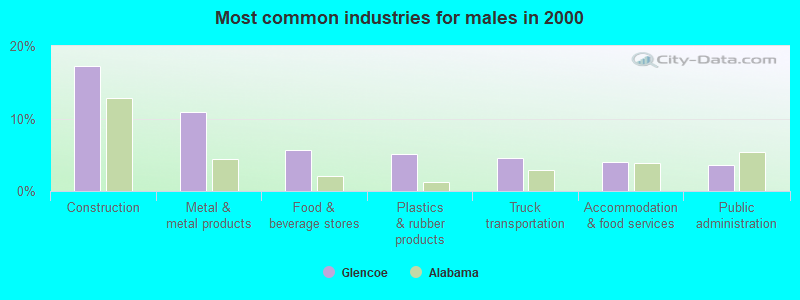
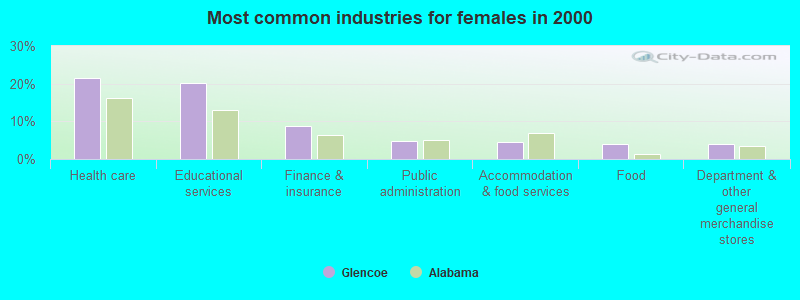
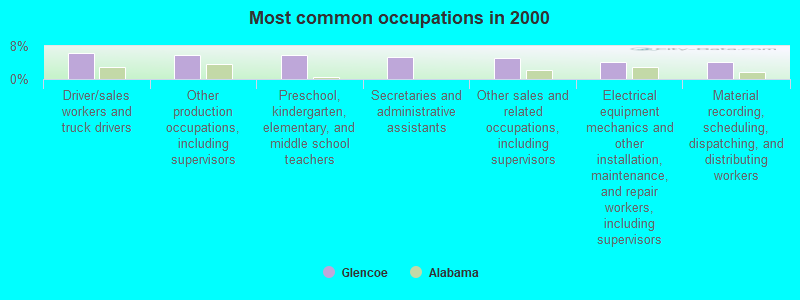
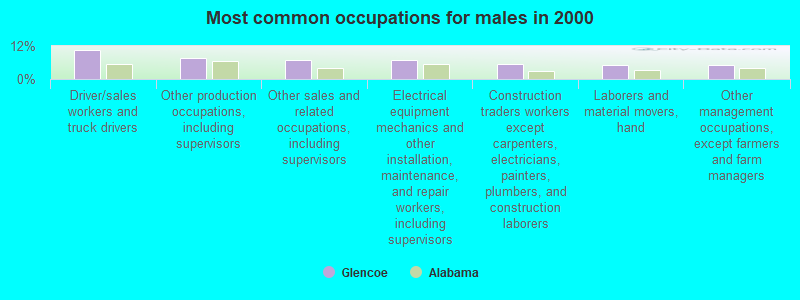
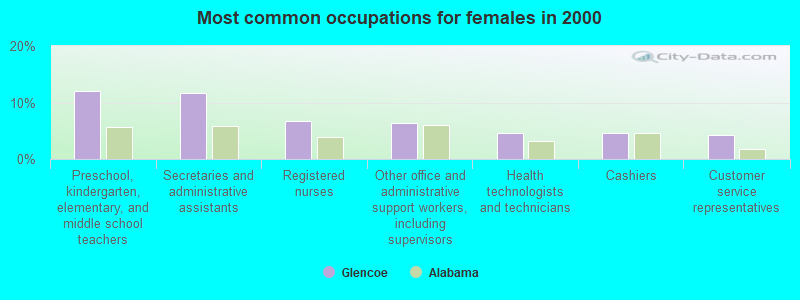


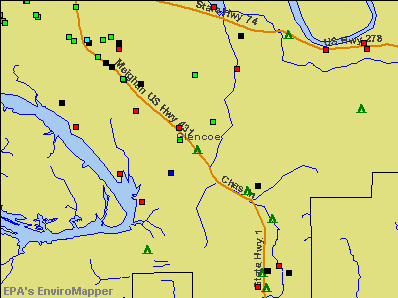

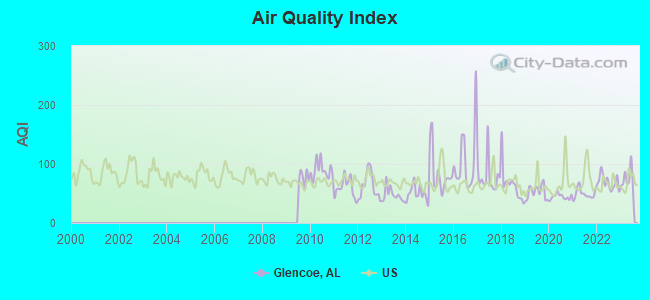
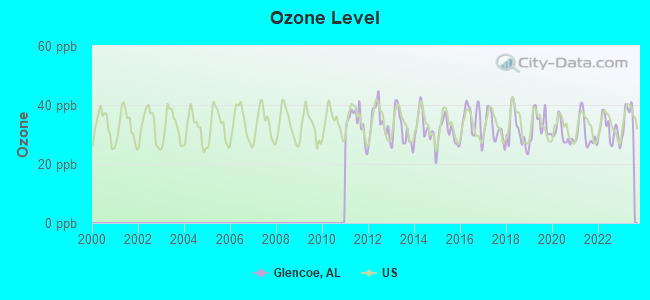
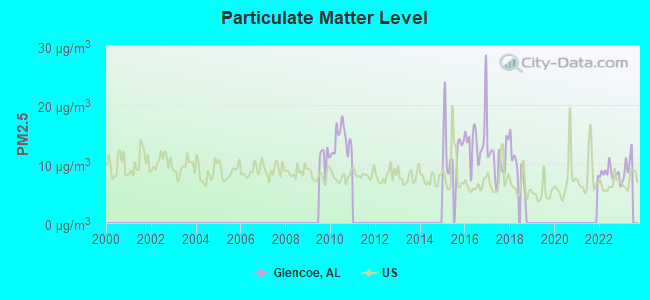
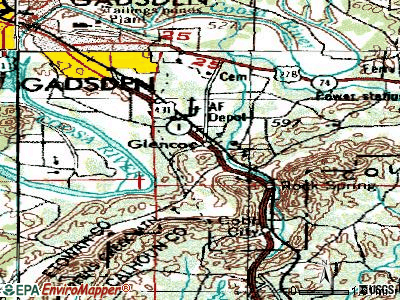
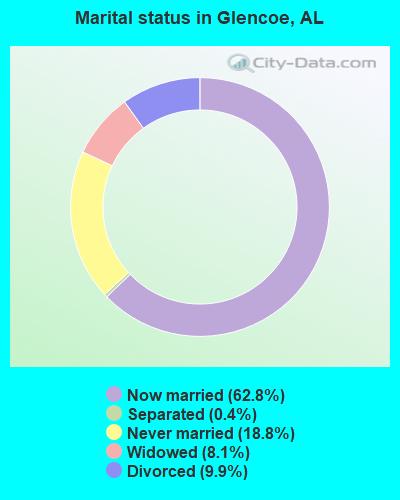
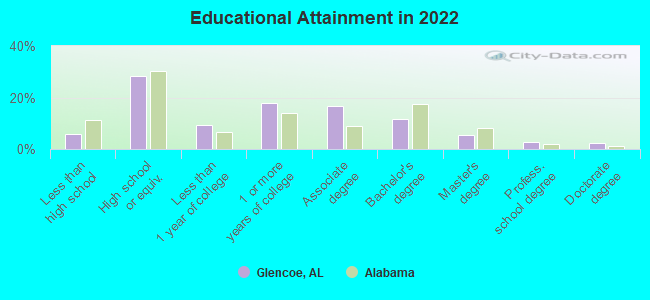
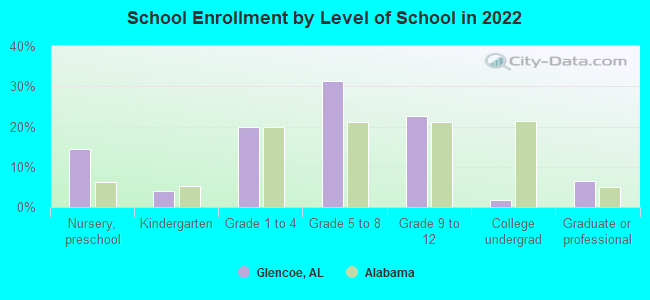
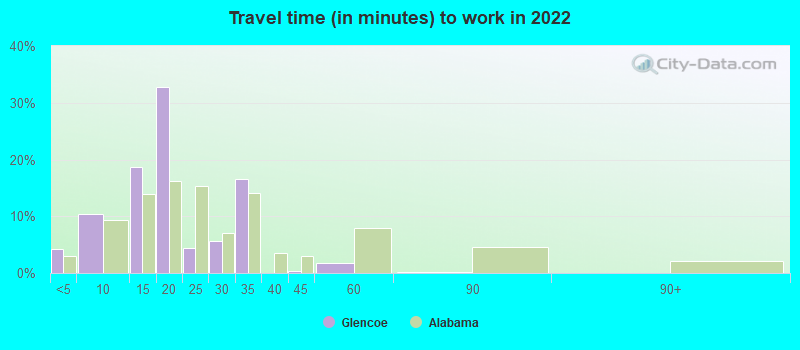
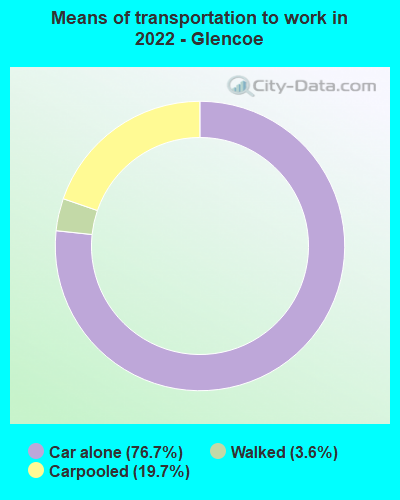
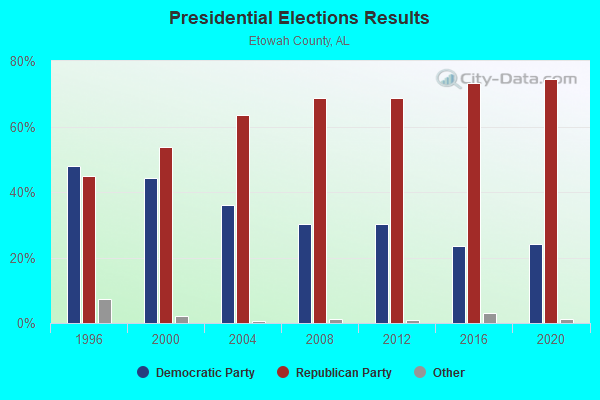
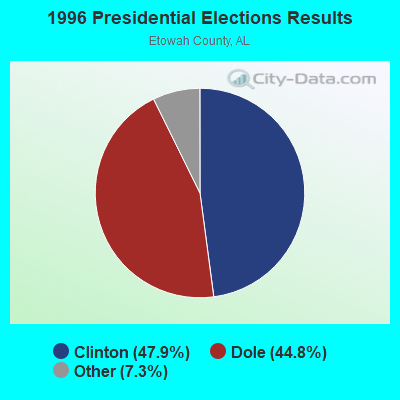
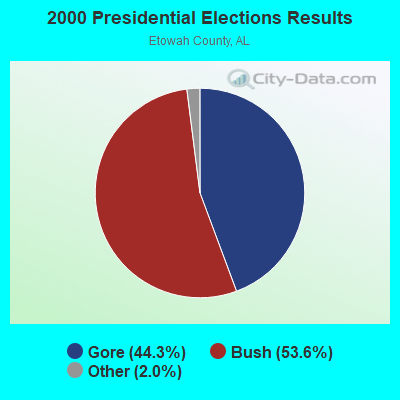
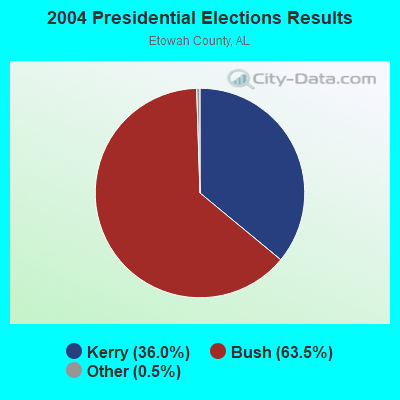
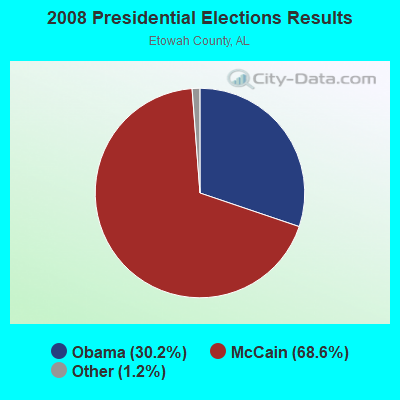

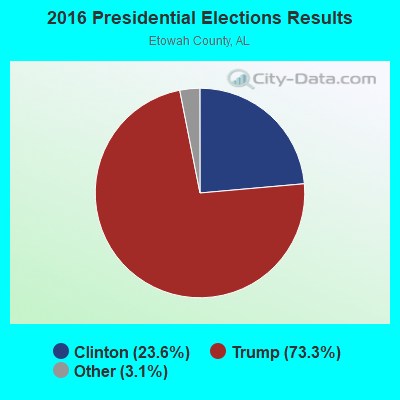
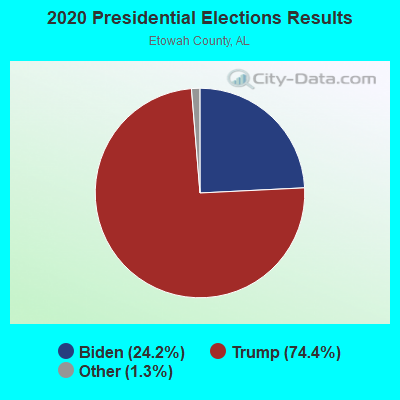
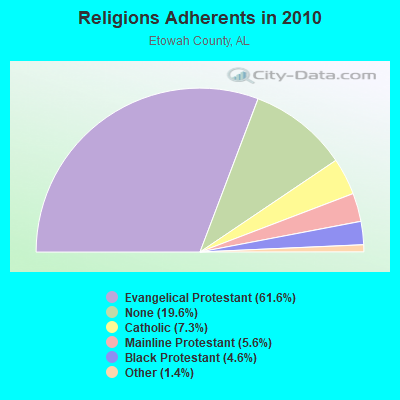
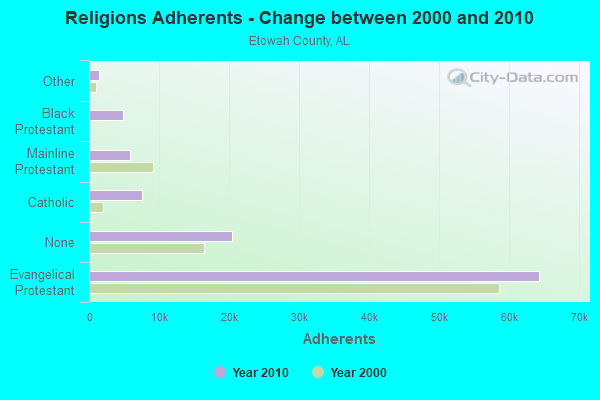
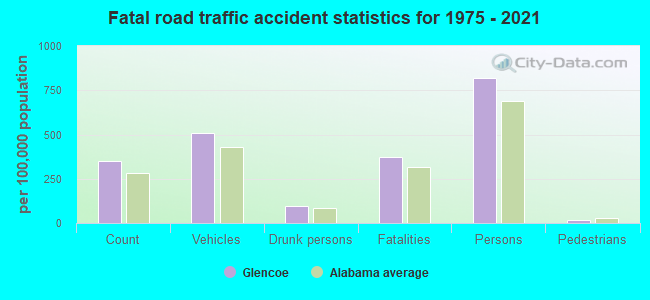
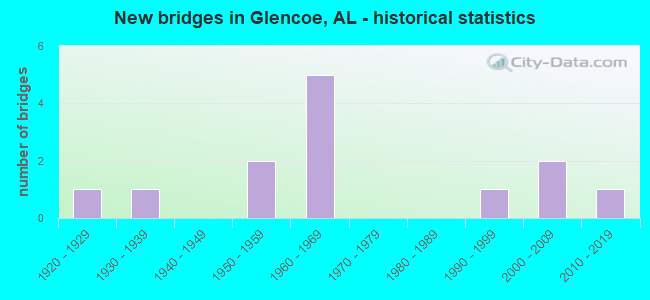
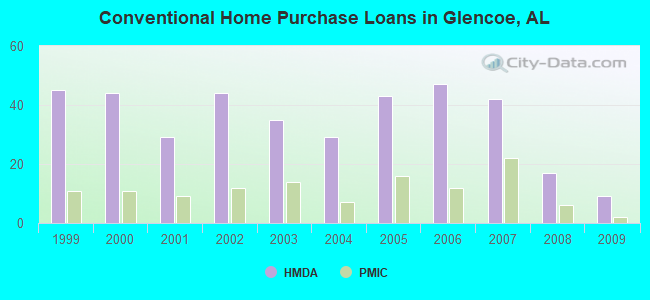
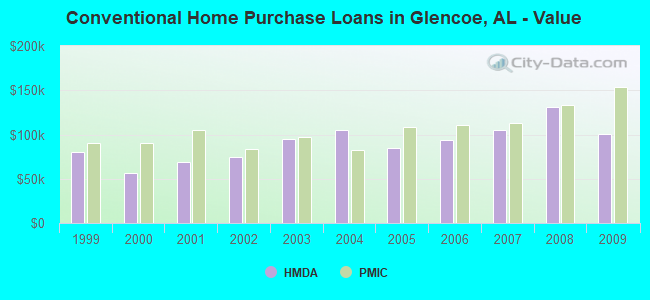
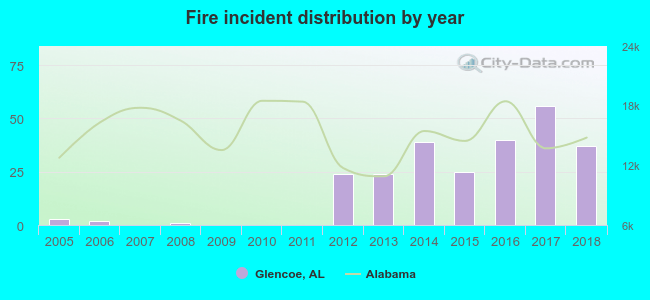 Based on the data from the years 2005 - 2018 the average number of fires per year is 18. The highest number of reported fire incidents - 56 took place in 2017, and the least - 0 in 2007. The data has an increasing trend.
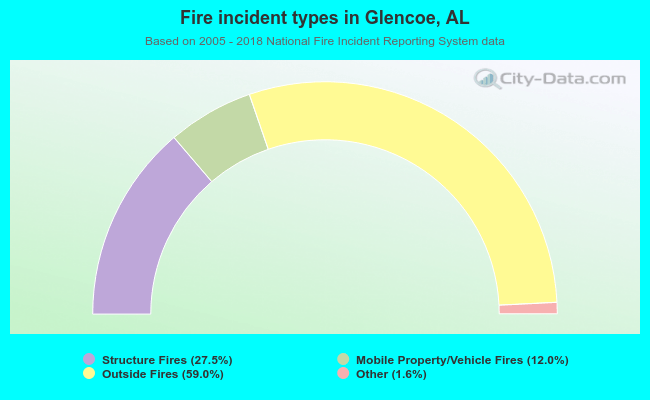 When looking into fire subcategories, the most incidents belonged to: Outside Fires (59.0%), and Structure Fires (27.5%).