Grandview, Missouri Submit your own pictures of this city and show them to the world
OSM Map
General Map
Google Map
MSN Map
OSM Map
General Map
Google Map
MSN Map
OSM Map
General Map
Google Map
MSN Map
OSM Map
General Map
Google Map
MSN Map
Please wait while loading the map...
Population in 2022: 25,610 (100% urban, 0% rural). Population change since 2000: +2.9%Males: 12,291 Females: 13,319
March 2022 cost of living index in Grandview: 86.3 (less than average, U.S. average is 100) Percentage of residents living in poverty in 2022: 15.2%for White Non-Hispanic residents , 20.8% for Black residents , 16.0% for Hispanic or Latino residents , 25.6% for other race residents , 11.8% for two or more races residents )
Profiles of local businesses
Business Search - 14 Million verified businesses
Data:
Median household income ($)
Median household income (% change since 2000)
Household income diversity
Ratio of average income to average house value (%)
Ratio of average income to average rent
Median household income ($) - White
Median household income ($) - Black or African American
Median household income ($) - Asian
Median household income ($) - Hispanic or Latino
Median household income ($) - American Indian and Alaska Native
Median household income ($) - Multirace
Median household income ($) - Other Race
Median household income for houses/condos with a mortgage ($)
Median household income for apartments without a mortgage ($)
Races - White alone (%)
Races - White alone (% change since 2000)
Races - Black alone (%)
Races - Black alone (% change since 2000)
Races - American Indian alone (%)
Races - American Indian alone (% change since 2000)
Races - Asian alone (%)
Races - Asian alone (% change since 2000)
Races - Hispanic (%)
Races - Hispanic (% change since 2000)
Races - Native Hawaiian and Other Pacific Islander alone (%)
Races - Native Hawaiian and Other Pacific Islander alone (% change since 2000)
Races - Two or more races (%)
Races - Two or more races (% change since 2000)
Races - Other race alone (%)
Races - Other race alone (% change since 2000)
Racial diversity
Unemployment (%)
Unemployment (% change since 2000)
Unemployment (%) - White
Unemployment (%) - Black or African American
Unemployment (%) - Asian
Unemployment (%) - Hispanic or Latino
Unemployment (%) - American Indian and Alaska Native
Unemployment (%) - Multirace
Unemployment (%) - Other Race
Population density (people per square mile)
Population - Males (%)
Population - Females (%)
Population - Males (%) - White
Population - Males (%) - Black or African American
Population - Males (%) - Asian
Population - Males (%) - Hispanic or Latino
Population - Males (%) - American Indian and Alaska Native
Population - Males (%) - Multirace
Population - Males (%) - Other Race
Population - Females (%) - White
Population - Females (%) - Black or African American
Population - Females (%) - Asian
Population - Females (%) - Hispanic or Latino
Population - Females (%) - American Indian and Alaska Native
Population - Females (%) - Multirace
Population - Females (%) - Other Race
Coronavirus confirmed cases (Jun 15, 2024)
Deaths caused by coronavirus (Jun 15, 2024)
Coronavirus confirmed cases (per 100k population) (Jun 15, 2024)
Deaths caused by coronavirus (per 100k population) (Jun 15, 2024)
Daily increase in number of cases (Jun 15, 2024)
Weekly increase in number of cases (Jun 15, 2024)
Cases doubled (in days) (Jun 15, 2024)
Hospitalized patients (Apr 18, 2022)
Negative test results (Apr 18, 2022)
Total test results (Apr 18, 2022)
COVID Vaccine doses distributed (per 100k population) (Sep 19, 2023)
COVID Vaccine doses administered (per 100k population) (Sep 19, 2023)
COVID Vaccine doses distributed (Sep 19, 2023)
COVID Vaccine doses administered (Sep 19, 2023)
Likely homosexual households (%)
Likely homosexual households (% change since 2000)
Likely homosexual households - Lesbian couples (%)
Likely homosexual households - Lesbian couples (% change since 2000)
Likely homosexual households - Gay men (%)
Likely homosexual households - Gay men (% change since 2000)
Cost of living index
Median gross rent ($)
Median contract rent ($)
Median monthly housing costs ($)
Median house or condo value ($)
Median house or condo value ($ change since 2000)
Mean house or condo value by units in structure - 1, detached ($)
Mean house or condo value by units in structure - 1, attached ($)
Mean house or condo value by units in structure - 2 ($)
Mean house or condo value by units in structure by units in structure - 3 or 4 ($)
Mean house or condo value by units in structure - 5 or more ($)
Mean house or condo value by units in structure - Boat, RV, van, etc. ($)
Mean house or condo value by units in structure - Mobile home ($)
Median house or condo value ($) - White
Median house or condo value ($) - Black or African American
Median house or condo value ($) - Asian
Median house or condo value ($) - Hispanic or Latino
Median house or condo value ($) - American Indian and Alaska Native
Median house or condo value ($) - Multirace
Median house or condo value ($) - Other Race
Median resident age
Resident age diversity
Median resident age - Males
Median resident age - Females
Median resident age - White
Median resident age - Black or African American
Median resident age - Asian
Median resident age - Hispanic or Latino
Median resident age - American Indian and Alaska Native
Median resident age - Multirace
Median resident age - Other Race
Median resident age - Males - White
Median resident age - Males - Black or African American
Median resident age - Males - Asian
Median resident age - Males - Hispanic or Latino
Median resident age - Males - American Indian and Alaska Native
Median resident age - Males - Multirace
Median resident age - Males - Other Race
Median resident age - Females - White
Median resident age - Females - Black or African American
Median resident age - Females - Asian
Median resident age - Females - Hispanic or Latino
Median resident age - Females - American Indian and Alaska Native
Median resident age - Females - Multirace
Median resident age - Females - Other Race
Commute - mean travel time to work (minutes)
Travel time to work - Less than 5 minutes (%)
Travel time to work - Less than 5 minutes (% change since 2000)
Travel time to work - 5 to 9 minutes (%)
Travel time to work - 5 to 9 minutes (% change since 2000)
Travel time to work - 10 to 19 minutes (%)
Travel time to work - 10 to 19 minutes (% change since 2000)
Travel time to work - 20 to 29 minutes (%)
Travel time to work - 20 to 29 minutes (% change since 2000)
Travel time to work - 30 to 39 minutes (%)
Travel time to work - 30 to 39 minutes (% change since 2000)
Travel time to work - 40 to 59 minutes (%)
Travel time to work - 40 to 59 minutes (% change since 2000)
Travel time to work - 60 to 89 minutes (%)
Travel time to work - 60 to 89 minutes (% change since 2000)
Travel time to work - 90 or more minutes (%)
Travel time to work - 90 or more minutes (% change since 2000)
Marital status - Never married (%)
Marital status - Now married (%)
Marital status - Separated (%)
Marital status - Widowed (%)
Marital status - Divorced (%)
Median family income ($)
Median family income (% change since 2000)
Median non-family income ($)
Median non-family income (% change since 2000)
Median per capita income ($)
Median per capita income (% change since 2000)
Median family income ($) - White
Median family income ($) - Black or African American
Median family income ($) - Asian
Median family income ($) - Hispanic or Latino
Median family income ($) - American Indian and Alaska Native
Median family income ($) - Multirace
Median family income ($) - Other Race
Median year house/condo built
Median year apartment built
Year house built - Built 2005 or later (%)
Year house built - Built 2000 to 2004 (%)
Year house built - Built 1990 to 1999 (%)
Year house built - Built 1980 to 1989 (%)
Year house built - Built 1970 to 1979 (%)
Year house built - Built 1960 to 1969 (%)
Year house built - Built 1950 to 1959 (%)
Year house built - Built 1940 to 1949 (%)
Year house built - Built 1939 or earlier (%)
Average household size
Household density (households per square mile)
Average household size - White
Average household size - Black or African American
Average household size - Asian
Average household size - Hispanic or Latino
Average household size - American Indian and Alaska Native
Average household size - Multirace
Average household size - Other Race
Occupied housing units (%)
Vacant housing units (%)
Owner occupied housing units (%)
Renter occupied housing units (%)
Vacancy status - For rent (%)
Vacancy status - For sale only (%)
Vacancy status - Rented or sold, not occupied (%)
Vacancy status - For seasonal, recreational, or occasional use (%)
Vacancy status - For migrant workers (%)
Vacancy status - Other vacant (%)
Residents with income below the poverty level (%)
Residents with income below 50% of the poverty level (%)
Children below poverty level (%)
Poor families by family type - Married-couple family (%)
Poor families by family type - Male, no wife present (%)
Poor families by family type - Female, no husband present (%)
Poverty status for native-born residents (%)
Poverty status for foreign-born residents (%)
Poverty among high school graduates not in families (%)
Poverty among people who did not graduate high school not in families (%)
Residents with income below the poverty level (%) - White
Residents with income below the poverty level (%) - Black or African American
Residents with income below the poverty level (%) - Asian
Residents with income below the poverty level (%) - Hispanic or Latino
Residents with income below the poverty level (%) - American Indian and Alaska Native
Residents with income below the poverty level (%) - Multirace
Residents with income below the poverty level (%) - Other Race
Air pollution - Air Quality Index (AQI)
Air pollution - CO
Air pollution - NO2
Air pollution - SO2
Air pollution - Ozone
Air pollution - PM10
Air pollution - PM25
Air pollution - Pb
Crime - Murders per 100,000 population
Crime - Rapes per 100,000 population
Crime - Robberies per 100,000 population
Crime - Assaults per 100,000 population
Crime - Burglaries per 100,000 population
Crime - Thefts per 100,000 population
Crime - Auto thefts per 100,000 population
Crime - Arson per 100,000 population
Crime - City-data.com crime index
Crime - Violent crime index
Crime - Property crime index
Crime - Murders per 100,000 population (5 year average)
Crime - Rapes per 100,000 population (5 year average)
Crime - Robberies per 100,000 population (5 year average)
Crime - Assaults per 100,000 population (5 year average)
Crime - Burglaries per 100,000 population (5 year average)
Crime - Thefts per 100,000 population (5 year average)
Crime - Auto thefts per 100,000 population (5 year average)
Crime - Arson per 100,000 population (5 year average)
Crime - City-data.com crime index (5 year average)
Crime - Violent crime index (5 year average)
Crime - Property crime index (5 year average)
1996 Presidential Elections Results (%) - Democratic Party (Clinton)
1996 Presidential Elections Results (%) - Republican Party (Dole)
1996 Presidential Elections Results (%) - Other
2000 Presidential Elections Results (%) - Democratic Party (Gore)
2000 Presidential Elections Results (%) - Republican Party (Bush)
2000 Presidential Elections Results (%) - Other
2004 Presidential Elections Results (%) - Democratic Party (Kerry)
2004 Presidential Elections Results (%) - Republican Party (Bush)
2004 Presidential Elections Results (%) - Other
2008 Presidential Elections Results (%) - Democratic Party (Obama)
2008 Presidential Elections Results (%) - Republican Party (McCain)
2008 Presidential Elections Results (%) - Other
2012 Presidential Elections Results (%) - Democratic Party (Obama)
2012 Presidential Elections Results (%) - Republican Party (Romney)
2012 Presidential Elections Results (%) - Other
2016 Presidential Elections Results (%) - Democratic Party (Clinton)
2016 Presidential Elections Results (%) - Republican Party (Trump)
2016 Presidential Elections Results (%) - Other
2020 Presidential Elections Results (%) - Democratic Party (Biden)
2020 Presidential Elections Results (%) - Republican Party (Trump)
2020 Presidential Elections Results (%) - Other
Ancestries Reported - Arab (%)
Ancestries Reported - Czech (%)
Ancestries Reported - Danish (%)
Ancestries Reported - Dutch (%)
Ancestries Reported - English (%)
Ancestries Reported - French (%)
Ancestries Reported - French Canadian (%)
Ancestries Reported - German (%)
Ancestries Reported - Greek (%)
Ancestries Reported - Hungarian (%)
Ancestries Reported - Irish (%)
Ancestries Reported - Italian (%)
Ancestries Reported - Lithuanian (%)
Ancestries Reported - Norwegian (%)
Ancestries Reported - Polish (%)
Ancestries Reported - Portuguese (%)
Ancestries Reported - Russian (%)
Ancestries Reported - Scotch-Irish (%)
Ancestries Reported - Scottish (%)
Ancestries Reported - Slovak (%)
Ancestries Reported - Subsaharan African (%)
Ancestries Reported - Swedish (%)
Ancestries Reported - Swiss (%)
Ancestries Reported - Ukrainian (%)
Ancestries Reported - United States (%)
Ancestries Reported - Welsh (%)
Ancestries Reported - West Indian (%)
Ancestries Reported - Other (%)
Educational Attainment - No schooling completed (%)
Educational Attainment - Less than high school (%)
Educational Attainment - High school or equivalent (%)
Educational Attainment - Less than 1 year of college (%)
Educational Attainment - 1 or more years of college (%)
Educational Attainment - Associate degree (%)
Educational Attainment - Bachelor's degree (%)
Educational Attainment - Master's degree (%)
Educational Attainment - Professional school degree (%)
Educational Attainment - Doctorate degree (%)
School Enrollment - Nursery, preschool (%)
School Enrollment - Kindergarten (%)
School Enrollment - Grade 1 to 4 (%)
School Enrollment - Grade 5 to 8 (%)
School Enrollment - Grade 9 to 12 (%)
School Enrollment - College undergrad (%)
School Enrollment - Graduate or professional (%)
School Enrollment - Not enrolled in school (%)
School enrollment - Public schools (%)
School enrollment - Private schools (%)
School enrollment - Not enrolled (%)
Median number of rooms in houses and condos
Median number of rooms in apartments
Housing units lacking complete plumbing facilities (%)
Housing units lacking complete kitchen facilities (%)
Density of houses
Urban houses (%)
Rural houses (%)
Households with people 60 years and over (%)
Households with people 65 years and over (%)
Households with people 75 years and over (%)
Households with one or more nonrelatives (%)
Households with no nonrelatives (%)
Population in households (%)
Family households (%)
Nonfamily households (%)
Population in families (%)
Family households with own children (%)
Median number of bedrooms in owner occupied houses
Mean number of bedrooms in owner occupied houses
Median number of bedrooms in renter occupied houses
Mean number of bedrooms in renter occupied houses
Median number of vehichles in owner occupied houses
Mean number of vehichles in owner occupied houses
Median number of vehichles in renter occupied houses
Mean number of vehichles in renter occupied houses
Mortgage status - with mortgage (%)
Mortgage status - with second mortgage (%)
Mortgage status - with home equity loan (%)
Mortgage status - with both second mortgage and home equity loan (%)
Mortgage status - without a mortgage (%)
Average family size
Average family size - White
Average family size - Black or African American
Average family size - Asian
Average family size - Hispanic or Latino
Average family size - American Indian and Alaska Native
Average family size - Multirace
Average family size - Other Race
Geographical mobility - Same house 1 year ago (%)
Geographical mobility - Moved within same county (%)
Geographical mobility - Moved from different county within same state (%)
Geographical mobility - Moved from different state (%)
Geographical mobility - Moved from abroad (%)
Place of birth - Born in state of residence (%)
Place of birth - Born in other state (%)
Place of birth - Native, outside of US (%)
Place of birth - Foreign born (%)
Housing units in structures - 1, detached (%)
Housing units in structures - 1, attached (%)
Housing units in structures - 2 (%)
Housing units in structures - 3 or 4 (%)
Housing units in structures - 5 to 9 (%)
Housing units in structures - 10 to 19 (%)
Housing units in structures - 20 to 49 (%)
Housing units in structures - 50 or more (%)
Housing units in structures - Mobile home (%)
Housing units in structures - Boat, RV, van, etc. (%)
House/condo owner moved in on average (years ago)
Renter moved in on average (years ago)
Year householder moved into unit - Moved in 1999 to March 2000 (%)
Year householder moved into unit - Moved in 1995 to 1998 (%)
Year householder moved into unit - Moved in 1990 to 1994 (%)
Year householder moved into unit - Moved in 1980 to 1989 (%)
Year householder moved into unit - Moved in 1970 to 1979 (%)
Year householder moved into unit - Moved in 1969 or earlier (%)
Means of transportation to work - Drove car alone (%)
Means of transportation to work - Carpooled (%)
Means of transportation to work - Public transportation (%)
Means of transportation to work - Bus or trolley bus (%)
Means of transportation to work - Streetcar or trolley car (%)
Means of transportation to work - Subway or elevated (%)
Means of transportation to work - Railroad (%)
Means of transportation to work - Ferryboat (%)
Means of transportation to work - Taxicab (%)
Means of transportation to work - Motorcycle (%)
Means of transportation to work - Bicycle (%)
Means of transportation to work - Walked (%)
Means of transportation to work - Other means (%)
Working at home (%)
Industry diversity
Most Common Industries - Agriculture, forestry, fishing and hunting, and mining (%)
Most Common Industries - Agriculture, forestry, fishing and hunting (%)
Most Common Industries - Mining, quarrying, and oil and gas extraction (%)
Most Common Industries - Construction (%)
Most Common Industries - Manufacturing (%)
Most Common Industries - Wholesale trade (%)
Most Common Industries - Retail trade (%)
Most Common Industries - Transportation and warehousing, and utilities (%)
Most Common Industries - Transportation and warehousing (%)
Most Common Industries - Utilities (%)
Most Common Industries - Information (%)
Most Common Industries - Finance and insurance, and real estate and rental and leasing (%)
Most Common Industries - Finance and insurance (%)
Most Common Industries - Real estate and rental and leasing (%)
Most Common Industries - Professional, scientific, and management, and administrative and waste management services (%)
Most Common Industries - Professional, scientific, and technical services (%)
Most Common Industries - Management of companies and enterprises (%)
Most Common Industries - Administrative and support and waste management services (%)
Most Common Industries - Educational services, and health care and social assistance (%)
Most Common Industries - Educational services (%)
Most Common Industries - Health care and social assistance (%)
Most Common Industries - Arts, entertainment, and recreation, and accommodation and food services (%)
Most Common Industries - Arts, entertainment, and recreation (%)
Most Common Industries - Accommodation and food services (%)
Most Common Industries - Other services, except public administration (%)
Most Common Industries - Public administration (%)
Occupation diversity
Most Common Occupations - Management, business, science, and arts occupations (%)
Most Common Occupations - Management, business, and financial occupations (%)
Most Common Occupations - Management occupations (%)
Most Common Occupations - Business and financial operations occupations (%)
Most Common Occupations - Computer, engineering, and science occupations (%)
Most Common Occupations - Computer and mathematical occupations (%)
Most Common Occupations - Architecture and engineering occupations (%)
Most Common Occupations - Life, physical, and social science occupations (%)
Most Common Occupations - Education, legal, community service, arts, and media occupations (%)
Most Common Occupations - Community and social service occupations (%)
Most Common Occupations - Legal occupations (%)
Most Common Occupations - Education, training, and library occupations (%)
Most Common Occupations - Arts, design, entertainment, sports, and media occupations (%)
Most Common Occupations - Healthcare practitioners and technical occupations (%)
Most Common Occupations - Health diagnosing and treating practitioners and other technical occupations (%)
Most Common Occupations - Health technologists and technicians (%)
Most Common Occupations - Service occupations (%)
Most Common Occupations - Healthcare support occupations (%)
Most Common Occupations - Protective service occupations (%)
Most Common Occupations - Fire fighting and prevention, and other protective service workers including supervisors (%)
Most Common Occupations - Law enforcement workers including supervisors (%)
Most Common Occupations - Food preparation and serving related occupations (%)
Most Common Occupations - Building and grounds cleaning and maintenance occupations (%)
Most Common Occupations - Personal care and service occupations (%)
Most Common Occupations - Sales and office occupations (%)
Most Common Occupations - Sales and related occupations (%)
Most Common Occupations - Office and administrative support occupations (%)
Most Common Occupations - Natural resources, construction, and maintenance occupations (%)
Most Common Occupations - Farming, fishing, and forestry occupations (%)
Most Common Occupations - Construction and extraction occupations (%)
Most Common Occupations - Installation, maintenance, and repair occupations (%)
Most Common Occupations - Production, transportation, and material moving occupations (%)
Most Common Occupations - Production occupations (%)
Most Common Occupations - Transportation occupations (%)
Most Common Occupations - Material moving occupations (%)
People in Group quarters - Institutionalized population (%)
People in Group quarters - Correctional institutions (%)
People in Group quarters - Federal prisons and detention centers (%)
People in Group quarters - Halfway houses (%)
People in Group quarters - Local jails and other confinement facilities (including police lockups) (%)
People in Group quarters - Military disciplinary barracks (%)
People in Group quarters - State prisons (%)
People in Group quarters - Other types of correctional institutions (%)
People in Group quarters - Nursing homes (%)
People in Group quarters - Hospitals/wards, hospices, and schools for the handicapped (%)
People in Group quarters - Hospitals/wards and hospices for chronically ill (%)
People in Group quarters - Hospices or homes for chronically ill (%)
People in Group quarters - Military hospitals or wards for chronically ill (%)
People in Group quarters - Other hospitals or wards for chronically ill (%)
People in Group quarters - Hospitals or wards for drug/alcohol abuse (%)
People in Group quarters - Mental (Psychiatric) hospitals or wards (%)
People in Group quarters - Schools, hospitals, or wards for the mentally retarded (%)
People in Group quarters - Schools, hospitals, or wards for the physically handicapped (%)
People in Group quarters - Institutions for the deaf (%)
People in Group quarters - Institutions for the blind (%)
People in Group quarters - Orthopedic wards and institutions for the physically handicapped (%)
People in Group quarters - Wards in general hospitals for patients who have no usual home elsewhere (%)
People in Group quarters - Wards in military hospitals for patients who have no usual home elsewhere (%)
People in Group quarters - Juvenile institutions (%)
People in Group quarters - Long-term care (%)
People in Group quarters - Homes for abused, dependent, and neglected children (%)
People in Group quarters - Residential treatment centers for emotionally disturbed children (%)
People in Group quarters - Training schools for juvenile delinquents (%)
People in Group quarters - Short-term care, detention or diagnostic centers for delinquent children (%)
People in Group quarters - Type of juvenile institution unknown (%)
People in Group quarters - Noninstitutionalized population (%)
People in Group quarters - College dormitories (includes college quarters off campus) (%)
People in Group quarters - Military quarters (%)
People in Group quarters - On base (%)
People in Group quarters - Barracks, unaccompanied personnel housing (UPH), (Enlisted/Officer), ;and similar group living quarters for military personnel (%)
People in Group quarters - Transient quarters for temporary residents (%)
People in Group quarters - Military ships (%)
People in Group quarters - Group homes (%)
People in Group quarters - Homes or halfway houses for drug/alcohol abuse (%)
People in Group quarters - Homes for the mentally ill (%)
People in Group quarters - Homes for the mentally retarded (%)
People in Group quarters - Homes for the physically handicapped (%)
People in Group quarters - Other group homes (%)
People in Group quarters - Religious group quarters (%)
People in Group quarters - Dormitories (%)
People in Group quarters - Agriculture workers' dormitories on farms (%)
People in Group quarters - Job Corps and vocational training facilities (%)
People in Group quarters - Other workers' dormitories (%)
People in Group quarters - Crews of maritime vessels (%)
People in Group quarters - Other nonhousehold living situations (%)
People in Group quarters - Other noninstitutional group quarters (%)
Residents speaking English at home (%)
Residents speaking English at home - Born in the United States (%)
Residents speaking English at home - Native, born elsewhere (%)
Residents speaking English at home - Foreign born (%)
Residents speaking Spanish at home (%)
Residents speaking Spanish at home - Born in the United States (%)
Residents speaking Spanish at home - Native, born elsewhere (%)
Residents speaking Spanish at home - Foreign born (%)
Residents speaking other language at home (%)
Residents speaking other language at home - Born in the United States (%)
Residents speaking other language at home - Native, born elsewhere (%)
Residents speaking other language at home - Foreign born (%)
Class of Workers - Employee of private company (%)
Class of Workers - Self-employed in own incorporated business (%)
Class of Workers - Private not-for-profit wage and salary workers (%)
Class of Workers - Local government workers (%)
Class of Workers - State government workers (%)
Class of Workers - Federal government workers (%)
Class of Workers - Self-employed workers in own not incorporated business and Unpaid family workers (%)
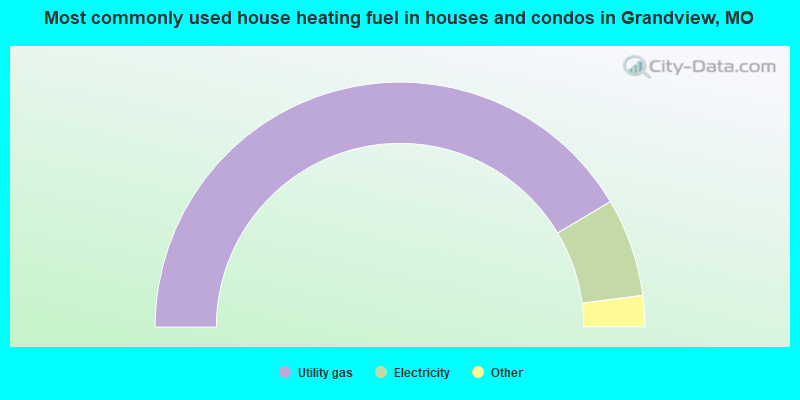
House heating fuel used in houses and condos - Utility gas (%)
House heating fuel used in houses and condos - Bottled, tank, or LP gas (%)
House heating fuel used in houses and condos - Electricity (%)
House heating fuel used in houses and condos - Fuel oil, kerosene, etc. (%)
House heating fuel used in houses and condos - Coal or coke (%)
House heating fuel used in houses and condos - Wood (%)
House heating fuel used in houses and condos - Solar energy (%)
House heating fuel used in houses and condos - Other fuel (%)
House heating fuel used in houses and condos - No fuel used (%)
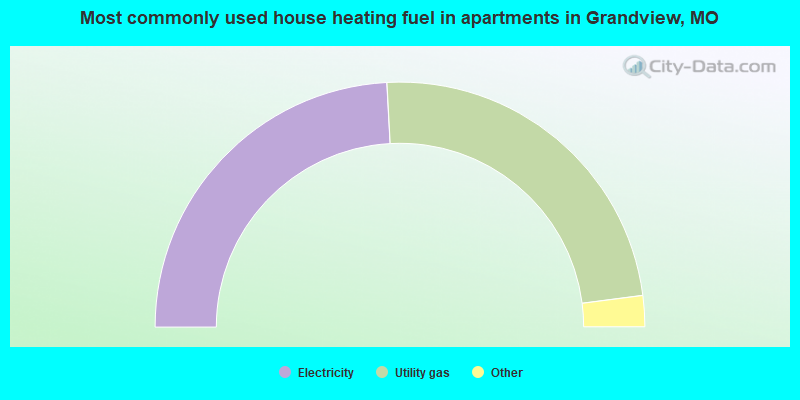
House heating fuel used in apartments - Utility gas (%)
House heating fuel used in apartments - Bottled, tank, or LP gas (%)
House heating fuel used in apartments - Electricity (%)
House heating fuel used in apartments - Fuel oil, kerosene, etc. (%)
House heating fuel used in apartments - Coal or coke (%)
House heating fuel used in apartments - Wood (%)
House heating fuel used in apartments - Solar energy (%)
House heating fuel used in apartments - Other fuel (%)
House heating fuel used in apartments - No fuel used (%)
Armed forces status - In Armed Forces (%)
Armed forces status - Civilian (%)
Armed forces status - Civilian - Veteran (%)
Armed forces status - Civilian - Nonveteran (%)
Fatal accidents locations in years 2005-2021
Fatal accidents locations in 2005
Fatal accidents locations in 2006
Fatal accidents locations in 2007
Fatal accidents locations in 2008
Fatal accidents locations in 2009
Fatal accidents locations in 2010
Fatal accidents locations in 2011
Fatal accidents locations in 2012
Fatal accidents locations in 2013
Fatal accidents locations in 2014
Fatal accidents locations in 2015
Fatal accidents locations in 2016
Fatal accidents locations in 2017
Fatal accidents locations in 2018
Fatal accidents locations in 2019
Fatal accidents locations in 2020
Fatal accidents locations in 2021
Alcohol use - People drinking some alcohol every month (%)
Alcohol use - People not drinking at all (%)
Alcohol use - Average days/month drinking alcohol
Alcohol use - Average drinks/week
Alcohol use - Average days/year people drink much
Audiometry - Average condition of hearing (%)
Audiometry - People that can hear a whisper from across a quiet room (%)
Audiometry - People that can hear normal voice from across a quiet room (%)
Audiometry - Ears ringing, roaring, buzzing (%)
Audiometry - Had a job exposure to loud noise (%)
Audiometry - Had off-work exposure to loud noise (%)
Blood Pressure & Cholesterol - Has high blood pressure (%)
Blood Pressure & Cholesterol - Checking blood pressure at home (%)
Blood Pressure & Cholesterol - Frequently checking blood cholesterol (%)
Blood Pressure & Cholesterol - Has high cholesterol level (%)
Consumer Behavior - Money monthly spent on food at supermarket/grocery store
Consumer Behavior - Money monthly spent on food at other stores
Consumer Behavior - Money monthly spent on eating out
Consumer Behavior - Money monthly spent on carryout/delivered foods
Consumer Behavior - Income spent on food at supermarket/grocery store (%)
Consumer Behavior - Income spent on food at other stores (%)
Consumer Behavior - Income spent on eating out (%)
Consumer Behavior - Income spent on carryout/delivered foods (%)
Current Health Status - General health condition (%)
Current Health Status - Blood donors (%)
Current Health Status - Has blood ever tested for HIV virus (%)
Current Health Status - Left-handed people (%)
Dermatology - People using sunscreen (%)
Diabetes - Diabetics (%)
Diabetes - Had a blood test for high blood sugar (%)
Diabetes - People taking insulin (%)
Diet Behavior & Nutrition - Diet health (%)
Diet Behavior & Nutrition - Milk product consumption (# of products/month)
Diet Behavior & Nutrition - Meals not home prepared (#/week)
Diet Behavior & Nutrition - Meals from fast food or pizza place (#/week)
Diet Behavior & Nutrition - Ready-to-eat foods (#/month)
Diet Behavior & Nutrition - Frozen meals/pizza (#/month)
Drug Use - People that ever used marijuana or hashish (%)
Drug Use - Ever used hard drugs (%)
Drug Use - Ever used any form of cocaine (%)
Drug Use - Ever used heroin (%)
Drug Use - Ever used methamphetamine (%)
Health Insurance - People covered by health insurance (%)
Kidney Conditions-Urology - Avg. # of times urinating at night
Medical Conditions - People with asthma (%)
Medical Conditions - People with anemia (%)
Medical Conditions - People with psoriasis (%)
Medical Conditions - People with overweight (%)
Medical Conditions - Elderly people having difficulties in thinking or remembering (%)
Medical Conditions - People who ever received blood transfusion (%)
Medical Conditions - People having trouble seeing even with glass/contacts (%)
Medical Conditions - People with arthritis (%)
Medical Conditions - People with gout (%)
Medical Conditions - People with congestive heart failure (%)
Medical Conditions - People with coronary heart disease (%)
Medical Conditions - People with angina pectoris (%)
Medical Conditions - People who ever had heart attack (%)
Medical Conditions - People who ever had stroke (%)
Medical Conditions - People with emphysema (%)
Medical Conditions - People with thyroid problem (%)
Medical Conditions - People with chronic bronchitis (%)
Medical Conditions - People with any liver condition (%)
Medical Conditions - People who ever had cancer or malignancy (%)
Mental Health - People who have little interest in doing things (%)
Mental Health - People feeling down, depressed, or hopeless (%)
Mental Health - People who have trouble sleeping or sleeping too much (%)
Mental Health - People feeling tired or having little energy (%)
Mental Health - People with poor appetite or overeating (%)
Mental Health - People feeling bad about themself (%)
Mental Health - People who have trouble concentrating on things (%)
Mental Health - People moving or speaking slowly or too fast (%)
Mental Health - People having thoughts they would be better off dead (%)
Oral Health - Average years since last visit a dentist
Oral Health - People embarrassed because of mouth (%)
Oral Health - People with gum disease (%)
Oral Health - General health of teeth and gums (%)
Oral Health - Average days a week using dental floss/device
Oral Health - Average days a week using mouthwash for dental problem
Oral Health - Average number of teeth
Pesticide Use - Households using pesticides to control insects (%)
Pesticide Use - Households using pesticides to kill weeds (%)
Physical Activity - People doing vigorous-intensity work activities (%)
Physical Activity - People doing moderate-intensity work activities (%)
Physical Activity - People walking or bicycling (%)
Physical Activity - People doing vigorous-intensity recreational activities (%)
Physical Activity - People doing moderate-intensity recreational activities (%)
Physical Activity - Average hours a day doing sedentary activities
Physical Activity - Average hours a day watching TV or videos
Physical Activity - Average hours a day using computer
Physical Functioning - People having limitations keeping them from working (%)
Physical Functioning - People limited in amount of work they can do (%)
Physical Functioning - People that need special equipment to walk (%)
Physical Functioning - People experiencing confusion/memory problems (%)
Physical Functioning - People requiring special healthcare equipment (%)
Prescription Medications - Average number of prescription medicines taking
Preventive Aspirin Use - Adults 40+ taking low-dose aspirin (%)
Reproductive Health - Vaginal deliveries (%)
Reproductive Health - Cesarean deliveries (%)
Reproductive Health - Deliveries resulted in a live birth (%)
Reproductive Health - Pregnancies resulted in a delivery (%)
Reproductive Health - Women breastfeeding newborns (%)
Reproductive Health - Women that had a hysterectomy (%)
Reproductive Health - Women that had both ovaries removed (%)
Reproductive Health - Women that have ever taken birth control pills (%)
Reproductive Health - Women taking birth control pills (%)
Reproductive Health - Women that have ever used Depo-Provera or injectables (%)
Reproductive Health - Women that have ever used female hormones (%)
Sexual Behavior - People 18+ that ever had sex (vaginal, anal, or oral) (%)
Sexual Behavior - Males 18+ that ever had vaginal sex with a woman (%)
Sexual Behavior - Males 18+ that ever performed oral sex on a woman (%)
Sexual Behavior - Males 18+ that ever had anal sex with a woman (%)
Sexual Behavior - Males 18+ that ever had any sex with a man (%)
Sexual Behavior - Females 18+ that ever had vaginal sex with a man (%)
Sexual Behavior - Females 18+ that ever performed oral sex on a man (%)
Sexual Behavior - Females 18+ that ever had anal sex with a man (%)
Sexual Behavior - Females 18+ that ever had any kind of sex with a woman (%)
Sexual Behavior - Average age people first had sex
Sexual Behavior - Average number of female sex partners in lifetime (males 18+)
Sexual Behavior - Average number of female vaginal sex partners in lifetime (males 18+)
Sexual Behavior - Average age people first performed oral sex on a woman (18+)
Sexual Behavior - Average number of woman performed oral sex on in lifetime (18+)
Sexual Behavior - Average number of male sex partners in lifetime (males 18+)
Sexual Behavior - Average number of male anal sex partners in lifetime (males 18+)
Sexual Behavior - Average age people first performed oral sex on a man (18+)
Sexual Behavior - Average number of male oral sex partners in lifetime (18+)
Sexual Behavior - People using protection when performing oral sex (%)
Sexual Behavior - Average number of times people have vaginal or anal sex a year
Sexual Behavior - People having sex without condom (%)
Sexual Behavior - Average number of male sex partners in lifetime (females 18+)
Sexual Behavior - Average number of male vaginal sex partners in lifetime (females 18+)
Sexual Behavior - Average number of female sex partners in lifetime (females 18+)
Sexual Behavior - Circumcised males 18+ (%)
Sleep Disorders - Average hours sleeping at night
Sleep Disorders - People that has trouble sleeping (%)
Smoking-Cigarette Use - People smoking cigarettes (%)
Taste & Smell - People 40+ having problems with smell (%)
Taste & Smell - People 40+ having problems with taste (%)
Taste & Smell - People 40+ that ever had wisdom teeth removed (%)
Taste & Smell - People 40+ that ever had tonsils teeth removed (%)
Taste & Smell - People 40+ that ever had a loss of consciousness because of a head injury (%)
Taste & Smell - People 40+ that ever had a broken nose or other serious injury to face or skull (%)
Taste & Smell - People 40+ that ever had two or more sinus infections (%)
Weight - Average height (inches)
Weight - Average weight (pounds)
Weight - Average BMI
Weight - People that are obese (%)
Weight - People that ever were obese (%)
Weight - People trying to lose weight (%)
According to our research of Missouri and other state lists, there were 48 registered sex offenders living in Grandview, Missouri as of June 15, 2024 . The ratio of all residents to sex offenders in Grandview is 530 to 1.The ratio of registered sex offenders to all residents in this city is lower than the state average.
Officers per 1,000 residents here:
2.06Missouri average:
2.54
Latest news from Grandview, MO collected exclusively by city-data.com from local newspapers, TV, and radio stations
Ancestries: German (6.5%), American (4.0%), Irish (3.1%), English (2.6%), Palestinian (1.7%), Italian (1.3%).
Current Local Time:
Land area: 14.7 square miles.
Population density: 1,739 people per square mile (low).
1,880 residents are foreign born (4.8% Latin America , 1.3% Asia ).
This city:
7.2%Missouri:
4.2%
Median real estate property taxes paid for housing units with mortgages in 2022: $1,935 (1.0%)Median real estate property taxes paid for housing units with no mortgage in 2022: $1,785 (1.2%)
Nearest city with pop. 50,000+: Lee's Summit, MO
Nearest city with pop. 200,000+: Kansas City, MO
Nearest city with pop. 1,000,000+: Chicago, IL
Nearest cities:
Unity Village, MO (2.8 miles),
Latitude: 38.89 N, Longitude: 94.52 W
Daytime population change due to commuting: -1,490 (-5.7%)Workers who live and work in this city: 3,339 (26.4%)
Area code commonly used in this area: 816
Single-family new house construction building permits:
2022: 7 buildings , average cost: $147,7002021: 11 buildings , average cost: $147,7002020: 9 buildings , average cost: $150,1002019: 5 buildings , average cost: $141,3002018: 8 buildings , average cost: $147,9002016: 1 building , cost: $144,2002015: 4 buildings , average cost: $136,4002014: 7 buildings , average cost: $144,2002013: 22 buildings , average cost: $118,0002012: 26 buildings , average cost: $113,2002011: 19 buildings , average cost: $114,2002010: 26 buildings , average cost: $117,5002009: 37 buildings , average cost: $115,8002008: 17 buildings , average cost: $106,8002007: 23 buildings , average cost: $122,8002006: 26 buildings , average cost: $156,0002005: 48 buildings , average cost: $132,2002004: 45 buildings , average cost: $138,6002003: 32 buildings , average cost: $123,6002002: 33 buildings , average cost: $123,0002001: 24 buildings , average cost: $115,8002000: 8 buildings , average cost: $113,4001999: 45 buildings , average cost: $116,1001998: 55 buildings , average cost: $98,4001997: 39 buildings , average cost: $97,900Unemployment in December 2023:
Most common occupations in Grandview, MO (%)
Both Males Females
Other office and administrative support workers, including supervisors (5.7%)
Other management occupations, except farmers and farm managers (5.0%)
Material recording, scheduling, dispatching, and distributing workers (3.7%)
Building and grounds cleaning and maintenance occupations (3.5%)
Other production occupations, including supervisors (3.5%)
Other sales and related occupations, including supervisors (3.4%)
Laborers and material movers, hand (3.1%)
Other management occupations, except farmers and farm managers (5.6%)
Laborers and material movers, hand (5.4%)
Material recording, scheduling, dispatching, and distributing workers (4.9%)
Other production occupations, including supervisors (4.7%)
Electrical equipment mechanics and other installation, maintenance, and repair workers, including supervisors (4.3%)
Building and grounds cleaning and maintenance occupations (4.1%)
Other sales and related occupations, including supervisors (3.8%)
Other office and administrative support workers, including supervisors (9.4%)
Secretaries and administrative assistants (5.6%)
Other management occupations, except farmers and farm managers (4.3%)
Child care workers (3.4%)
Cashiers (3.2%)
Preschool, kindergarten, elementary, and middle school teachers (3.2%)
Customer service representatives (3.2%)
Tornado activity:
Grandview-area historical tornado activity is slightly above Missouri state average. It is 95% greater than the overall U.S. average.
On 5/20/1957, a category F5 (max. wind speeds 261-318 mph) tornado 9.3 miles away from the Grandview city center killed 44 people and injured 207 people and caused between $500,000 and $5,000,000 in damages.
On 5/22/1952, a category F4 (max. wind speeds 207-260 mph) tornado 16.6 miles away from the city center injured 3 people and caused between $50,000 and $500,000 in damages.
Earthquake activity:
Grandview-area historical earthquake activity is significantly above Missouri state average. It is 515% greater than the overall U.S. average. On 9/3/2016 at 12:02:44, a magnitude 5.8 (5.8 MW, Depth: 3.5 mi, Class: Moderate, Intensity: VI - VII) earthquake occurred 215.2 miles away from the city center On 11/6/2011 at 03:53:10, a magnitude 5.7 (5.7 MW, Depth: 3.2 mi) earthquake occurred 262.7 miles away from Grandview center On 11/12/2014 at 21:40:00, a magnitude 4.9 (4.9 MW, Depth: 2.5 mi, Class: Light, Intensity: IV - V) earthquake occurred 202.2 miles away from Grandview center On 11/7/2016 at 01:44:24, a magnitude 5.0 (5.0 MW, Depth: 2.8 mi) earthquake occurred 236.1 miles away from the city center On 2/13/2016 at 17:07:06, a magnitude 5.1 (5.1 MW, Depth: 5.2 mi) earthquake occurred 282.7 miles away from the city center On 1/19/2020 at 19:08:42, a magnitude 4.5 (4.5 MW, Depth: 3.1 mi) earthquake occurred 196.1 miles away from Grandview center Magnitude types: moment magnitude (MW) Natural disasters: The number of natural disasters in Jackson County (24) is greater than the US average (15).Major Disasters (Presidential) Declared: 17Emergencies Declared: 5Floods: 18, Storms: 15, Tornadoes: 8, Winter Storms: 2, Drought: 1, Heavy Rain: 1, Hurricane: 1, Ice Storm: 1, Wind: 1, Other: 1 (Note: some incidents may be assigned to more than one category). Main business address for: NASB FINANCIAL INC SAVINGS INSTITUTION, FEDERALLY CHARTERED ).
Hospitals and medical centers in Grandview: GRANDVIEW MANOR CARE CENTER (5301 HARRY TRUMAN DR)
GRANDVIEW VILLA NURSING CENTER (13111 SPRING ST)
LIFE CARE CENTER OF GRANDVIEW (6301 EAST 125TH ST)
GRANDVIEW DIALYSIS (13812 S 71 HWY)
Amtrak stations near Grandview: 9 miles: LEE'S SUMMIT (220 S. MAIN ST.) Services: enclosed waiting area, public payphones, free short-term parking, free long-term parking, call for taxi service.
15 miles: KANSAS CITY (2200 MAIN ST.) Services: ticket office, fully wheelchair accessible, enclosed waiting area, public restrooms, public payphones, snack bar, free short-term parking, paid long-term parking, call for car rental service, taxi stand, public transit connection.
15 miles: INDEPENDENCE (600 S. GRAND AVE.) Services: free short-term parking, call for taxi service.
Colleges/universities with over 2000 students nearest to Grandview:
Wright Career College (about 9 miles; Overland Park, KS ; Full-time enrollment: 3,107)
Rockhurst University (about 11 miles; Kansas City, MO ; FT enrollment: 2,013)
University of Missouri-Kansas City (about 11 miles; Kansas City, MO ; FT enrollment: 10,544)
Johnson County Community College (about 12 miles; Overland Park, KS ; FT enrollment: 11,976)
Metropolitan Community College-Kansas City (about 14 miles; Kansas City, MO ; FT enrollment: 12,834)
MidAmerica Nazarene University (about 15 miles; Olathe, KS ; FT enrollment: 2,158)
Kansas City Kansas Community College (about 21 miles; Kansas City, KS ; FT enrollment: 4,718)
Public high schools in Grandview:
Private high school in Grandview: GRANDVIEW CHRISTIAN SCHOOL Students: 118, Location: 12340 GRANDVIEW RD, Grades: KG-12)
Public elementary/middle schools in Grandview: GRANDVIEW MIDDLE Students: 655, Location: 12650 MANCHESTER, Grades: 6-8)MEADOWMERE ELEM. Students: 394, Location: 7010 E 136TH ST, Grades: KG-5)BELVIDERE ELEM. Students: 305, Location: 15200 WHITE AVE, Grades: KG-5)CONN-WEST ELEM. Students: 257, Location: 1100 HIGH GROVE RD, Grades: KG-5)BUTCHER-GREENE ELEM. Students: 247, Location: 5302 E 140TH, Grades: PK-5)HIGH GROVE ELEM. Location: 2500 HIGH GROVE RD, Grades: PK-5)
Private elementary/middle schools in Grandview: SECOND MISSIONARY BAPTIST SCHOOL Students: 49, Location: 5111 HARRY S TRUMAN DR, Grades: PK-1)
LIFE A-NEW PREPARATORY ACADEMY Students: 39, Location: 12401 BYARS RD, Grades: PK-6)
See full list of schools located in Grandview Birthplace of: Alec Burks - Basketball player, Larry Noble - Politician.
Jackson County has a predicted average indoor radon screening level greater than 4 pCi/L (pico curies per liter) - Highest Potential Average household size: This city:
2.5 peopleMissouri:
2.5 people
Percentage of family households: This city:
63.7%Whole state:
65.3%
Percentage of households with unmarried partners: This city:
7.5%Whole state:
6.7%
Likely homosexual households (counted as self-reported same-sex unmarried-partner households)
Lesbian couples: 0.3% of all households Gay men: 0.2% of all households
People in group quarters in Grandview in 2010:
102 people in nursing facilities/skilled-nursing facilities
27 people in group homes intended for adults
19 people in group homes for juveniles (non-correctional)
People in group quarters in Grandview in 2000:
237 people in nursing homes
23 people in homes for the mentally retarded
11 people in homes for the physically handicapped
7 people in training schools for juvenile delinquents
Banks with branches in Grandview (2011 data):
UMB Bank, National Association: Hickman Mills Branch at 12210 S 71 Highway, branch established on 1921/01/01. Info updated 2007/12/13: Bank assets: $11,205.9 mil, Deposits: $8,538.8 mil, headquarters in Kansas City, MO, positive income , 107 total offices , Holding Company: Umb Financial Corporation
Commerce Bank: Grandview Branch at 12829 South Highway 71, branch established on 1976/07/14. Info updated 2011/07/07: Bank assets: $20,493.6 mil, Deposits: $16,805.3 mil, headquarters in Kansas City, MO, positive income , 206 total offices , Holding Company: Commerce Bancshares, Inc.
North American Savings Bank, F.S.B.: North American Savings Bank, F.S.b. at 125th And South 71 Highway, branch established on 1923/01/01. Info updated 2011/07/21: Bank assets: $1,184.7 mil, Deposits: $889.0 mil, local headquarters , negative income in the last year , Commercial Lending Specialization, 9 total offices
First Federal Bank, FSB: 5901 Main Street Branch at 5901 Main Street, branch established on 1934/07/01. Info updated 2011/07/21: Bank assets: $374.8 mil, Deposits: $280.7 mil, headquarters in Kansas City, MO, negative income in the last year , Mortgage Lending Specialization, 8 total offices
Bank Midwest, National Association: Grandview Highway 71 Branch # 4 at 12500 South 71 Highway, branch established on 1993/04/05. Info updated 2012/03/19: Bank assets: $6,237.6 mil, Deposits: $5,064.6 mil, headquarters in Kansas City, MO, positive income , 138 total offices , Holding Company: Nbh Holdings Corp.
For population 15 years and over in Grandview:
Never married: 41.7%Now married: 37.6%Separated: 1.8%Widowed: 5.9%Divorced: 13.0% For population 25 years and over in Grandview:
High school or higher: 90.7%Bachelor's degree or higher: 23.5%Graduate or professional degree: 7.4%Unemployed: 4.9%Mean travel time to work (commute): 18.3 minutes
Education Gini index (Inequality in education) Here:
10.8Missouri average:
11.1
Religion statistics for Grandview, MO (based on Jackson County data)
Religion Adherents Congregations Evangelical Protestant 154,390 404 Catholic 69,441 52 Mainline Protestant 61,299 159 Other 34,880 110 Black Protestant 34,722 84 Orthodox 1,235 3 None 318,191 -
Source: Clifford Grammich, Kirk Hadaway, Richard Houseal, Dale E.Jones, Alexei Krindatch, Richie Stanley and Richard H.Taylor. 2012. 2010 U.S.Religion Census: Religious Congregations & Membership Study. Association of Statisticians of American Religious Bodies. Jones, Dale E., et al. 2002. Congregations and Membership in the United States 2000. Nashville, TN: Glenmary Research Center. Graphs represent county-level data
Food Environment Statistics: Number of grocery stores : 109Jackson County :
1.64 / 10,000 pop.Missouri :
1.88 / 10,000 pop.
Number of supercenters and club stores : 10Jackson County :
0.15 / 10,000 pop.Missouri :
0.18 / 10,000 pop.
Number of convenience stores (no gas) : 40This county :
0.60 / 10,000 pop.Missouri :
0.60 / 10,000 pop.
Number of convenience stores (with gas) : 185Jackson County :
2.78 / 10,000 pop.Missouri :
4.34 / 10,000 pop.
Number of full-service restaurants : 460This county :
6.91 / 10,000 pop.Missouri :
7.37 / 10,000 pop.
Adult diabetes rate : Jackson County :
9.1%Missouri :
8.8%
Adult obesity rate : This county :
30.8%Missouri :
29.6%
Low-income preschool obesity rate : This county :
14.0%State :
13.5%
Health and Nutrition: Healthy diet rate : Grandview:
47.8%State:
50.9%
Average overall health of teeth and gums : Average BMI : This city:
29.3Missouri:
28.7
People feeling badly about themselves : Grandview:
20.9%Missouri:
20.6%
People not drinking alcohol at all : Grandview:
11.1%Missouri:
10.1%
Average hours sleeping at night : Grandview:
6.7Missouri:
6.8
Overweight people : Grandview:
34.8%Missouri:
34.3%
General health condition : Grandview:
55.0%State:
57.5%
Average condition of hearing : More about Health and Nutrition of Grandview, MO Residents
Local government employment and payroll (March 2022)
Function
Full-time employees
Monthly full-time payroll
Average yearly full-time wage
Part-time employees
Monthly part-time payroll
Police Protection - Officers
58 $286,053 $59,183 0 $0 Firefighters
43 $201,095 $56,120 0 $0 Parks and Recreation
18 $74,362 $49,575 67 $74,250 Financial Administration
14 $56,740 $48,634 9 $14,197 Other Government Administration
13 $83,753 $77,310 16 $22,044 Police - Other
10 $37,358 $44,830 7 $11,003 Housing and Community Development (Local)
10 $48,054 $57,665 0 $0 Sewerage
9 $30,913 $41,217 0 $0 Streets and Highways
7 $26,836 $46,005 0 $0 Fire - Other
6 $44,877 $89,754 0 $0 Judicial and Legal
0 $0 6 $6,751
Totals for Government
188 $890,042 $56,811 105 $128,245
Grandview government finances - Expenditure in 2021 (per resident):
Current Operations - General - Other: $13,117,000 ($512.18)
Police Protection: $6,481,000 ($253.07)Local Fire Protection: $4,891,000 ($190.98)Sewerage: $4,728,000 ($184.62)Parks and Recreation: $3,865,000 ($150.92)Regular Highways: $2,987,000 ($116.63)Central Staff Services: $1,146,000 ($44.75)Financial Administration: $1,105,000 ($43.15)Housing and Community Development: $602,000 ($23.51)Judicial and Legal Services: $275,000 ($10.74)Protective Inspection and Regulation - Other: $258,000 ($10.07)General - Interest on Debt: $632,000 ($24.68)
Total Salaries and Wages: $11,213,000 ($437.84)
Grandview government finances - Revenue in 2021 (per resident):
Charges - Sewerage: $4,601,000 ($179.66)
Parks and Recreation: $1,965,000 ($76.73)Miscellaneous - General Revenue - Other: $10,426,000 ($407.11)
Fines and Forfeits: $852,000 ($33.27)Interest Earnings: $376,000 ($14.68)State Intergovernmental - Highways: $624,000 ($24.37)
Tax - General Sales and Gross Receipts: $11,241,000 ($438.93)
Property: $6,683,000 ($260.95)Public Utilities Sales: $3,159,000 ($123.35)Occupation and Business License - Other: $307,000 ($11.99)Motor Vehicle License: $95,000 ($3.71)Tobacco Products Sales: $67,000 ($2.62)Alcoholic Beverage License: $26,000 ($1.02)
Grandview government finances - Debt in 2021 (per resident):
Long Term Debt - Beginning Outstanding - Unspecified Public Purpose: $15,795,000 ($616.75)
Outstanding Unspecified Public Purpose: $14,210,000 ($554.86)Retired Unspecified Public Purpose: $1,585,000 ($61.89)
7.09% of this county's 2021 resident taxpayers lived in other counties in 2020 ($55,298 average adjusted gross income )
Here:
7.09%Missouri average:
7.67%
0.01% of residents moved from foreign countries ($84 average AGI )Jackson County:
0.01%Missouri average:
0.02%
Top counties from which taxpayers relocated into this county between 2020 and 2021:
7.47% of this county's 2020 resident taxpayers moved to other counties in 2021 ($66,055 average adjusted gross income )
Here:
7.47%Missouri average:
7.51%
0.01% of residents moved to foreign countries ($37 average AGI )Jackson County:
0.01%Missouri average:
0.01%
Top counties to which taxpayers relocated from this county between 2020 and 2021:
Businesses in Grandview, MO
Name Count Name Count
7-Eleven 1 Little Caesars Pizza 1 Advance Auto Parts 1 McDonald's 1 Applebee's 1 Papa John's Pizza 1 Arby's 1 Payless 1 AutoZone 1 Pizza Hut 2 Blockbuster 1 Popeyes 1 Burger King 1 RadioShack 1 CVS 1 Rodeway Inn 1 Cricket Wireless 2 SONIC Drive-In 2 Curves 1 Sam's Club 1 Fashion Bug 1 Sprint Nextel 1 FedEx 1 Subway 2 Firestone Complete Auto Care 1 Taco Bell 1 GNC 1 True Value 1 H&R Block 1 UPS 4 Holiday Inn 1 Waffle House 1 IHOP 1 Walgreens 1 KFC 1 Wendy's 1
Strongest AM radio stations in Grandview:
KCSP (610 AM; 5 kW; KANSAS CITY, MO; Owner: ENTERCOM KANSAS CITY LICENSE, LLC)
WHB (810 AM; 50 kW; KANSAS CITY, MO; Owner: UNION BROADCASTING, INC.)
KCCV (760 AM; daytime; 6 kW; OVERLAND PARK, KS; Owner: BOTT BROADCASTING COMPANY)
KKHK (1250 AM; 25 kW; KANSAS CITY, KS)
KXTR (1660 AM; 10 kW; KANSAS CITY, KS; Owner: ENTERCOM KANSAS CITY LICENSE, LLC)
KCTE (1510 AM; daytime; 10 kW; INDEPENDENCE, MO; Owner: UNION BROADCASTING, INC.)
KMBZ (980 AM; 5 kW; KANSAS CITY, MO; Owner: ENTERCOM KANSAS CITY LICENSE, LLC)
KPHN (1190 AM; 5 kW; KANSAS CITY, MO; Owner: ABC, INC.)
KCMO (710 AM; 10 kW; KANSAS CITY, MO; Owner: SUSQUEHANNA KANSAS CITY PARTNERSHIP)
KCNW (1380 AM; 2 kW; FAIRWAY, KS; Owner: KANSAS CITY RADIO, INC.)
KPRT (1590 AM; 1 kW; KANSAS CITY, MO; Owner: CARTER BROADCAST GROUP, INC.)
KKLO (1410 AM; 5 kW; LEAVENWORTH, KS; Owner: CHARA COMMUNICATIONS, INC.)
KCZZ (1480 AM; 1 kW; MISSION, KS; Owner: HMEB COMMUNICATIONS, L.L.C.)
Strongest FM radio stations in Grandview:
KMXV (93.3 FM; KANSAS CITY, MO; Owner: INFINITY RADIO OPERATIONS INC.)
KQRC-FM (98.9 FM; LEAVENWORTH, KS; Owner: ENTERCOM KANSAS CITY LICENSE, LLC)
KRBZ (96.5 FM; KANSAS CITY, MO; Owner: ENTERCOM KANSAS CITY LICENSE, LLC)
KYYS (99.7 FM; KANSAS CITY, MO; Owner: ENTERCOM KANSAS CITY LICENSE, LLC)
KPRS (103.3 FM; KANSAS CITY, MO; Owner: CARTER BROADCAST GROUP, INC.)
KCFX (101.1 FM; HARRISONVILLE, MO; Owner: SUSQUEHANNA KANSAS CITY PARTNERSHIP)
KZPL (97.3 FM; LEE'S SUMMIT, MO; Owner: UNION FIRST BROADCASTING, LLC)
WDAF-FM (106.5 FM; LIBERTY, MO; Owner: ENTERCOM KANSAS CITY LICENSE, LLC)
KCMO-FM (94.9 FM; KANSAS CITY, MO; Owner: SUSQUEHANNA KANSAS CITY PARTNERSHIP)
KUDL (98.1 FM; KANSAS CITY, KS; Owner: ENTERCOM KANSAS CITY LICENSE, LLC)
KSRC (102.1 FM; KANSAS CITY, MO; Owner: INFINITY RADIO OPERATIONS INC.)
KBEQ-FM (104.3 FM; KANSAS CITY, MO; Owner: INFINITY RADIO SUBSIDIARY OPERATIONS INC.)
KCUR-FM (89.3 FM; KANSAS CITY, MO; Owner: CURATORS OF UNIVERSITY OF MISSOURI)
KLJC (88.5 FM; KANSAS CITY, MO; Owner: CALVARY BIBLE COLLEGE)
KFKF-FM (94.1 FM; KANSAS CITY, KS; Owner: INFINITY RADIO SUBSIDIARY OPERATIONS INC.)
KKFI (90.1 FM; KANSAS CITY, MO; Owner: MID-COAST RADIO PROJECT, INC.)
KCCV-FM (92.3 FM; OLATHE, KS; Owner: BOTT BROADCASTING COMPANY)
KMJK (107.3 FM; LEXINGTON, MO; Owner: ALLUR-KANSAS CITY, INC.)
TV broadcast stations around Grandview:
KMCI (Channel 38; LAWRENCE, KS; Owner: SCRIPPS HOWARD BROADCASTING COMPANY)
KPXE (Channel 50; KANSAS CITY, MO; Owner: PAXSON KANSAS CITY LICENSE, INC.)
KMBC-TV (Channel 9; KANSAS CITY, MO; Owner: KMBC HEARST-ARGYLE TELEVISION, INC.)
K35CT (Channel 35; KANSAS CITY, MO; Owner: WORD OF GOD FELLOWSHIP, INC.)
KCTV (Channel 5; KANSAS CITY, MO; Owner: MEREDITH CORPORATION)
KCPT (Channel 19; KANSAS CITY, MO; Owner: PUBLIC TELEVISION 19, INC.)
KSMO-TV (Channel 62; KANSAS CITY, MO; Owner: KSMO LICENSEE, INC.)
KCWE (Channel 29; KANSAS CITY, MO; Owner: KCWE-TV, INC.)
KSHB-TV (Channel 41; KANSAS CITY, MO; Owner: SCRIPPS HOWARD BROADCASTING COMPANY)
WDAF-TV (Channel 4; KANSAS CITY, MO; Owner: WDAF LICENSE, INC.)
K48FS (Channel 48; KANSAS CITY, MO; Owner: WORD OF GOD FELLOWSHIP, INC.)
K26CR (Channel 26; KANSAS CITY, MO; Owner: VENTANA TELEVISION, INC.)
K27FR (Channel 27; OVERLAND PARK, KS; Owner: UNIVERSITY OF KANSAS)
National Bridge Inventory (NBI) Statistics 58 Number of bridges594ft / 181m Total length $2,329,000 Total costs885,004 Total average daily traffic105,966 Total average daily truck traffic
New bridges - historical statistics
1 1940-1949 2 1950-1959 5 1960-1969 7 1970-1979 7 1980-1989 4 1990-1999 18 2000-2009 14 2010-2019
See full National Bridge Inventory statistics for Grandview, MO
Home Mortgage Disclosure Act Aggregated Statistics For Year 2009(Based on 5 full tracts) A) FHA, FSA/RHS & VA B) Conventional C) Refinancings D) Home Improvement Loans E) Loans on Dwellings For 5+ Families F) Non-occupant Loans on G) Loans On Manufactured Number Average Value Number Average Value Number Average Value Number Average Value Number Average Value Number Average Value Number Average Value
LOANS ORIGINATED 174 $105,178 86 $77,267 293 $117,717 20 $43,450 2 $1,565,000 58 $116,276 0 $0 APPLICATIONS APPROVED, NOT ACCEPTED 13 $110,538 2 $40,500 49 $107,510 8 $17,375 0 $0 3 $45,667 0 $0 APPLICATIONS DENIED 33 $101,848 18 $82,333 198 $109,505 27 $23,111 0 $0 21 $84,190 1 $38,000 APPLICATIONS WITHDRAWN 25 $105,520 6 $143,167 125 $108,760 8 $47,625 1 $2,434,000 7 $108,000 1 $76,000 FILES CLOSED FOR INCOMPLETENESS 2 $141,500 0 $0 28 $115,786 0 $0 0 $0 1 $84,000 0 $0
Aggregated Statistics For Year 2008(Based on 5 full tracts) A) FHA, FSA/RHS & VA B) Conventional C) Refinancings D) Home Improvement Loans E) Loans on Dwellings For 5+ Families F) Non-occupant Loans on G) Loans On Manufactured Number Average Value Number Average Value Number Average Value Number Average Value Number Average Value Number Average Value Number Average Value
LOANS ORIGINATED 154 $105,818 183 $81,372 266 $118,263 40 $24,250 0 $0 138 $81,580 0 $0 APPLICATIONS APPROVED, NOT ACCEPTED 13 $108,692 16 $88,500 55 $110,855 14 $13,286 0 $0 13 $75,846 0 $0 APPLICATIONS DENIED 9 $107,667 46 $113,348 354 $116,630 84 $39,310 1 $500,000 37 $77,514 4 $20,000 APPLICATIONS WITHDRAWN 17 $117,882 19 $93,789 176 $119,114 18 $52,056 0 $0 17 $80,353 0 $0 FILES CLOSED FOR INCOMPLETENESS 4 $139,500 6 $154,000 29 $121,241 2 $17,500 0 $0 4 $111,500 0 $0
Aggregated Statistics For Year 2007(Based on 5 full tracts) A) FHA, FSA/RHS & VA B) Conventional C) Refinancings D) Home Improvement Loans E) Loans on Dwellings For 5+ Families F) Non-occupant Loans on G) Loans On Manufactured Number Average Value Number Average Value Number Average Value Number Average Value Number Average Value Number Average Value Number Average Value
LOANS ORIGINATED 49 $117,612 359 $93,368 402 $100,216 64 $41,734 2 $2,911,000 171 $78,509 0 $0 APPLICATIONS APPROVED, NOT ACCEPTED 6 $107,833 46 $87,304 110 $108,327 18 $48,167 0 $0 21 $66,571 1 $39,000 APPLICATIONS DENIED 8 $108,125 91 $100,429 536 $112,278 112 $44,429 0 $0 43 $81,279 3 $100,000 APPLICATIONS WITHDRAWN 7 $122,857 40 $94,625 239 $113,046 20 $74,650 0 $0 23 $88,870 0 $0 FILES CLOSED FOR INCOMPLETENESS 2 $89,500 24 $91,125 70 $116,657 2 $25,500 0 $0 4 $94,750 0 $0
Aggregated Statistics For Year 2006(Based on 5 full tracts) A) FHA, FSA/RHS & VA B) Conventional C) Refinancings D) Home Improvement Loans E) Loans on Dwellings For 5+ Families F) Non-occupant Loans on G) Loans On Manufactured Number Average Value Number Average Value Number Average Value Number Average Value Number Average Value Number Average Value Number Average Value
LOANS ORIGINATED 66 $103,197 580 $82,155 587 $95,397 83 $43,639 5 $3,188,800 194 $72,010 1 $25,000 APPLICATIONS APPROVED, NOT ACCEPTED 7 $126,000 121 $85,818 189 $105,222 20 $71,450 0 $0 14 $86,857 2 $54,000 APPLICATIONS DENIED 6 $132,333 229 $91,550 716 $103,809 134 $45,545 2 $47,000 67 $72,776 4 $62,750 APPLICATIONS WITHDRAWN 8 $108,500 123 $87,447 402 $105,032 19 $67,211 0 $0 35 $82,114 0 $0 FILES CLOSED FOR INCOMPLETENESS 1 $90,000 31 $99,000 98 $114,163 1 $75,000 0 $0 9 $66,000 0 $0
Aggregated Statistics For Year 2005(Based on 5 full tracts) A) FHA, FSA/RHS & VA B) Conventional C) Refinancings D) Home Improvement Loans E) Loans on Dwellings For 5+ Families F) Non-occupant Loans on G) Loans On Manufactured Number Average Value Number Average Value Number Average Value Number Average Value Number Average Value Number Average Value Number Average Value
LOANS ORIGINATED 81 $108,222 593 $76,858 704 $92,567 81 $49,852 3 $601,333 225 $67,000 1 $16,000 APPLICATIONS APPROVED, NOT ACCEPTED 4 $101,250 97 $80,320 139 $93,317 18 $42,944 0 $0 29 $63,552 1 $33,000 APPLICATIONS DENIED 11 $109,818 210 $82,090 732 $100,329 124 $36,573 0 $0 61 $65,180 4 $87,000 APPLICATIONS WITHDRAWN 4 $89,000 145 $94,517 463 $101,151 38 $127,211 0 $0 28 $85,321 1 $59,000 FILES CLOSED FOR INCOMPLETENESS 0 $0 31 $82,516 75 $109,053 4 $58,750 0 $0 11 $78,727 1 $60,000
Aggregated Statistics For Year 2004(Based on 5 full tracts) A) FHA, FSA/RHS & VA B) Conventional C) Refinancings D) Home Improvement Loans E) Loans on Dwellings For 5+ Families F) Non-occupant Loans on G) Loans On Manufactured Number Average Value Number Average Value Number Average Value Number Average Value Number Average Value Number Average Value Number Average Value
LOANS ORIGINATED 87 $102,540 452 $83,569 824 $90,091 73 $40,712 6 $1,124,167 170 $73,665 0 $0 APPLICATIONS APPROVED, NOT ACCEPTED 5 $109,000 111 $85,171 197 $93,619 22 $27,909 0 $0 18 $72,000 2 $19,000 APPLICATIONS DENIED 19 $107,421 219 $88,854 756 $102,087 101 $33,683 0 $0 45 $77,000 5 $39,000 APPLICATIONS WITHDRAWN 11 $114,909 74 $84,189 452 $101,168 14 $50,714 0 $0 36 $74,722 1 $90,000 FILES CLOSED FOR INCOMPLETENESS 7 $106,286 33 $95,515 144 $102,528 2 $54,500 1 $2,900,000 8 $81,875 1 $60,000
Aggregated Statistics For Year 2003(Based on 5 full tracts) A) FHA, FSA/RHS & VA B) Conventional C) Refinancings D) Home Improvement Loans E) Loans on Dwellings For 5+ Families F) Non-occupant Loans on Number Average Value Number Average Value Number Average Value Number Average Value Number Average Value Number Average Value
LOANS ORIGINATED 105 $98,476 349 $86,358 1,265 $85,119 41 $16,707 4 $1,222,250 152 $64,842 APPLICATIONS APPROVED, NOT ACCEPTED 4 $93,750 80 $75,550 222 $89,324 10 $65,800 1 $4,500,000 38 $71,474 APPLICATIONS DENIED 17 $101,118 144 $84,076 770 $94,348 78 $22,679 0 $0 40 $58,575 APPLICATIONS WITHDRAWN 8 $93,125 73 $91,370 487 $95,772 9 $20,889 0 $0 20 $68,750 FILES CLOSED FOR INCOMPLETENESS 8 $77,875 20 $79,400 103 $96,942 2 $36,500 0 $0 6 $55,833
Aggregated Statistics For Year 2002(Based on 5 full tracts) A) FHA, FSA/RHS & VA B) Conventional C) Refinancings D) Home Improvement Loans E) Loans on Dwellings For 5+ Families F) Non-occupant Loans on Number Average Value Number Average Value Number Average Value Number Average Value Number Average Value Number Average Value
LOANS ORIGINATED 153 $96,954 274 $77,318 852 $85,217 49 $25,286 3 $280,333 125 $63,152 APPLICATIONS APPROVED, NOT ACCEPTED 4 $110,000 29 $74,034 172 $83,762 13 $19,077 0 $0 12 $54,167 APPLICATIONS DENIED 11 $100,727 93 $79,226 508 $88,671 60 $11,067 0 $0 24 $58,833 APPLICATIONS WITHDRAWN 9 $95,333 53 $86,321 414 $92,674 14 $16,000 0 $0 10 $60,500 FILES CLOSED FOR INCOMPLETENESS 1 $125,000 29 $82,621 136 $86,471 1 $30,000 0 $0 9 $68,778
Aggregated Statistics For Year 2001(Based on 5 full tracts) A) FHA, FSA/RHS & VA B) Conventional C) Refinancings D) Home Improvement Loans E) Loans on Dwellings For 5+ Families F) Non-occupant Loans on Number Average Value Number Average Value Number Average Value Number Average Value Number Average Value Number Average Value
LOANS ORIGINATED 175 $92,354 242 $74,479 715 $77,782 60 $39,883 5 $2,584,000 113 $62,292 APPLICATIONS APPROVED, NOT ACCEPTED 6 $74,000 37 $67,568 125 $81,168 21 $18,429 0 $0 9 $80,111 APPLICATIONS DENIED 21 $91,333 93 $90,366 599 $73,781 120 $14,475 1 $2,000 31 $66,581 APPLICATIONS WITHDRAWN 12 $80,000 34 $80,941 394 $81,586 35 $26,886 0 $0 11 $58,182 FILES CLOSED FOR INCOMPLETENESS 2 $85,000 16 $65,812 94 $84,947 0 $0 0 $0 4 $43,750
Aggregated Statistics For Year 2000(Based on 5 full tracts) A) FHA, FSA/RHS & VA B) Conventional C) Refinancings D) Home Improvement Loans E) Loans on Dwellings For 5+ Families F) Non-occupant Loans on Number Average Value Number Average Value Number Average Value Number Average Value Number Average Value Number Average Value
LOANS ORIGINATED 188 $79,973 269 $65,870 312 $66,176 83 $12,506 4 $766,750 74 $48,108 APPLICATIONS APPROVED, NOT ACCEPTED 5 $59,800 57 $63,754 85 $75,200 52 $22,750 0 $0 10 $48,200 APPLICATIONS DENIED 10 $80,000 148 $69,764 332 $65,512 103 $16,204 1 $75,000 27 $67,889 APPLICATIONS WITHDRAWN 8 $98,250 41 $59,122 163 $60,663 13 $28,538 1 $249,000 9 $64,333 FILES CLOSED FOR INCOMPLETENESS 4 $97,250 18 $59,500 62 $82,871 5 $29,400 0 $0 4 $72,250
Aggregated Statistics For Year 1999(Based on 5 full tracts) A) FHA, FSA/RHS & VA B) Conventional C) Refinancings D) Home Improvement Loans E) Loans on Dwellings For 5+ Families F) Non-occupant Loans on Number Average Value Number Average Value Number Average Value Number Average Value Number Average Value Number Average Value
LOANS ORIGINATED 210 $78,342 237 $69,899 430 $63,316 94 $12,443 6 $692,475 77 $50,445 APPLICATIONS APPROVED, NOT ACCEPTED 3 $80,260 37 $66,786 105 $61,395 42 $12,818 1 $9,920 9 $48,258 APPLICATIONS DENIED 14 $82,774 99 $65,399 281 $62,644 126 $14,399 0 $0 18 $34,652 APPLICATIONS WITHDRAWN 23 $74,295 46 $60,047 161 $66,236 16 $24,859 0 $0 9 $59,517 FILES CLOSED FOR INCOMPLETENESS 9 $73,127 18 $65,544 49 $69,065 1 $98,160 0 $0 3 $42,693
Detailed HMDA statistics for the following Tracts:
0133.01
, 0133.02 , 0133.03 , 0134.01 , 0134.06
Private Mortgage Insurance Companies Aggregated Statistics For Year 2009(Based on 5 full tracts) A) Conventional B) Refinancings C) Non-occupant Loans on Number Average Value Number Average Value Number Average Value
LOANS ORIGINATED 21 $77,571 9 $121,333 0 $0 APPLICATIONS APPROVED, NOT ACCEPTED 2 $134,000 2 $177,500 2 $134,000 APPLICATIONS DENIED 2 $140,500 1 $126,000 1 $231,000 APPLICATIONS WITHDRAWN 0 $0 0 $0 0 $0 FILES CLOSED FOR INCOMPLETENESS 3 $94,000 0 $0 0 $0
Aggregated Statistics For Year 2008(Based on 5 full tracts) A) Conventional B) Refinancings C) Non-occupant Loans on Number Average Value Number Average Value Number Average Value
LOANS ORIGINATED 66 $95,742 31 $111,968 19 $74,421 APPLICATIONS APPROVED, NOT ACCEPTED 20 $108,050 23 $121,304 12 $88,417 APPLICATIONS DENIED 8 $112,250 2 $93,000 6 $113,333 APPLICATIONS WITHDRAWN 4 $85,750 1 $153,000 2 $75,500 FILES CLOSED FOR INCOMPLETENESS 3 $83,000 1 $146,000 2 $114,500
Aggregated Statistics For Year 2007(Based on 5 full tracts) A) Conventional B) Refinancings C) Non-occupant Loans on Number Average Value Number Average Value Number Average Value
LOANS ORIGINATED 147 $103,483 64 $109,812 29 $71,862 APPLICATIONS APPROVED, NOT ACCEPTED 17 $100,353 13 $111,077 3 $88,667 APPLICATIONS DENIED 4 $116,500 2 $123,500 2 $72,000 APPLICATIONS WITHDRAWN 10 $88,700 13 $83,000 11 $63,182 FILES CLOSED FOR INCOMPLETENESS 0 $0 0 $0 0 $0
Aggregated Statistics For Year 2006(Based on 5 full tracts) A) Conventional B) Refinancings C) Non-occupant Loans on Number Average Value Number Average Value Number Average Value
LOANS ORIGINATED 85 $99,706 44 $116,341 18 $71,389 APPLICATIONS APPROVED, NOT ACCEPTED 5 $97,200 9 $109,556 0 $0 APPLICATIONS DENIED 2 $61,000 3 $93,667 2 $47,000 APPLICATIONS WITHDRAWN 1 $78,000 3 $120,667 0 $0 FILES CLOSED FOR INCOMPLETENESS 0 $0 0 $0 0 $0
Aggregated Statistics For Year 2005(Based on 5 full tracts) A) Conventional B) Refinancings C) Non-occupant Loans on D) Loans On Manufactured Number Average Value Number Average Value Number Average Value Number Average Value
LOANS ORIGINATED 77 $102,974 63 $104,444 21 $74,619 1 $61,000 APPLICATIONS APPROVED, NOT ACCEPTED 24 $98,208 17 $115,176 12 $88,250 0 $0 APPLICATIONS DENIED 3 $78,333 4 $103,000 3 $77,000 0 $0 APPLICATIONS WITHDRAWN 8 $118,625 3 $84,333 0 $0 0 $0 FILES CLOSED FOR INCOMPLETENESS 1 $121,000 2 $133,000 1 $135,000 0 $0
Aggregated Statistics For Year 2004(Based on 5 full tracts) A) Conventional B) Refinancings C) Non-occupant Loans on Number Average Value Number Average Value Number Average Value
LOANS ORIGINATED 109 $88,394 80 $104,738 35 $75,086 APPLICATIONS APPROVED, NOT ACCEPTED 12 $137,667 31 $103,516 2 $108,000 APPLICATIONS DENIED 2 $81,000 1 $99,000 1 $81,000 APPLICATIONS WITHDRAWN 4 $96,250 6 $96,000 3 $96,333 FILES CLOSED FOR INCOMPLETENESS 1 $76,000 3 $66,000 4 $68,500
Aggregated Statistics For Year 2003(Based on 5 full tracts) A) Conventional B) Refinancings C) Non-occupant Loans on Number Average Value Number Average Value Number Average Value
LOANS ORIGINATED 142 $91,831 144 $100,833 33 $66,939 APPLICATIONS APPROVED, NOT ACCEPTED 21 $79,905 48 $95,875 9 $51,222 APPLICATIONS DENIED 3 $146,000 1 $131,000 1 $131,000 APPLICATIONS WITHDRAWN 3 $90,667 8 $104,875 0 $0 FILES CLOSED FOR INCOMPLETENESS 0 $0 4 $53,750 3 $50,667
Aggregated Statistics For Year 2002(Based on 5 full tracts) A) Conventional B) Refinancings C) Non-occupant Loans on Number Average Value Number Average Value Number Average Value
LOANS ORIGINATED 97 $81,784 136 $98,640 28 $56,750 APPLICATIONS APPROVED, NOT ACCEPTED 15 $100,667 26 $96,192 11 $51,000 APPLICATIONS DENIED 1 $116,000 2 $83,500 1 $116,000 APPLICATIONS WITHDRAWN 8 $86,750 5 $86,000 3 $72,000 FILES CLOSED FOR INCOMPLETENESS 0 $0 3 $120,000 0 $0
Aggregated Statistics For Year 2001(Based on 5 full tracts) A) Conventional B) Refinancings C) Non-occupant Loans on Number Average Value Number Average Value Number Average Value
LOANS ORIGINATED 99 $80,384 83 $87,880 29 $58,034 APPLICATIONS APPROVED, NOT ACCEPTED 17 $78,706 14 $91,643 4 $67,500 APPLICATIONS DENIED 3 $45,667 5 $94,000 5 $53,200 APPLICATIONS WITHDRAWN 1 $161,000 4 $86,250 0 $0 FILES CLOSED FOR INCOMPLETENESS 0 $0 0 $0 0 $0
Aggregated Statistics For Year 2000(Based on 5 full tracts) A) Conventional B) Refinancings C) Non-occupant Loans on Number Average Value Number Average Value Number Average Value
LOANS ORIGINATED 98 $72,806 16 $81,062 15 $47,400 APPLICATIONS APPROVED, NOT ACCEPTED 8 $72,375 8 $82,125 0 $0 APPLICATIONS DENIED 4 $81,250 4 $73,500 0 $0 APPLICATIONS WITHDRAWN 4 $60,750 0 $0 0 $0 FILES CLOSED FOR INCOMPLETENESS 1 $110,000 0 $0 0 $0
Aggregated Statistics For Year 1999(Based on 5 full tracts) A) Conventional B) Refinancings C) Non-occupant Loans on Number Average Value Number Average Value Number Average Value
LOANS ORIGINATED 76 $75,105 37 $68,458 17 $47,468 APPLICATIONS APPROVED, NOT ACCEPTED 4 $49,735 7 $69,837 1 $24,790 APPLICATIONS DENIED 2 $84,235 2 $73,145 1 $33,690 APPLICATIONS WITHDRAWN 4 $62,725 1 $151,620 2 $53,540 FILES CLOSED FOR INCOMPLETENESS 1 $35,680 1 $55,840 0 $0
Detailed PMIC statistics for the following Tracts:
0133.01
, 0133.02 , 0133.03 , 0134.01 , 0134.06
Most common first names in Grandview, MO among deceased individuals Name Count Lived (average)
Mary 112 77.3 years John 95 70.9 years William 92 71.2 years Robert 80 71.0 years James 77 70.1 years Charles 62 69.8 years George 51 76.0 years Dorothy 46 74.5 years Donald 41 64.5 years Margaret 37 78.8 years
Most common last names in Grandview, MO among deceased individuals Last name Count Lived (average)
Smith 49 73.7 years Johnson 39 71.9 years Miller 34 74.7 years Williams 32 74.6 years Jones 28 72.7 years Anderson 27 73.1 years Davis 24 72.0 years Brown 21 74.3 years Walker 18 77.1 years Taylor 17 73.4 years
Grandview compared to Missouri state average:
Unemployed percentage significantly below state average. Black race population percentage significantly above state average. Hispanic race population percentage significantly above state average. Foreign-born population percentage above state average. Length of stay since moving in above state average.
#30 on the list of "Top 101 cities with the smallest racial income disparities between White and Black householders (with at least 2,000 householders)"
#4 on the list of "Top 101 counties with the highest Sulfur Oxides Annual air pollution readings in 2012 (µg/m3 )"
#20 on the list of "Top 101 counties with the highest Particulate Matter (PM10 ) Annual air pollution readings in 2012 (µg/m3 )"
#25 on the list of "Top 101 counties with the most Black Protestant adherents"
#26 on the list of "Top 101 counties with the most Black Protestant congregations"
#37 on the list of "Top 101 counties with the lowest surface withdrawal of fresh water for public supply (pop. 50,000+)"
Top Patent Applicants
Alexander Savenok (6)
Philip T. Ward (4)
Xander Orozco (3)
Louis Orozco (3)
Jessica Del Rosario San Nicolas (2)
Larry Jesse San Nicolas (1)
Edward Neal Koop (1)
Z. Lavern Bland (1)
Jason Cristoffer Welch (1)
Gary N. Cai (1)
Total of 27 patent applications in 2008-2024.

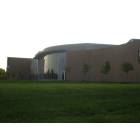

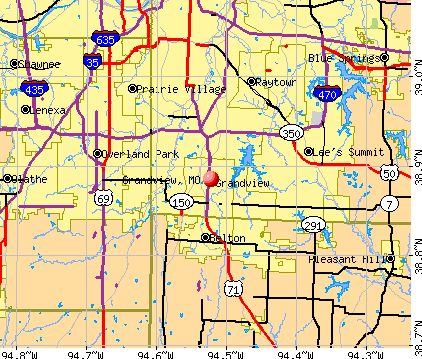


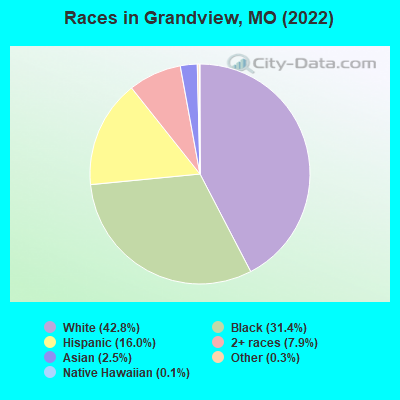
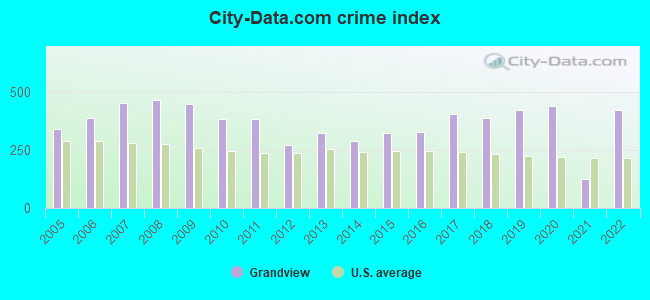
 Recent articles from our blog. Our writers, many of them Ph.D. graduates or candidates, create easy-to-read articles on a wide variety of topics.

 (8.4 miles
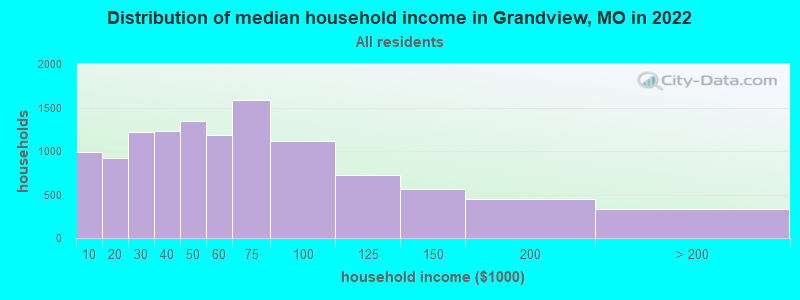
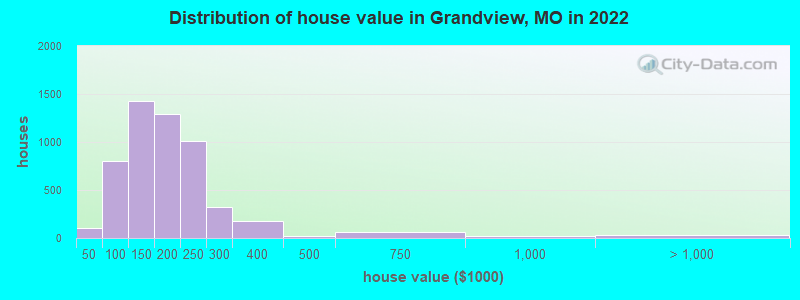

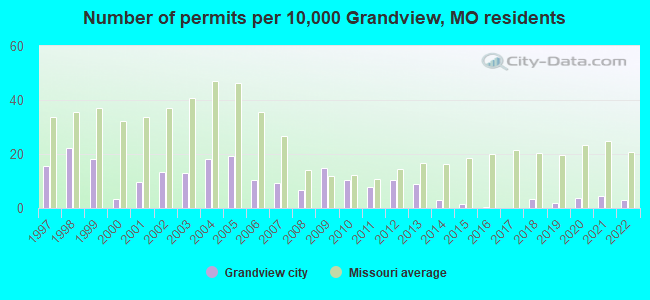
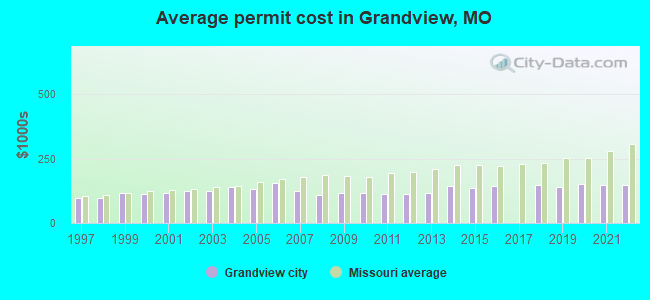
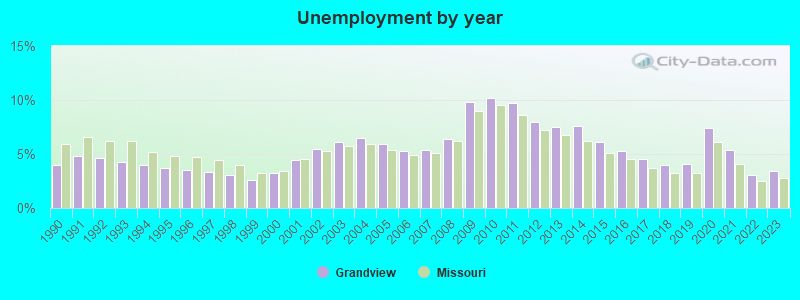
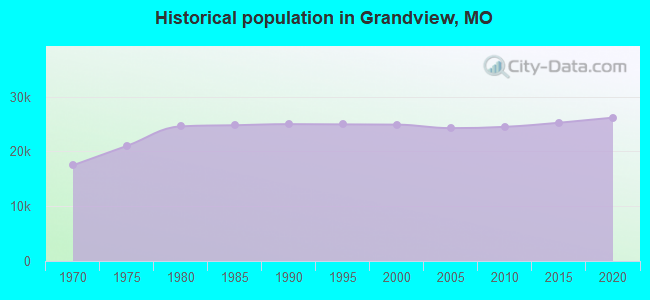
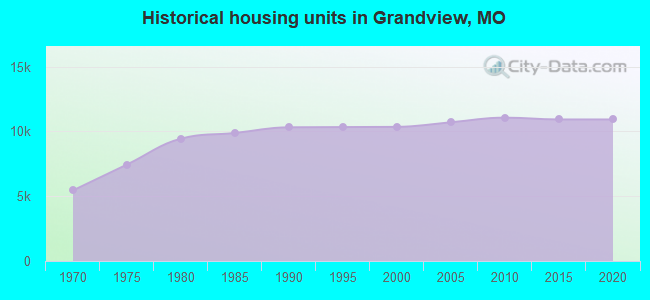
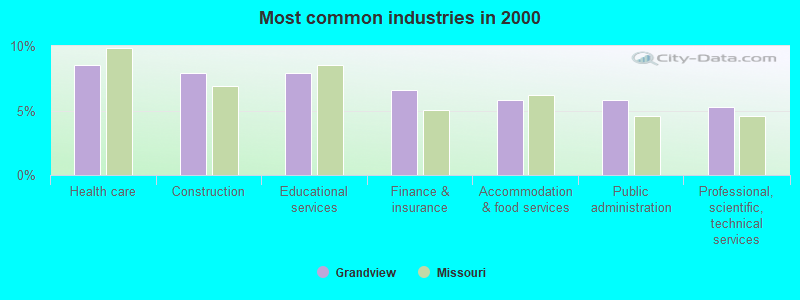
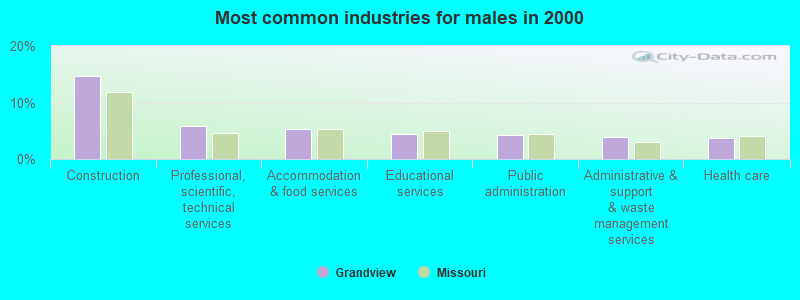
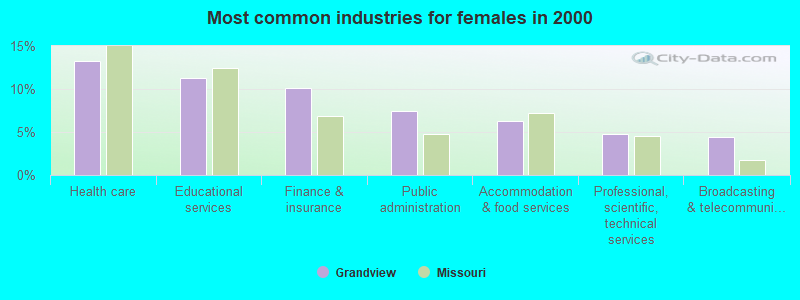
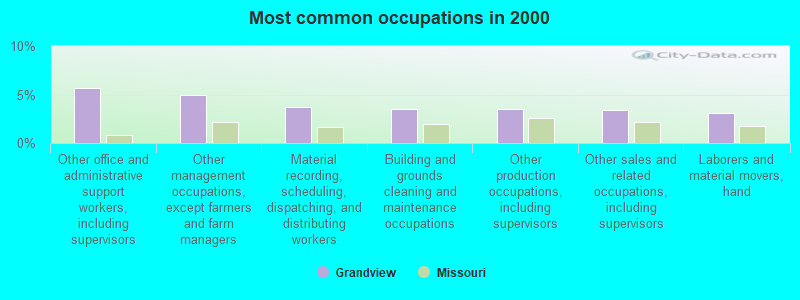
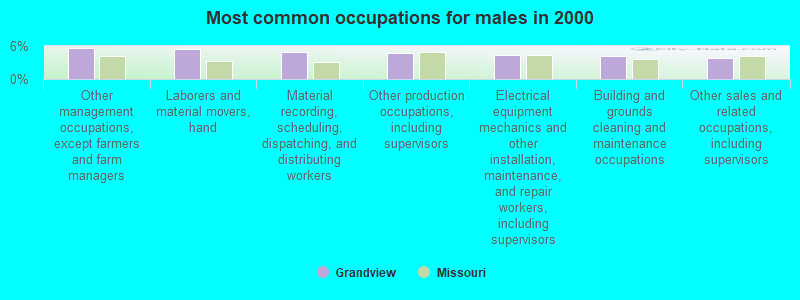
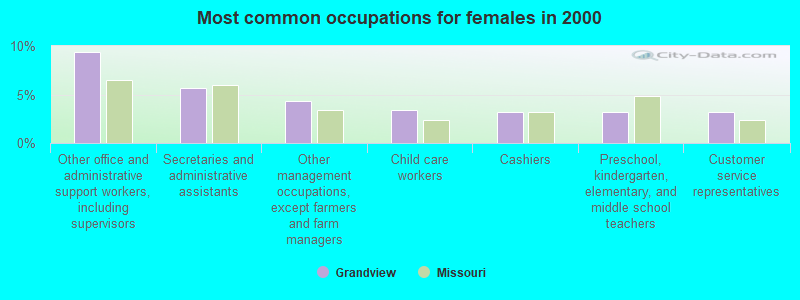


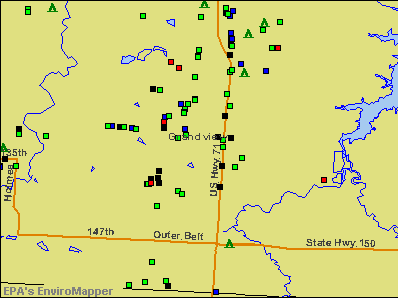

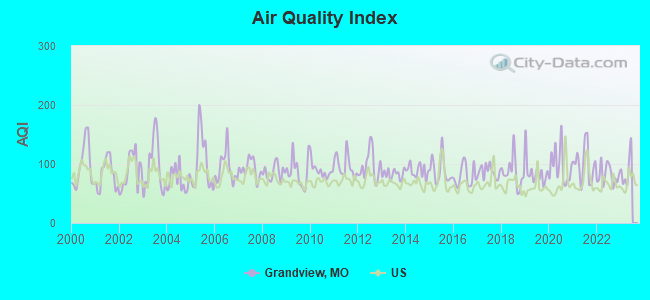
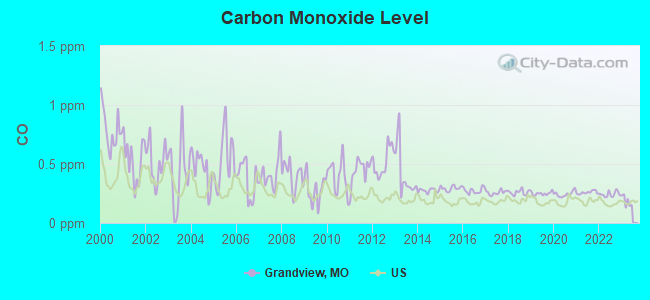
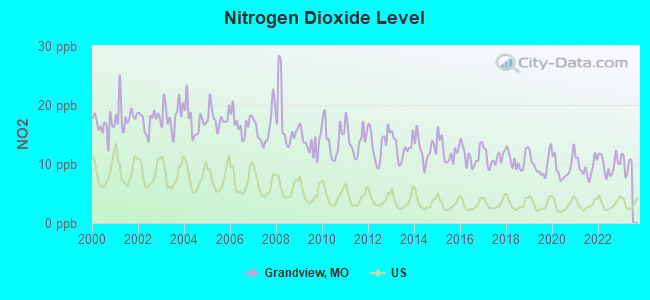
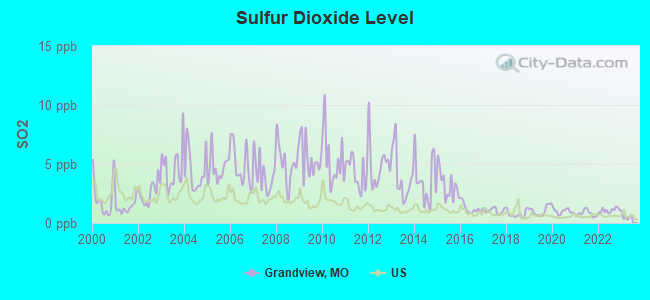
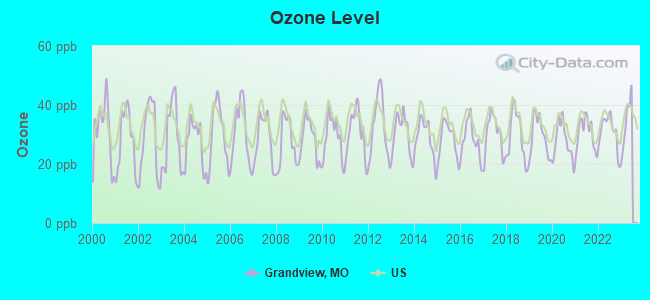
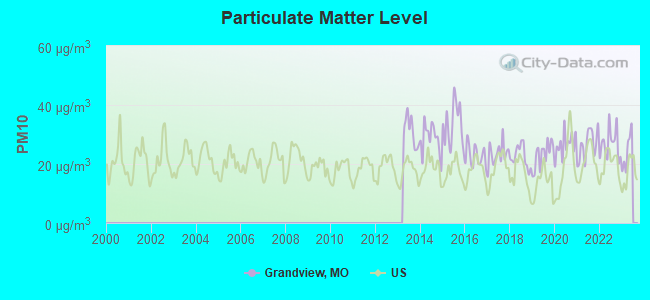
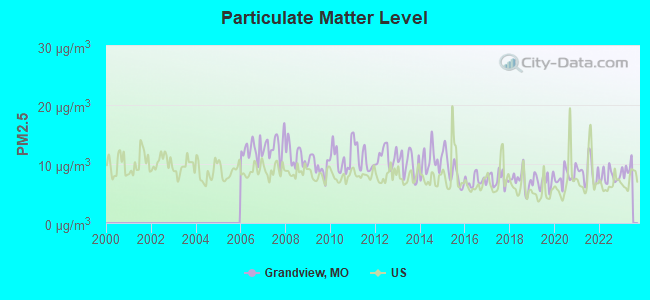

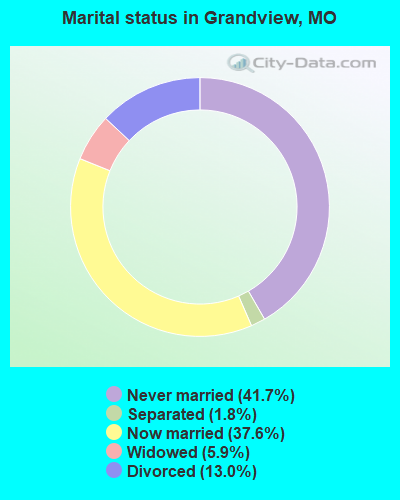
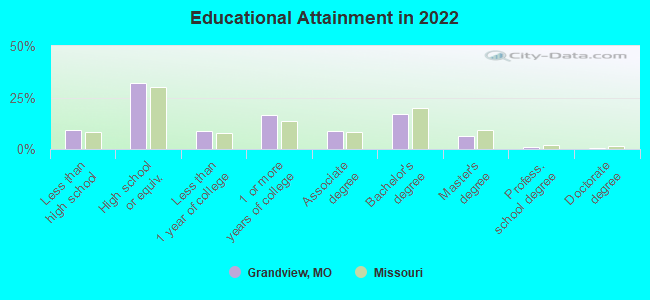
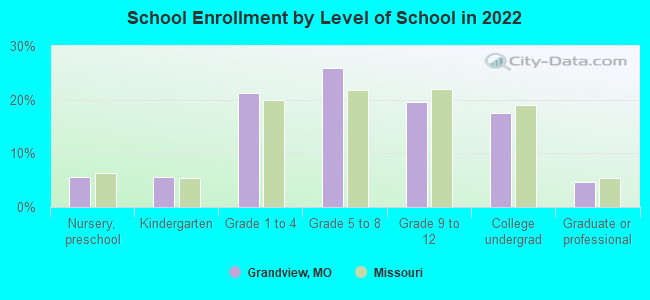
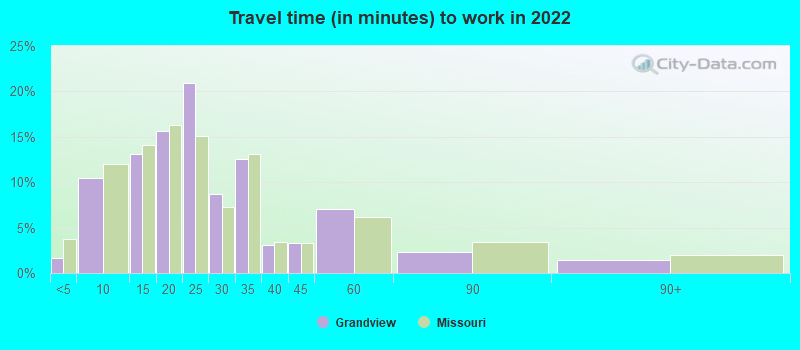
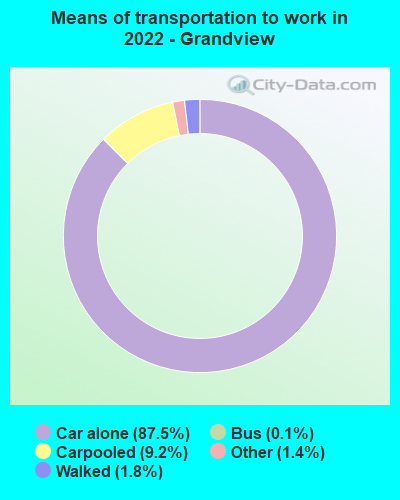
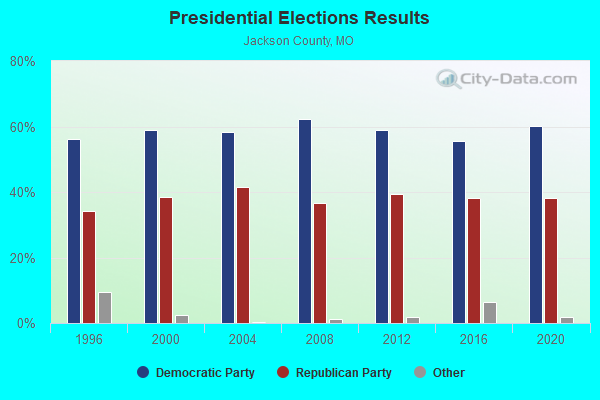
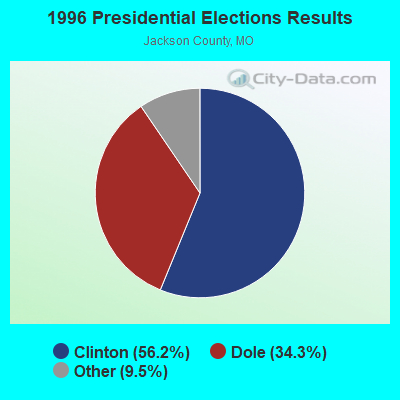
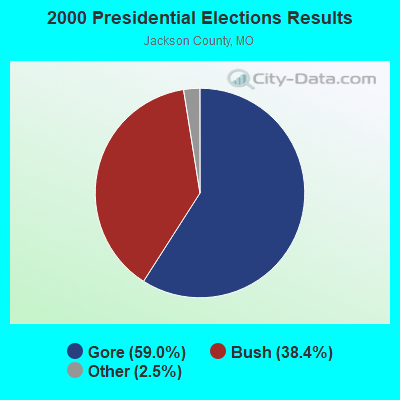
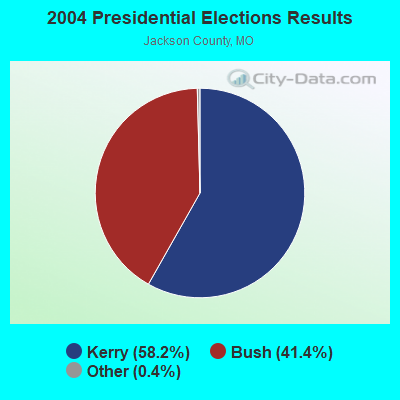
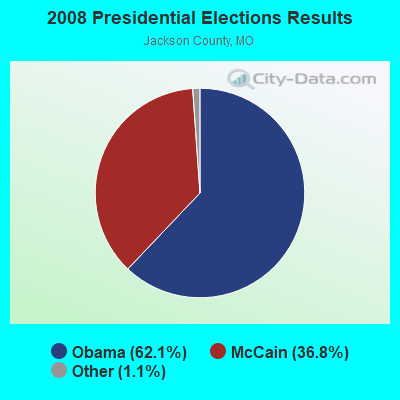
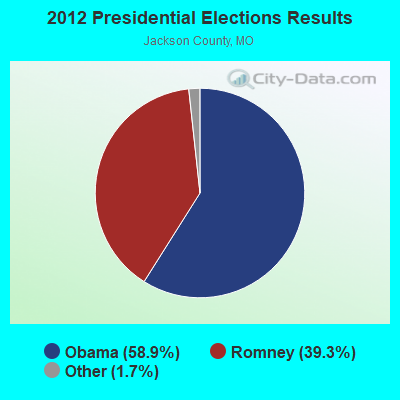
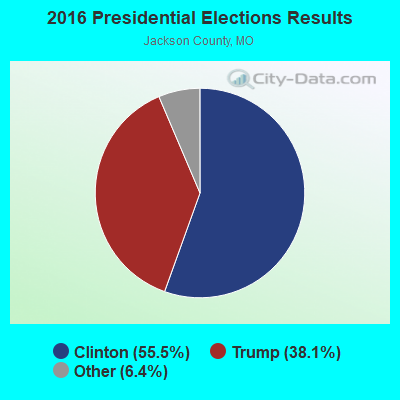
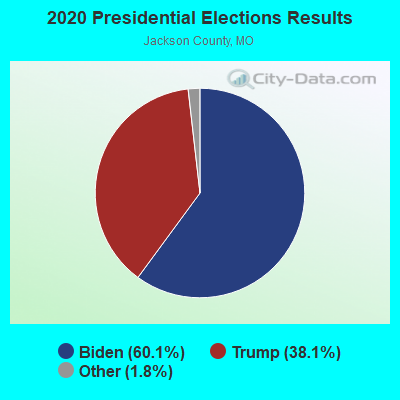
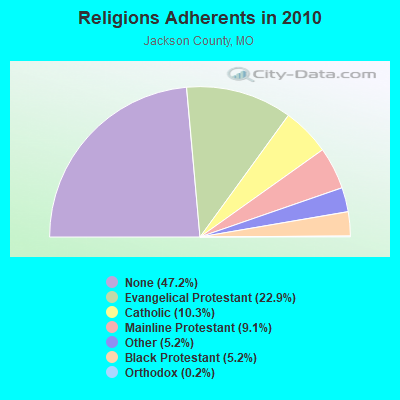
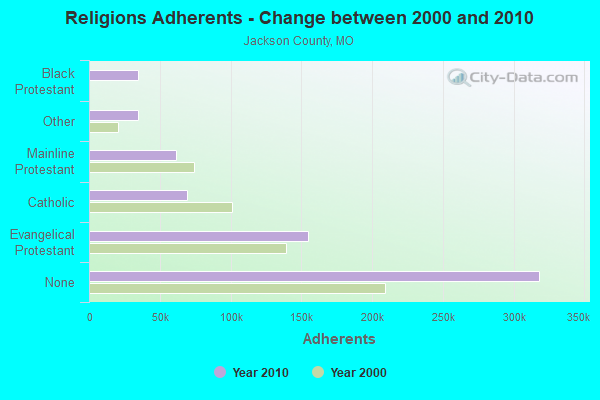
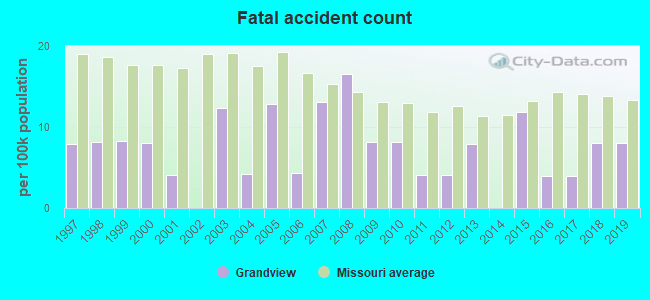
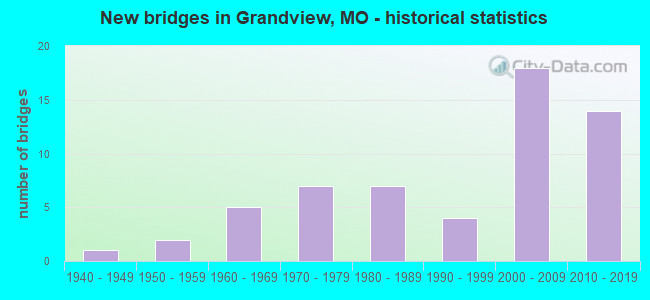
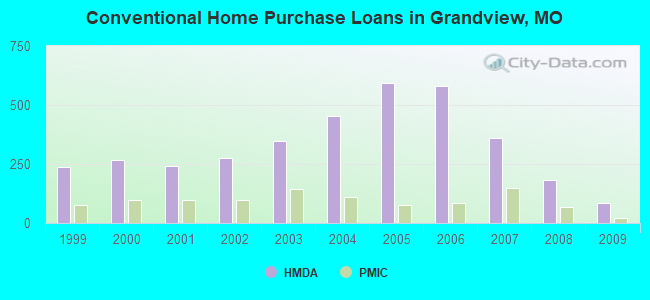
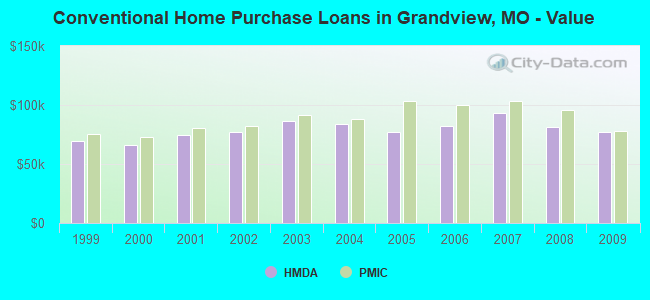
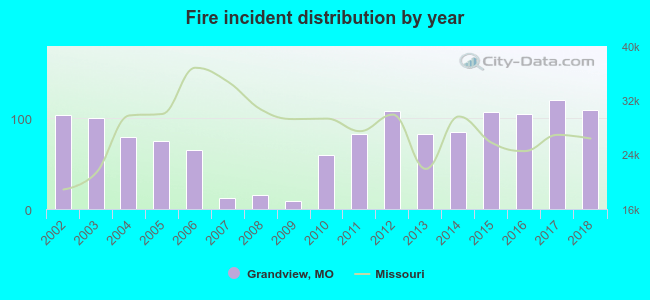 According to the data from the years 2002 - 2018 the average number of fire incidents per year is 78. The highest number of fires - 120 took place in 2017, and the least - 9 in 2009. The data has a growing trend.
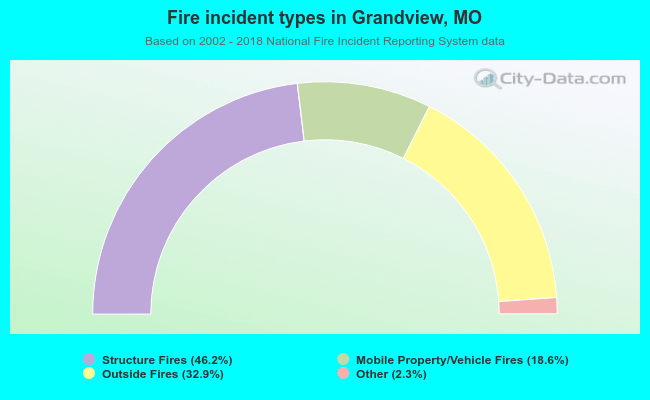 When looking into fire subcategories, the most incidents belonged to: Structure Fires (46.2%), and Outside Fires (32.9%).