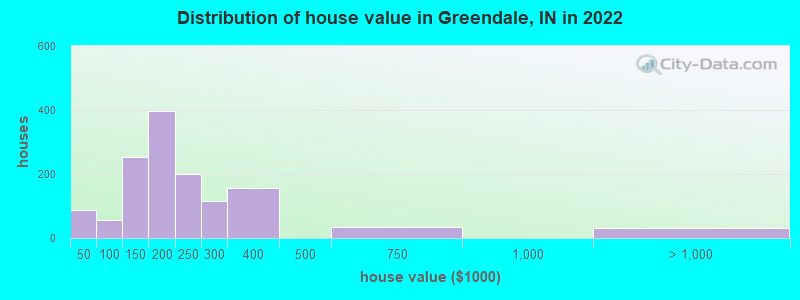
Estimated median house or condo value in 2022: $191,649 (it was $109,600 in 2000)
Greendale:
$191,649
IN:
$208,700
Mean prices in 2022:all housing units: $262,517; detached houses: $270,003; townhouses or other attached units: $195,639; in 2-unit structures: $149,155; in 3-to-4-unit structures: $168,044; in 5-or-more-unit structures: $94,439; mobile homes: $114,377
Median gross rent in 2022: $589.
March 2022 cost of living index in Greendale: 86.1 (less than average, U.S. average is 100)
According to our research of Indiana and other state lists, there were 3 registered sex offenders living in Greendale, Indiana as of June 16, 2024. The ratio of all residents to sex offenders in Greendale is 1,501 to 1. The ratio of registered sex offenders to all residents in this city is much lower than the state average.
Crime rates in Greendale by year
Type
2009
2010
2011
2012
2013
2017
2018
Murders (per 100,000)
0 (0.0)
0 (0.0)
0 (0.0)
0 (0.0)
0 (0.0)
0 (0.0)
0 (0.0)
Rapes (per 100,000)
1 (22.9)
1 (22.1)
0 (0.0)
0 (0.0)
0 (0.0)
0 (0.0)
0 (0.0)
Robberies (per 100,000)
1 (22.9)
2 (44.2)
2 (44.0)
0 (0.0)
1 (22.3)
0 (0.0)
0 (0.0)
Assaults (per 100,000)
3 (68.6)
5 (110.6)
4 (88.0)
7 (154.2)
2 (44.6)
0 (0.0)
2 (45.4)
Burglaries (per 100,000)
14 (320.2)
13 (287.6)
15 (330.2)
13 (286.4)
0 (0.0)
3 (68.5)
0 (0.0)
Thefts (per 100,000)
12 (274.5)
20 (442.5)
110 (2,421)
97 (2,137)
14 (312.1)
26 (593.3)
2 (45.4)
Auto thefts (per 100,000)
0 (0.0)
0 (0.0)
1 (22.0)
2 (44.1)
0 (0.0)
3 (68.5)
0 (0.0)
Arson (per 100,000)
0 (0.0)
0 (0.0)
0 (0.0)
0 (0.0)
0 (0.0)
0 (0.0)
0 (0.0)
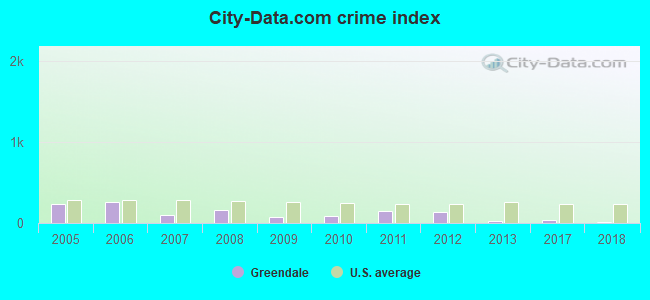
City-Data.com crime index
72.3
90.9
152.5
139.9
28.1
34.0
10.9
The City-Data.com crime index weighs serious crimes and violent crimes more heavily. Higher means more crime, U.S. average is 246.1. It adjusts for the number of visitors and daily workers commuting into cities.
Latest news from Greendale, IN collected exclusively by city-data.com from local newspapers, TV, and radio stations
Ancestries: American (40.0%), German (26.1%), Scotch-Irish (7.6%), European (7.1%), Irish (4.9%), English (4.6%).
Current Local Time: EST time zone
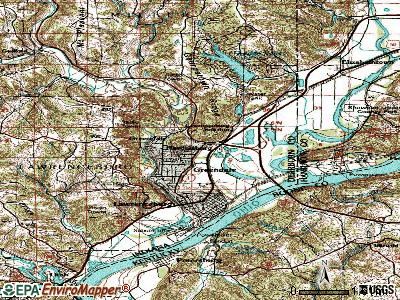
Land area: 6.05 square miles.
Population density: 757 people per square mile (low).
18 residents are foreign born
This city:
0.5%
Indiana:
5.6%
Median real estate property taxes paid for housing units with mortgages in 2022: $1,804 (0.8%) Median real estate property taxes paid for housing units with no mortgage in 2022: $1,299 (0.8%)
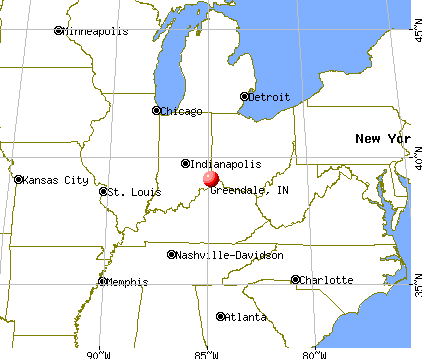
Nearest city with pop. 50,000+: Cincinnati, OH (18.9 miles , pop. 331,285).
Nearest city with pop. 1,000,000+: Chicago, IL (239.7 miles , pop. 2,896,016).
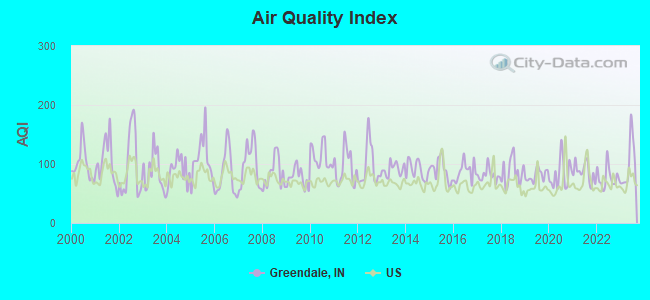
Air Quality Index (AQI) level in 2023 was 100. This is worse than average.
City:
100
U.S.:
73
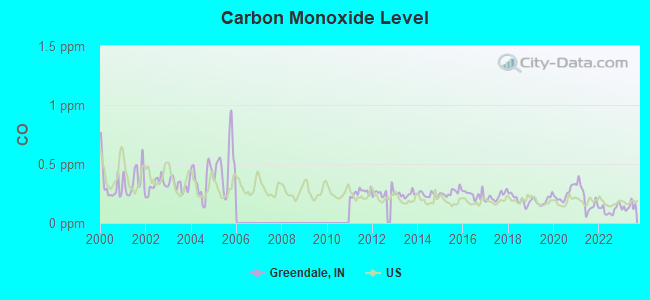
Carbon Monoxide (CO) [ppm] level in 2023 was 0.138. This is significantly better than average.Closest monitor was 10.9 miles away from the city center.
City:
0.138
U.S.:
0.251
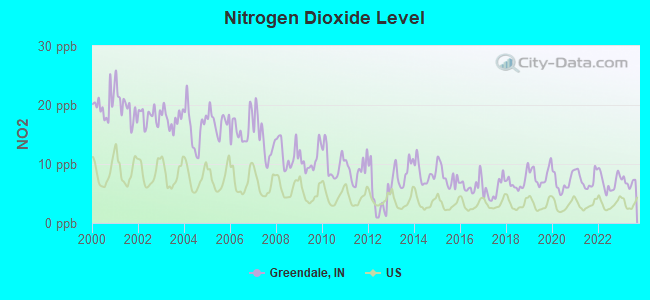
Nitrogen Dioxide (NO2) [ppb] level in 2023 was 6.94. This is worse than average.Closest monitor was 1.9 miles away from the city center.
City:
6.94
U.S.:
5.11
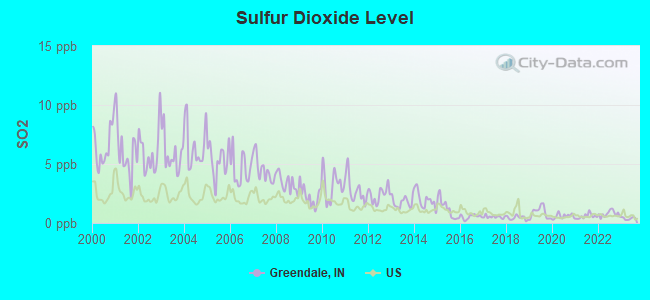
Sulfur Dioxide (SO2) [ppb] level in 2023 was 0.390. This is significantly better than average.Closest monitor was 1.0 miles away from the city center.
City:
0.390
U.S.:
1.515
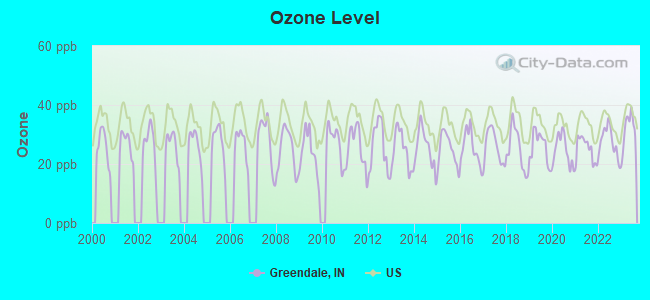
Ozone [ppb] level in 2023 was 31.8. This is about average.Closest monitor was 1.9 miles away from the city center.
City:
31.8
U.S.:
33.3
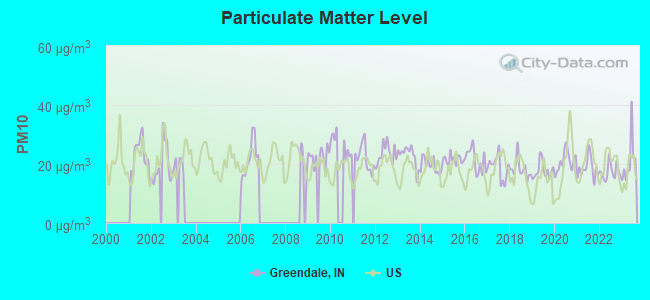
Particulate Matter (PM10) [µg/m3] level in 2023 was 21.0. This is about average.Closest monitor was 1.7 miles away from the city center.
City:
21.0
U.S.:
19.2
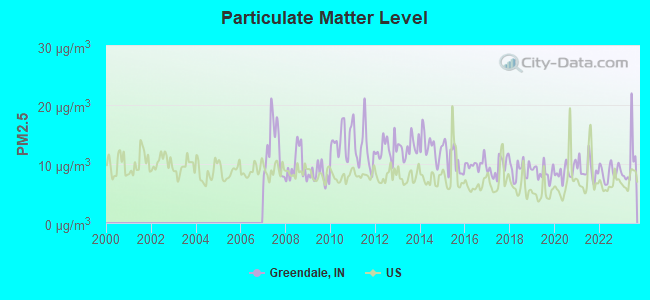
Particulate Matter (PM2.5) [µg/m3] level in 2023 was 10.3. This is worse than average.Closest monitor was 10.9 miles away from the city center.
City:
10.3
U.S.:
8.1
Tornado activity:
Greendale-area historical tornado activity is near Indiana state average. It is 83% greater than the overall U.S. average.
On 4/3/1974, a category F5 (max. wind speeds 261-318 mph) tornado 10.6 miles away from the Greendale city center killed 3 peopleand injured 210 people.
On 4/3/1974, a category F4 (max. wind speeds 207-260 mph) tornado 5.5 miles away from the city center injured 104 peopleand causedbetween $5,000,000 and $50,000,000 in damages.
Earthquake activity:
Greendale-area historical earthquake activity is significantly above Indiana state average. It is 59% greater than the overall U.S. average.
On 7/27/1980 at 18:52:21, a magnitude 5.2 (5.1 MB, 4.7 MS, 5.0 UK, 5.2 UK, Class: Moderate, Intensity: VI - VII) earthquake occurred 80.2 miles away from the city center On 4/18/2008 at 09:36:59, a magnitude 5.4 (5.1 MB, 4.8 MS, 5.4 MW, 5.2 MW) earthquake occurred 169.9 miles away from the city center On 4/18/2008 at 09:36:59, a magnitude 5.2 (5.2 MW, Depth: 8.9 mi) earthquake occurred 169.9 miles away from Greendale center On 6/10/1987 at 23:48:54, a magnitude 5.1 (4.9 MB, 4.4 MS, 4.6 MS, 5.1 LG) earthquake occurred 164.3 miles away from Greendale center On 9/7/1988 at 02:28:09, a magnitude 4.6 (4.5 MB, 4.6 LG, Class: Light, Intensity: IV - V) earthquake occurred 85.8 miles away from the city center On 6/18/2002 at 17:37:15, a magnitude 5.0 (4.3 MB, 4.6 MW, 5.0 LG) earthquake occurred 176.6 miles away from the city center Magnitude types: regional Lg-wave magnitude (LG), body-wave magnitude (MB), surface-wave magnitude (MS), moment magnitude (MW)
Natural disasters:
The number of natural disasters in Dearborn County (18) is near the US average (15). Major Disasters (Presidential) Declared: 14 Emergencies Declared: 2
Causes of natural disasters: Floods: 13, Storms: 10, Tornadoes: 6, Blizzard: 1, Hurricane: 1, Snow: 1, Wind: 1, Winter Storm: 1, Other: 1 (Note: some incidents may be assigned to more than one category).
Hospitals and medical centers near Greendale:
INTERIM HEALTHCARE OF SE INDIANA INC (Home Health Center, about 1 miles away; LAWRENCEBURG, IN)
DAVITA - LAWRENCEBURG DIALYSIS,LLC (Dialysis Facility, about 2 miles away; LAWRENCEBURG, IN)
SHADY NOOK CARE CENTER (Nursing Home, about 2 miles away; LAWRENCEBURG, IN)
WOODLAND HILLS CARE CENTER (Nursing Home, about 2 miles away; LAWRENCEBURG, IN)
DEARBORN COUNTY HOSPITAL HOME HEALTH AND HOSPICE (Home Health Center, about 2 miles away; LAWRENCEBURG, IN)
COMMUNITY MENTAL HEALTH CENTER INC (Hospital, about 2 miles away; LAWRENCEBURG, IN)
VOCA CORPORATION OF INDIANA (Hospital, about 2 miles away; LAWRENCEBURG, IN)
Dearborn County has a predicted average indoor radon screening level between 2 and 4 pCi/L (pico curies per liter) - Moderate Potential
Drinking water stations with addresses in Greendale and their reported violations in the past:
CITY OF GREENDALE UTILITIES (Population served: 5,100, Groundwater):
Past monitoring violations:
Monitoring and Reporting (DBP) - Between JAN-2005 and DEC-2005, Contaminant: Total Haloacetic Acids (HAA5). Follow-up actions: St Public Notif requested (DEC-02-2005), St Violation/Reminder Notice (DEC-02-2005), St Compliance achieved (DEC-13-2005), St Public Notif received (DEC-13-2005)
Monitoring and Reporting (DBP) - Between JAN-2005 and DEC-2005, Contaminant: TTHM. Follow-up actions: St Public Notif requested (DEC-02-2005), St Violation/Reminder Notice (DEC-02-2005), St Compliance achieved (DEC-13-2005), St Public Notif received (DEC-13-2005)
Average household size:
This city:
2.5 people
Indiana:
2.5 people
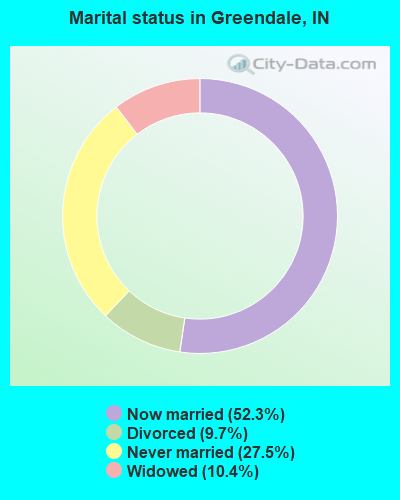
Percentage of family households:
This city:
68.6%
Whole state:
66.9%
Percentage of households with unmarried partners:
This city:
7.1%
Whole state:
6.9%
Likely homosexual households (counted as self-reported same-sex unmarried-partner households)
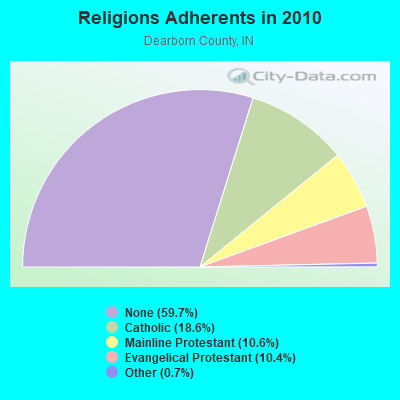
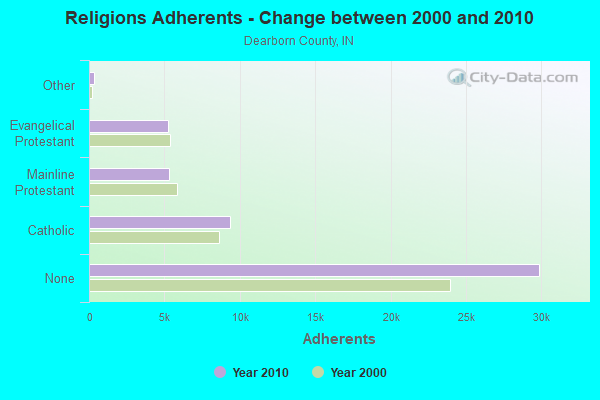
Religion statistics for Greendale, IN (based on Dearborn County data)
Religion
Adherents
Congregations
Catholic
9,317
7
Mainline Protestant
5,305
33
Evangelical Protestant
5,222
28
Other
336
3
None
29,867
-
Source: Clifford Grammich, Kirk Hadaway, Richard Houseal, Dale E.Jones, Alexei Krindatch, Richie Stanley and Richard H.Taylor. 2012. 2010 U.S.Religion Census: Religious Congregations & Membership Study. Association of Statisticians of American Religious Bodies. Jones, Dale E., et al. 2002. Congregations and Membership in the United States 2000. Nashville, TN: Glenmary Research Center. Graphs represent county-level data
1725 Greendale Plaza Drive (Lat: 39.125972 Lon: -84.843583), Type: Mast, Structure height: 9.1 m, Overall height: 12.8 m, Call Sign: WSBW813, Assigned Frequencies: 72.1000 MHz, Grant Date: 03/18/2024, Expiration Date: 03/18/2034, Certifier: Pat Wilgenbusch, Registrant: Primex Wireless, Inc., 965 S Wells St., Lake Geneva, WI 53147, Phone: (855) 557-0337, Email:
FCC Registered Amateur Radio Licenses:
4
Call Sign: K1SSB, Previous Call Sign: KA8TEQ, Licensee ID: L00194303, Grant Date: 03/17/2020, Expiration Date: 06/13/2030, Certifier: David B Moore, Registrant: David B Moore, 359 Beckett Landing, Greendale, IN 47025
Call Sign: KB9YVK, Licensee ID: L00322737, Grant Date: 11/22/2010, Expiration Date: 02/07/2021, Cancellation Date: 02/08/2023, Certifier: Elwood R Benning, Registrant: Elwood R Benning, 223 Locust St, Greendale, IN 47025
Call Sign: K7WLW, Previous Call Sign: K8PRR, Licensee ID: L00255892, Grant Date: 08/20/2002, Expiration Date: 08/20/2012, Cancellation Date: 04/24/2012, Certifier: Charles D Van Sant, Registrant: Charles D Van Sant, 19912 Cravenhurst Drive, Greendale, IN 47025
Call Sign: KD9PBZ, Licensee ID: L02333621, Grant Date: 03/16/2020, Expiration Date: 03/16/2030, Certifier: Anthony S Crosby, Registrant: Anthony S Crosby, 62 Catalpa Avenue, Greendale, IN 47025
FAA Registered Aircraft:
1
Aircraft: CESSNA T210M (Category: Land, Seats: 6, Weight: Up to 12,499 Pounds, Speed: 141 mph), Engine: CONT MOTOR TSIO-520 SER (300 HP) (Reciprocating) N-Number: 210ZX, N210ZX, N-210ZX, Serial Number: 21061705, Year manufactured: 1977, Certificate Issue Date: 05/17/1989 Registrant (Individual): William G Krider, 548 Ridge Ave, Greendale, IN 47025
Home Mortgage Disclosure Act Aggregated Statistics For Year 2009 (Based on 1 partial tract)
A) FHA, FSA/RHS & VA Home Purchase Loans
B) Conventional Home Purchase Loans
C) Refinancings
D) Home Improvement Loans
F) Non-occupant Loans on < 5 Family Dwellings (A B C & D)
Number
Average Value
Number
Average Value
Number
Average Value
Number
Average Value
Number
Average Value
LOANS ORIGINATED
9
$126,256
8
$122,158
46
$143,634
3
$20,593
1
$124,210
APPLICATIONS APPROVED, NOT ACCEPTED
1
$90,690
0
$0
3
$150,500
0
$0
0
$0
APPLICATIONS DENIED
2
$97,100
3
$106,357
18
$153,803
1
$3,610
1
$89,710
APPLICATIONS WITHDRAWN
1
$181,390
1
$87,410
9
$156,852
0
$0
0
$0
FILES CLOSED FOR INCOMPLETENESS
0
$0
0
$0
3
$156,523
0
$0
0
$0
Aggregated Statistics For Year 2008 (Based on 1 partial tract)
A) FHA, FSA/RHS & VA Home Purchase Loans
B) Conventional Home Purchase Loans
C) Refinancings
D) Home Improvement Loans
F) Non-occupant Loans on < 5 Family Dwellings (A B C & D)
Number
Average Value
Number
Average Value
Number
Average Value
Number
Average Value
Number
Average Value
LOANS ORIGINATED
7
$140,359
14
$128,412
33
$133,202
4
$37,708
2
$122,895
APPLICATIONS APPROVED, NOT ACCEPTED
0
$0
1
$193,220
1
$265,840
1
$7,890
0
$0
APPLICATIONS DENIED
4
$128,072
2
$117,640
23
$153,985
7
$37,179
0
$0
APPLICATIONS WITHDRAWN
2
$108,440
1
$161,340
11
$143,688
1
$59,480
0
$0
FILES CLOSED FOR INCOMPLETENESS
0
$0
0
$0
2
$204,720
0
$0
0
$0
Aggregated Statistics For Year 2007 (Based on 1 partial tract)
A) FHA, FSA/RHS & VA Home Purchase Loans
B) Conventional Home Purchase Loans
C) Refinancings
D) Home Improvement Loans
F) Non-occupant Loans on < 5 Family Dwellings (A B C & D)
G) Loans On Manufactured Home Dwelling (A B C & D)
Number
Average Value
Number
Average Value
Number
Average Value
Number
Average Value
Number
Average Value
Number
Average Value
LOANS ORIGINATED
2
$153,455
23
$142,084
34
$114,923
9
$29,319
5
$92,534
1
$33,190
APPLICATIONS APPROVED, NOT ACCEPTED
0
$0
1
$152,470
5
$143,598
1
$30,560
0
$0
0
$0
APPLICATIONS DENIED
1
$80,510
5
$126,116
25
$125,854
6
$54,657
0
$0
0
$0
APPLICATIONS WITHDRAWN
0
$0
1
$98,910
13
$124,362
0
$0
1
$95,950
0
$0
FILES CLOSED FOR INCOMPLETENESS
0
$0
1
$157,730
4
$199,625
0
$0
0
$0
0
$0
Aggregated Statistics For Year 2006 (Based on 1 partial tract)
A) FHA, FSA/RHS & VA Home Purchase Loans
B) Conventional Home Purchase Loans
C) Refinancings
D) Home Improvement Loans
F) Non-occupant Loans on < 5 Family Dwellings (A B C & D)
G) Loans On Manufactured Home Dwelling (A B C & D)
Number
Average Value
Number
Average Value
Number
Average Value
Number
Average Value
Number
Average Value
Number
Average Value
LOANS ORIGINATED
6
$107,013
32
$129,633
40
$117,212
8
$30,436
6
$113,642
1
$65,060
APPLICATIONS APPROVED, NOT ACCEPTED
0
$0
2
$122,570
7
$112,476
1
$88,390
1
$160,360
0
$0
APPLICATIONS DENIED
1
$96,940
5
$140,050
21
$113,758
5
$52,708
1
$69,660
1
$34,500
APPLICATIONS WITHDRAWN
1
$81,490
6
$103,290
15
$130,717
0
$0
0
$0
0
$0
FILES CLOSED FOR INCOMPLETENESS
0
$0
0
$0
4
$135,795
0
$0
0
$0
0
$0
Aggregated Statistics For Year 2005 (Based on 1 partial tract)
A) FHA, FSA/RHS & VA Home Purchase Loans
B) Conventional Home Purchase Loans
C) Refinancings
D) Home Improvement Loans
F) Non-occupant Loans on < 5 Family Dwellings (A B C & D)
Number
Average Value
Number
Average Value
Number
Average Value
Number
Average Value
Number
Average Value
LOANS ORIGINATED
5
$112,842
35
$132,717
49
$107,848
11
$41,255
6
$112,545
APPLICATIONS APPROVED, NOT ACCEPTED
0
$0
5
$80,046
7
$116,747
1
$34,170
1
$60,460
APPLICATIONS DENIED
1
$134,400
7
$124,446
33
$125,864
6
$46,935
1
$219,500
APPLICATIONS WITHDRAWN
1
$97,590
4
$126,265
19
$139,136
1
$165,290
1
$179,090
FILES CLOSED FOR INCOMPLETENESS
0
$0
0
$0
5
$220,820
0
$0
1
$38,770
Aggregated Statistics For Year 2004 (Based on 1 partial tract)
A) FHA, FSA/RHS & VA Home Purchase Loans
B) Conventional Home Purchase Loans
C) Refinancings
D) Home Improvement Loans
F) Non-occupant Loans on < 5 Family Dwellings (A B C & D)
G) Loans On Manufactured Home Dwelling (A B C & D)
Number
Average Value
Number
Average Value
Number
Average Value
Number
Average Value
Number
Average Value
Number
Average Value
LOANS ORIGINATED
5
$104,232
46
$131,947
54
$108,249
6
$31,327
8
$97,184
1
$113,370
APPLICATIONS APPROVED, NOT ACCEPTED
0
$0
5
$118,428
5
$102,984
1
$25,960
1
$46,000
0
$0
APPLICATIONS DENIED
1
$175,800
3
$119,610
26
$118,410
5
$25,106
1
$130,130
0
$0
APPLICATIONS WITHDRAWN
0
$0
4
$145,160
15
$123,839
2
$58,985
0
$0
0
$0
FILES CLOSED FOR INCOMPLETENESS
1
$84,450
0
$0
4
$160,358
1
$11,500
0
$0
0
$0
Aggregated Statistics For Year 2003 (Based on 1 partial tract)
A) FHA, FSA/RHS & VA Home Purchase Loans
B) Conventional Home Purchase Loans
C) Refinancings
D) Home Improvement Loans
F) Non-occupant Loans on < 5 Family Dwellings (A B C & D)
Number
Average Value
Number
Average Value
Number
Average Value
Number
Average Value
Number
Average Value
LOANS ORIGINATED
5
$126,972
45
$134,558
109
$118,564
29
$89,799
10
$81,033
APPLICATIONS APPROVED, NOT ACCEPTED
1
$73,940
2
$210,470
10
$124,014
2
$7,885
1
$88,720
APPLICATIONS DENIED
1
$146,560
5
$81,428
28
$124,891
6
$50,605
1
$41,400
APPLICATIONS WITHDRAWN
1
$105,810
5
$157,728
18
$110,026
1
$19,720
1
$117,640
FILES CLOSED FOR INCOMPLETENESS
0
$0
2
$55,700
5
$108,176
1
$6,570
0
$0
Aggregated Statistics For Year 2002 (Based on 1 partial tract)
A) FHA, FSA/RHS & VA Home Purchase Loans
B) Conventional Home Purchase Loans
C) Refinancings
D) Home Improvement Loans
F) Non-occupant Loans on < 5 Family Dwellings (A B C & D)
Number
Average Value
Number
Average Value
Number
Average Value
Number
Average Value
Number
Average Value
LOANS ORIGINATED
7
$91,304
27
$105,943
95
$110,489
12
$18,374
4
$77,302
APPLICATIONS APPROVED, NOT ACCEPTED
0
$0
3
$114,680
10
$107,091
3
$9,530
1
$75,910
APPLICATIONS DENIED
1
$91,350
5
$70,650
27
$108,243
3
$11,283
1
$63,090
APPLICATIONS WITHDRAWN
0
$0
3
$88,940
15
$97,682
1
$27,930
0
$0
FILES CLOSED FOR INCOMPLETENESS
0
$0
0
$0
3
$106,247
0
$0
0
$0
Aggregated Statistics For Year 2001 (Based on 1 partial tract)
A) FHA, FSA/RHS & VA Home Purchase Loans
B) Conventional Home Purchase Loans
C) Refinancings
D) Home Improvement Loans
F) Non-occupant Loans on < 5 Family Dwellings (A B C & D)
Number
Average Value
Number
Average Value
Number
Average Value
Number
Average Value
Number
Average Value
LOANS ORIGINATED
8
$109,219
33
$104,545
94
$105,390
8
$21,605
5
$75,250
APPLICATIONS APPROVED, NOT ACCEPTED
0
$0
3
$103,510
9
$100,004
3
$15,227
1
$59,810
APPLICATIONS DENIED
0
$0
7
$76,470
20
$110,492
5
$14,392
0
$0
APPLICATIONS WITHDRAWN
1
$70,650
2
$82,970
11
$87,557
1
$18,400
0
$0
FILES CLOSED FOR INCOMPLETENESS
0
$0
1
$133,410
3
$90,367
0
$0
0
$0
Aggregated Statistics For Year 2000 (Based on 1 partial tract)
A) FHA, FSA/RHS & VA Home Purchase Loans
B) Conventional Home Purchase Loans
C) Refinancings
D) Home Improvement Loans
E) Loans on Dwellings For 5+ Families
F) Non-occupant Loans on < 5 Family Dwellings (A B C & D)
Number
Average Value
Number
Average Value
Number
Average Value
Number
Average Value
Number
Average Value
Number
Average Value
LOANS ORIGINATED
4
$86,258
33
$104,794
27
$74,921
15
$14,721
1
$91,350
4
$53,315
APPLICATIONS APPROVED, NOT ACCEPTED
1
$72,290
3
$64,517
8
$86,299
5
$13,012
0
$0
0
$0
APPLICATIONS DENIED
1
$107,450
10
$79,061
14
$66,941
5
$22,542
0
$0
2
$133,575
APPLICATIONS WITHDRAWN
1
$60,130
4
$112,955
8
$81,000
2
$26,290
0
$0
0
$0
FILES CLOSED FOR INCOMPLETENESS
0
$0
1
$122,240
1
$82,150
1
$14,790
0
$0
0
$0
Aggregated Statistics For Year 1999 (Based on 1 partial tract)
A) FHA, FSA/RHS & VA Home Purchase Loans
B) Conventional Home Purchase Loans
C) Refinancings
D) Home Improvement Loans
F) Non-occupant Loans on < 5 Family Dwellings (A B C & D)
Detailed PMIC statistics for the following Tracts:0804.00
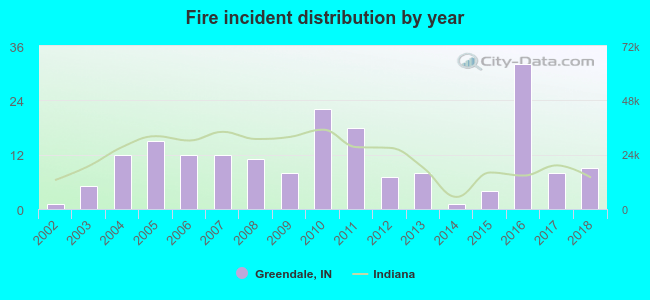
2002 - 2018 National Fire Incident Reporting System (NFIRS) incidents
According to the data from the years 2002 - 2018 the average number of fires per year is 11. The highest number of fires - 32 took place in 2016, and the least - 1 in 2002. The data has an increasing trend.
When looking into fire subcategories, the most incidents belonged to: Structure Fires (32.4%), and Mobile Property/Vehicle Fires (29.2%).
Fire incident types reported to NFIRS in Greendale, IN


 Recent articles from our blog. Our writers, many of them Ph.D. graduates or candidates, create easy-to-read articles on a wide variety of topics.

 (18.9 miles


 According to the data from the years 2002 - 2018 the average number of fires per year is 11. The highest number of fires - 32 took place in 2016, and the least - 1 in 2002. The data has an increasing trend.
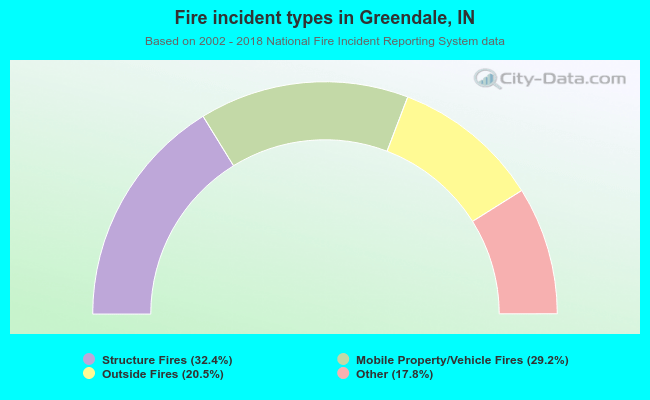 When looking into fire subcategories, the most incidents belonged to: Structure Fires (32.4%), and Mobile Property/Vehicle Fires (29.2%).