Grimes, Iowa Submit your own pictures of this city and show them to the world
OSM Map
General Map
Google Map
MSN Map
OSM Map
General Map
Google Map
MSN Map
OSM Map
General Map
Google Map
MSN Map
OSM Map
General Map
Google Map
MSN Map
Please wait while loading the map...
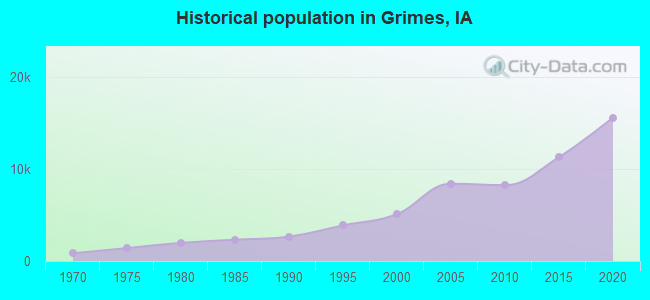
Population in 2022: 16,295 (99% urban, 1% rural). Population change since 2000: +219.6%Males: 8,565 Females: 7,730
March 2022 cost of living index in Grimes: 89.8 (less than average, U.S. average is 100) Percentage of residents living in poverty in 2022: 6.5%for White Non-Hispanic residents , 14.5% for two or more races residents )
Profiles of local businesses
Business Search - 14 Million verified businesses
Data:
Median household income ($)
Median household income (% change since 2000)
Household income diversity
Ratio of average income to average house value (%)
Ratio of average income to average rent
Median household income ($) - White
Median household income ($) - Black or African American
Median household income ($) - Asian
Median household income ($) - Hispanic or Latino
Median household income ($) - American Indian and Alaska Native
Median household income ($) - Multirace
Median household income ($) - Other Race
Median household income for houses/condos with a mortgage ($)
Median household income for apartments without a mortgage ($)
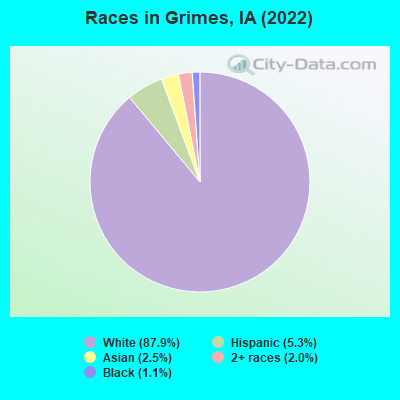
Races - White alone (%)
Races - White alone (% change since 2000)
Races - Black alone (%)
Races - Black alone (% change since 2000)
Races - American Indian alone (%)
Races - American Indian alone (% change since 2000)
Races - Asian alone (%)
Races - Asian alone (% change since 2000)
Races - Hispanic (%)
Races - Hispanic (% change since 2000)
Races - Native Hawaiian and Other Pacific Islander alone (%)
Races - Native Hawaiian and Other Pacific Islander alone (% change since 2000)
Races - Two or more races (%)
Races - Two or more races (% change since 2000)
Races - Other race alone (%)
Races - Other race alone (% change since 2000)
Racial diversity
Unemployment (%)
Unemployment (% change since 2000)
Unemployment (%) - White
Unemployment (%) - Black or African American
Unemployment (%) - Asian
Unemployment (%) - Hispanic or Latino
Unemployment (%) - American Indian and Alaska Native
Unemployment (%) - Multirace
Unemployment (%) - Other Race
Population density (people per square mile)
Population - Males (%)
Population - Females (%)
Population - Males (%) - White
Population - Males (%) - Black or African American
Population - Males (%) - Asian
Population - Males (%) - Hispanic or Latino
Population - Males (%) - American Indian and Alaska Native
Population - Males (%) - Multirace
Population - Males (%) - Other Race
Population - Females (%) - White
Population - Females (%) - Black or African American
Population - Females (%) - Asian
Population - Females (%) - Hispanic or Latino
Population - Females (%) - American Indian and Alaska Native
Population - Females (%) - Multirace
Population - Females (%) - Other Race
Coronavirus confirmed cases (Jun 16, 2024)
Deaths caused by coronavirus (Jun 16, 2024)
Coronavirus confirmed cases (per 100k population) (Jun 16, 2024)
Deaths caused by coronavirus (per 100k population) (Jun 16, 2024)
Daily increase in number of cases (Jun 16, 2024)
Weekly increase in number of cases (Jun 16, 2024)
Cases doubled (in days) (Jun 16, 2024)
Hospitalized patients (Apr 18, 2022)
Negative test results (Apr 18, 2022)
Total test results (Apr 18, 2022)
COVID Vaccine doses distributed (per 100k population) (Sep 19, 2023)
COVID Vaccine doses administered (per 100k population) (Sep 19, 2023)
COVID Vaccine doses distributed (Sep 19, 2023)
COVID Vaccine doses administered (Sep 19, 2023)
Likely homosexual households (%)
Likely homosexual households (% change since 2000)
Likely homosexual households - Lesbian couples (%)
Likely homosexual households - Lesbian couples (% change since 2000)
Likely homosexual households - Gay men (%)
Likely homosexual households - Gay men (% change since 2000)
Cost of living index
Median gross rent ($)
Median contract rent ($)
Median monthly housing costs ($)
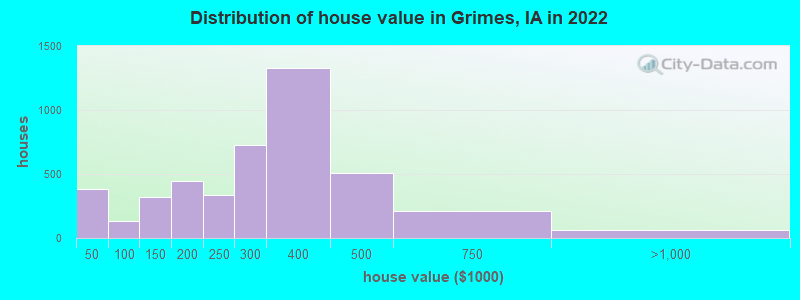
Median house or condo value ($)
Median house or condo value ($ change since 2000)
Mean house or condo value by units in structure - 1, detached ($)
Mean house or condo value by units in structure - 1, attached ($)
Mean house or condo value by units in structure - 2 ($)
Mean house or condo value by units in structure by units in structure - 3 or 4 ($)
Mean house or condo value by units in structure - 5 or more ($)
Mean house or condo value by units in structure - Boat, RV, van, etc. ($)
Mean house or condo value by units in structure - Mobile home ($)
Median house or condo value ($) - White
Median house or condo value ($) - Black or African American
Median house or condo value ($) - Asian
Median house or condo value ($) - Hispanic or Latino
Median house or condo value ($) - American Indian and Alaska Native
Median house or condo value ($) - Multirace
Median house or condo value ($) - Other Race
Median resident age
Resident age diversity
Median resident age - Males
Median resident age - Females
Median resident age - White
Median resident age - Black or African American
Median resident age - Asian
Median resident age - Hispanic or Latino
Median resident age - American Indian and Alaska Native
Median resident age - Multirace
Median resident age - Other Race
Median resident age - Males - White
Median resident age - Males - Black or African American
Median resident age - Males - Asian
Median resident age - Males - Hispanic or Latino
Median resident age - Males - American Indian and Alaska Native
Median resident age - Males - Multirace
Median resident age - Males - Other Race
Median resident age - Females - White
Median resident age - Females - Black or African American
Median resident age - Females - Asian
Median resident age - Females - Hispanic or Latino
Median resident age - Females - American Indian and Alaska Native
Median resident age - Females - Multirace
Median resident age - Females - Other Race
Commute - mean travel time to work (minutes)
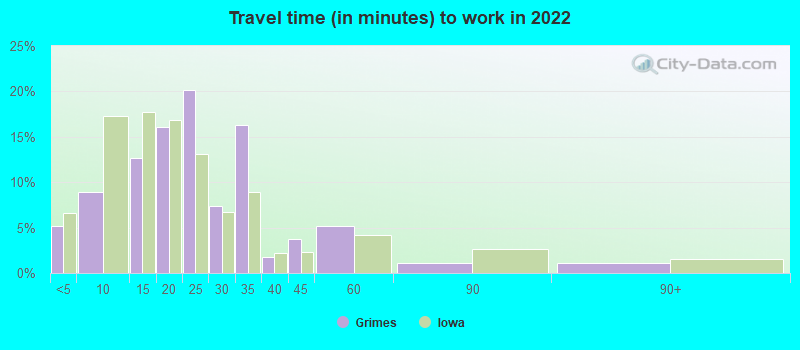
Travel time to work - Less than 5 minutes (%)
Travel time to work - Less than 5 minutes (% change since 2000)
Travel time to work - 5 to 9 minutes (%)
Travel time to work - 5 to 9 minutes (% change since 2000)
Travel time to work - 10 to 19 minutes (%)
Travel time to work - 10 to 19 minutes (% change since 2000)
Travel time to work - 20 to 29 minutes (%)
Travel time to work - 20 to 29 minutes (% change since 2000)
Travel time to work - 30 to 39 minutes (%)
Travel time to work - 30 to 39 minutes (% change since 2000)
Travel time to work - 40 to 59 minutes (%)
Travel time to work - 40 to 59 minutes (% change since 2000)
Travel time to work - 60 to 89 minutes (%)
Travel time to work - 60 to 89 minutes (% change since 2000)
Travel time to work - 90 or more minutes (%)
Travel time to work - 90 or more minutes (% change since 2000)
Marital status - Never married (%)
Marital status - Now married (%)
Marital status - Separated (%)
Marital status - Widowed (%)
Marital status - Divorced (%)
Median family income ($)
Median family income (% change since 2000)
Median non-family income ($)
Median non-family income (% change since 2000)
Median per capita income ($)
Median per capita income (% change since 2000)
Median family income ($) - White
Median family income ($) - Black or African American
Median family income ($) - Asian
Median family income ($) - Hispanic or Latino
Median family income ($) - American Indian and Alaska Native
Median family income ($) - Multirace
Median family income ($) - Other Race
Median year house/condo built
Median year apartment built
Year house built - Built 2005 or later (%)
Year house built - Built 2000 to 2004 (%)
Year house built - Built 1990 to 1999 (%)
Year house built - Built 1980 to 1989 (%)
Year house built - Built 1970 to 1979 (%)
Year house built - Built 1960 to 1969 (%)
Year house built - Built 1950 to 1959 (%)
Year house built - Built 1940 to 1949 (%)
Year house built - Built 1939 or earlier (%)
Average household size
Household density (households per square mile)
Average household size - White
Average household size - Black or African American
Average household size - Asian
Average household size - Hispanic or Latino
Average household size - American Indian and Alaska Native
Average household size - Multirace
Average household size - Other Race
Occupied housing units (%)
Vacant housing units (%)
Owner occupied housing units (%)
Renter occupied housing units (%)
Vacancy status - For rent (%)
Vacancy status - For sale only (%)
Vacancy status - Rented or sold, not occupied (%)
Vacancy status - For seasonal, recreational, or occasional use (%)
Vacancy status - For migrant workers (%)
Vacancy status - Other vacant (%)
Residents with income below the poverty level (%)
Residents with income below 50% of the poverty level (%)
Children below poverty level (%)
Poor families by family type - Married-couple family (%)
Poor families by family type - Male, no wife present (%)
Poor families by family type - Female, no husband present (%)
Poverty status for native-born residents (%)
Poverty status for foreign-born residents (%)
Poverty among high school graduates not in families (%)
Poverty among people who did not graduate high school not in families (%)
Residents with income below the poverty level (%) - White
Residents with income below the poverty level (%) - Black or African American
Residents with income below the poverty level (%) - Asian
Residents with income below the poverty level (%) - Hispanic or Latino
Residents with income below the poverty level (%) - American Indian and Alaska Native
Residents with income below the poverty level (%) - Multirace
Residents with income below the poverty level (%) - Other Race
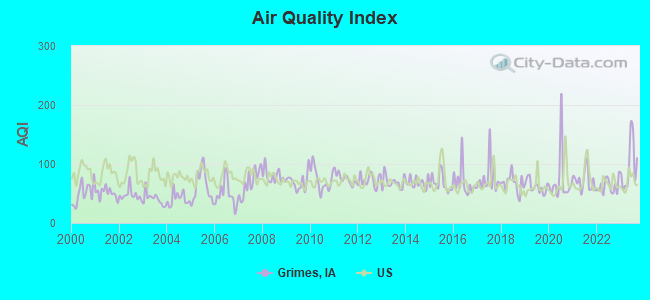
Air pollution - Air Quality Index (AQI)
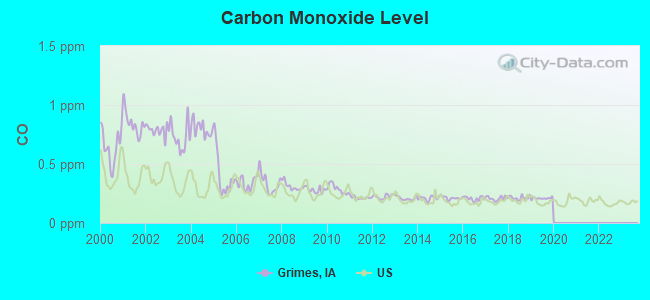
Air pollution - CO
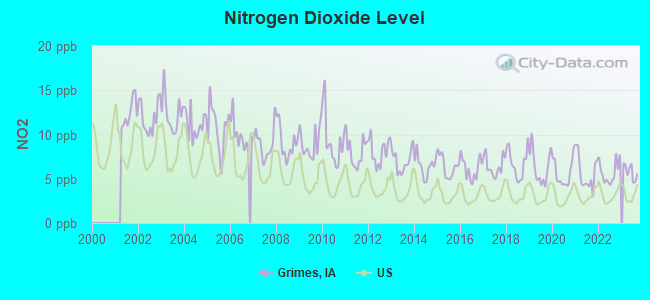
Air pollution - NO2
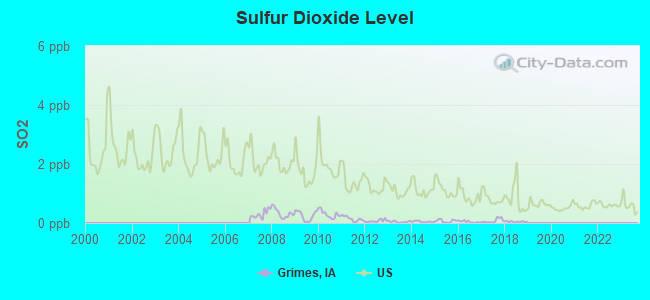
Air pollution - SO2
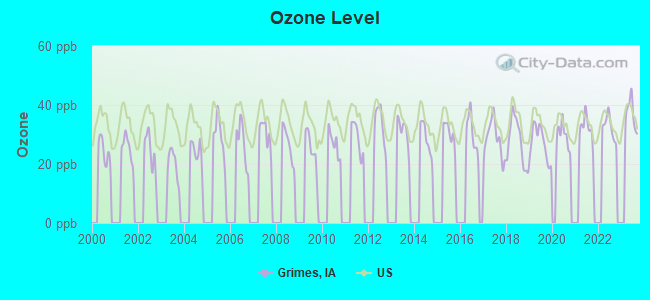
Air pollution - Ozone
Air pollution - PM10
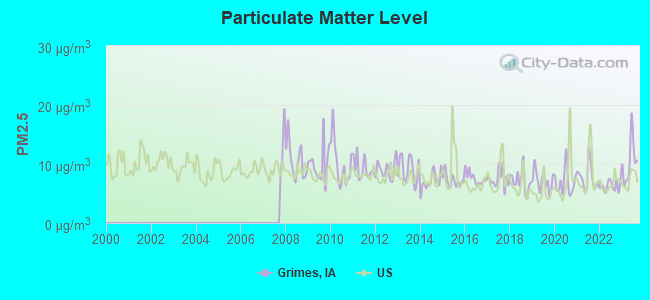
Air pollution - PM25
Air pollution - Pb
Crime - Murders per 100,000 population
Crime - Rapes per 100,000 population
Crime - Robberies per 100,000 population
Crime - Assaults per 100,000 population
Crime - Burglaries per 100,000 population
Crime - Thefts per 100,000 population
Crime - Auto thefts per 100,000 population
Crime - Arson per 100,000 population
Crime - City-data.com crime index
Crime - Violent crime index
Crime - Property crime index
Crime - Murders per 100,000 population (5 year average)
Crime - Rapes per 100,000 population (5 year average)
Crime - Robberies per 100,000 population (5 year average)
Crime - Assaults per 100,000 population (5 year average)
Crime - Burglaries per 100,000 population (5 year average)
Crime - Thefts per 100,000 population (5 year average)
Crime - Auto thefts per 100,000 population (5 year average)
Crime - Arson per 100,000 population (5 year average)
Crime - City-data.com crime index (5 year average)
Crime - Violent crime index (5 year average)
Crime - Property crime index (5 year average)
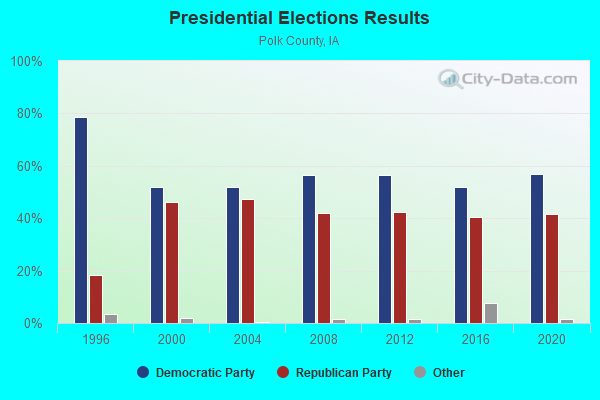
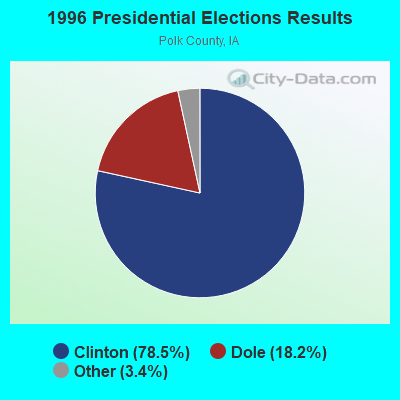
1996 Presidential Elections Results (%) - Democratic Party (Clinton)
1996 Presidential Elections Results (%) - Republican Party (Dole)
1996 Presidential Elections Results (%) - Other
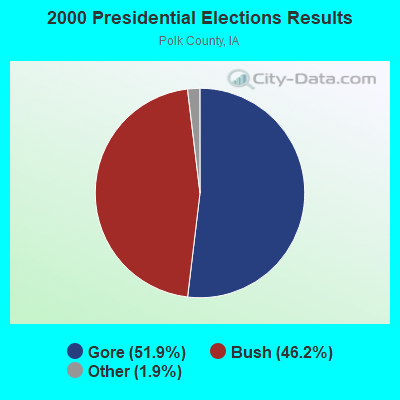
2000 Presidential Elections Results (%) - Democratic Party (Gore)
2000 Presidential Elections Results (%) - Republican Party (Bush)
2000 Presidential Elections Results (%) - Other
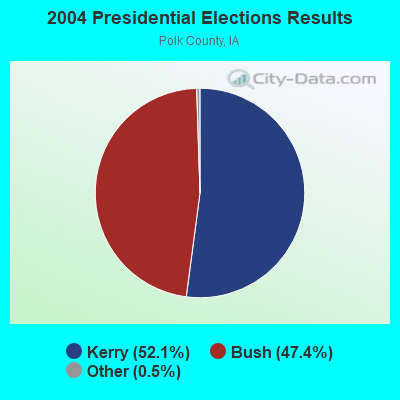
2004 Presidential Elections Results (%) - Democratic Party (Kerry)
2004 Presidential Elections Results (%) - Republican Party (Bush)
2004 Presidential Elections Results (%) - Other
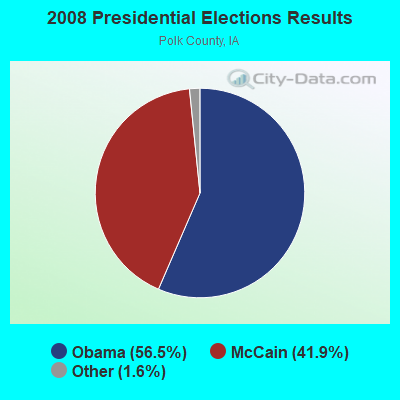
2008 Presidential Elections Results (%) - Democratic Party (Obama)
2008 Presidential Elections Results (%) - Republican Party (McCain)
2008 Presidential Elections Results (%) - Other
2012 Presidential Elections Results (%) - Democratic Party (Obama)
2012 Presidential Elections Results (%) - Republican Party (Romney)
2012 Presidential Elections Results (%) - Other
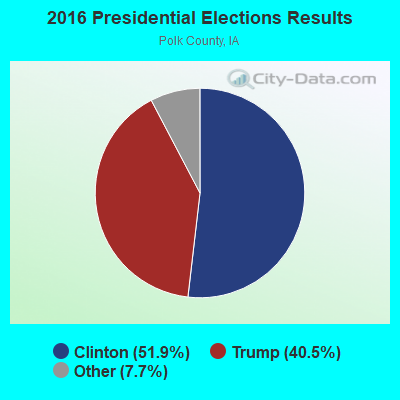
2016 Presidential Elections Results (%) - Democratic Party (Clinton)
2016 Presidential Elections Results (%) - Republican Party (Trump)
2016 Presidential Elections Results (%) - Other
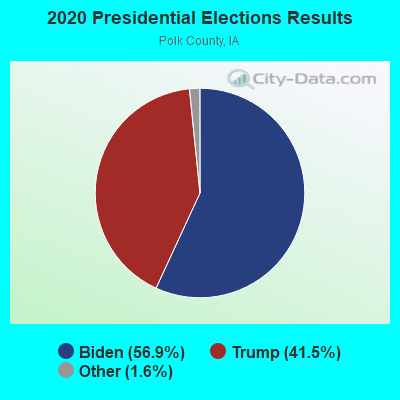
2020 Presidential Elections Results (%) - Democratic Party (Biden)
2020 Presidential Elections Results (%) - Republican Party (Trump)
2020 Presidential Elections Results (%) - Other
Ancestries Reported - Arab (%)
Ancestries Reported - Czech (%)
Ancestries Reported - Danish (%)
Ancestries Reported - Dutch (%)
Ancestries Reported - English (%)
Ancestries Reported - French (%)
Ancestries Reported - French Canadian (%)
Ancestries Reported - German (%)
Ancestries Reported - Greek (%)
Ancestries Reported - Hungarian (%)
Ancestries Reported - Irish (%)
Ancestries Reported - Italian (%)
Ancestries Reported - Lithuanian (%)
Ancestries Reported - Norwegian (%)
Ancestries Reported - Polish (%)
Ancestries Reported - Portuguese (%)
Ancestries Reported - Russian (%)
Ancestries Reported - Scotch-Irish (%)
Ancestries Reported - Scottish (%)
Ancestries Reported - Slovak (%)
Ancestries Reported - Subsaharan African (%)
Ancestries Reported - Swedish (%)
Ancestries Reported - Swiss (%)
Ancestries Reported - Ukrainian (%)
Ancestries Reported - United States (%)
Ancestries Reported - Welsh (%)
Ancestries Reported - West Indian (%)
Ancestries Reported - Other (%)
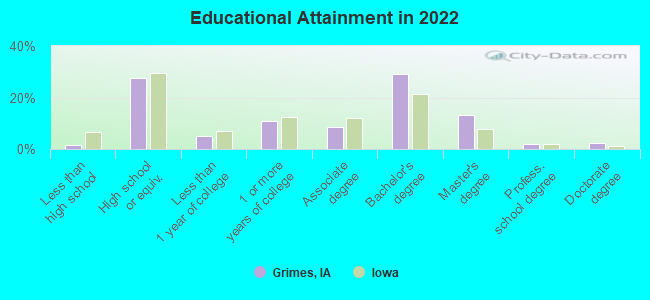
Educational Attainment - No schooling completed (%)
Educational Attainment - Less than high school (%)
Educational Attainment - High school or equivalent (%)
Educational Attainment - Less than 1 year of college (%)
Educational Attainment - 1 or more years of college (%)
Educational Attainment - Associate degree (%)
Educational Attainment - Bachelor's degree (%)
Educational Attainment - Master's degree (%)
Educational Attainment - Professional school degree (%)
Educational Attainment - Doctorate degree (%)
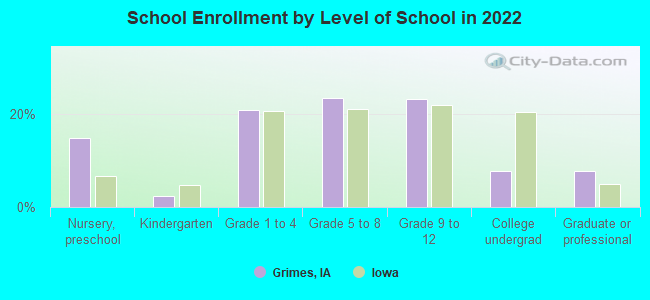
School Enrollment - Nursery, preschool (%)
School Enrollment - Kindergarten (%)
School Enrollment - Grade 1 to 4 (%)
School Enrollment - Grade 5 to 8 (%)
School Enrollment - Grade 9 to 12 (%)
School Enrollment - College undergrad (%)
School Enrollment - Graduate or professional (%)
School Enrollment - Not enrolled in school (%)
School enrollment - Public schools (%)
School enrollment - Private schools (%)
School enrollment - Not enrolled (%)
Median number of rooms in houses and condos
Median number of rooms in apartments
Housing units lacking complete plumbing facilities (%)
Housing units lacking complete kitchen facilities (%)
Density of houses
Urban houses (%)
Rural houses (%)
Households with people 60 years and over (%)
Households with people 65 years and over (%)
Households with people 75 years and over (%)
Households with one or more nonrelatives (%)
Households with no nonrelatives (%)
Population in households (%)
Family households (%)
Nonfamily households (%)
Population in families (%)
Family households with own children (%)
Median number of bedrooms in owner occupied houses
Mean number of bedrooms in owner occupied houses
Median number of bedrooms in renter occupied houses
Mean number of bedrooms in renter occupied houses
Median number of vehichles in owner occupied houses
Mean number of vehichles in owner occupied houses
Median number of vehichles in renter occupied houses
Mean number of vehichles in renter occupied houses
Mortgage status - with mortgage (%)
Mortgage status - with second mortgage (%)
Mortgage status - with home equity loan (%)
Mortgage status - with both second mortgage and home equity loan (%)
Mortgage status - without a mortgage (%)
Average family size
Average family size - White
Average family size - Black or African American
Average family size - Asian
Average family size - Hispanic or Latino
Average family size - American Indian and Alaska Native
Average family size - Multirace
Average family size - Other Race
Geographical mobility - Same house 1 year ago (%)
Geographical mobility - Moved within same county (%)
Geographical mobility - Moved from different county within same state (%)
Geographical mobility - Moved from different state (%)
Geographical mobility - Moved from abroad (%)
Place of birth - Born in state of residence (%)
Place of birth - Born in other state (%)
Place of birth - Native, outside of US (%)
Place of birth - Foreign born (%)
Housing units in structures - 1, detached (%)
Housing units in structures - 1, attached (%)
Housing units in structures - 2 (%)
Housing units in structures - 3 or 4 (%)
Housing units in structures - 5 to 9 (%)
Housing units in structures - 10 to 19 (%)
Housing units in structures - 20 to 49 (%)
Housing units in structures - 50 or more (%)
Housing units in structures - Mobile home (%)
Housing units in structures - Boat, RV, van, etc. (%)
House/condo owner moved in on average (years ago)
Renter moved in on average (years ago)
Year householder moved into unit - Moved in 1999 to March 2000 (%)
Year householder moved into unit - Moved in 1995 to 1998 (%)
Year householder moved into unit - Moved in 1990 to 1994 (%)
Year householder moved into unit - Moved in 1980 to 1989 (%)
Year householder moved into unit - Moved in 1970 to 1979 (%)
Year householder moved into unit - Moved in 1969 or earlier (%)
Means of transportation to work - Drove car alone (%)
Means of transportation to work - Carpooled (%)
Means of transportation to work - Public transportation (%)
Means of transportation to work - Bus or trolley bus (%)
Means of transportation to work - Streetcar or trolley car (%)
Means of transportation to work - Subway or elevated (%)
Means of transportation to work - Railroad (%)
Means of transportation to work - Ferryboat (%)
Means of transportation to work - Taxicab (%)
Means of transportation to work - Motorcycle (%)
Means of transportation to work - Bicycle (%)
Means of transportation to work - Walked (%)
Means of transportation to work - Other means (%)
Working at home (%)
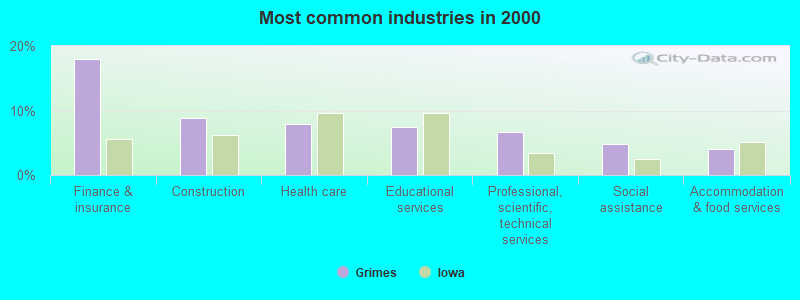
Industry diversity
Most Common Industries - Agriculture, forestry, fishing and hunting, and mining (%)
Most Common Industries - Agriculture, forestry, fishing and hunting (%)
Most Common Industries - Mining, quarrying, and oil and gas extraction (%)
Most Common Industries - Construction (%)
Most Common Industries - Manufacturing (%)
Most Common Industries - Wholesale trade (%)
Most Common Industries - Retail trade (%)
Most Common Industries - Transportation and warehousing, and utilities (%)
Most Common Industries - Transportation and warehousing (%)
Most Common Industries - Utilities (%)
Most Common Industries - Information (%)
Most Common Industries - Finance and insurance, and real estate and rental and leasing (%)
Most Common Industries - Finance and insurance (%)
Most Common Industries - Real estate and rental and leasing (%)
Most Common Industries - Professional, scientific, and management, and administrative and waste management services (%)
Most Common Industries - Professional, scientific, and technical services (%)
Most Common Industries - Management of companies and enterprises (%)
Most Common Industries - Administrative and support and waste management services (%)
Most Common Industries - Educational services, and health care and social assistance (%)
Most Common Industries - Educational services (%)
Most Common Industries - Health care and social assistance (%)
Most Common Industries - Arts, entertainment, and recreation, and accommodation and food services (%)
Most Common Industries - Arts, entertainment, and recreation (%)
Most Common Industries - Accommodation and food services (%)
Most Common Industries - Other services, except public administration (%)
Most Common Industries - Public administration (%)
Occupation diversity
Most Common Occupations - Management, business, science, and arts occupations (%)
Most Common Occupations - Management, business, and financial occupations (%)
Most Common Occupations - Management occupations (%)
Most Common Occupations - Business and financial operations occupations (%)
Most Common Occupations - Computer, engineering, and science occupations (%)
Most Common Occupations - Computer and mathematical occupations (%)
Most Common Occupations - Architecture and engineering occupations (%)
Most Common Occupations - Life, physical, and social science occupations (%)
Most Common Occupations - Education, legal, community service, arts, and media occupations (%)
Most Common Occupations - Community and social service occupations (%)
Most Common Occupations - Legal occupations (%)
Most Common Occupations - Education, training, and library occupations (%)
Most Common Occupations - Arts, design, entertainment, sports, and media occupations (%)
Most Common Occupations - Healthcare practitioners and technical occupations (%)
Most Common Occupations - Health diagnosing and treating practitioners and other technical occupations (%)
Most Common Occupations - Health technologists and technicians (%)
Most Common Occupations - Service occupations (%)
Most Common Occupations - Healthcare support occupations (%)
Most Common Occupations - Protective service occupations (%)
Most Common Occupations - Fire fighting and prevention, and other protective service workers including supervisors (%)
Most Common Occupations - Law enforcement workers including supervisors (%)
Most Common Occupations - Food preparation and serving related occupations (%)
Most Common Occupations - Building and grounds cleaning and maintenance occupations (%)
Most Common Occupations - Personal care and service occupations (%)
Most Common Occupations - Sales and office occupations (%)
Most Common Occupations - Sales and related occupations (%)
Most Common Occupations - Office and administrative support occupations (%)
Most Common Occupations - Natural resources, construction, and maintenance occupations (%)
Most Common Occupations - Farming, fishing, and forestry occupations (%)
Most Common Occupations - Construction and extraction occupations (%)
Most Common Occupations - Installation, maintenance, and repair occupations (%)
Most Common Occupations - Production, transportation, and material moving occupations (%)
Most Common Occupations - Production occupations (%)
Most Common Occupations - Transportation occupations (%)
Most Common Occupations - Material moving occupations (%)
People in Group quarters - Institutionalized population (%)
People in Group quarters - Correctional institutions (%)
People in Group quarters - Federal prisons and detention centers (%)
People in Group quarters - Halfway houses (%)
People in Group quarters - Local jails and other confinement facilities (including police lockups) (%)
People in Group quarters - Military disciplinary barracks (%)
People in Group quarters - State prisons (%)
People in Group quarters - Other types of correctional institutions (%)
People in Group quarters - Nursing homes (%)
People in Group quarters - Hospitals/wards, hospices, and schools for the handicapped (%)
People in Group quarters - Hospitals/wards and hospices for chronically ill (%)
People in Group quarters - Hospices or homes for chronically ill (%)
People in Group quarters - Military hospitals or wards for chronically ill (%)
People in Group quarters - Other hospitals or wards for chronically ill (%)
People in Group quarters - Hospitals or wards for drug/alcohol abuse (%)
People in Group quarters - Mental (Psychiatric) hospitals or wards (%)
People in Group quarters - Schools, hospitals, or wards for the mentally retarded (%)
People in Group quarters - Schools, hospitals, or wards for the physically handicapped (%)
People in Group quarters - Institutions for the deaf (%)
People in Group quarters - Institutions for the blind (%)
People in Group quarters - Orthopedic wards and institutions for the physically handicapped (%)
People in Group quarters - Wards in general hospitals for patients who have no usual home elsewhere (%)
People in Group quarters - Wards in military hospitals for patients who have no usual home elsewhere (%)
People in Group quarters - Juvenile institutions (%)
People in Group quarters - Long-term care (%)
People in Group quarters - Homes for abused, dependent, and neglected children (%)
People in Group quarters - Residential treatment centers for emotionally disturbed children (%)
People in Group quarters - Training schools for juvenile delinquents (%)
People in Group quarters - Short-term care, detention or diagnostic centers for delinquent children (%)
People in Group quarters - Type of juvenile institution unknown (%)
People in Group quarters - Noninstitutionalized population (%)
People in Group quarters - College dormitories (includes college quarters off campus) (%)
People in Group quarters - Military quarters (%)
People in Group quarters - On base (%)
People in Group quarters - Barracks, unaccompanied personnel housing (UPH), (Enlisted/Officer), ;and similar group living quarters for military personnel (%)
People in Group quarters - Transient quarters for temporary residents (%)
People in Group quarters - Military ships (%)
People in Group quarters - Group homes (%)
People in Group quarters - Homes or halfway houses for drug/alcohol abuse (%)
People in Group quarters - Homes for the mentally ill (%)
People in Group quarters - Homes for the mentally retarded (%)
People in Group quarters - Homes for the physically handicapped (%)
People in Group quarters - Other group homes (%)
People in Group quarters - Religious group quarters (%)
People in Group quarters - Dormitories (%)
People in Group quarters - Agriculture workers' dormitories on farms (%)
People in Group quarters - Job Corps and vocational training facilities (%)
People in Group quarters - Other workers' dormitories (%)
People in Group quarters - Crews of maritime vessels (%)
People in Group quarters - Other nonhousehold living situations (%)
People in Group quarters - Other noninstitutional group quarters (%)
Residents speaking English at home (%)
Residents speaking English at home - Born in the United States (%)
Residents speaking English at home - Native, born elsewhere (%)
Residents speaking English at home - Foreign born (%)
Residents speaking Spanish at home (%)
Residents speaking Spanish at home - Born in the United States (%)
Residents speaking Spanish at home - Native, born elsewhere (%)
Residents speaking Spanish at home - Foreign born (%)
Residents speaking other language at home (%)
Residents speaking other language at home - Born in the United States (%)
Residents speaking other language at home - Native, born elsewhere (%)
Residents speaking other language at home - Foreign born (%)
Class of Workers - Employee of private company (%)
Class of Workers - Self-employed in own incorporated business (%)
Class of Workers - Private not-for-profit wage and salary workers (%)
Class of Workers - Local government workers (%)
Class of Workers - State government workers (%)
Class of Workers - Federal government workers (%)
Class of Workers - Self-employed workers in own not incorporated business and Unpaid family workers (%)
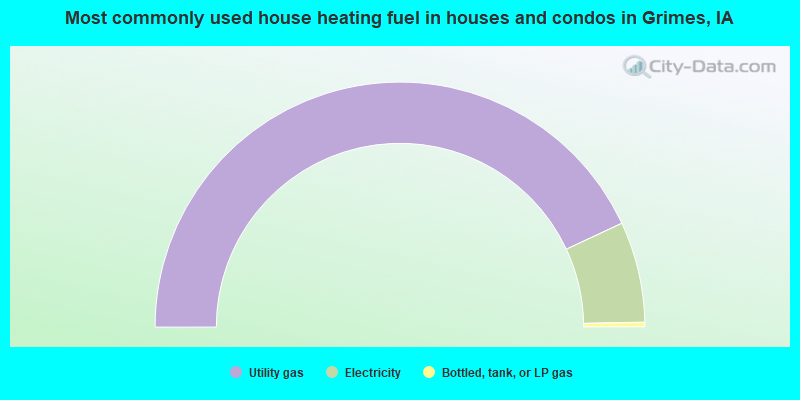
House heating fuel used in houses and condos - Utility gas (%)
House heating fuel used in houses and condos - Bottled, tank, or LP gas (%)
House heating fuel used in houses and condos - Electricity (%)
House heating fuel used in houses and condos - Fuel oil, kerosene, etc. (%)
House heating fuel used in houses and condos - Coal or coke (%)
House heating fuel used in houses and condos - Wood (%)
House heating fuel used in houses and condos - Solar energy (%)
House heating fuel used in houses and condos - Other fuel (%)
House heating fuel used in houses and condos - No fuel used (%)
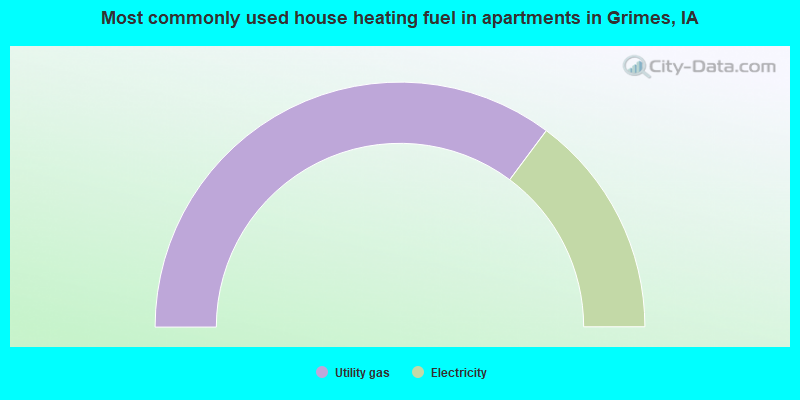
House heating fuel used in apartments - Utility gas (%)
House heating fuel used in apartments - Bottled, tank, or LP gas (%)
House heating fuel used in apartments - Electricity (%)
House heating fuel used in apartments - Fuel oil, kerosene, etc. (%)
House heating fuel used in apartments - Coal or coke (%)
House heating fuel used in apartments - Wood (%)
House heating fuel used in apartments - Solar energy (%)
House heating fuel used in apartments - Other fuel (%)
House heating fuel used in apartments - No fuel used (%)
Armed forces status - In Armed Forces (%)
Armed forces status - Civilian (%)
Armed forces status - Civilian - Veteran (%)
Armed forces status - Civilian - Nonveteran (%)
Fatal accidents locations in years 2005-2021
Fatal accidents locations in 2005
Fatal accidents locations in 2006
Fatal accidents locations in 2007
Fatal accidents locations in 2008
Fatal accidents locations in 2009
Fatal accidents locations in 2010
Fatal accidents locations in 2011
Fatal accidents locations in 2012
Fatal accidents locations in 2013
Fatal accidents locations in 2014
Fatal accidents locations in 2015
Fatal accidents locations in 2016
Fatal accidents locations in 2017
Fatal accidents locations in 2018
Fatal accidents locations in 2019
Fatal accidents locations in 2020
Fatal accidents locations in 2021
Alcohol use - People drinking some alcohol every month (%)
Alcohol use - People not drinking at all (%)
Alcohol use - Average days/month drinking alcohol
Alcohol use - Average drinks/week
Alcohol use - Average days/year people drink much
Audiometry - Average condition of hearing (%)
Audiometry - People that can hear a whisper from across a quiet room (%)
Audiometry - People that can hear normal voice from across a quiet room (%)
Audiometry - Ears ringing, roaring, buzzing (%)
Audiometry - Had a job exposure to loud noise (%)
Audiometry - Had off-work exposure to loud noise (%)
Blood Pressure & Cholesterol - Has high blood pressure (%)
Blood Pressure & Cholesterol - Checking blood pressure at home (%)
Blood Pressure & Cholesterol - Frequently checking blood cholesterol (%)
Blood Pressure & Cholesterol - Has high cholesterol level (%)
Consumer Behavior - Money monthly spent on food at supermarket/grocery store
Consumer Behavior - Money monthly spent on food at other stores
Consumer Behavior - Money monthly spent on eating out
Consumer Behavior - Money monthly spent on carryout/delivered foods
Consumer Behavior - Income spent on food at supermarket/grocery store (%)
Consumer Behavior - Income spent on food at other stores (%)
Consumer Behavior - Income spent on eating out (%)
Consumer Behavior - Income spent on carryout/delivered foods (%)
Current Health Status - General health condition (%)
Current Health Status - Blood donors (%)
Current Health Status - Has blood ever tested for HIV virus (%)
Current Health Status - Left-handed people (%)
Dermatology - People using sunscreen (%)
Diabetes - Diabetics (%)
Diabetes - Had a blood test for high blood sugar (%)
Diabetes - People taking insulin (%)
Diet Behavior & Nutrition - Diet health (%)
Diet Behavior & Nutrition - Milk product consumption (# of products/month)
Diet Behavior & Nutrition - Meals not home prepared (#/week)
Diet Behavior & Nutrition - Meals from fast food or pizza place (#/week)
Diet Behavior & Nutrition - Ready-to-eat foods (#/month)
Diet Behavior & Nutrition - Frozen meals/pizza (#/month)
Drug Use - People that ever used marijuana or hashish (%)
Drug Use - Ever used hard drugs (%)
Drug Use - Ever used any form of cocaine (%)
Drug Use - Ever used heroin (%)
Drug Use - Ever used methamphetamine (%)
Health Insurance - People covered by health insurance (%)
Kidney Conditions-Urology - Avg. # of times urinating at night
Medical Conditions - People with asthma (%)
Medical Conditions - People with anemia (%)
Medical Conditions - People with psoriasis (%)
Medical Conditions - People with overweight (%)
Medical Conditions - Elderly people having difficulties in thinking or remembering (%)
Medical Conditions - People who ever received blood transfusion (%)
Medical Conditions - People having trouble seeing even with glass/contacts (%)
Medical Conditions - People with arthritis (%)
Medical Conditions - People with gout (%)
Medical Conditions - People with congestive heart failure (%)
Medical Conditions - People with coronary heart disease (%)
Medical Conditions - People with angina pectoris (%)
Medical Conditions - People who ever had heart attack (%)
Medical Conditions - People who ever had stroke (%)
Medical Conditions - People with emphysema (%)
Medical Conditions - People with thyroid problem (%)
Medical Conditions - People with chronic bronchitis (%)
Medical Conditions - People with any liver condition (%)
Medical Conditions - People who ever had cancer or malignancy (%)
Mental Health - People who have little interest in doing things (%)
Mental Health - People feeling down, depressed, or hopeless (%)
Mental Health - People who have trouble sleeping or sleeping too much (%)
Mental Health - People feeling tired or having little energy (%)
Mental Health - People with poor appetite or overeating (%)
Mental Health - People feeling bad about themself (%)
Mental Health - People who have trouble concentrating on things (%)
Mental Health - People moving or speaking slowly or too fast (%)
Mental Health - People having thoughts they would be better off dead (%)
Oral Health - Average years since last visit a dentist
Oral Health - People embarrassed because of mouth (%)
Oral Health - People with gum disease (%)
Oral Health - General health of teeth and gums (%)
Oral Health - Average days a week using dental floss/device
Oral Health - Average days a week using mouthwash for dental problem
Oral Health - Average number of teeth
Pesticide Use - Households using pesticides to control insects (%)
Pesticide Use - Households using pesticides to kill weeds (%)
Physical Activity - People doing vigorous-intensity work activities (%)
Physical Activity - People doing moderate-intensity work activities (%)
Physical Activity - People walking or bicycling (%)
Physical Activity - People doing vigorous-intensity recreational activities (%)
Physical Activity - People doing moderate-intensity recreational activities (%)
Physical Activity - Average hours a day doing sedentary activities
Physical Activity - Average hours a day watching TV or videos
Physical Activity - Average hours a day using computer
Physical Functioning - People having limitations keeping them from working (%)
Physical Functioning - People limited in amount of work they can do (%)
Physical Functioning - People that need special equipment to walk (%)
Physical Functioning - People experiencing confusion/memory problems (%)
Physical Functioning - People requiring special healthcare equipment (%)
Prescription Medications - Average number of prescription medicines taking
Preventive Aspirin Use - Adults 40+ taking low-dose aspirin (%)
Reproductive Health - Vaginal deliveries (%)
Reproductive Health - Cesarean deliveries (%)
Reproductive Health - Deliveries resulted in a live birth (%)
Reproductive Health - Pregnancies resulted in a delivery (%)
Reproductive Health - Women breastfeeding newborns (%)
Reproductive Health - Women that had a hysterectomy (%)
Reproductive Health - Women that had both ovaries removed (%)
Reproductive Health - Women that have ever taken birth control pills (%)
Reproductive Health - Women taking birth control pills (%)
Reproductive Health - Women that have ever used Depo-Provera or injectables (%)
Reproductive Health - Women that have ever used female hormones (%)
Sexual Behavior - People 18+ that ever had sex (vaginal, anal, or oral) (%)
Sexual Behavior - Males 18+ that ever had vaginal sex with a woman (%)
Sexual Behavior - Males 18+ that ever performed oral sex on a woman (%)
Sexual Behavior - Males 18+ that ever had anal sex with a woman (%)
Sexual Behavior - Males 18+ that ever had any sex with a man (%)
Sexual Behavior - Females 18+ that ever had vaginal sex with a man (%)
Sexual Behavior - Females 18+ that ever performed oral sex on a man (%)
Sexual Behavior - Females 18+ that ever had anal sex with a man (%)
Sexual Behavior - Females 18+ that ever had any kind of sex with a woman (%)
Sexual Behavior - Average age people first had sex
Sexual Behavior - Average number of female sex partners in lifetime (males 18+)
Sexual Behavior - Average number of female vaginal sex partners in lifetime (males 18+)
Sexual Behavior - Average age people first performed oral sex on a woman (18+)
Sexual Behavior - Average number of woman performed oral sex on in lifetime (18+)
Sexual Behavior - Average number of male sex partners in lifetime (males 18+)
Sexual Behavior - Average number of male anal sex partners in lifetime (males 18+)
Sexual Behavior - Average age people first performed oral sex on a man (18+)
Sexual Behavior - Average number of male oral sex partners in lifetime (18+)
Sexual Behavior - People using protection when performing oral sex (%)
Sexual Behavior - Average number of times people have vaginal or anal sex a year
Sexual Behavior - People having sex without condom (%)
Sexual Behavior - Average number of male sex partners in lifetime (females 18+)
Sexual Behavior - Average number of male vaginal sex partners in lifetime (females 18+)
Sexual Behavior - Average number of female sex partners in lifetime (females 18+)
Sexual Behavior - Circumcised males 18+ (%)
Sleep Disorders - Average hours sleeping at night
Sleep Disorders - People that has trouble sleeping (%)
Smoking-Cigarette Use - People smoking cigarettes (%)
Taste & Smell - People 40+ having problems with smell (%)
Taste & Smell - People 40+ having problems with taste (%)
Taste & Smell - People 40+ that ever had wisdom teeth removed (%)
Taste & Smell - People 40+ that ever had tonsils teeth removed (%)
Taste & Smell - People 40+ that ever had a loss of consciousness because of a head injury (%)
Taste & Smell - People 40+ that ever had a broken nose or other serious injury to face or skull (%)
Taste & Smell - People 40+ that ever had two or more sinus infections (%)
Weight - Average height (inches)
Weight - Average weight (pounds)
Weight - Average BMI
Weight - People that are obese (%)
Weight - People that ever were obese (%)
Weight - People trying to lose weight (%)
According to our research of Iowa and other state lists, there were 5 registered sex offenders living in Grimes, Iowa as of June 16, 2024 . The ratio of all residents to sex offenders in Grimes is 2,152 to 1.The ratio of registered sex offenders to all residents in this city is much lower than the state average.
Latest news from Grimes, IA collected exclusively by city-data.com from local newspapers, TV, and radio stations
Ancestries: German (31.2%), Irish (13.1%), Yugoslavian (8.6%), English (8.4%), American (4.9%), Italian (2.5%).
Current Local Time:
Incorporated on 05/7/1894
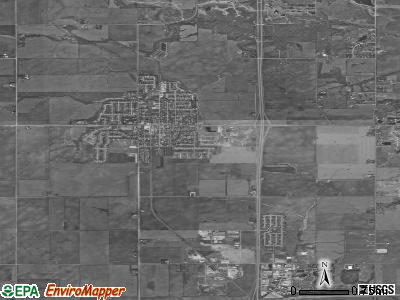
Land area: 8.95 square miles.
Population density: 1,820 people per square mile (low).
891 residents are foreign born (2.8% Europe , 2.4% Asia ).
Median real estate property taxes paid for housing units with mortgages in 2022: $5,273 (1.7%)Median real estate property taxes paid for housing units with no mortgage in 2022: $4,066 (1.7%)
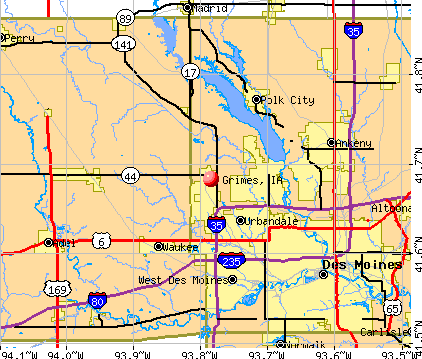
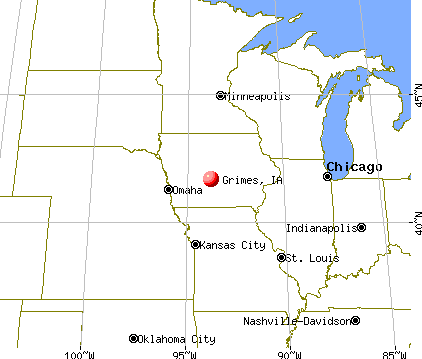
Nearest city with pop. 50,000+: Des Moines, IA
Nearest city with pop. 200,000+: Omaha, NE
Nearest city with pop. 1,000,000+: Chicago, IL
Nearest cities:
Latitude: 41.68 N, Longitude: 93.78 W
Daytime population change due to commuting: -264 (-1.7%)Workers who live and work in this city: 2,821 (33.3%)
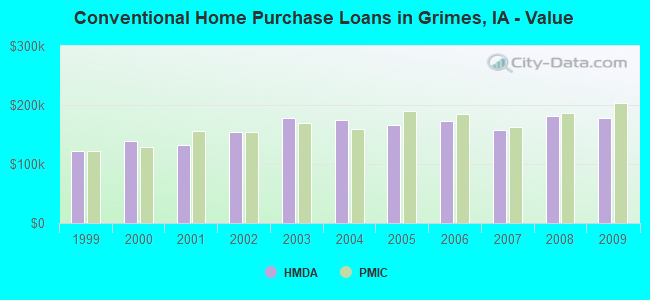
Property values in Grimes, IA
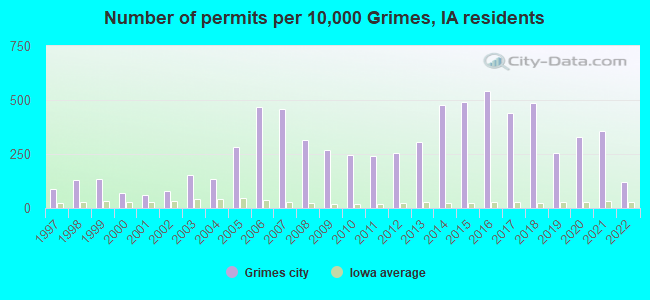
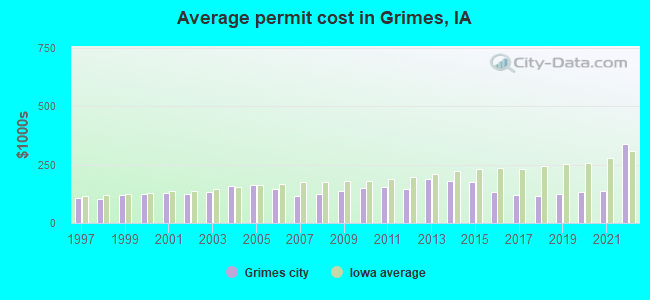
Single-family new house construction building permits:
2022: 62 buildings , average cost: $337,6002021: 181 buildings , average cost: $134,7002020: 168 buildings , average cost: $132,3002019: 129 buildings , average cost: $124,7002018: 249 buildings , average cost: $116,7002017: 224 buildings , average cost: $120,0002016: 277 buildings , average cost: $132,8002015: 251 buildings , average cost: $175,9002014: 243 buildings , average cost: $179,1002013: 155 buildings , average cost: $188,4002012: 129 buildings , average cost: $144,2002011: 124 buildings , average cost: $155,4002010: 126 buildings , average cost: $147,8002009: 136 buildings , average cost: $138,9002008: 161 buildings , average cost: $123,5002007: 233 buildings , average cost: $115,3002006: 239 buildings , average cost: $144,7002005: 144 buildings , average cost: $161,8002004: 68 buildings , average cost: $159,7002003: 78 buildings , average cost: $131,5002002: 41 buildings , average cost: $123,7002001: 30 buildings , average cost: $128,4002000: 36 buildings , average cost: $126,3001999: 69 buildings , average cost: $118,9001998: 66 buildings , average cost: $104,2001997: 45 buildings , average cost: $107,800Unemployment in December 2023:
Population change in the 1990s: +2,411 (+89.7%).
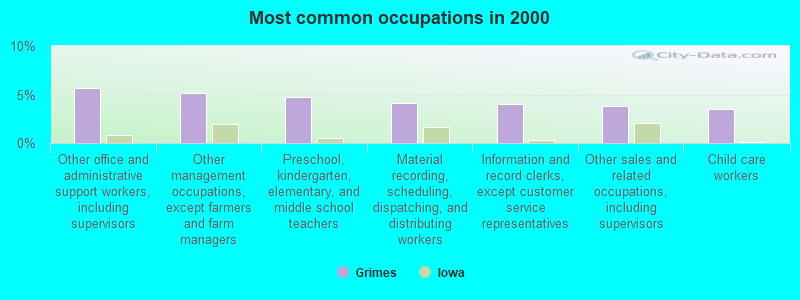
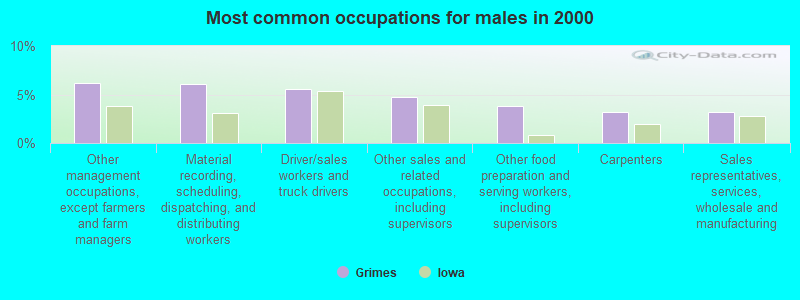
Most common occupations in Grimes, IA (%)
Both Males Females
Other office and administrative support workers, including supervisors (5.6%)
Other management occupations, except farmers and farm managers (5.1%)
Preschool, kindergarten, elementary, and middle school teachers (4.8%)
Material recording, scheduling, dispatching, and distributing workers (4.1%)
Information and record clerks, except customer service representatives (4.0%)
Other sales and related occupations, including supervisors (3.8%)
Child care workers (3.5%)
Other management occupations, except farmers and farm managers (6.2%)
Material recording, scheduling, dispatching, and distributing workers (6.1%)
Driver/sales workers and truck drivers (5.6%)
Other sales and related occupations, including supervisors (4.7%)
Other food preparation and serving workers, including supervisors (3.8%)
Carpenters (3.2%)
Sales representatives, services, wholesale and manufacturing (3.2%)
Other office and administrative support workers, including supervisors (9.8%)
Preschool, kindergarten, elementary, and middle school teachers (8.5%)
Child care workers (7.1%)
Information and record clerks, except customer service representatives (5.8%)
Media and communications workers (4.6%)
Computer specialists (4.5%)
Health technologists and technicians (4.2%)
Tornado activity:
Grimes-area historical tornado activity is slightly above Iowa state average. It is 110% greater than the overall U.S. average.
On 6/13/1976, a category F5 (max. wind speeds 261-318 mph) tornado 17.6 miles away from the Grimes city center injured 9 people and caused between $5,000,000 and $50,000,000 in damages.
On 4/8/1999, a category F4 (max. wind speeds 207-260 mph) tornado 7.5 miles away from the city center injured one person and caused $2 million in damages.
Earthquake activity:
Grimes-area historical earthquake activity is significantly above Iowa state average. It is 217% greater than the overall U.S. average. On 9/3/2016 at 12:02:44, a magnitude 5.8 (5.8 MW, Depth: 3.5 mi, Class: Moderate, Intensity: VI - VII) earthquake occurred 400.9 miles away from the city center On 4/18/2008 at 09:36:59, a magnitude 5.4 (5.1 MB, 4.8 MS, 5.4 MW, 5.2 MW) earthquake occurred 383.8 miles away from Grimes center On 11/6/2011 at 03:53:10, a magnitude 5.7 (5.7 MW, Depth: 3.2 mi) earthquake occurred 454.8 miles away from the city center On 4/18/2008 at 09:36:59, a magnitude 5.2 (5.2 MW, Depth: 8.9 mi) earthquake occurred 383.8 miles away from the city center On 6/10/1987 at 23:48:54, a magnitude 5.1 (4.9 MB, 4.4 MS, 4.6 MS, 5.1 LG) earthquake occurred 368.9 miles away from the city center On 7/9/1975 at 14:54:15, a magnitude 4.6 (4.6 MB, Class: Light, Intensity: IV - V) earthquake occurred 297.9 miles away from the city center Magnitude types: regional Lg-wave magnitude (LG), body-wave magnitude (MB), surface-wave magnitude (MS), moment magnitude (MW) Natural disasters: The number of natural disasters in Polk County (17) is near the US average (15).Major Disasters (Presidential) Declared: 13Emergencies Declared: 1Floods: 12, Storms: 10, Tornadoes: 5, Heavy Rain: 1, Hurricane: 1, Snow: 1, Wind: 1, Winter Storm: 1, Other: 1 (Note: some incidents may be assigned to more than one category). Hospitals and medical centers in Grimes: KENNYBROOK VILLAGE (200 SW BROOKSIDE DRIVE)
Other hospitals and medical centers near Grimes: IOWA HEALTH HOME CARE (Home Health Center, about 4 miles away; URBANDALE, IA)
URBANDALE HEALTH CARE CENTER (Nursing Home, about 4 miles away; URBANDALE, IA)
BISHOP DRUMM CARE CENTER (Nursing Home, about 5 miles away; JOHNSTON, IA)
SOUTHERN CARE (Hospital, about 5 miles away; URBANDALE, IA)
CHILDSERVE HABILITATION CENTER (Nursing Home, about 5 miles away; JOHNSTON, IA)
IOWA HOSPICE, L L C (Hospital, about 5 miles away; JOHNSTON, IA)
DEERFIELD RETIREMENT COMMUNITY INC (Nursing Home, about 5 miles away; URBANDALE, IA)
Airports located in Grimes: Colleges/universities with over 2000 students nearest to Grimes:
Drake University (about 9 miles; Des Moines, IA ; Full-time enrollment: 3,768)
Des Moines Area Community College (about 10 miles; Ankeny, IA ; FT enrollment: 15,337)
Iowa State University (about 25 miles; Ames, IA ; FT enrollment: 28,662)
Iowa Central Community College (about 60 miles; Fort Dodge, IA ; FT enrollment: 4,682)
Indian Hills Community College (about 85 miles; Ottumwa, IA ; FT enrollment: 4,034)
University of Northern Iowa (about 90 miles; Cedar Falls, IA ; FT enrollment: 10,816)
Hawkeye Community College (about 91 miles; Waterloo, IA ; FT enrollment: 7,160)
Public high schools in Grimes:
Public elementary/middle schools in Grimes: SOUTH PRAIRIE ELEMENTARY Location: 500 S JAMES ST, Grades: KG-2)
NORTH RIDGE ELEMENTARY Location: 400 NW 27TH ST, Grades: PK-4)
See full list of schools located in Grimes Library in Grimes: GRIMES PUBLIC LIBRARY Operating income: $303,625; Location: 200 N JAMES ST; 30,563 books ; 2,604 audio materials ; 2,197 video materials ; 7 local licensed databases ; 13 state licensed databases ; 1 other licensed databases ; 82 print serial subscriptions ; 3 electronic serial subscriptions )
Notable locations in Grimes: (A) , Grimes (B) , Grimes Waste Treatment Plant (C) , Grimes Fire and Rescue Department (D) , Grimes City Hall (E) , Grimes Public Library (F) . Display/hide their locations on the map
Churches in Grimes include: (A) , Saint Peter Lutheran Church (B) . Display/hide their locations on the map
Cemetery: (1) . Display/hide its location on the map
Parks in Grimes include: (1) , Grimes City Park (2) , Lions Park (3) . Display/hide their locations on the map
Hotels:
Polk County has a predicted average indoor radon screening level greater than 4 pCi/L (pico curies per liter) - Highest Potential Drinking water stations with addresses in Grimes and their reported violations in the past:
GRIMES WATER SUPPLY (Address: 1801 N JAMES ST Population served: 8,246, Groundwater):
Past health violations:
MCL, Monthly (TCR) - In AUG-2011, Contaminant: Coliform. Follow-up actions: St Violation/Reminder Notice (AUG-05-2011), St Public Notif received (2 times from AUG-11-2011 to AUG-11-2011), St Compliance achieved (SEP-13-2011)
MCL, Acute (TCR) - In AUG-2011, Contaminant: Coliform. Follow-up actions: St Formal NOV issued (AUG-08-2011), St Public Notif requested (AUG-08-2011), St Public Notif received (2 times from AUG-11-2011 to AUG-11-2011), St Compliance achieved (SEP-13-2011)
Average household size: This city:
2.6 peopleIowa:
2.4 people
Percentage of family households: This city:
71.3%Whole state:
64.7%
Percentage of households with unmarried partners: This city:
6.6%Whole state:
6.7%
Likely homosexual households (counted as self-reported same-sex unmarried-partner households)
Lesbian couples: 0.4% of all households Gay men: 0.3% of all households
Banks with branches in Grimes (2011 data):
Bankers Trust Company: Grimes Branch at 110 South Main Street, branch established on 1917/06/01; Mobile Grimes Branch at 110 South Main, branch established on 2000/02/17. Info updated 2010/01/13: Bank assets: $2,686.8 mil, Deposits: $1,857.5 mil, headquarters in Des Moines, IA, positive income , Commercial Lending Specialization, 21 total offices , Holding Company: Btc Financial Corporation
City State Bank: Grimes Branch at 100 North Jacob, branch established on 1934/05/25; Kennybrook Village Branch at 200 Sw Brookside Drive, branch established on 2011/11/30. Info updated 2006/11/03: Bank assets: $236.0 mil, Deposits: $196.7 mil, headquarters in Norwalk, IA, positive income , Commercial Lending Specialization, 8 total offices , Holding Company: Albrecht Financial Services, Inc.
AMES COMMUNITY BANK: Grimes Branch at 925 Se Gateway Dr., branch established on 2006/10/13. Info updated 2010/06/07: Bank assets: $431.7 mil, Deposits: $366.0 mil, headquarters in Ames, IA, positive income , Commercial Lending Specialization, 8 total offices , Holding Company: Ogden Bancshares, Inc.
Charter Bank: Grimes Branch at 150 Gateway Drive, branch established on 2000/09/22. Info updated 2011/07/21: Bank assets: $125.6 mil, Deposits: $113.0 mil, headquarters in Johnston, IA, positive income , Commercial Lending Specialization, 3 total offices
For population 15 years and over in Grimes:
Never married: 26.2%Now married: 58.9%Separated: 0.3%Widowed: 3.0%Divorced: 11.5% For population 25 years and over in Grimes:
High school or higher: 98.4%Bachelor's degree or higher: 43.6%Graduate or professional degree: 15.4%Unemployed: 1.6%Mean travel time to work (commute): 14.5 minutes
Education Gini index (Inequality in education) Here:
9.8Iowa average:
10.5
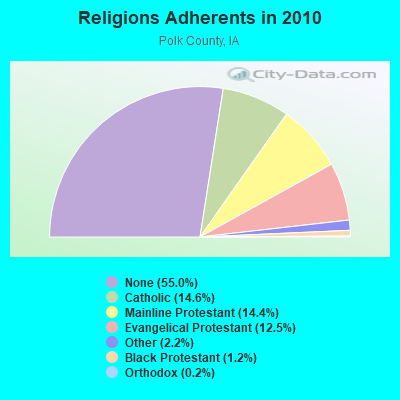
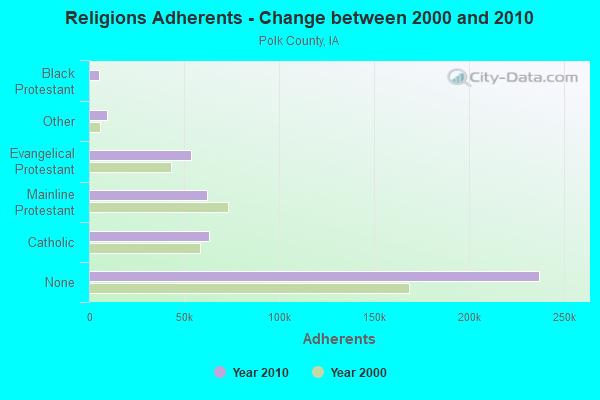
Religion statistics for Grimes, IA (based on Polk County data)
Religion Adherents Congregations Catholic 62,867 19 Mainline Protestant 61,821 117 Evangelical Protestant 53,822 208 Other 9,331 35 Black Protestant 5,275 19 Orthodox 646 4 None 236,878 -
Source: Clifford Grammich, Kirk Hadaway, Richard Houseal, Dale E.Jones, Alexei Krindatch, Richie Stanley and Richard H.Taylor. 2012. 2010 U.S.Religion Census: Religious Congregations & Membership Study. Association of Statisticians of American Religious Bodies. Jones, Dale E., et al. 2002. Congregations and Membership in the United States 2000. Nashville, TN: Glenmary Research Center. Graphs represent county-level data
Food Environment Statistics: Number of grocery stores : 63This county :
1.51 / 10,000 pop.Iowa :
2.14 / 10,000 pop.
Number of supercenters and club stores : 7Polk County :
0.17 / 10,000 pop.Iowa :
0.23 / 10,000 pop.
Number of convenience stores (no gas) : 8This county :
0.19 / 10,000 pop.State :
0.43 / 10,000 pop.
Number of convenience stores (with gas) : 158Polk County :
3.78 / 10,000 pop.State :
5.55 / 10,000 pop.
Number of full-service restaurants : 316This county :
7.57 / 10,000 pop.Iowa :
8.01 / 10,000 pop.
Adult diabetes rate : This county :
7.3%Iowa :
7.8%
Low-income preschool obesity rate : Health and Nutrition:
Average overall health of teeth and gums : People feeling badly about themselves : People not drinking alcohol at all : This city:
8.5%State:
10.4%
Average hours sleeping at night : Overweight people : This city:
32.3%State:
33.8%
General health condition : Average condition of hearing : More about Health and Nutrition of Grimes, IA Residents
Local government employment and payroll (March 2022)
Function
Full-time employees
Monthly full-time payroll
Average yearly full-time wage
Part-time employees
Monthly part-time payroll
Other Government Administration
17 $83,258 $58,770 0 $0 Firefighters
13 $89,778 $82,872 5 $10,735 Streets and Highways
13 $72,237 $66,680 1 $3,851 Financial Administration
7 $45,214 $77,510 0 $0 Local Libraries
5 $30,128 $72,307 14 $7,019 Other and Unallocable
5 $36,618 $87,883 0 $0 Parks and Recreation
4 $24,089 $72,267 6 $3,065 Sewerage
2 $9,189 $55,134 0 $0 Water Supply
2 $9,530 $57,180 0 $0 Fire - Other
0 $0 2 $1,176
Totals for Government
68 $400,040 $70,595 28 $25,845
Grimes government finances - Expenditure in 2021 (per resident):
Current Operations - General - Other: $2,348,000 ($144.09)
Sewerage: $2,228,000 ($136.73)Regular Highways: $2,010,000 ($123.35)Water Utilities: $1,961,000 ($120.34)Health - Other: $1,485,000 ($91.13)Protective Inspection and Regulation - Other: $1,479,000 ($90.76)Police Protection: $1,373,000 ($84.26)Parks and Recreation: $1,128,000 ($69.22)Libraries: $704,000 ($43.20)Local Fire Protection: $623,000 ($38.23)Solid Waste Management: $574,000 ($35.23)General Public Buildings: $541,000 ($33.20)Financial Administration: $521,000 ($31.97)Central Staff Services: $245,000 ($15.04)Judicial and Legal Services: $183,000 ($11.23)Miscellaneous Commercial Activities - Other: $1,000 ($0.06)General - Interest on Debt: $2,219,000 ($136.18)
Intergovernmental to Local - Other - Police Protection: $1,260,000 ($77.32)
Other - General - Other: $274,000 ($16.81)Total Salaries and Wages: $4,406,000 ($270.39)
Water Utilities - Interest on Debt: $872,000 ($53.51)
Grimes government finances - Revenue in 2021 (per resident):
Charges - Sewerage: $4,001,000 ($245.54)
Solid Waste Management: $540,000 ($33.14)Other: $350,000 ($21.48)Parks and Recreation: $127,000 ($7.79)Federal Intergovernmental - Other: $434,000 ($26.63)
Local Intergovernmental - Other: $94,000 ($5.77)
Miscellaneous - General Revenue - Other: $2,277,000 ($139.74)
Interest Earnings: $222,000 ($13.62)Rents: $83,000 ($5.09)Sale of Property: $36,000 ($2.21)Fines and Forfeits: $17,000 ($1.04)Special Assessments: $13,000 ($0.80)Revenue - Water Utilities: $5,426,000 ($332.99)
State Intergovernmental - Highways: $1,710,000 ($104.94)
General Local Government Support: $380,000 ($23.32)Other: $16,000 ($0.98)Tax - Property: $14,770,000 ($906.41)
General Sales and Gross Receipts: $1,401,000 ($85.98)Other License: $850,000 ($52.16)Public Utilities Sales: $230,000 ($14.11)Other Selective Sales: $57,000 ($3.50)
Grimes government finances - Debt in 2021 (per resident):
Long Term Debt - Outstanding Unspecified Public Purpose: $84,111,000 ($5161.77)
Beginning Outstanding - Unspecified Public Purpose: $77,282,000 ($4742.68)Issue, Unspecified Public Purpose: $16,230,000 ($996.01)Retired Unspecified Public Purpose: $9,401,000 ($576.93)
Grimes government finances - Cash and Securities in 2021 (per resident):
Bond Funds - Cash and Securities: $24,282,000 ($1490.15)
Other Funds - Cash and Securities: $31,984,000 ($1962.81)
Sinking Funds - Cash and Securities: $734,000 ($45.04)
Businesses in Grimes, IA
Name Count Name Count
AmericInn 1 Quiznos 1 Curves 1 Subway 1 FedEx 1 True Value 1 McDonald's 1 UPS 1 Nike 1 Walmart 1
Strongest AM radio stations in Grimes:
WHO (1040 AM; 50 kW; DES MOINES, IA; Owner: CITICASTERS LICENSES, L.P.)
KBGG (1700 AM; 10 kW; DES MOINES, IA; Owner: CITADEL BROADCASTING COMPANY)
KXNO (1460 AM; 5 kW; DES MOINES, IA; Owner: CAPSTAR TX LIMITED PARTNERSHIP)
KRNT (1350 AM; 5 kW; DES MOINES, IA; Owner: SAGA COMMUNICATIONS OF IOWA, LLC)
KPSZ (940 AM; 10 kW; DES MOINES, IA; Owner: SAGA COMMUNICATIONS OF IOWA, LLC)
WOI (640 AM; 5 kW; AMES, IA; Owner: IOWA STATE UNIV., OF SCIENCE & TECH.)
KFGQ (1260 AM; 5 kW; BOONE, IA; Owner: BOONE BIBLICAL MINISTRIES, INC.)
KXEL (1540 AM; 50 kW; WATERLOO, IA; Owner: KXEL BROADCASTING COMPANY, INC.)
KOIL (1020 AM; 50 kW; PLATTSMOUTH, NE; Owner: WAITT RADIO, INC.)
KWKY (1150 AM; 1 kW; DES MOINES, IA; Owner: PUTBRESE COMMUNICATIONS, LTD.)
KFAB (1110 AM; 50 kW; OMAHA, NE; Owner: CAPSTAR TX LIMITED PARTNERSHIP)
KKAR (1290 AM; 50 kW; OMAHA, NE; Owner: WAITT RADIO, INC.)
KWMT (540 AM; 5 kW; FORT DODGE, IA; Owner: CLEAR CHANNEL BROADCASTING LICENSES, INC.)
Strongest FM radio stations in Grimes:
KJJY (92.5 FM; WEST DES MOINES, IA; Owner: CITADEL BROADCASTING COMPANY)
KHKI (97.3 FM; DES MOINES, IA; Owner: CITADEL BROADCASTING COMPANY)
KMXD (100.3 FM; DES MOINES, IA; Owner: CITICASTERS LICENSES, L.P.)
WOI-FM (90.1 FM; AMES, IA; Owner: IOWA STATE UNIVERSITY OF SCI & TECH)
KSTZ (102.5 FM; DES MOINES, IA; Owner: SAGA COMMUNICATIONS OF IOWA, LLC)
KIOA (93.3 FM; DES MOINES, IA; Owner: SAGA COMMUNICATIONS OF IOWA, LLC)
KLTI-FM (104.1 FM; AMES, IA; Owner: SAGA COMMUNICATIONS OF IOWA, LLC)
KGGO (94.9 FM; DES MOINES, IA; Owner: CITADEL BROADCASTING COMPANY)
KRKQ (98.3 FM; BOONE, IA; Owner: CITADEL BROADCASTING COMPANY)
KAZR (103.3 FM; PELLA, IA; Owner: SAGA COMMUNICATIONS OF IOWA, LLC)
KVJZ (106.3 FM; ANKENY, IA; Owner: CITICASTERS LICENSES, L.P.)
KJMC (89.3 FM; DES MOINES, IA; Owner: MINORITY COMMUNICATIONS, INC.)
K269EJ (101.7 FM; DES MOINES, IA; Owner: UNIVERSITY OF NORTHERN IOWA)
KWDM (88.7 FM; WEST DES MOINES, IA; Owner: W. DES MOINES COMM. SCHOOL DISTRICT)
KDFR (91.3 FM; DES MOINES, IA; Owner: FAMILY STATIONS, INC.)
KKDM (107.5 FM; DES MOINES, IA; Owner: CLEAR CHANNEL BROADCASTING LICENSES, INC.)
KLRX (96.1 FM; MADRID, IA; Owner: THOMAS H. BURKE, RECEIVER FOR LIFESTYLE COMMUNICATIONS CORP.)
KDLS-FM (105.5 FM; PERRY, IA; Owner: PERRY BROADCASTING COMPANY)
KZZQ (99.5 FM; WINTERSET, IA; Owner: POSITIVE IMPACT MEDIA, INC.)
KKRF (107.9 FM; STUART, IA; Owner: COON VALLEY COMMUNICATIONS, INC.)
TV broadcast stations around Grimes:
K41DD (Channel 41; DES MOINES, IA; Owner: VENTANA TELEVISION, INC.)
WOI-TV (Channel 5; AMES, IA; Owner: CAPITAL COMMUNICATIONS COMPANY, INC.)
KDIN-TV (Channel 11; DES MOINES, IA; Owner: IOWA PUBLIC BROADCASTING BOARD)
KPWB-TV (Channel 23; AMES, IA; Owner: PAPPAS TELECASTING OF IOWA, L.L.C.)
KDSM-TV (Channel 17; DES MOINES, IA; Owner: KDSM LICENSEE, LLC)
KCCI (Channel 8; DES MOINES, IA; Owner: DES MOINES HEARST-ARGYLE TV, INC.)
WHO-TV (Channel 13; DES MOINES, IA; Owner: NEW YORK TIMES MANAGEMENT SERVICES)
WBXF-CA (Channel 4; DES MOINES, IA; Owner: THE BOX WORLDWIDE LLC)
KRPG-LP (Channel 43; DES MOINES, IA; Owner: TIGER EYE BROADCASTING CORPORATION)
K29EA (Channel 29; DES MOINES, IA; Owner: TV-45, INC.)
K46EY (Channel 46; DES MOINES, IA; Owner: TV-45, INC.)
K56GD (Channel 56; AMES, IA; Owner: TV-45, INC.)
K48FZ (Channel 48; AMES, IA; Owner: TV-52, INC.)
National Bridge Inventory (NBI) Statistics 17 Number of bridges226ft / 69.4m Total length103,521 Total average daily traffic5,195 Total average daily truck traffic
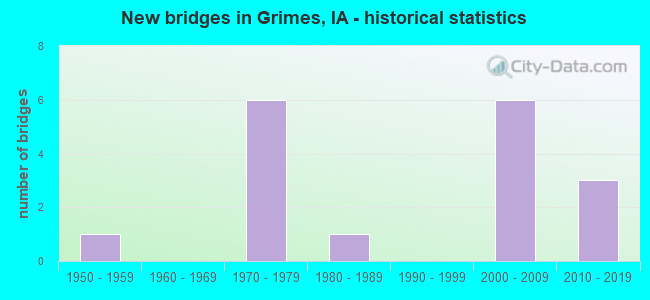
New bridges - historical statistics
1 1950-1959 6 1970-1979 1 1980-1989 6 2000-2009 3 2010-2019
See full National Bridge Inventory statistics for Grimes, IA
Home Mortgage Disclosure Act Aggregated Statistics For Year 2009(Based on 1 partial tract) A) FHA, FSA/RHS & VA B) Conventional C) Refinancings D) Home Improvement Loans F) Non-occupant Loans on G) Loans On Manufactured Number Average Value Number Average Value Number Average Value Number Average Value Number Average Value Number Average Value
LOANS ORIGINATED 79 $155,525 104 $177,330 364 $194,031 13 $67,442 10 $169,104 2 $23,630 APPLICATIONS APPROVED, NOT ACCEPTED 4 $180,270 5 $212,898 27 $198,717 1 $129,650 0 $0 1 $34,690 APPLICATIONS DENIED 5 $173,094 8 $132,356 49 $206,172 5 $41,278 0 $0 2 $29,050 APPLICATIONS WITHDRAWN 6 $166,937 9 $156,867 52 $182,204 1 $13,440 0 $0 0 $0 FILES CLOSED FOR INCOMPLETENESS 0 $0 1 $581,020 8 $190,512 0 $0 0 $0 0 $0
Aggregated Statistics For Year 2008(Based on 1 partial tract) A) FHA, FSA/RHS & VA B) Conventional C) Refinancings D) Home Improvement Loans E) Loans on Dwellings For 5+ Families F) Non-occupant Loans on G) Loans On Manufactured Number Average Value Number Average Value Number Average Value Number Average Value Number Average Value Number Average Value Number Average Value
LOANS ORIGINATED 45 $163,284 148 $180,518 124 $189,945 10 $89,278 1 $96,260 10 $194,296 5 $26,536 APPLICATIONS APPROVED, NOT ACCEPTED 3 $170,117 14 $163,931 22 $226,260 3 $37,290 0 $0 1 $98,430 2 $31,000 APPLICATIONS DENIED 3 $142,077 16 $121,571 49 $182,970 7 $44,166 0 $0 2 $71,545 5 $45,442 APPLICATIONS WITHDRAWN 5 $186,014 12 $154,470 23 $207,336 3 $126,900 0 $0 0 $0 0 $0 FILES CLOSED FOR INCOMPLETENESS 0 $0 6 $176,982 7 $188,801 1 $130,950 0 $0 1 $142,650 0 $0
Aggregated Statistics For Year 2007(Based on 1 partial tract) A) FHA, FSA/RHS & VA B) Conventional C) Refinancings D) Home Improvement Loans E) Loans on Dwellings For 5+ Families F) Non-occupant Loans on G) Loans On Manufactured Number Average Value Number Average Value Number Average Value Number Average Value Number Average Value Number Average Value Number Average Value
LOANS ORIGINATED 6 $152,772 282 $157,146 128 $157,082 25 $56,628 1 $402,810 16 $156,936 8 $30,569 APPLICATIONS APPROVED, NOT ACCEPTED 0 $0 28 $153,247 29 $169,149 3 $47,263 0 $0 0 $0 0 $0 APPLICATIONS DENIED 0 $0 24 $145,997 59 $163,328 10 $38,027 0 $0 3 $246,140 5 $34,342 APPLICATIONS WITHDRAWN 2 $94,960 19 $167,940 23 $186,542 1 $92,790 0 $0 1 $111,870 0 $0 FILES CLOSED FOR INCOMPLETENESS 0 $0 10 $189,136 9 $194,204 0 $0 0 $0 1 $240,210 0 $0
Aggregated Statistics For Year 2006(Based on 1 partial tract) A) FHA, FSA/RHS & VA B) Conventional C) Refinancings D) Home Improvement Loans F) Non-occupant Loans on G) Loans On Manufactured Number Average Value Number Average Value Number Average Value Number Average Value Number Average Value Number Average Value
LOANS ORIGINATED 6 $156,313 268 $173,147 108 $139,523 18 $53,044 13 $160,398 10 $28,141 APPLICATIONS APPROVED, NOT ACCEPTED 0 $0 24 $160,739 19 $171,865 4 $21,355 0 $0 3 $40,903 APPLICATIONS DENIED 0 $0 31 $115,016 44 $132,494 9 $49,574 3 $151,037 11 $28,499 APPLICATIONS WITHDRAWN 0 $0 13 $175,808 26 $134,433 3 $40,613 0 $0 0 $0 FILES CLOSED FOR INCOMPLETENESS 0 $0 8 $154,254 18 $150,893 0 $0 0 $0 0 $0
Aggregated Statistics For Year 2005(Based on 1 partial tract) A) FHA, FSA/RHS & VA B) Conventional C) Refinancings D) Home Improvement Loans E) Loans on Dwellings For 5+ Families F) Non-occupant Loans on G) Loans On Manufactured Number Average Value Number Average Value Number Average Value Number Average Value Number Average Value Number Average Value Number Average Value
LOANS ORIGINATED 9 $158,553 235 $166,705 120 $146,799 18 $50,563 1 $867,200 8 $108,454 8 $34,905 APPLICATIONS APPROVED, NOT ACCEPTED 0 $0 19 $172,504 18 $143,546 3 $38,300 0 $0 1 $99,290 5 $31,826 APPLICATIONS DENIED 0 $0 26 $107,883 46 $138,771 10 $34,081 0 $0 4 $90,405 12 $38,952 APPLICATIONS WITHDRAWN 0 $0 21 $133,487 29 $143,626 2 $46,180 0 $0 3 $131,813 1 $13,440 FILES CLOSED FOR INCOMPLETENESS 0 $0 13 $161,366 17 $164,181 1 $88,890 0 $0 0 $0 0 $0
Aggregated Statistics For Year 2004(Based on 1 partial tract) A) FHA, FSA/RHS & VA B) Conventional C) Refinancings D) Home Improvement Loans F) Non-occupant Loans on G) Loans On Manufactured Number Average Value Number Average Value Number Average Value Number Average Value Number Average Value Number Average Value
LOANS ORIGINATED 10 $128,606 243 $174,557 133 $155,049 13 $61,305 7 $98,984 5 $33,128 APPLICATIONS APPROVED, NOT ACCEPTED 0 $0 20 $183,282 15 $132,248 2 $24,715 0 $0 3 $30,063 APPLICATIONS DENIED 1 $78,480 19 $99,796 26 $161,516 7 $28,431 0 $0 8 $46,341 APPLICATIONS WITHDRAWN 0 $0 15 $101,376 21 $139,041 2 $116,420 1 $117,510 1 $27,320 FILES CLOSED FOR INCOMPLETENESS 0 $0 6 $178,643 13 $128,412 2 $47,045 0 $0 0 $0
Aggregated Statistics For Year 2003(Based on 1 partial tract) A) FHA, FSA/RHS & VA B) Conventional C) Refinancings D) Home Improvement Loans F) Non-occupant Loans on Number Average Value Number Average Value Number Average Value Number Average Value Number Average Value
LOANS ORIGINATED 13 $135,216 216 $178,336 291 $161,807 16 $19,295 3 $92,357 APPLICATIONS APPROVED, NOT ACCEPTED 1 $122,710 22 $139,166 26 $127,745 1 $24,720 0 $0 APPLICATIONS DENIED 1 $104,060 15 $100,219 41 $133,485 5 $19,772 0 $0 APPLICATIONS WITHDRAWN 1 $176,040 11 $162,127 33 $137,662 0 $0 0 $0 FILES CLOSED FOR INCOMPLETENESS 0 $0 2 $161,515 6 $157,468 0 $0 0 $0
Aggregated Statistics For Year 2002(Based on 1 partial tract) A) FHA, FSA/RHS & VA B) Conventional C) Refinancings D) Home Improvement Loans F) Non-occupant Loans on Number Average Value Number Average Value Number Average Value Number Average Value Number Average Value
LOANS ORIGINATED 16 $121,625 116 $154,848 177 $139,460 13 $38,157 3 $92,933 APPLICATIONS APPROVED, NOT ACCEPTED 1 $146,120 14 $154,206 16 $107,966 3 $22,980 0 $0 APPLICATIONS DENIED 0 $0 18 $100,692 23 $106,533 3 $20,380 1 $42,490 APPLICATIONS WITHDRAWN 2 $125,095 7 $116,453 20 $127,738 0 $0 1 $113,600 FILES CLOSED FOR INCOMPLETENESS 0 $0 3 $105,510 6 $131,670 0 $0 0 $0
Aggregated Statistics For Year 2001(Based on 1 partial tract) A) FHA, FSA/RHS & VA B) Conventional C) Refinancings D) Home Improvement Loans F) Non-occupant Loans on Number Average Value Number Average Value Number Average Value Number Average Value Number Average Value
LOANS ORIGINATED 12 $115,591 82 $132,190 124 $118,618 15 $17,662 6 $92,863 APPLICATIONS APPROVED, NOT ACCEPTED 0 $0 16 $120,514 10 $87,934 2 $15,610 0 $0 APPLICATIONS DENIED 0 $0 21 $52,837 34 $90,355 3 $14,020 1 $26,880 APPLICATIONS WITHDRAWN 0 $0 4 $79,565 17 $98,988 1 $43,360 0 $0 FILES CLOSED FOR INCOMPLETENESS 0 $0 2 $66,340 5 $104,584 0 $0 0 $0
Aggregated Statistics For Year 2000(Based on 1 partial tract) A) FHA, FSA/RHS & VA B) Conventional C) Refinancings D) Home Improvement Loans E) Loans on Dwellings For 5+ Families F) Non-occupant Loans on Number Average Value Number Average Value Number Average Value Number Average Value Number Average Value Number Average Value
LOANS ORIGINATED 11 $112,815 57 $139,269 34 $74,299 16 $19,214 1 $91,920 1 $79,350 APPLICATIONS APPROVED, NOT ACCEPTED 1 $87,590 10 $105,582 13 $45,762 5 $20,726 0 $0 0 $0 APPLICATIONS DENIED 0 $0 22 $63,050 15 $79,927 8 $11,924 0 $0 1 $55,500 APPLICATIONS WITHDRAWN 0 $0 5 $102,590 10 $92,487 1 $7,370 0 $0 0 $0 FILES CLOSED FOR INCOMPLETENESS 0 $0 0 $0 3 $108,833 0 $0 0 $0 0 $0
Aggregated Statistics For Year 1999(Based on 1 partial tract) A) FHA, FSA/RHS & VA B) Conventional C) Refinancings D) Home Improvement Loans F) Non-occupant Loans on Number Average Value Number Average Value Number Average Value Number Average Value Number Average Value
LOANS ORIGINATED 10 $104,046 66 $121,927 37 $79,685 15 $20,019 2 $68,635 APPLICATIONS APPROVED, NOT ACCEPTED 0 $0 9 $96,937 19 $48,346 3 $15,637 0 $0 APPLICATIONS DENIED 1 $118,040 16 $59,405 20 $63,077 4 $7,305 0 $0 APPLICATIONS WITHDRAWN 1 $112,660 1 $91,510 6 $103,173 0 $0 0 $0 FILES CLOSED FOR INCOMPLETENESS 0 $0 1 $127,270 4 $45,468 0 $0 0 $0
Detailed HMDA statistics for the following Tracts:
0113.00
Private Mortgage Insurance Companies Aggregated Statistics For Year 2009(Based on 1 partial tract) A) Conventional B) Refinancings Number Average Value Number Average Value
LOANS ORIGINATED 28 $203,080 30 $202,751 APPLICATIONS APPROVED, NOT ACCEPTED 6 $225,183 6 $203,213 APPLICATIONS DENIED 3 $212,173 4 $273,060 APPLICATIONS WITHDRAWN 0 $0 2 $151,545 FILES CLOSED FOR INCOMPLETENESS 0 $0 0 $0
Aggregated Statistics For Year 2008(Based on 1 partial tract) A) Conventional B) Refinancings C) Non-occupant Loans on Number Average Value Number Average Value Number Average Value
LOANS ORIGINATED 59 $186,382 23 $214,481 2 $112,085 APPLICATIONS APPROVED, NOT ACCEPTED 10 $212,768 3 $160,287 0 $0 APPLICATIONS DENIED 1 $124,010 0 $0 0 $0 APPLICATIONS WITHDRAWN 0 $0 1 $205,090 0 $0 FILES CLOSED FOR INCOMPLETENESS 0 $0 0 $0 0 $0
Aggregated Statistics For Year 2007(Based on 1 partial tract) A) Conventional B) Refinancings C) Non-occupant Loans on Number Average Value Number Average Value Number Average Value
LOANS ORIGINATED 86 $162,232 16 $204,984 4 $230,892 APPLICATIONS APPROVED, NOT ACCEPTED 7 $199,331 3 $271,723 0 $0 APPLICATIONS DENIED 0 $0 0 $0 0 $0 APPLICATIONS WITHDRAWN 2 $208,560 3 $250,187 0 $0 FILES CLOSED FOR INCOMPLETENESS 0 $0 0 $0 0 $0
Aggregated Statistics For Year 2006(Based on 1 partial tract) A) Conventional B) Refinancings C) Non-occupant Loans on Number Average Value Number Average Value Number Average Value
LOANS ORIGINATED 41 $185,528 9 $178,788 3 $148,723 APPLICATIONS APPROVED, NOT ACCEPTED 5 $214,718 6 $161,733 1 $169,970 APPLICATIONS DENIED 0 $0 0 $0 0 $0 APPLICATIONS WITHDRAWN 1 $210,300 2 $193,170 0 $0 FILES CLOSED FOR INCOMPLETENESS 0 $0 0 $0 0 $0
Aggregated Statistics For Year 2005(Based on 1 partial tract) A) Conventional B) Refinancings C) Non-occupant Loans on Number Average Value Number Average Value Number Average Value
LOANS ORIGINATED 44 $189,473 11 $182,940 2 $137,670 APPLICATIONS APPROVED, NOT ACCEPTED 10 $213,765 1 $258,430 0 $0 APPLICATIONS DENIED 0 $0 0 $0 0 $0 APPLICATIONS WITHDRAWN 3 $221,137 1 $130,950 0 $0 FILES CLOSED FOR INCOMPLETENESS 0 $0 0 $0 0 $0
Aggregated Statistics For Year 2004(Based on 1 partial tract) A) Conventional B) Refinancings C) Non-occupant Loans on Number Average Value Number Average Value Number Average Value
LOANS ORIGINATED 48 $159,791 14 $173,997 1 $145,690 APPLICATIONS APPROVED, NOT ACCEPTED 11 $201,821 8 $186,502 0 $0 APPLICATIONS DENIED 1 $124,010 0 $0 0 $0 APPLICATIONS WITHDRAWN 3 $205,670 3 $150,460 0 $0 FILES CLOSED FOR INCOMPLETENESS 1 $143,960 0 $0 0 $0
Aggregated Statistics For Year 2003(Based on 1 partial tract) A) Conventional B) Refinancings Number Average Value Number Average Value
LOANS ORIGINATED 59 $169,376 39 $157,230 APPLICATIONS APPROVED, NOT ACCEPTED 10 $169,668 10 $168,237 APPLICATIONS DENIED 1 $191,650 0 $0 APPLICATIONS WITHDRAWN 3 $179,077 4 $174,632 FILES CLOSED FOR INCOMPLETENESS 0 $0 0 $0
Aggregated Statistics For Year 2002(Based on 1 partial tract) A) Conventional B) Refinancings Number Average Value Number Average Value
LOANS ORIGINATED 38 $154,293 33 $148,331 APPLICATIONS APPROVED, NOT ACCEPTED 4 $166,285 7 $103,197 APPLICATIONS DENIED 0 $0 0 $0 APPLICATIONS WITHDRAWN 3 $91,490 3 $115,050 FILES CLOSED FOR INCOMPLETENESS 0 $0 0 $0
Aggregated Statistics For Year 2001(Based on 1 partial tract) A) Conventional B) Refinancings C) Non-occupant Loans on Number Average Value Number Average Value Number Average Value
LOANS ORIGINATED 39 $156,141 22 $136,347 1 $80,650 APPLICATIONS APPROVED, NOT ACCEPTED 6 $176,620 3 $125,310 0 $0 APPLICATIONS DENIED 0 $0 0 $0 0 $0 APPLICATIONS WITHDRAWN 1 $535,060 0 $0 0 $0 FILES CLOSED FOR INCOMPLETENESS 0 $0 0 $0 0 $0
Aggregated Statistics For Year 2000(Based on 1 partial tract) A) Conventional B) Refinancings Number Average Value Number Average Value
LOANS ORIGINATED 30 $128,620 2 $80,435 APPLICATIONS APPROVED, NOT ACCEPTED 5 $135,804 1 $145,690 APPLICATIONS DENIED 0 $0 0 $0 APPLICATIONS WITHDRAWN 1 $81,950 0 $0 FILES CLOSED FOR INCOMPLETENESS 1 $68,510 0 $0
Aggregated Statistics For Year 1999(Based on 1 partial tract) A) Conventional B) Refinancings Number Average Value Number Average Value
LOANS ORIGINATED 25 $122,317 7 $110,736 APPLICATIONS APPROVED, NOT ACCEPTED 1 $140,730 0 $0 APPLICATIONS DENIED 1 $128,810 0 $0 APPLICATIONS WITHDRAWN 1 $128,420 0 $0 FILES CLOSED FOR INCOMPLETENESS 0 $0 0 $0
Detailed PMIC statistics for the following Tracts:
0113.00
Most common first names in Grimes, IA among deceased individuals Name Count Lived (average)
John 18 74.6 years Mary 12 80.8 years Robert 10 70.2 years James 10 71.7 years William 9 76.7 years Irene 7 84.6 years Richard 7 71.1 years Harold 6 78.8 years Margaret 6 73.5 years Helen 6 84.0 years
Most common last names in Grimes, IA among deceased individuals Last name Count Lived (average)
Seibert 10 79.1 years Smith 8 83.3 years Taylor 7 74.3 years Bauman 7 82.4 years Martin 7 68.5 years Bartelt 6 80.6 years Peitzman 6 78.5 years Brown 5 90.2 years House 5 73.0 years Shafer 5 77.4 years
Grimes compared to Iowa state average:
Median house value above state average. Unemployed percentage significantly below state average. Hispanic race population percentage above state average. Median age significantly below state average. Foreign-born population percentage significantly above state average. Renting percentage below state average. Length of stay since moving in above state average. House age significantly below state average. Number of college students above state average. Percentage of population with a bachelor's degree or higher above state average.
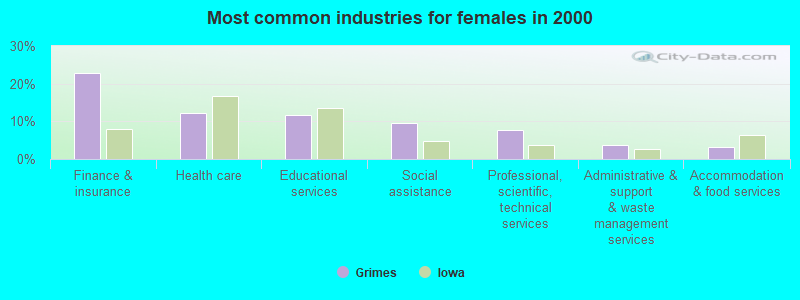
#37 on the list of "Top 101 cities with largest percentage of females in industries: finance and insurance (population 5,000+)"
#40 on the list of "Top 101 cities with largest percentage of females in occupations: architecture and engineering occupations (population 5,000+)"
#55 on the list of "Top 101 cities with largest percentage of males in industries: finance and insurance (population 5,000+)"
#89 on the list of "Top 101 cities with most building permits per 10,000 residents (population 5,000+)"
#23 on the list of "Top 101 counties with the lowest Sulfur Oxides Annual air pollution readings in 2012 (µg/m3 )"
#30 on the list of "Top 101 counties with the lowest percentage of residents relocating from foreign countries between 2010 and 2011"
#46 on the list of "Top 101 counties with the lowest percentage of residents relocating to foreign countries in 2011"
#47 on the list of "Top 101 counties with the highest percentage of residents that visited a dentist within the past year"
#55 on the list of "Top 101 counties with the most Mainline Protestant adherents"
Top Patent Applicants
Marc C. Albertsen (32)
David Kurth (17)
Dwight Tomes (16)
Atul Gupta (6)
Ronald D. Flannagan (6)
Brandon G. Leiran (5)
Kellen O'Connor (5)
Zachary T. Bonefas (5)
Jeremy J. Faust (5)
Marc Albertsen (4)
Total of 158 patent applications in 2008-2024.


 Recent articles from our blog. Our writers, many of them Ph.D. graduates or candidates, create easy-to-read articles on a wide variety of topics.

 (10.6 miles
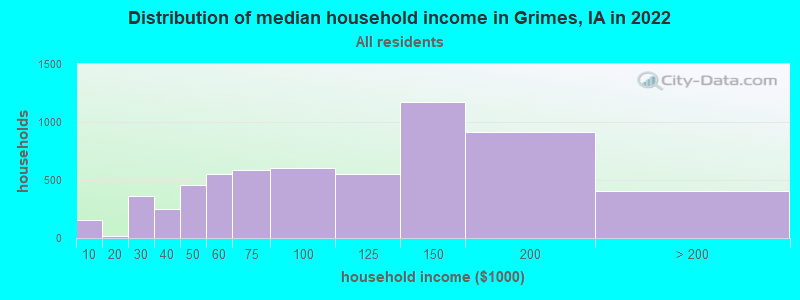


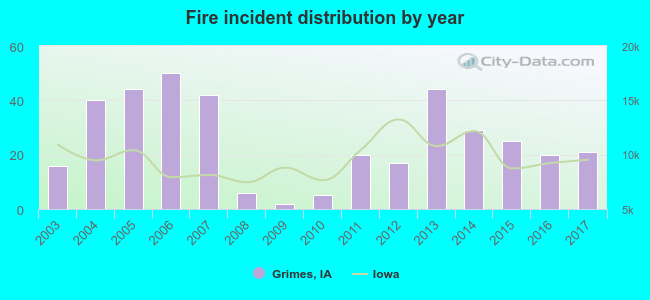 Based on the data from the years 2003 - 2017 the average number of fires per year is 25. The highest number of fires - 50 took place in 2006, and the least - 2 in 2009. The data has an increasing trend.
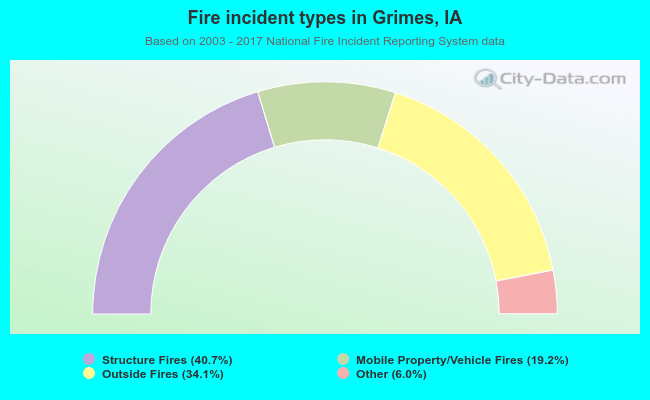 When looking into fire subcategories, the most incidents belonged to: Structure Fires (40.7%), and Outside Fires (34.1%).