Grove City, Ohio Submit your own pictures of this city and show them to the world
OSM Map
General Map
Google Map
MSN Map
OSM Map
General Map
Google Map
MSN Map
OSM Map
General Map
Google Map
MSN Map
OSM Map
General Map
Google Map
MSN Map
Please wait while loading the map...
Population in 2022: 42,233 (100% urban, 0% rural). Population change since 2000: +56.0%Males: 21,234 Females: 20,999
March 2022 cost of living index in Grove City: 95.9 (near average, U.S. average is 100) Percentage of residents living in poverty in 2022: 5.6%for White Non-Hispanic residents , 4.6% for Black residents , 29.3% for Hispanic or Latino residents , 27.8% for other race residents , 2.0% for two or more races residents )
Profiles of local businesses
Business Search - 14 Million verified businesses
Data:
Median household income ($)
Median household income (% change since 2000)
Household income diversity
Ratio of average income to average house value (%)
Ratio of average income to average rent
Median household income ($) - White
Median household income ($) - Black or African American
Median household income ($) - Asian
Median household income ($) - Hispanic or Latino
Median household income ($) - American Indian and Alaska Native
Median household income ($) - Multirace
Median household income ($) - Other Race
Median household income for houses/condos with a mortgage ($)
Median household income for apartments without a mortgage ($)
Races - White alone (%)
Races - White alone (% change since 2000)
Races - Black alone (%)
Races - Black alone (% change since 2000)
Races - American Indian alone (%)
Races - American Indian alone (% change since 2000)
Races - Asian alone (%)
Races - Asian alone (% change since 2000)
Races - Hispanic (%)
Races - Hispanic (% change since 2000)
Races - Native Hawaiian and Other Pacific Islander alone (%)
Races - Native Hawaiian and Other Pacific Islander alone (% change since 2000)
Races - Two or more races (%)
Races - Two or more races (% change since 2000)
Races - Other race alone (%)
Races - Other race alone (% change since 2000)
Racial diversity
Unemployment (%)
Unemployment (% change since 2000)
Unemployment (%) - White
Unemployment (%) - Black or African American
Unemployment (%) - Asian
Unemployment (%) - Hispanic or Latino
Unemployment (%) - American Indian and Alaska Native
Unemployment (%) - Multirace
Unemployment (%) - Other Race
Population density (people per square mile)
Population - Males (%)
Population - Females (%)
Population - Males (%) - White
Population - Males (%) - Black or African American
Population - Males (%) - Asian
Population - Males (%) - Hispanic or Latino
Population - Males (%) - American Indian and Alaska Native
Population - Males (%) - Multirace
Population - Males (%) - Other Race
Population - Females (%) - White
Population - Females (%) - Black or African American
Population - Females (%) - Asian
Population - Females (%) - Hispanic or Latino
Population - Females (%) - American Indian and Alaska Native
Population - Females (%) - Multirace
Population - Females (%) - Other Race
Coronavirus confirmed cases (Jun 15, 2024)
Deaths caused by coronavirus (Jun 15, 2024)
Coronavirus confirmed cases (per 100k population) (Jun 15, 2024)
Deaths caused by coronavirus (per 100k population) (Jun 15, 2024)
Daily increase in number of cases (Jun 15, 2024)
Weekly increase in number of cases (Jun 15, 2024)
Cases doubled (in days) (Jun 15, 2024)
Hospitalized patients (Apr 18, 2022)
Negative test results (Apr 18, 2022)
Total test results (Apr 18, 2022)
COVID Vaccine doses distributed (per 100k population) (Sep 19, 2023)
COVID Vaccine doses administered (per 100k population) (Sep 19, 2023)
COVID Vaccine doses distributed (Sep 19, 2023)
COVID Vaccine doses administered (Sep 19, 2023)
Likely homosexual households (%)
Likely homosexual households (% change since 2000)
Likely homosexual households - Lesbian couples (%)
Likely homosexual households - Lesbian couples (% change since 2000)
Likely homosexual households - Gay men (%)
Likely homosexual households - Gay men (% change since 2000)
Cost of living index
Median gross rent ($)
Median contract rent ($)
Median monthly housing costs ($)
Median house or condo value ($)
Median house or condo value ($ change since 2000)
Mean house or condo value by units in structure - 1, detached ($)
Mean house or condo value by units in structure - 1, attached ($)
Mean house or condo value by units in structure - 2 ($)
Mean house or condo value by units in structure by units in structure - 3 or 4 ($)
Mean house or condo value by units in structure - 5 or more ($)
Mean house or condo value by units in structure - Boat, RV, van, etc. ($)
Mean house or condo value by units in structure - Mobile home ($)
Median house or condo value ($) - White
Median house or condo value ($) - Black or African American
Median house or condo value ($) - Asian
Median house or condo value ($) - Hispanic or Latino
Median house or condo value ($) - American Indian and Alaska Native
Median house or condo value ($) - Multirace
Median house or condo value ($) - Other Race
Median resident age
Resident age diversity
Median resident age - Males
Median resident age - Females
Median resident age - White
Median resident age - Black or African American
Median resident age - Asian
Median resident age - Hispanic or Latino
Median resident age - American Indian and Alaska Native
Median resident age - Multirace
Median resident age - Other Race
Median resident age - Males - White
Median resident age - Males - Black or African American
Median resident age - Males - Asian
Median resident age - Males - Hispanic or Latino
Median resident age - Males - American Indian and Alaska Native
Median resident age - Males - Multirace
Median resident age - Males - Other Race
Median resident age - Females - White
Median resident age - Females - Black or African American
Median resident age - Females - Asian
Median resident age - Females - Hispanic or Latino
Median resident age - Females - American Indian and Alaska Native
Median resident age - Females - Multirace
Median resident age - Females - Other Race
Commute - mean travel time to work (minutes)
Travel time to work - Less than 5 minutes (%)
Travel time to work - Less than 5 minutes (% change since 2000)
Travel time to work - 5 to 9 minutes (%)
Travel time to work - 5 to 9 minutes (% change since 2000)
Travel time to work - 10 to 19 minutes (%)
Travel time to work - 10 to 19 minutes (% change since 2000)
Travel time to work - 20 to 29 minutes (%)
Travel time to work - 20 to 29 minutes (% change since 2000)
Travel time to work - 30 to 39 minutes (%)
Travel time to work - 30 to 39 minutes (% change since 2000)
Travel time to work - 40 to 59 minutes (%)
Travel time to work - 40 to 59 minutes (% change since 2000)
Travel time to work - 60 to 89 minutes (%)
Travel time to work - 60 to 89 minutes (% change since 2000)
Travel time to work - 90 or more minutes (%)
Travel time to work - 90 or more minutes (% change since 2000)
Marital status - Never married (%)
Marital status - Now married (%)
Marital status - Separated (%)
Marital status - Widowed (%)
Marital status - Divorced (%)
Median family income ($)
Median family income (% change since 2000)
Median non-family income ($)
Median non-family income (% change since 2000)
Median per capita income ($)
Median per capita income (% change since 2000)
Median family income ($) - White
Median family income ($) - Black or African American
Median family income ($) - Asian
Median family income ($) - Hispanic or Latino
Median family income ($) - American Indian and Alaska Native
Median family income ($) - Multirace
Median family income ($) - Other Race
Median year house/condo built
Median year apartment built
Year house built - Built 2005 or later (%)
Year house built - Built 2000 to 2004 (%)
Year house built - Built 1990 to 1999 (%)
Year house built - Built 1980 to 1989 (%)
Year house built - Built 1970 to 1979 (%)
Year house built - Built 1960 to 1969 (%)
Year house built - Built 1950 to 1959 (%)
Year house built - Built 1940 to 1949 (%)
Year house built - Built 1939 or earlier (%)
Average household size
Household density (households per square mile)
Average household size - White
Average household size - Black or African American
Average household size - Asian
Average household size - Hispanic or Latino
Average household size - American Indian and Alaska Native
Average household size - Multirace
Average household size - Other Race
Occupied housing units (%)
Vacant housing units (%)
Owner occupied housing units (%)
Renter occupied housing units (%)
Vacancy status - For rent (%)
Vacancy status - For sale only (%)
Vacancy status - Rented or sold, not occupied (%)
Vacancy status - For seasonal, recreational, or occasional use (%)
Vacancy status - For migrant workers (%)
Vacancy status - Other vacant (%)
Residents with income below the poverty level (%)
Residents with income below 50% of the poverty level (%)
Children below poverty level (%)
Poor families by family type - Married-couple family (%)
Poor families by family type - Male, no wife present (%)
Poor families by family type - Female, no husband present (%)
Poverty status for native-born residents (%)
Poverty status for foreign-born residents (%)
Poverty among high school graduates not in families (%)
Poverty among people who did not graduate high school not in families (%)
Residents with income below the poverty level (%) - White
Residents with income below the poverty level (%) - Black or African American
Residents with income below the poverty level (%) - Asian
Residents with income below the poverty level (%) - Hispanic or Latino
Residents with income below the poverty level (%) - American Indian and Alaska Native
Residents with income below the poverty level (%) - Multirace
Residents with income below the poverty level (%) - Other Race
Air pollution - Air Quality Index (AQI)
Air pollution - CO
Air pollution - NO2
Air pollution - SO2
Air pollution - Ozone
Air pollution - PM10
Air pollution - PM25
Air pollution - Pb
Crime - Murders per 100,000 population
Crime - Rapes per 100,000 population
Crime - Robberies per 100,000 population
Crime - Assaults per 100,000 population
Crime - Burglaries per 100,000 population
Crime - Thefts per 100,000 population
Crime - Auto thefts per 100,000 population
Crime - Arson per 100,000 population
Crime - City-data.com crime index
Crime - Violent crime index
Crime - Property crime index
Crime - Murders per 100,000 population (5 year average)
Crime - Rapes per 100,000 population (5 year average)
Crime - Robberies per 100,000 population (5 year average)
Crime - Assaults per 100,000 population (5 year average)
Crime - Burglaries per 100,000 population (5 year average)
Crime - Thefts per 100,000 population (5 year average)
Crime - Auto thefts per 100,000 population (5 year average)
Crime - Arson per 100,000 population (5 year average)
Crime - City-data.com crime index (5 year average)
Crime - Violent crime index (5 year average)
Crime - Property crime index (5 year average)
1996 Presidential Elections Results (%) - Democratic Party (Clinton)
1996 Presidential Elections Results (%) - Republican Party (Dole)
1996 Presidential Elections Results (%) - Other
2000 Presidential Elections Results (%) - Democratic Party (Gore)
2000 Presidential Elections Results (%) - Republican Party (Bush)
2000 Presidential Elections Results (%) - Other
2004 Presidential Elections Results (%) - Democratic Party (Kerry)
2004 Presidential Elections Results (%) - Republican Party (Bush)
2004 Presidential Elections Results (%) - Other
2008 Presidential Elections Results (%) - Democratic Party (Obama)
2008 Presidential Elections Results (%) - Republican Party (McCain)
2008 Presidential Elections Results (%) - Other
2012 Presidential Elections Results (%) - Democratic Party (Obama)
2012 Presidential Elections Results (%) - Republican Party (Romney)
2012 Presidential Elections Results (%) - Other
2016 Presidential Elections Results (%) - Democratic Party (Clinton)
2016 Presidential Elections Results (%) - Republican Party (Trump)
2016 Presidential Elections Results (%) - Other
2020 Presidential Elections Results (%) - Democratic Party (Biden)
2020 Presidential Elections Results (%) - Republican Party (Trump)
2020 Presidential Elections Results (%) - Other
Ancestries Reported - Arab (%)
Ancestries Reported - Czech (%)
Ancestries Reported - Danish (%)
Ancestries Reported - Dutch (%)
Ancestries Reported - English (%)
Ancestries Reported - French (%)
Ancestries Reported - French Canadian (%)
Ancestries Reported - German (%)
Ancestries Reported - Greek (%)
Ancestries Reported - Hungarian (%)
Ancestries Reported - Irish (%)
Ancestries Reported - Italian (%)
Ancestries Reported - Lithuanian (%)
Ancestries Reported - Norwegian (%)
Ancestries Reported - Polish (%)
Ancestries Reported - Portuguese (%)
Ancestries Reported - Russian (%)
Ancestries Reported - Scotch-Irish (%)
Ancestries Reported - Scottish (%)
Ancestries Reported - Slovak (%)
Ancestries Reported - Subsaharan African (%)
Ancestries Reported - Swedish (%)
Ancestries Reported - Swiss (%)
Ancestries Reported - Ukrainian (%)
Ancestries Reported - United States (%)
Ancestries Reported - Welsh (%)
Ancestries Reported - West Indian (%)
Ancestries Reported - Other (%)
Educational Attainment - No schooling completed (%)
Educational Attainment - Less than high school (%)
Educational Attainment - High school or equivalent (%)
Educational Attainment - Less than 1 year of college (%)
Educational Attainment - 1 or more years of college (%)
Educational Attainment - Associate degree (%)
Educational Attainment - Bachelor's degree (%)
Educational Attainment - Master's degree (%)
Educational Attainment - Professional school degree (%)
Educational Attainment - Doctorate degree (%)
School Enrollment - Nursery, preschool (%)
School Enrollment - Kindergarten (%)
School Enrollment - Grade 1 to 4 (%)
School Enrollment - Grade 5 to 8 (%)
School Enrollment - Grade 9 to 12 (%)
School Enrollment - College undergrad (%)
School Enrollment - Graduate or professional (%)
School Enrollment - Not enrolled in school (%)
School enrollment - Public schools (%)
School enrollment - Private schools (%)
School enrollment - Not enrolled (%)
Median number of rooms in houses and condos
Median number of rooms in apartments
Housing units lacking complete plumbing facilities (%)
Housing units lacking complete kitchen facilities (%)
Density of houses
Urban houses (%)
Rural houses (%)
Households with people 60 years and over (%)
Households with people 65 years and over (%)
Households with people 75 years and over (%)
Households with one or more nonrelatives (%)
Households with no nonrelatives (%)
Population in households (%)
Family households (%)
Nonfamily households (%)
Population in families (%)
Family households with own children (%)
Median number of bedrooms in owner occupied houses
Mean number of bedrooms in owner occupied houses
Median number of bedrooms in renter occupied houses
Mean number of bedrooms in renter occupied houses
Median number of vehichles in owner occupied houses
Mean number of vehichles in owner occupied houses
Median number of vehichles in renter occupied houses
Mean number of vehichles in renter occupied houses
Mortgage status - with mortgage (%)
Mortgage status - with second mortgage (%)
Mortgage status - with home equity loan (%)
Mortgage status - with both second mortgage and home equity loan (%)
Mortgage status - without a mortgage (%)
Average family size
Average family size - White
Average family size - Black or African American
Average family size - Asian
Average family size - Hispanic or Latino
Average family size - American Indian and Alaska Native
Average family size - Multirace
Average family size - Other Race
Geographical mobility - Same house 1 year ago (%)
Geographical mobility - Moved within same county (%)
Geographical mobility - Moved from different county within same state (%)
Geographical mobility - Moved from different state (%)
Geographical mobility - Moved from abroad (%)
Place of birth - Born in state of residence (%)
Place of birth - Born in other state (%)
Place of birth - Native, outside of US (%)
Place of birth - Foreign born (%)
Housing units in structures - 1, detached (%)
Housing units in structures - 1, attached (%)
Housing units in structures - 2 (%)
Housing units in structures - 3 or 4 (%)
Housing units in structures - 5 to 9 (%)
Housing units in structures - 10 to 19 (%)
Housing units in structures - 20 to 49 (%)
Housing units in structures - 50 or more (%)
Housing units in structures - Mobile home (%)
Housing units in structures - Boat, RV, van, etc. (%)
House/condo owner moved in on average (years ago)
Renter moved in on average (years ago)
Year householder moved into unit - Moved in 1999 to March 2000 (%)
Year householder moved into unit - Moved in 1995 to 1998 (%)
Year householder moved into unit - Moved in 1990 to 1994 (%)
Year householder moved into unit - Moved in 1980 to 1989 (%)
Year householder moved into unit - Moved in 1970 to 1979 (%)
Year householder moved into unit - Moved in 1969 or earlier (%)
Means of transportation to work - Drove car alone (%)
Means of transportation to work - Carpooled (%)
Means of transportation to work - Public transportation (%)
Means of transportation to work - Bus or trolley bus (%)
Means of transportation to work - Streetcar or trolley car (%)
Means of transportation to work - Subway or elevated (%)
Means of transportation to work - Railroad (%)
Means of transportation to work - Ferryboat (%)
Means of transportation to work - Taxicab (%)
Means of transportation to work - Motorcycle (%)
Means of transportation to work - Bicycle (%)
Means of transportation to work - Walked (%)
Means of transportation to work - Other means (%)
Working at home (%)
Industry diversity
Most Common Industries - Agriculture, forestry, fishing and hunting, and mining (%)
Most Common Industries - Agriculture, forestry, fishing and hunting (%)
Most Common Industries - Mining, quarrying, and oil and gas extraction (%)
Most Common Industries - Construction (%)
Most Common Industries - Manufacturing (%)
Most Common Industries - Wholesale trade (%)
Most Common Industries - Retail trade (%)
Most Common Industries - Transportation and warehousing, and utilities (%)
Most Common Industries - Transportation and warehousing (%)
Most Common Industries - Utilities (%)
Most Common Industries - Information (%)
Most Common Industries - Finance and insurance, and real estate and rental and leasing (%)
Most Common Industries - Finance and insurance (%)
Most Common Industries - Real estate and rental and leasing (%)
Most Common Industries - Professional, scientific, and management, and administrative and waste management services (%)
Most Common Industries - Professional, scientific, and technical services (%)
Most Common Industries - Management of companies and enterprises (%)
Most Common Industries - Administrative and support and waste management services (%)
Most Common Industries - Educational services, and health care and social assistance (%)
Most Common Industries - Educational services (%)
Most Common Industries - Health care and social assistance (%)
Most Common Industries - Arts, entertainment, and recreation, and accommodation and food services (%)
Most Common Industries - Arts, entertainment, and recreation (%)
Most Common Industries - Accommodation and food services (%)
Most Common Industries - Other services, except public administration (%)
Most Common Industries - Public administration (%)
Occupation diversity
Most Common Occupations - Management, business, science, and arts occupations (%)
Most Common Occupations - Management, business, and financial occupations (%)
Most Common Occupations - Management occupations (%)
Most Common Occupations - Business and financial operations occupations (%)
Most Common Occupations - Computer, engineering, and science occupations (%)
Most Common Occupations - Computer and mathematical occupations (%)
Most Common Occupations - Architecture and engineering occupations (%)
Most Common Occupations - Life, physical, and social science occupations (%)
Most Common Occupations - Education, legal, community service, arts, and media occupations (%)
Most Common Occupations - Community and social service occupations (%)
Most Common Occupations - Legal occupations (%)
Most Common Occupations - Education, training, and library occupations (%)
Most Common Occupations - Arts, design, entertainment, sports, and media occupations (%)
Most Common Occupations - Healthcare practitioners and technical occupations (%)
Most Common Occupations - Health diagnosing and treating practitioners and other technical occupations (%)
Most Common Occupations - Health technologists and technicians (%)
Most Common Occupations - Service occupations (%)
Most Common Occupations - Healthcare support occupations (%)
Most Common Occupations - Protective service occupations (%)
Most Common Occupations - Fire fighting and prevention, and other protective service workers including supervisors (%)
Most Common Occupations - Law enforcement workers including supervisors (%)
Most Common Occupations - Food preparation and serving related occupations (%)
Most Common Occupations - Building and grounds cleaning and maintenance occupations (%)
Most Common Occupations - Personal care and service occupations (%)
Most Common Occupations - Sales and office occupations (%)
Most Common Occupations - Sales and related occupations (%)
Most Common Occupations - Office and administrative support occupations (%)
Most Common Occupations - Natural resources, construction, and maintenance occupations (%)
Most Common Occupations - Farming, fishing, and forestry occupations (%)
Most Common Occupations - Construction and extraction occupations (%)
Most Common Occupations - Installation, maintenance, and repair occupations (%)
Most Common Occupations - Production, transportation, and material moving occupations (%)
Most Common Occupations - Production occupations (%)
Most Common Occupations - Transportation occupations (%)
Most Common Occupations - Material moving occupations (%)
People in Group quarters - Institutionalized population (%)
People in Group quarters - Correctional institutions (%)
People in Group quarters - Federal prisons and detention centers (%)
People in Group quarters - Halfway houses (%)
People in Group quarters - Local jails and other confinement facilities (including police lockups) (%)
People in Group quarters - Military disciplinary barracks (%)
People in Group quarters - State prisons (%)
People in Group quarters - Other types of correctional institutions (%)
People in Group quarters - Nursing homes (%)
People in Group quarters - Hospitals/wards, hospices, and schools for the handicapped (%)
People in Group quarters - Hospitals/wards and hospices for chronically ill (%)
People in Group quarters - Hospices or homes for chronically ill (%)
People in Group quarters - Military hospitals or wards for chronically ill (%)
People in Group quarters - Other hospitals or wards for chronically ill (%)
People in Group quarters - Hospitals or wards for drug/alcohol abuse (%)
People in Group quarters - Mental (Psychiatric) hospitals or wards (%)
People in Group quarters - Schools, hospitals, or wards for the mentally retarded (%)
People in Group quarters - Schools, hospitals, or wards for the physically handicapped (%)
People in Group quarters - Institutions for the deaf (%)
People in Group quarters - Institutions for the blind (%)
People in Group quarters - Orthopedic wards and institutions for the physically handicapped (%)
People in Group quarters - Wards in general hospitals for patients who have no usual home elsewhere (%)
People in Group quarters - Wards in military hospitals for patients who have no usual home elsewhere (%)
People in Group quarters - Juvenile institutions (%)
People in Group quarters - Long-term care (%)
People in Group quarters - Homes for abused, dependent, and neglected children (%)
People in Group quarters - Residential treatment centers for emotionally disturbed children (%)
People in Group quarters - Training schools for juvenile delinquents (%)
People in Group quarters - Short-term care, detention or diagnostic centers for delinquent children (%)
People in Group quarters - Type of juvenile institution unknown (%)
People in Group quarters - Noninstitutionalized population (%)
People in Group quarters - College dormitories (includes college quarters off campus) (%)
People in Group quarters - Military quarters (%)
People in Group quarters - On base (%)
People in Group quarters - Barracks, unaccompanied personnel housing (UPH), (Enlisted/Officer), ;and similar group living quarters for military personnel (%)
People in Group quarters - Transient quarters for temporary residents (%)
People in Group quarters - Military ships (%)
People in Group quarters - Group homes (%)
People in Group quarters - Homes or halfway houses for drug/alcohol abuse (%)
People in Group quarters - Homes for the mentally ill (%)
People in Group quarters - Homes for the mentally retarded (%)
People in Group quarters - Homes for the physically handicapped (%)
People in Group quarters - Other group homes (%)
People in Group quarters - Religious group quarters (%)
People in Group quarters - Dormitories (%)
People in Group quarters - Agriculture workers' dormitories on farms (%)
People in Group quarters - Job Corps and vocational training facilities (%)
People in Group quarters - Other workers' dormitories (%)
People in Group quarters - Crews of maritime vessels (%)
People in Group quarters - Other nonhousehold living situations (%)
People in Group quarters - Other noninstitutional group quarters (%)
Residents speaking English at home (%)
Residents speaking English at home - Born in the United States (%)
Residents speaking English at home - Native, born elsewhere (%)
Residents speaking English at home - Foreign born (%)
Residents speaking Spanish at home (%)
Residents speaking Spanish at home - Born in the United States (%)
Residents speaking Spanish at home - Native, born elsewhere (%)
Residents speaking Spanish at home - Foreign born (%)
Residents speaking other language at home (%)
Residents speaking other language at home - Born in the United States (%)
Residents speaking other language at home - Native, born elsewhere (%)
Residents speaking other language at home - Foreign born (%)
Class of Workers - Employee of private company (%)
Class of Workers - Self-employed in own incorporated business (%)
Class of Workers - Private not-for-profit wage and salary workers (%)
Class of Workers - Local government workers (%)
Class of Workers - State government workers (%)
Class of Workers - Federal government workers (%)
Class of Workers - Self-employed workers in own not incorporated business and Unpaid family workers (%)
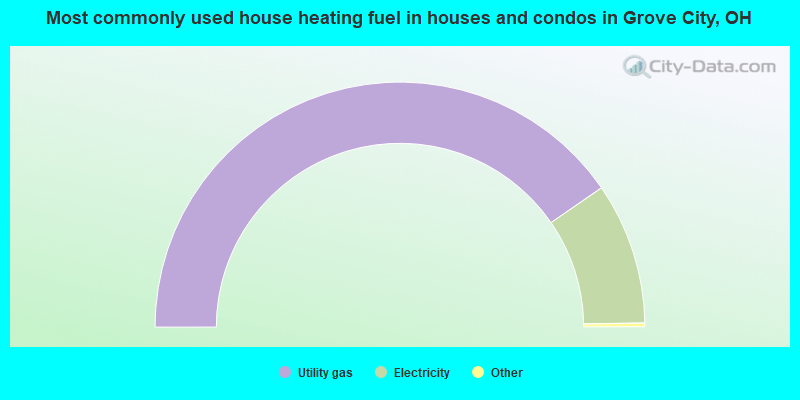
House heating fuel used in houses and condos - Utility gas (%)
House heating fuel used in houses and condos - Bottled, tank, or LP gas (%)
House heating fuel used in houses and condos - Electricity (%)
House heating fuel used in houses and condos - Fuel oil, kerosene, etc. (%)
House heating fuel used in houses and condos - Coal or coke (%)
House heating fuel used in houses and condos - Wood (%)
House heating fuel used in houses and condos - Solar energy (%)
House heating fuel used in houses and condos - Other fuel (%)
House heating fuel used in houses and condos - No fuel used (%)
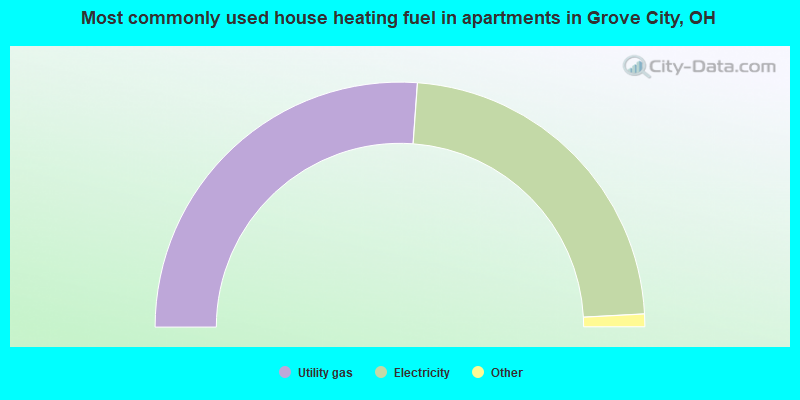
House heating fuel used in apartments - Utility gas (%)
House heating fuel used in apartments - Bottled, tank, or LP gas (%)
House heating fuel used in apartments - Electricity (%)
House heating fuel used in apartments - Fuel oil, kerosene, etc. (%)
House heating fuel used in apartments - Coal or coke (%)
House heating fuel used in apartments - Wood (%)
House heating fuel used in apartments - Solar energy (%)
House heating fuel used in apartments - Other fuel (%)
House heating fuel used in apartments - No fuel used (%)
Armed forces status - In Armed Forces (%)
Armed forces status - Civilian (%)
Armed forces status - Civilian - Veteran (%)
Armed forces status - Civilian - Nonveteran (%)
Fatal accidents locations in years 2005-2021
Fatal accidents locations in 2005
Fatal accidents locations in 2006
Fatal accidents locations in 2007
Fatal accidents locations in 2008
Fatal accidents locations in 2009
Fatal accidents locations in 2010
Fatal accidents locations in 2011
Fatal accidents locations in 2012
Fatal accidents locations in 2013
Fatal accidents locations in 2014
Fatal accidents locations in 2015
Fatal accidents locations in 2016
Fatal accidents locations in 2017
Fatal accidents locations in 2018
Fatal accidents locations in 2019
Fatal accidents locations in 2020
Fatal accidents locations in 2021
Alcohol use - People drinking some alcohol every month (%)
Alcohol use - People not drinking at all (%)
Alcohol use - Average days/month drinking alcohol
Alcohol use - Average drinks/week
Alcohol use - Average days/year people drink much
Audiometry - Average condition of hearing (%)
Audiometry - People that can hear a whisper from across a quiet room (%)
Audiometry - People that can hear normal voice from across a quiet room (%)
Audiometry - Ears ringing, roaring, buzzing (%)
Audiometry - Had a job exposure to loud noise (%)
Audiometry - Had off-work exposure to loud noise (%)
Blood Pressure & Cholesterol - Has high blood pressure (%)
Blood Pressure & Cholesterol - Checking blood pressure at home (%)
Blood Pressure & Cholesterol - Frequently checking blood cholesterol (%)
Blood Pressure & Cholesterol - Has high cholesterol level (%)
Consumer Behavior - Money monthly spent on food at supermarket/grocery store
Consumer Behavior - Money monthly spent on food at other stores
Consumer Behavior - Money monthly spent on eating out
Consumer Behavior - Money monthly spent on carryout/delivered foods
Consumer Behavior - Income spent on food at supermarket/grocery store (%)
Consumer Behavior - Income spent on food at other stores (%)
Consumer Behavior - Income spent on eating out (%)
Consumer Behavior - Income spent on carryout/delivered foods (%)
Current Health Status - General health condition (%)
Current Health Status - Blood donors (%)
Current Health Status - Has blood ever tested for HIV virus (%)
Current Health Status - Left-handed people (%)
Dermatology - People using sunscreen (%)
Diabetes - Diabetics (%)
Diabetes - Had a blood test for high blood sugar (%)
Diabetes - People taking insulin (%)
Diet Behavior & Nutrition - Diet health (%)
Diet Behavior & Nutrition - Milk product consumption (# of products/month)
Diet Behavior & Nutrition - Meals not home prepared (#/week)
Diet Behavior & Nutrition - Meals from fast food or pizza place (#/week)
Diet Behavior & Nutrition - Ready-to-eat foods (#/month)
Diet Behavior & Nutrition - Frozen meals/pizza (#/month)
Drug Use - People that ever used marijuana or hashish (%)
Drug Use - Ever used hard drugs (%)
Drug Use - Ever used any form of cocaine (%)
Drug Use - Ever used heroin (%)
Drug Use - Ever used methamphetamine (%)
Health Insurance - People covered by health insurance (%)
Kidney Conditions-Urology - Avg. # of times urinating at night
Medical Conditions - People with asthma (%)
Medical Conditions - People with anemia (%)
Medical Conditions - People with psoriasis (%)
Medical Conditions - People with overweight (%)
Medical Conditions - Elderly people having difficulties in thinking or remembering (%)
Medical Conditions - People who ever received blood transfusion (%)
Medical Conditions - People having trouble seeing even with glass/contacts (%)
Medical Conditions - People with arthritis (%)
Medical Conditions - People with gout (%)
Medical Conditions - People with congestive heart failure (%)
Medical Conditions - People with coronary heart disease (%)
Medical Conditions - People with angina pectoris (%)
Medical Conditions - People who ever had heart attack (%)
Medical Conditions - People who ever had stroke (%)
Medical Conditions - People with emphysema (%)
Medical Conditions - People with thyroid problem (%)
Medical Conditions - People with chronic bronchitis (%)
Medical Conditions - People with any liver condition (%)
Medical Conditions - People who ever had cancer or malignancy (%)
Mental Health - People who have little interest in doing things (%)
Mental Health - People feeling down, depressed, or hopeless (%)
Mental Health - People who have trouble sleeping or sleeping too much (%)
Mental Health - People feeling tired or having little energy (%)
Mental Health - People with poor appetite or overeating (%)
Mental Health - People feeling bad about themself (%)
Mental Health - People who have trouble concentrating on things (%)
Mental Health - People moving or speaking slowly or too fast (%)
Mental Health - People having thoughts they would be better off dead (%)
Oral Health - Average years since last visit a dentist
Oral Health - People embarrassed because of mouth (%)
Oral Health - People with gum disease (%)
Oral Health - General health of teeth and gums (%)
Oral Health - Average days a week using dental floss/device
Oral Health - Average days a week using mouthwash for dental problem
Oral Health - Average number of teeth
Pesticide Use - Households using pesticides to control insects (%)
Pesticide Use - Households using pesticides to kill weeds (%)
Physical Activity - People doing vigorous-intensity work activities (%)
Physical Activity - People doing moderate-intensity work activities (%)
Physical Activity - People walking or bicycling (%)
Physical Activity - People doing vigorous-intensity recreational activities (%)
Physical Activity - People doing moderate-intensity recreational activities (%)
Physical Activity - Average hours a day doing sedentary activities
Physical Activity - Average hours a day watching TV or videos
Physical Activity - Average hours a day using computer
Physical Functioning - People having limitations keeping them from working (%)
Physical Functioning - People limited in amount of work they can do (%)
Physical Functioning - People that need special equipment to walk (%)
Physical Functioning - People experiencing confusion/memory problems (%)
Physical Functioning - People requiring special healthcare equipment (%)
Prescription Medications - Average number of prescription medicines taking
Preventive Aspirin Use - Adults 40+ taking low-dose aspirin (%)
Reproductive Health - Vaginal deliveries (%)
Reproductive Health - Cesarean deliveries (%)
Reproductive Health - Deliveries resulted in a live birth (%)
Reproductive Health - Pregnancies resulted in a delivery (%)
Reproductive Health - Women breastfeeding newborns (%)
Reproductive Health - Women that had a hysterectomy (%)
Reproductive Health - Women that had both ovaries removed (%)
Reproductive Health - Women that have ever taken birth control pills (%)
Reproductive Health - Women taking birth control pills (%)
Reproductive Health - Women that have ever used Depo-Provera or injectables (%)
Reproductive Health - Women that have ever used female hormones (%)
Sexual Behavior - People 18+ that ever had sex (vaginal, anal, or oral) (%)
Sexual Behavior - Males 18+ that ever had vaginal sex with a woman (%)
Sexual Behavior - Males 18+ that ever performed oral sex on a woman (%)
Sexual Behavior - Males 18+ that ever had anal sex with a woman (%)
Sexual Behavior - Males 18+ that ever had any sex with a man (%)
Sexual Behavior - Females 18+ that ever had vaginal sex with a man (%)
Sexual Behavior - Females 18+ that ever performed oral sex on a man (%)
Sexual Behavior - Females 18+ that ever had anal sex with a man (%)
Sexual Behavior - Females 18+ that ever had any kind of sex with a woman (%)
Sexual Behavior - Average age people first had sex
Sexual Behavior - Average number of female sex partners in lifetime (males 18+)
Sexual Behavior - Average number of female vaginal sex partners in lifetime (males 18+)
Sexual Behavior - Average age people first performed oral sex on a woman (18+)
Sexual Behavior - Average number of woman performed oral sex on in lifetime (18+)
Sexual Behavior - Average number of male sex partners in lifetime (males 18+)
Sexual Behavior - Average number of male anal sex partners in lifetime (males 18+)
Sexual Behavior - Average age people first performed oral sex on a man (18+)
Sexual Behavior - Average number of male oral sex partners in lifetime (18+)
Sexual Behavior - People using protection when performing oral sex (%)
Sexual Behavior - Average number of times people have vaginal or anal sex a year
Sexual Behavior - People having sex without condom (%)
Sexual Behavior - Average number of male sex partners in lifetime (females 18+)
Sexual Behavior - Average number of male vaginal sex partners in lifetime (females 18+)
Sexual Behavior - Average number of female sex partners in lifetime (females 18+)
Sexual Behavior - Circumcised males 18+ (%)
Sleep Disorders - Average hours sleeping at night
Sleep Disorders - People that has trouble sleeping (%)
Smoking-Cigarette Use - People smoking cigarettes (%)
Taste & Smell - People 40+ having problems with smell (%)
Taste & Smell - People 40+ having problems with taste (%)
Taste & Smell - People 40+ that ever had wisdom teeth removed (%)
Taste & Smell - People 40+ that ever had tonsils teeth removed (%)
Taste & Smell - People 40+ that ever had a loss of consciousness because of a head injury (%)
Taste & Smell - People 40+ that ever had a broken nose or other serious injury to face or skull (%)
Taste & Smell - People 40+ that ever had two or more sinus infections (%)
Weight - Average height (inches)
Weight - Average weight (pounds)
Weight - Average BMI
Weight - People that are obese (%)
Weight - People that ever were obese (%)
Weight - People trying to lose weight (%)
According to our research of Ohio and other state lists, there were 52 registered sex offenders living in Grove City, Ohio as of June 15, 2024 . The ratio of all residents to sex offenders in Grove City is 757 to 1.The ratio of registered sex offenders to all residents in this city is lower than the state average.
Officers per 1,000 residents here:
1.52Ohio average:
2.23
Latest news from Grove City, OH collected exclusively by city-data.com from local newspapers, TV, and radio stations
Ancestries: German (22.5%), American (17.3%), English (8.8%), Irish (8.8%), Italian (4.4%), European (2.6%).
Current Local Time:
Land area: 13.9 square miles.
Population density: 3,028 people per square mile (average).
1,505 residents are foreign born (1.7% Asia , 0.8% Europe , 0.7% Latin America ).
Median real estate property taxes paid for housing units with mortgages in 2022: $4,594 (1.5%)Median real estate property taxes paid for housing units with no mortgage in 2022: $4,381 (1.5%)
Nearest city with pop. 50,000+: Columbus, OH
Nearest city with pop. 1,000,000+: Chicago, IL
Nearest cities:
New Rome, OH (2.5 miles),
Latitude: 39.88 N, Longitude: 83.08 W
Daytime population change due to commuting: +3,957 (+9.5%)Workers who live and work in this city: 7,231 (32.2%)
Property values in Grove City, OH
Single-family new house construction building permits:
2022: 384 buildings , average cost: $355,1002021: 409 buildings , average cost: $266,3002020: 278 buildings , average cost: $198,2002019: 62 buildings , average cost: $294,3002018: 136 buildings , average cost: $288,0002017: 176 buildings , average cost: $210,0002016: 256 buildings , average cost: $191,6002015: 182 buildings , average cost: $223,1002014: 172 buildings , average cost: $241,0002013: 187 buildings , average cost: $237,6002012: 126 buildings , average cost: $222,0002011: 92 buildings , average cost: $226,7002010: 115 buildings , average cost: $196,0002009: 171 buildings , average cost: $193,5002008: 139 buildings , average cost: $242,3002007: 256 buildings , average cost: $231,4002006: 355 buildings , average cost: $212,4002005: 463 buildings , average cost: $199,4002004: 360 buildings , average cost: $197,6002003: 464 buildings , average cost: $145,6002002: 231 buildings , average cost: $194,9002001: 243 buildings , average cost: $194,4002000: 284 buildings , average cost: $184,4001999: 241 buildings , average cost: $171,7001998: 416 buildings , average cost: $108,2001997: 240 buildings , average cost: $151,900Unemployment in December 2023:
Population change in the 1990s: +7,362 (+37.3%).
Most common occupations in Grove City, OH (%)
Both Males Females
Other office and administrative support workers, including supervisors (5.8%)
Other management occupations, except farmers and farm managers (4.5%)
Secretaries and administrative assistants (4.3%)
Other sales and related occupations, including supervisors (4.0%)
Material recording, scheduling, dispatching, and distributing workers (3.6%)
Computer specialists (3.1%)
Information and record clerks, except customer service representatives (2.8%)
Other management occupations, except farmers and farm managers (5.8%)
Other sales and related occupations, including supervisors (5.4%)
Driver/sales workers and truck drivers (4.6%)
Material recording, scheduling, dispatching, and distributing workers (4.3%)
Computer specialists (4.0%)
Other production occupations, including supervisors (3.7%)
Electrical equipment mechanics and other installation, maintenance, and repair workers, including supervisors (3.7%)
Other office and administrative support workers, including supervisors (9.8%)
Secretaries and administrative assistants (8.6%)
Information and record clerks, except customer service representatives (5.1%)
Preschool, kindergarten, elementary, and middle school teachers (4.6%)
Customer service representatives (4.4%)
Registered nurses (4.0%)
Bookkeeping, accounting, and auditing clerks (3.3%)
Tornado activity:
Grove City-area historical tornado activity is near Ohio state average. It is 19% greater than the overall U.S. average.
On 4/3/1974, a category F5 (max. wind speeds 261-318 mph) tornado 27.8 miles away from the Grove City city center killed 36 people and injured 1150 people and caused between $50,000,000 and $500,000,000 in damages.
On 2/22/1971, a category F3 (max. wind speeds 158-206 mph) tornado 10.1 miles away from the city center injured 7 people and caused between $500,000 and $5,000,000 in damages.
Earthquake activity:
Grove City-area historical earthquake activity is significantly above Ohio state average. It is 0% smaller than the overall U.S. average. On 7/27/1980 at 18:52:21, a magnitude 5.2 (5.1 MB, 4.7 MS, 5.0 UK, 5.2 UK, Class: Moderate, Intensity: VI - VII) earthquake occurred 124.7 miles away from Grove City center On 9/25/1998 at 19:52:52, a magnitude 5.2 (4.8 MB, 4.3 MS, 5.2 LG, 4.5 MW, Depth: 3.1 mi) earthquake occurred 179.5 miles away from Grove City center On 8/23/2011 at 17:51:04, a magnitude 5.8 (5.8 MW, Depth: 3.7 mi) earthquake occurred 308.4 miles away from the city center On 1/31/1986 at 16:46:43, a magnitude 5.0 (5.0 MB) earthquake occurred 156.0 miles away from the city center On 7/12/1986 at 08:19:37, a magnitude 4.5 (4.5 MB, Class: Light, Intensity: IV - V) earthquake occurred 82.1 miles away from the city center On 4/18/2008 at 09:36:59, a magnitude 5.4 (5.1 MB, 4.8 MS, 5.4 MW, 5.2 MW) earthquake occurred 276.0 miles away from Grove City center Magnitude types: regional Lg-wave magnitude (LG), body-wave magnitude (MB), surface-wave magnitude (MS), moment magnitude (MW) Natural disasters: The number of natural disasters in Franklin County (16) is near the US average (15).Major Disasters (Presidential) Declared: 11Emergencies Declared: 4Storms: 9, Floods: 7, Tornadoes: 6, Winds: 3, Mudslides: 2, Snows: 2, Blizzard: 1, Hurricane: 1, Landslide: 1, Snowstorm: 1, Tropical Depression: 1, Winter Storm: 1, Other: 1 (Note: some incidents may be assigned to more than one category). Hospitals and medical centers in Grove City: MCDOWELL ROAD HOME (4196-4250 MCDOWELL ROAD) MONTEREY CARE CENTER (3929 HOOVER ROAD)
DAVITA - GROVE CITY DIALYSIS (4155 KELNOR DRIVE)
NURSE MEDICAL HEALTHCARE SERVICES, INC (3457 BROADWAY STREET)
TRIAD HOME HEALTH SERVICES LLC (1953 OHIO DRIVE)
Amtrak station near Grove City: 8 miles: COLUMBUS (111 EAST TOWN ST.) - Bus Station Services: enclosed waiting area, public restrooms, public payphones.
College/University in Grove City: Harrison College-Grove City Full-time enrollment: 197; Location: 3880 Jackpot Rd; Private, for-profit; Website: harrison.edu)
Colleges/universities with over 2000 students nearest to Grove City:
Franklin University (about 8 miles; Columbus, OH ; Full-time enrollment: 3,736)
Columbus State Community College (about 8 miles; Columbus, OH ; FT enrollment: 24,488)
DeVry University-Ohio (about 9 miles; Columbus, OH ; FT enrollment: 3,896)
Ohio State University-Main Campus (about 10 miles; Columbus, OH ; FT enrollment: 50,395)
Capital University (about 10 miles; Columbus, OH ; FT enrollment: 3,029)
Ohio Dominican University (about 11 miles; Columbus, OH ; FT enrollment: 2,045)
Otterbein University (about 19 miles; Westerville, OH ; FT enrollment: 2,933)
Public high schools in Grove City:
Private high school in Grove City: GROVE CITY CHRISTIAN SCHOOL Students: 708, Location: 4750 HOOVER RD, Grades: KG-12)
Biggest public elementary/middle schools in Grove City: BUCKEYE WOODS ELEMENTARY SCHOOL Students: 822, Location: 2525 HOLTON RD, Grades: KG-4)PLEASANT VIEW MIDDLE SCHOOL Students: 770, Location: 7255 KROPP RD, Grades: 7-8)HOLT CROSSING INTERMEDIATE SCHOOL Students: 703, Location: 2706 HOLT RD, Grades: 5-6)PARK STREET INTERMEDIATE SCHOOL Students: 699, Location: 3191 PARK ST, Grades: 5-6)BROOKPARK MIDDLE SCHOOL Students: 610, Location: 2803 SOUTHWEST BLVD, Grades: 7-8)JC SOMMER ELEMENTARY SCHOOL Students: 584, Location: 3055 KINGSTON AVE, Grades: KG-4)RICHARD AVENUE ELEMENTARY SCHOOL Students: 464, Location: 2584 DENNIS LN, Grades: KG-4)HIGHLAND PARK ELEMENTARY SCHOOL Students: 445, Location: 2600 CAMERON ST, Grades: KG-4)HAYES INTERMEDIATE SCHOOL Students: 441, Location: 4436 HAUGHN RD, Grades: 5-6)JAMES A HARMON ELEMENTARY SCHOOL Students: 441, Location: 1861 GANTZ RD, Grades: KG-4)Private elementary/middle schools in Grove City: OUR LADY OF PERPETUAL HELP SCHOOL Students: 446, Location: 3752 BROADWAY, Grades: PK-8)
BEAUTIFUL SAVIOR EVANGELICAL LUTHERAN ELEM SCHOOL Students: 68, Location: 2213 WHITE RD, Grades: PK-8)
See full list of schools located in Grove City Library in Grove City: SOUTHWEST PUBLIC LIBRARIES Operating income: $4,316,769; Location: 3359 PARK ST.; 323,131 books ; 6,100 e-books ; 29,263 audio materials ; 30,254 video materials ; 3 local licensed databases ; 266 state licensed databases ; 323 print serial subscriptions )
Notable locations in Grove City: (A) , Grove City Industrial Park (B) , Gateway Business Park (C) , Capital Music Center (D) , Buckeye Boys Ranch (E) , Jackson Township Fire Department Station 201 (F) , Grove City City Hall (G) , Jackson Township Fire Department Station 202 Headquarters (H) , Jackson Township Fire Department Station 203 (I) , The Buckeye Ranch Incorporated (J) , Grove City Library (K) . Display/hide their locations on the map
Shopping Centers: (1) , Arlington Towers Shopping Center (2) , Buckeye Grove Shopping Center (3) , Broadway Shopping Center (4) , Derby Square Shopping Center (5) . Display/hide their locations on the map
Churches in Grove City include: (A) , Our Lady of Perpetual Help Church (B) , Faith Believing Word Center (C) , First Presbyterian Church (D) , Southwestern Church of Christ (E) , Kingdom Hall of Jehovah's Witnesses (F) , Bible Baptist Church (G) , First Baptist Church of Grove City (H) , Grove City Church of Christ (I) . Display/hide their locations on the map
Cemetery: (1) . Display/hide its location on the map
Streams, rivers, and creeks: (A) , Mulberry Run (B) , Republican Run (C) . Display/hide their locations on the map
Parks in Grove City include: (1) , Gantz Park (2) , Grove City Park (3) . Display/hide their locations on the map
Tourist attractions: (1) , Bound For Travel (Tours & Charters; 2345 Demorest Road) (2) . Display/hide their approximate locations on the map
Hotels: (1) , Comfort Inn Grove City (4197 Marlane Drive) (2) , Columbus/Grove City Knights Inn (3131 Broadway) (3) , Hilton Garden Inn® Columbus/Grove City (3928 Jackson Pike) (4) , Cross Country Inn Grove City (4055 Jackpot Road) (5) , Hilton Garden Inn (3928 Jackpot Road) (6) , Holiday Inn Express Hotel & Suites (3951 Jackpot Road) (7) , Best Western Executive Inn (4026 Jackpot Road) (8) , Days Inn (1849 Stringtown Road) (9) . Display/hide their approximate locations on the map
Birthplace of: Cheryl Grossman - Politician, Mike Furrey - 2005 NFL player (St. Louis Rams, born : May 12, 1977), J. T. Murray - Footballer.
Franklin County has a predicted average indoor radon screening level greater than 4 pCi/L (pico curies per liter) - Highest Potential Drinking water stations with addresses in Grove City and their reported violations in the past:
SUNOCO FOOD MART 7563 PWS (Population served: 200, Groundwater):
Past monitoring violations:
5 routine major monitoring violations
One regular monitoring violation
Population served: 85, Groundwater):
Past health violations:
MCL, Monthly (TCR) - In JUL-2010, Contaminant: Coliform. Follow-up actions: St Public Notif requested (AUG-11-2010), St Violation/Reminder Notice (AUG-11-2010), St Compliance achieved (MAR-04-2011), St Public Notif received (MAR-15-2011)
MCL, Monthly (TCR) - Between APR-2010 and JUN-2010, Contaminant: Coliform. Follow-up actions: St Public Notif requested (AUG-04-2010), St Violation/Reminder Notice (AUG-04-2010), St Public Notif received (MAR-15-2011), St Compliance achieved (MAY-17-2011)
Past monitoring violations:
Lead Consumer Notice - In DEC-31-2009, Contaminant: Lead and Copper Rule. Follow-up actions: St Violation/Reminder Notice (JUN-30-2010), State No Longer Subject to Rule (MAR-16-2011)
Follow-up Or Routine LCR Tap M/R - In OCT-10-2009, Contaminant: Lead and Copper Rule. Follow-up actions: St Public Notif requested (DEC-11-2009), St Violation/Reminder Notice (DEC-11-2009), State No Longer Subject to Rule (MAR-16-2011)
One minor monitoring violation
Population served: 80, Groundwater):
Past health violations:
MCL, Monthly (TCR) - Between JUL-2009 and SEP-2009, Contaminant: Coliform. Follow-up actions: St Violation/Reminder Notice (SEP-14-2009), St Public Notif requested (SEP-14-2009), St Public Notif received (OCT-23-2009), St Compliance achieved (JUN-11-2010)
MCL, Monthly (TCR) - Between OCT-2006 and DEC-2006, Contaminant: Coliform. Follow-up actions: St Public Notif requested (DEC-04-2006), St Violation/Reminder Notice (DEC-04-2006), St Public Notif received (MAR-27-2007), St Compliance achieved (AUG-09-2007)
Past monitoring violations:
Follow-up Or Routine LCR Tap M/R - In DEC-23-2009, Contaminant: Lead and Copper Rule. Follow-up actions: State No Longer Subject to Rule (APR-28-2009), St Public Notif requested (DEC-23-2009), St Violation/Reminder Notice (DEC-23-2009), St Public Notif received (OCT-19-2012)
Population served: 35, Groundwater):
Past health violations:
MCL, Monthly (TCR) - Between OCT-2008 and DEC-2008, Contaminant: Coliform. Follow-up actions: St Violation/Reminder Notice (NOV-10-2008), St Public Notif requested (NOV-10-2008), St Compliance achieved (AUG-05-2009)
MCL, Monthly (TCR) - Between OCT-2006 and DEC-2006, Contaminant: Coliform. Follow-up actions: St Public Notif requested (DEC-07-2006), St Violation/Reminder Notice (DEC-07-2006), St Compliance achieved (APR-19-2007)
MCL, Monthly (TCR) - Between JUL-2006 and SEP-2006, Contaminant: Coliform. Follow-up actions: St Violation/Reminder Notice (SEP-25-2006), St Public Notif requested (SEP-25-2006), St Public Notif received (DEC-28-2006), St Compliance achieved (APR-19-2007)
MCL, Acute (TCR) - Between JUL-2006 and SEP-2006, Contaminant: Coliform. Follow-up actions: St Public Notif requested (SEP-25-2006), St Violation/Reminder Notice (SEP-25-2006), St Compliance achieved (APR-19-2007)
Past monitoring violations:
Monitoring, Repeat Major (TCR) - Between JUL-2006 and SEP-2006, Contaminant: Coliform (TCR). Follow-up actions: St Public Notif received (SEP-25-2006), St Public Notif requested (SEP-25-2006), St Violation/Reminder Notice (SEP-25-2006), St Compliance achieved (APR-19-2007)
6 routine major monitoring violations
One regular monitoring violation
Address: 1060 Borror Road Population served: 30, Groundwater):
Past health violations:
MCL, Monthly (TCR) - In AUG-2013, Contaminant: Coliform. Follow-up actions: St Public Notif requested (AUG-05-2013), St Violation/Reminder Notice (AUG-05-2013), St Compliance achieved (SEP-24-2013)
MCL, Monthly (TCR) - Between JUL-2013 and SEP-2013, Contaminant: Coliform. Follow-up actions: St Public Notif requested (JUL-11-2013), St Violation/Reminder Notice (JUL-11-2013), St Compliance achieved (SEP-24-2013), St Public Notif received (NOV-07-2013)
MCL, Acute (TCR) - Between JUL-2013 and SEP-2013, Contaminant: Coliform. Follow-up actions: St Public Notif requested (JUL-11-2013), St Boil Water Order (JUL-11-2013), St Violation/Reminder Notice (JUL-11-2013), St Public Notif received (SEP-18-2013), St Compliance achieved (SEP-24-2013)
MCL, Monthly (TCR) - In AUG-2011, Contaminant: Coliform. Follow-up actions: St Compliance achieved (SEP-15-2011), St Public Notif received (OCT-24-2011)
MCL, Monthly (TCR) - Between JUL-2011 and SEP-2011, Contaminant: Coliform. Follow-up actions: St Public Notif requested (AUG-22-2011), St Violation/Reminder Notice (AUG-22-2011), St Compliance achieved (SEP-15-2011), St Public Notif received (OCT-24-2011)
Past monitoring violations:
Monitoring, Repeat Major (TCR) - In AUG-2011, Contaminant: Coliform (TCR). Follow-up actions: St Compliance achieved (SEP-15-2011), St Public Notif received (OCT-24-2011)
Monitoring, Repeat Major (TCR) - Between JUL-2011 and SEP-2011, Contaminant: Coliform (TCR). Follow-up actions: St Public Notif requested (SEP-08-2011), St Violation/Reminder Notice (SEP-08-2011), St Compliance achieved (SEP-15-2011), St Public Notif received (OCT-03-2011)
One routine major monitoring violation
Address: 1060 Borror Road Population served: 25, Groundwater):
Past health violations:
MCL, Monthly (TCR) - In AUG-2013, Contaminant: Coliform. Follow-up actions: St Public Notif requested (AUG-26-2013), St Violation/Reminder Notice (AUG-26-2013), St Compliance achieved (SEP-24-2013)
MCL, Acute (TCR) - Between JUL-2013 and SEP-2013, Contaminant: Coliform. Follow-up actions: St Public Notif requested (JUL-11-2013), St Boil Water Order (JUL-11-2013), St Violation/Reminder Notice (JUL-11-2013), St Public Notif received (SEP-18-2013), St Compliance achieved (SEP-24-2013)
MCL, Monthly (TCR) - Between JUL-2013 and SEP-2013, Contaminant: Coliform. Follow-up actions: St Public Notif requested (JUL-11-2013), St Violation/Reminder Notice (JUL-11-2013), St Compliance achieved (SEP-24-2013), St Public Notif received (APR-03-2014)
Past monitoring violations:
2 routine major monitoring violations
Drinking water stations with addresses in Grove City that have no violations reported:
TOTAL QUALITY INC WENDY PWS (Population served: 450, Primary Water Source Type: Groundwater)
VINEYARD CHRISTIAN FELLOWSHIP-HOLT PWS (Population served: 171, Primary Water Source Type: Groundwater)
INSURANCE AUTO AUCTIONS INC PWS (Population served: 42, Primary Water Source Type: Groundwater)
Average household size: This city:
2.5 peopleOhio:
2.4 people
Percentage of family households: This city:
68.7%Whole state:
65.0%
Percentage of households with unmarried partners: This city:
7.2%Whole state:
6.8%
Likely homosexual households (counted as self-reported same-sex unmarried-partner households)
Lesbian couples: 0.5% of all households Gay men: 0.4% of all households
People in group quarters in Grove City in 2010:
165 people in nursing facilities/skilled-nursing facilities
83 people in residential treatment centers for juveniles (non-correctional)
30 people in group homes intended for adults
4 people in workers' group living quarters and job corps centers
People in group quarters in Grove City in 2000:
180 people in nursing homes
73 people in other group homes
24 people in homes for the mentally retarded
4 people in other noninstitutional group quarters
Banks with most branches in Grove City (2011 data):
U.S. Bank National Association: Grove City Meijer Branch at 2811 London Groveport Road, branch established on 2008/04/30; Grove City Branch at 2508 Columbus Street, branch established on 1988/12/06. Info updated 2012/01/30: Bank assets: $330,470.8 mil, Deposits: $236,091.5 mil, headquarters in Cincinnati, OH, positive income , 3121 total offices , Holding Company: U.S. Bancorp
JPMorgan Chase Bank, National Association: Grove City East Branch at 4100 Buckeye Pkwy, branch established on 2008/07/15; Grove City Branch at 2161 Stringtown Road, branch established on 1991/09/01. Info updated 2011/11/10: Bank assets: $1,811,678.0 mil, Deposits: $1,190,738.0 mil, headquarters in Columbus, OH, positive income , International Specialization, 5577 total offices , Holding Company: Jpmorgan Chase & Co.
KeyBank National Association: Grove City Branch at 2345 Stringtown Road, branch established on 1963/03/29; Grove City Branch at 5968 Hoover Road, branch established on 2006/07/31. Info updated 2008/03/03: Bank assets: $86,198.8 mil, Deposits: $64,214.8 mil, headquarters in Cleveland, OH, positive income , Commercial Lending Specialization, 1067 total offices , Holding Company: Keycorp
RBS Citizens, National Association: Hoover Road/Kroger Branch at 5965 Hoover Rd, branch established on 2004/08/20; Grove City/Walmart Branch at 1693 Stringtown Rd, branch established on 2004/11/12. Info updated 2007/09/19: Bank assets: $106,940.6 mil, Deposits: $75,690.2 mil, headquarters in Providence, RI, positive income , 1135 total offices , Holding Company: Uk Financial Investments Limited
Fifth Third Bank: Grove City Downtown at 3990 Broadway, branch established on 1900/01/01; Grove City Hoover Road at 4128 Hoover Road, branch established on 1989/12/29. Info updated 2009/10/05: Bank assets: $114,540.4 mil, Deposits: $89,689.1 mil, headquarters in Cincinnati, OH, positive income , Commercial Lending Specialization, 1378 total offices , Holding Company: Fifth Third Bancorp
The Huntington National Bank: Buckeye Grove Branch at 2607 London-Groveport Road, branch established on 2007/08/01; Stringtown Road Branch at 2227 Stringtown Road, branch established on 2006/12/11. Info updated 2012/04/02: Bank assets: $54,183.4 mil, Deposits: $44,300.3 mil, headquarters in Columbus, OH, positive income , Commercial Lending Specialization, 878 total offices , Holding Company: Huntington Bancshares Incorporated
PNC Bank, National Association: Grove City Branch at 2500 Stringtown Road, branch established on 1976/12/02; Buckeye Groves Branch at 2814 London-Groveport Road, branch established on 2008/11/17. Info updated 2012/03/20: Bank assets: $263,309.6 mil, Deposits: $197,343.0 mil, headquarters in Wilmington, DE, positive income , Commercial Lending Specialization, 3085 total offices , Holding Company: Pnc Financial Services Group, Inc., The
The Citizens Bank of Ashville, Ohio: Grove City Branch at 2250 Stringtown Road, branch established on 2010/06/10. Info updated 2006/11/03: Bank assets: $100.3 mil, Deposits: $81.4 mil, headquarters in Ashville, OH, negative income in the last year , Commercial Lending Specialization, 4 total offices
Heartland Bank: Grove City Branch at 2365 Old Stringtown Rd, branch established on 1989/09/26. Info updated 2006/11/03: Bank assets: $570.7 mil, Deposits: $493.0 mil, headquarters in Gahanna, OH, positive income , Commercial Lending Specialization, 13 total offices , Holding Company: Heartland Banccorp
3 other banks with 3 local branches
For population 15 years and over in Grove City:
Never married: 25.5%Now married: 56.1%Separated: 1.0%Widowed: 5.5%Divorced: 12.0% For population 25 years and over in Grove City:
High school or higher: 93.3%Bachelor's degree or higher: 33.1%Graduate or professional degree: 10.6%Unemployed: 3.4%Mean travel time to work (commute): 18.9 minutes
Education Gini index (Inequality in education) Here:
10.3Ohio average:
11.0
Religion statistics for Grove City, OH (based on Franklin County data)
Religion Adherents Congregations Catholic 153,400 51 Evangelical Protestant 144,147 462 Mainline Protestant 105,457 230 Other 42,560 102 Black Protestant 19,363 54 Orthodox 5,360 11 None 693,127 -
Source: Clifford Grammich, Kirk Hadaway, Richard Houseal, Dale E.Jones, Alexei Krindatch, Richie Stanley and Richard H.Taylor. 2012. 2010 U.S.Religion Census: Religious Congregations & Membership Study. Association of Statisticians of American Religious Bodies. Jones, Dale E., et al. 2002. Congregations and Membership in the United States 2000. Nashville, TN: Glenmary Research Center. Graphs represent county-level data
Food Environment Statistics: Number of grocery stores : 251Franklin County :
2.25 / 10,000 pop.Ohio :
1.89 / 10,000 pop.
Number of supercenters and club stores : 11Here :
0.10 / 10,000 pop.Ohio :
0.13 / 10,000 pop.
Number of convenience stores (no gas) : 146Franklin County :
1.31 / 10,000 pop.Ohio :
1.25 / 10,000 pop.
Number of convenience stores (with gas) : 285Franklin County :
2.55 / 10,000 pop.Ohio :
2.93 / 10,000 pop.
Number of full-service restaurants : 730Here :
6.54 / 10,000 pop.State :
6.25 / 10,000 pop.
Adult diabetes rate : This county :
9.5%Ohio :
10.3%
Adult obesity rate : This county :
30.2%Ohio :
29.1%
Low-income preschool obesity rate : Health and Nutrition:
Average overall health of teeth and gums : Grove City:
50.5%State:
47.8%
People feeling badly about themselves : People not drinking alcohol at all : Grove City:
9.3%State:
10.4%
Average hours sleeping at night : Overweight people : Grove City:
34.2%Ohio:
34.3%
General health condition : This city:
59.0%Ohio:
57.0%
Average condition of hearing : This city:
79.8%State:
79.1%
More about Health and Nutrition of Grove City, OH Residents
Grove City government finances - Expenditure in 2021 (per resident):
Construction - Regular Highways: $12,712,000 ($301.00)
General - Other: $1,193,000 ($28.25)Parks and Recreation: $775,000 ($18.35)General Public Buildings: $349,000 ($8.26)Sewerage: $271,000 ($6.42)Central Staff Services: $38,000 ($0.90)Current Operations - Police Protection: $11,897,000 ($281.70)
General - Other: $10,614,000 ($251.32)Central Staff Services: $4,604,000 ($109.01)General Public Buildings: $3,299,000 ($78.11)Parks and Recreation: $2,294,000 ($54.32)Regular Highways: $2,260,000 ($53.51)Protective Inspection and Regulation - Other: $1,180,000 ($27.94)Financial Administration: $938,000 ($22.21)Sewerage: $691,000 ($16.36)Judicial and Legal Services: $416,000 ($9.85)Water Utilities: $155,000 ($3.67)General - Interest on Debt: $1,771,000 ($41.93)
Other Capital Outlay - General - Other: $1,060,000 ($25.10)
General Public Building: $504,000 ($11.93)Police Protection: $439,000 ($10.39)Sewerage: $357,000 ($8.45)Regular Highways: $291,000 ($6.89)Parks and Recreation: $246,000 ($5.82)Central Staff Services: $165,000 ($3.91)Water Utilities: $64,000 ($1.52)Protective Inspection and Regulation - Other: $35,000 ($0.83)Total Salaries and Wages: $16,447,000 ($389.43)
Water Utilities - Interest on Debt: $77,000 ($1.82)
Grove City government finances - Revenue in 2021 (per resident):
Charges - Sewerage: $1,144,000 ($27.09)
Parks and Recreation: $645,000 ($15.27)Federal Intergovernmental - General Local Government Support: $7,000 ($0.17)
Miscellaneous - General Revenue - Other: $1,603,000 ($37.96)
Interest Earnings: $702,000 ($16.62)Special Assessments: $367,000 ($8.69)Fines and Forfeits: $257,000 ($6.09)Sale of Property: $104,000 ($2.46)Rents: $61,000 ($1.44)Revenue - Water Utilities: $619,000 ($14.66)
State Intergovernmental - General Local Government Support: $13,954,000 ($330.41)
Highways: $2,724,000 ($64.50)Other: $1,471,000 ($34.83)Tax - Individual Income: $25,599,000 ($606.14)
Property: $3,173,000 ($75.13)Corporation Net Income: $2,593,000 ($61.40)Other Selective Sales: $1,206,000 ($28.56)Occupation and Business License - Other: $1,109,000 ($26.26)Public Utilities Sales: $770,000 ($18.23)Other License: $566,000 ($13.40)
Grove City government finances - Debt in 2021 (per resident):
Long Term Debt - Beginning Outstanding - Unspecified Public Purpose: $60,450,000 ($1431.35)
Outstanding Unspecified Public Purpose: $57,698,000 ($1366.18)Retired Unspecified Public Purpose: $2,870,000 ($67.96)Issue, Unspecified Public Purpose: $117,000 ($2.77)
Grove City government finances - Cash and Securities in 2021 (per resident):
Other Funds - Cash and Securities: $58,318,000 ($1380.86)
5.55% of this county's 2021 resident taxpayers lived in other counties in 2020 ($57,598 average adjusted gross income )
Here:
5.55%Ohio average:
5.68%
0.01% of residents moved from foreign countries ($105 average AGI )Franklin County:
0.01%Ohio average:
0.01%
Top counties from which taxpayers relocated into this county between 2020 and 2021:
6.60% of this county's 2020 resident taxpayers moved to other counties in 2021 ($69,680 average adjusted gross income )
Here:
6.60%Ohio average:
5.79%
0.01% of residents moved to foreign countries ($94 average AGI )Franklin County:
0.01%Ohio average:
0.01%
Top counties to which taxpayers relocated from this county between 2020 and 2021:
Businesses in Grove City, OH
Name Count Name Count
ALDI 1 Lane Bryant 1 AMF Bowling 1 Little Caesars Pizza 1 AT&T 2 MasterBrand Cabinets 6 Advance Auto Parts 1 Maurices 1 Applebee's 1 McDonald's 3 Arby's 1 Meijer 1 AutoZone 1 Microtel 1 Bath & Body Works 2 Nike 2 Bed Bath & Beyond 1 Olive Garden 1 Best Western 1 Panda Express 1 Blockbuster 1 Payless 1 Burger King 2 Penske 2 CVS 3 PetSmart 1 Casual Male XL 1 Pier 1 Imports 1 Chick-Fil-A 1 Pizza Hut 1 Chipotle 1 Plato's Closet 1 Circle K 1 Quiznos 1 Cold Stone Creamery 1 RadioShack 1 Comfort Inn 1 Red Robin 1 Cracker Barrel 1 Red Roof Inn 1 Curves 1 Ruby Tuesday 1 DHL 1 SONIC Drive-In 1 Dairy Queen 2 Sears 1 Days Inn 1 Sprint Nextel 3 Decora Cabinetry 2 Staples 1 Discount Tire 1 Starbucks 4 Domino's Pizza 1 Steak 'n Shake 1 DressBarn 1 Super 8 1 Dressbarn 1 T-Mobile 3 Famous Footwear 1 T.J.Maxx 1 FedEx 8 Taco Bell 1 Firestone Complete Auto Care 1 Target 1 GNC 1 Tim Hortons 3 GameStop 1 Travelodge 1 H&R Block 1 U-Haul 5 Hilton 2 UPS 12 Hobby Lobby 1 Verizon Wireless 1 Holiday Inn 1 Waffle House 2 Home Depot 1 Walgreens 1 KFC 1 Walmart 1 Kmart 1 Wendy's 3 Knights Inn 1 White Castle 1 Kroger 2 YMCA 1 La Quinta 1
Strongest AM radio stations in Grove City:
WRFD (880 AM; daytime; 23 kW; COLUMBUS-WORTHINGTON, OH; Owner: SALEM MEDIA OF OHIO, INC.)
WMNI (920 AM; 1 kW; COLUMBUS, OH; Owner: NORTH AMERICAN BROADCASTING CO.)
WTVN (610 AM; 50 kW; COLUMBUS, OH; Owner: CITICASTERS LICENSES, L.P.)
WOSU (820 AM; 5 kW; COLUMBUS, OH; Owner: THE OHIO STATE UNIVERSITY)
WBNS (1460 AM; 5 kW; COLUMBUS, OH; Owner: RADIOHIO, INCORPORATED)
WCOL (1230 AM; 1 kW; COLUMBUS, OH; Owner: CITICASTERS LICENSES, L.P.)
WLW (700 AM; 50 kW; CINCINNATI, OH; Owner: JACOR BROADCASTING CORPORATION)
WVKO (1580 AM; 1 kW; COLUMBUS, OH; Owner: ASSOCIATED RADIO, INC.)
WKNR (850 AM; 50 kW; CLEVELAND, OH; Owner: CARON BROADCASTING, INC.)
WSAI (1530 AM; 50 kW; CINCINNATI, OH; Owner: JACOR BROADCASTING CORPORATION)
WWVA (1170 AM; 53 kW; WHEELING, WV; Owner: CAPSTAR TX LIMITED PARTNERSHIP)
WDLR (1550 AM; 4 kW; DELAWARE, OH; Owner: THE FIFTEEN FIFTY CORPORATION)
WTAM (1100 AM; 50 kW; CLEVELAND, OH; Owner: JACOR BROADCASTING CORPORATION)
Strongest FM radio stations in Grove City:
W201AK (88.1 FM; COLUMBUS, OH; Owner: THE CEDARVILLE UNIVERSITY)
WOSU-FM (89.7 FM; COLUMBUS, OH; Owner: THE OHIO STATE UNIVERSITY)
WUFM (88.7 FM; COLUMBUS, OH; Owner: SPIRIT COMMUNICATIONS, INC)
WBZX (99.7 FM; COLUMBUS, OH; Owner: NORTH AMERICAN BROADCASTING CO., INC)
WBNS-FM (97.1 FM; COLUMBUS, OH; Owner: RADIO OHIO, INC.)
WCOL-FM (92.3 FM; COLUMBUS, OH; Owner: CITICASTERS LICENSES, L.P.)
WXMG (98.9 FM; UPPER ARLINGTON, OH; Owner: BLUE CHIP BROADCASTING LICENSES, LTD)
WLVQ (96.3 FM; COLUMBUS, OH; Owner: INFINITY RADIO OPERATIONS INC.)
WWCD (101.1 FM; GROVE CITY, OH; Owner: FUN WITH RADIO, LLC)
WCBE (90.5 FM; COLUMBUS, OH; Owner: BD.OF EDUC.,CITY SCH.DIST.,COLUMBUS)
WNCI (97.9 FM; COLUMBUS, OH; Owner: CITICASTERS LICENSES, L.P.)
WFJX (105.7 FM; HILLIARD, OH; Owner: CITICASTERS LICENSES, L.P.)
WCKX (107.5 FM; COLUMBUS, OH; Owner: BLUE CHIP BROADCASTING LICENSES, LTD)
WSNY (94.7 FM; COLUMBUS, OH; Owner: FRANKLIN COMMUNICATIONS, INC.)
WRVT (88.7 FM; RUTLAND, VT; Owner: VERMONT PUBLIC RADIO)
W272AT (102.3 FM; COLUMBUS, OH; Owner: INFINITY RADIO SUBSIDIARY OPERATIONS INC.)
WFCB (93.3 FM; CHILLICOTHE, OH; Owner: CLEAR CHANNEL BROADCASTING LICENSES, INC.)
WHOK-FM (95.5 FM; LANCASTER, OH; Owner: INFINITY RADIO SUBSIDIARY OPERATIONS INC.)
WJYD (106.3 FM; LONDON, OH; Owner: BLUE CHIP BROADCASTING LICENSES, LTD)
WCVO (104.9 FM; GAHANNA, OH; Owner: CHRISTIAN VOICE OF CENTRAL OHIO)
TV broadcast stations around Grove City:
W23BZ (Channel 23; COLUMBUS, OH; Owner: NATIONAL MINORITY T.V., INC.)
WSYX (Channel 6; COLUMBUS, OH; Owner: WSYX LICENSEE, INC.)
WTTE (Channel 28; COLUMBUS, OH; Owner: COLUMBUS (WTTE-TV) LICENSEE, INC.)
WBNS-TV (Channel 10; COLUMBUS, OH; Owner: WBNS-TV, INC.)
WCMH-TV (Channel 4; COLUMBUS, OH; Owner: OUTLET BROADCASTING, INC.)
WINJ-LP (Channel 8; COLUMBUS, OH; Owner: THE NEW LIFE FELLOWSHIP OF CHURCHES)
WCLL-LP (Channel 19; COLUMBUS, OH; Owner: JONATHAN W. OWENS)
WDEM-LP (Channel 17; COLUMBUS, OH; Owner: TRIPLETT & ASSOCIATES, INC.)
W43BZ (Channel 43; COLUMBUS, OH; Owner: VENTANA TELEVISION, INC.)
WWHO (Channel 53; CHILLICOTHE, OH; Owner: UPN STATIONS GROUP INC.)
WOSU-TV (Channel 34; COLUMBUS, OH; Owner: THE OHIO STATE UNIVERSITY)
WBDT (Channel 26; SPRINGFIELD, OH; Owner: ACME TV LICENSES OF OHIO, LLC)
WCPX-LP (Channel 48; COLUMBUS, OH; Owner: PAXSON COMMUNICATIONS LICENSE COMPANY, LLC)
National Bridge Inventory (NBI) Statistics 55 Number of bridges463ft / 141m Total length1,144,111 Total average daily traffic195,015 Total average daily truck traffic
New bridges - historical statistics
1 1920-1929 2 1940-1949 4 1950-1959 9 1960-1969 3 1970-1979 3 1980-1989 8 1990-1999 8 2000-2009 14 2010-2019 3 2020-2022
See full National Bridge Inventory statistics for Grove City, OH
Home Mortgage Disclosure Act Aggregated Statistics For Year 2009(Based on 2 full and 5 partial tracts) A) FHA, FSA/RHS & VA B) Conventional C) Refinancings D) Home Improvement Loans F) Non-occupant Loans on G) Loans On Manufactured Number Average Value Number Average Value Number Average Value Number Average Value Number Average Value Number Average Value
LOANS ORIGINATED 200 $135,925 100 $123,125 409 $138,850 15 $46,920 27 $86,487 0 $0 APPLICATIONS APPROVED, NOT ACCEPTED 14 $135,141 9 $167,252 36 $141,501 7 $12,406 1 $114,320 1 $27,000 APPLICATIONS DENIED 24 $129,491 10 $144,128 150 $143,736 26 $34,788 7 $93,339 2 $55,000 APPLICATIONS WITHDRAWN 20 $139,780 11 $117,134 85 $141,851 3 $40,417 5 $99,816 0 $0 FILES CLOSED FOR INCOMPLETENESS 4 $109,035 1 $107,940 22 $140,330 2 $18,585 1 $73,000 0 $0
Aggregated Statistics For Year 2008(Based on 2 full and 5 partial tracts) A) FHA, FSA/RHS & VA B) Conventional C) Refinancings D) Home Improvement Loans E) Loans on Dwellings For 5+ Families F) Non-occupant Loans on G) Loans On Manufactured Number Average Value Number Average Value Number Average Value Number Average Value Number Average Value Number Average Value Number Average Value
LOANS ORIGINATED 133 $143,525 171 $129,009 230 $124,847 44 $24,183 3 $1,122,897 46 $94,551 1 $60,500 APPLICATIONS APPROVED, NOT ACCEPTED 16 $150,228 27 $174,041 47 $112,136 17 $19,956 0 $0 3 $143,317 1 $39,430 APPLICATIONS DENIED 24 $130,336 31 $126,272 185 $132,740 54 $25,313 0 $0 16 $90,317 2 $51,170 APPLICATIONS WITHDRAWN 16 $152,836 21 $132,187 74 $138,329 5 $70,372 0 $0 4 $121,155 0 $0 FILES CLOSED FOR INCOMPLETENESS 3 $151,047 3 $127,293 17 $160,057 2 $22,940 0 $0 4 $76,135 0 $0
Aggregated Statistics For Year 2007(Based on 2 full and 5 partial tracts) A) FHA, FSA/RHS & VA B) Conventional C) Refinancings D) Home Improvement Loans F) Non-occupant Loans on G) Loans On Manufactured Number Average Value Number Average Value Number Average Value Number Average Value Number Average Value Number Average Value
LOANS ORIGINATED 54 $147,414 360 $125,682 291 $140,399 52 $40,407 71 $88,270 1 $100,000 APPLICATIONS APPROVED, NOT ACCEPTED 5 $141,628 42 $132,710 74 $111,767 15 $27,937 8 $102,064 4 $82,145 APPLICATIONS DENIED 15 $141,719 78 $114,618 286 $125,500 55 $41,654 26 $103,861 12 $42,422 APPLICATIONS WITHDRAWN 6 $159,412 43 $126,303 113 $126,009 10 $41,290 6 $64,363 1 $110,000 FILES CLOSED FOR INCOMPLETENESS 1 $162,880 7 $155,123 42 $149,472 1 $82,450 6 $122,300 0 $0
Aggregated Statistics For Year 2006(Based on 2 full and 5 partial tracts) A) FHA, FSA/RHS & VA B) Conventional C) Refinancings D) Home Improvement Loans F) Non-occupant Loans on G) Loans On Manufactured Number Average Value Number Average Value Number Average Value Number Average Value Number Average Value Number Average Value
LOANS ORIGINATED 80 $150,658 511 $113,953 360 $104,482 65 $119,083 82 $84,697 1 $47,180 APPLICATIONS APPROVED, NOT ACCEPTED 11 $147,244 80 $106,036 84 $105,996 13 $28,465 13 $107,018 3 $32,913 APPLICATIONS DENIED 10 $144,714 82 $128,078 300 $118,865 60 $38,788 25 $100,618 4 $48,660 APPLICATIONS WITHDRAWN 13 $143,915 78 $108,647 158 $121,806 17 $43,504 20 $94,170 1 $55,550 FILES CLOSED FOR INCOMPLETENESS 1 $188,020 13 $121,944 55 $121,626 2 $19,280 0 $0 0 $0
Aggregated Statistics For Year 2005(Based on 2 full and 5 partial tracts) A) FHA, FSA/RHS & VA B) Conventional C) Refinancings D) Home Improvement Loans E) Loans on Dwellings For 5+ Families F) Non-occupant Loans on G) Loans On Manufactured Number Average Value Number Average Value Number Average Value Number Average Value Number Average Value Number Average Value Number Average Value
LOANS ORIGINATED 68 $150,946 466 $116,881 500 $117,680 66 $44,321 1 $1,667,880 93 $98,297 1 $129,580 APPLICATIONS APPROVED, NOT ACCEPTED 8 $130,454 67 $127,922 100 $112,309 11 $38,473 0 $0 4 $110,260 4 $49,718 APPLICATIONS DENIED 12 $162,168 107 $94,976 350 $122,969 66 $30,527 0 $0 26 $82,422 13 $51,563 APPLICATIONS WITHDRAWN 10 $146,055 61 $126,296 215 $125,967 23 $124,849 0 $0 15 $135,749 0 $0 FILES CLOSED FOR INCOMPLETENESS 1 $64,560 18 $102,888 81 $134,732 1 $38,880 0 $0 2 $122,900 0 $0
Aggregated Statistics For Year 2004(Based on 2 full and 5 partial tracts) A) FHA, FSA/RHS & VA B) Conventional C) Refinancings D) Home Improvement Loans E) Loans on Dwellings For 5+ Families F) Non-occupant Loans on G) Loans On Manufactured Number Average Value Number Average Value Number Average Value Number Average Value Number Average Value Number Average Value Number Average Value
LOANS ORIGINATED 106 $148,683 447 $129,391 537 $116,038 76 $32,356 3 $631,767 85 $94,083 1 $53,820 APPLICATIONS APPROVED, NOT ACCEPTED 14 $173,716 65 $126,104 115 $123,929 15 $40,315 0 $0 8 $80,051 3 $11,113 APPLICATIONS DENIED 22 $136,011 68 $119,008 302 $115,721 82 $28,186 0 $0 12 $69,475 6 $49,940 APPLICATIONS WITHDRAWN 13 $171,241 59 $121,044 186 $122,936 13 $33,430 0 $0 19 $94,869 1 $42,000 FILES CLOSED FOR INCOMPLETENESS 1 $197,580 10 $108,631 52 $124,366 6 $39,095 0 $0 2 $86,655 0 $0
Aggregated Statistics For Year 2003(Based on 2 full and 5 partial tracts) A) FHA, FSA/RHS & VA B) Conventional C) Refinancings D) Home Improvement Loans E) Loans on Dwellings For 5+ Families F) Non-occupant Loans on Number Average Value Number Average Value Number Average Value Number Average Value Number Average Value Number Average Value
LOANS ORIGINATED 165 $143,347 327 $117,060 1,326 $112,112 47 $35,175 1 $306,860 126 $86,717 APPLICATIONS APPROVED, NOT ACCEPTED 10 $141,850 34 $121,808 167 $108,651 12 $23,748 0 $0 7 $103,084 APPLICATIONS DENIED 14 $135,899 51 $103,207 308 $110,481 54 $24,871 0 $0 17 $67,192 APPLICATIONS WITHDRAWN 19 $128,455 33 $130,561 211 $126,478 12 $25,481 0 $0 11 $81,793 FILES CLOSED FOR INCOMPLETENESS 1 $222,210 11 $119,446 76 $115,130 4 $18,372 0 $0 6 $83,105
Aggregated Statistics For Year 2002(Based on 2 full and 3 partial tracts) A) FHA, FSA/RHS & VA B) Conventional C) Refinancings D) Home Improvement Loans F) Non-occupant Loans on Number Average Value Number Average Value Number Average Value Number Average Value Number Average Value
LOANS ORIGINATED 169 $135,610 244 $116,489 701 $105,022 46 $16,669 60 $93,777 APPLICATIONS APPROVED, NOT ACCEPTED 9 $128,913 26 $109,270 121 $101,829 14 $16,496 6 $82,153 APPLICATIONS DENIED 10 $146,356 28 $88,550 204 $102,057 35 $17,861 4 $73,632 APPLICATIONS WITHDRAWN 15 $119,503 17 $123,315 133 $113,009 5 $37,784 6 $66,472 FILES CLOSED FOR INCOMPLETENESS 4 $97,728 6 $88,845 51 $104,265 1 $50,320 0 $0
Aggregated Statistics For Year 2001(Based on 2 full and 3 partial tracts) A) FHA, FSA/RHS & VA B) Conventional C) Refinancings D) Home Improvement Loans E) Loans on Dwellings For 5+ Families F) Non-occupant Loans on Number Average Value Number Average Value Number Average Value Number Average Value Number Average Value Number Average Value
LOANS ORIGINATED 178 $130,916 186 $105,009 612 $97,555 71 $20,668 1 $1,368,720 44 $75,473 APPLICATIONS APPROVED, NOT ACCEPTED 11 $150,306 25 $81,971 111 $86,325 22 $22,745 0 $0 7 $66,813 APPLICATIONS DENIED 11 $132,469 56 $55,994 217 $89,069 51 $12,180 0 $0 7 $37,116 APPLICATIONS WITHDRAWN 14 $128,314 21 $106,218 117 $98,068 11 $34,126 0 $0 7 $131,157 FILES CLOSED FOR INCOMPLETENESS 0 $0 4 $43,798 32 $106,742 0 $0 0 $0 3 $71,667
Aggregated Statistics For Year 2000(Based on 2 full and 3 partial tracts) A) FHA, FSA/RHS & VA B) Conventional C) Refinancings D) Home Improvement Loans E) Loans on Dwellings For 5+ Families F) Non-occupant Loans on Number Average Value Number Average Value Number Average Value Number Average Value Number Average Value Number Average Value
LOANS ORIGINATED 125 $116,437 193 $106,335 196 $82,260 67 $17,045 1 $12,612,040 26 $66,211 APPLICATIONS APPROVED, NOT ACCEPTED 13 $104,935 28 $79,074 69 $77,901 23 $19,960 0 $0 5 $44,982 APPLICATIONS DENIED 17 $111,991 106 $56,317 148 $84,340 51 $12,450 0 $0 7 $106,394 APPLICATIONS WITHDRAWN 16 $112,059 16 $103,583 68 $82,831 7 $33,377 0 $0 2 $20,000 FILES CLOSED FOR INCOMPLETENESS 2 $87,085 4 $113,932 15 $82,324 1 $20,000 0 $0 0 $0
Aggregated Statistics For Year 1999(Based on 2 full and 4 partial tracts) A) FHA, FSA/RHS & VA B) Conventional C) Refinancings D) Home Improvement Loans E) Loans on Dwellings For 5+ Families F) Non-occupant Loans on Number Average Value Number Average Value Number Average Value Number Average Value Number Average Value Number Average Value
LOANS ORIGINATED 135 $111,653 261 $104,994 427 $83,047 91 $13,606 2 $2,128,175 47 $77,452 APPLICATIONS APPROVED, NOT ACCEPTED 10 $120,560 31 $74,543 91 $78,105 38 $13,911 0 $0 6 $88,012 APPLICATIONS DENIED 11 $118,217 84 $55,970 162 $82,231 65 $13,973 0 $0 8 $61,615 APPLICATIONS WITHDRAWN 14 $109,724 38 $98,764 127 $88,130 8 $44,300 0 $0 10 $53,925 FILES CLOSED FOR INCOMPLETENESS 3 $117,777 8 $97,791 46 $83,903 0 $0 0 $0 1 $33,000
Detailed HMDA statistics for the following Tracts:
0096.00
, 0097.11 , 0097.12 , 0097.20 , 0097.40 , 0097.51 , 0097.52
Private Mortgage Insurance Companies Aggregated Statistics For Year 2009(Based on 2 full and 5 partial tracts) A) Conventional B) Refinancings Number Average Value Number Average Value
LOANS ORIGINATED 22 $150,370 19 $160,844 APPLICATIONS APPROVED, NOT ACCEPTED 5 $148,184 6 $166,402 APPLICATIONS DENIED 3 $150,913 5 $124,614 APPLICATIONS WITHDRAWN 1 $154,170 1 $297,360 FILES CLOSED FOR INCOMPLETENESS 0 $0 1 $158,400
Aggregated Statistics For Year 2008(Based on 2 full and 5 partial tracts) A) Conventional B) Refinancings C) Non-occupant Loans on Number Average Value Number Average Value Number Average Value
LOANS ORIGINATED 76 $152,220 27 $151,449 9 $111,661 APPLICATIONS APPROVED, NOT ACCEPTED 25 $167,637 18 $153,216 4 $87,492 APPLICATIONS DENIED 8 $150,985 2 $116,200 4 $126,825 APPLICATIONS WITHDRAWN 4 $134,808 1 $79,400 0 $0 FILES CLOSED FOR INCOMPLETENESS 1 $143,380 1 $103,370 0 $0
Aggregated Statistics For Year 2007(Based on 2 full and 5 partial tracts) A) Conventional B) Refinancings C) Non-occupant Loans on Number Average Value Number Average Value Number Average Value
LOANS ORIGINATED 161 $146,211 31 $152,675 11 $108,144 APPLICATIONS APPROVED, NOT ACCEPTED 17 $144,314 13 $191,610 3 $75,550 APPLICATIONS DENIED 2 $181,270 2 $163,805 1 $95,600 APPLICATIONS WITHDRAWN 5 $148,010 2 $193,860 0 $0 FILES CLOSED FOR INCOMPLETENESS 0 $0 1 $100,570 0 $0
Aggregated Statistics For Year 2006(Based on 2 full and 5 partial tracts) A) Conventional B) Refinancings C) Non-occupant Loans on Number Average Value Number Average Value Number Average Value
LOANS ORIGINATED 92 $134,404 27 $136,247 10 $107,589 APPLICATIONS APPROVED, NOT ACCEPTED 6 $106,203 10 $137,623 3 $43,467 APPLICATIONS DENIED 1 $121,040 0 $0 0 $0 APPLICATIONS WITHDRAWN 5 $154,672 5 $158,588 1 $217,260 FILES CLOSED FOR INCOMPLETENESS 1 $147,000 0 $0 0 $0
Aggregated Statistics For Year 2005(Based on 2 full and 5 partial tracts) A) Conventional B) Refinancings C) Non-occupant Loans on Number Average Value Number Average Value Number Average Value
LOANS ORIGINATED 72 $147,684 44 $145,501 14 $93,024 APPLICATIONS APPROVED, NOT ACCEPTED 13 $156,806 17 $148,097 3 $137,133 APPLICATIONS DENIED 1 $204,170 1 $145,620 1 $204,170 APPLICATIONS WITHDRAWN 4 $139,022 3 $180,510 0 $0 FILES CLOSED FOR INCOMPLETENESS 0 $0 1 $139,900 0 $0
Aggregated Statistics For Year 2004(Based on 2 full and 5 partial tracts) A) Conventional B) Refinancings C) Non-occupant Loans on Number Average Value Number Average Value Number Average Value
LOANS ORIGINATED 74 $148,765 55 $143,419 13 $107,712 APPLICATIONS APPROVED, NOT ACCEPTED 15 $152,319 25 $139,069 4 $100,782 APPLICATIONS DENIED 0 $0 1 $74,110 0 $0 APPLICATIONS WITHDRAWN 6 $122,598 5 $150,868 1 $86,000 FILES CLOSED FOR INCOMPLETENESS 0 $0 0 $0 0 $0
Aggregated Statistics For Year 2003(Based on 2 full and 5 partial tracts) A) Conventional B) Refinancings C) Non-occupant Loans on Number Average Value Number Average Value Number Average Value
LOANS ORIGINATED 89 $141,530 180 $141,008 17 $89,259 APPLICATIONS APPROVED, NOT ACCEPTED 14 $156,184 48 $138,700 2 $82,760 APPLICATIONS DENIED 3 $133,833 1 $153,470 2 $99,500 APPLICATIONS WITHDRAWN 9 $144,011 13 $149,634 4 $97,762 FILES CLOSED FOR INCOMPLETENESS 1 $126,000 1 $149,620 0 $0
Aggregated Statistics For Year 2002(Based on 2 full and 3 partial tracts) A) Conventional B) Refinancings C) Non-occupant Loans on Number Average Value Number Average Value Number Average Value
LOANS ORIGINATED 69 $126,166 109 $123,195 12 $80,131 APPLICATIONS APPROVED, NOT ACCEPTED 10 $122,234 24 $122,451 4 $76,035 APPLICATIONS DENIED 2 $78,745 2 $157,655 1 $117,380 APPLICATIONS WITHDRAWN 4 $115,038 5 $125,800 2 $90,325 FILES CLOSED FOR INCOMPLETENESS 0 $0 1 $116,000 0 $0
Aggregated Statistics For Year 2001(Based on 2 full and 3 partial tracts) A) Conventional B) Refinancings C) Non-occupant Loans on Number Average Value Number Average Value Number Average Value
LOANS ORIGINATED 69 $117,871 101 $120,077 8 $99,019 APPLICATIONS APPROVED, NOT ACCEPTED 10 $138,244 20 $116,325 1 $53,690 APPLICATIONS DENIED 1 $98,380 5 $101,996 0 $0 APPLICATIONS WITHDRAWN 1 $91,000 3 $151,313 0 $0 FILES CLOSED FOR INCOMPLETENESS 0 $0 2 $83,940 0 $0
Aggregated Statistics For Year 2000(Based on 2 full and 3 partial tracts) A) Conventional B) Refinancings C) Non-occupant Loans on Number Average Value Number Average Value Number Average Value
LOANS ORIGINATED 63 $117,578 21 $104,173 4 $80,840 APPLICATIONS APPROVED, NOT ACCEPTED 10 $113,810 6 $102,985 2 $63,275 APPLICATIONS DENIED 2 $110,500 3 $116,467 0 $0 APPLICATIONS WITHDRAWN 2 $87,995 2 $98,500 0 $0 FILES CLOSED FOR INCOMPLETENESS 0 $0 0 $0 0 $0
Aggregated Statistics For Year 1999(Based on 2 full and 4 partial tracts) A) Conventional B) Refinancings C) Non-occupant Loans on Number Average Value Number Average Value Number Average Value
LOANS ORIGINATED 103 $127,835 64 $107,098 10 $98,397 APPLICATIONS APPROVED, NOT ACCEPTED 10 $127,643 11 $114,930 0 $0 APPLICATIONS DENIED 7 $119,436 3 $100,913 0 $0 APPLICATIONS WITHDRAWN 2 $101,555 5 $120,452 0 $0 FILES CLOSED FOR INCOMPLETENESS 2 $62,340 0 $0 0 $0
Detailed PMIC statistics for the following Tracts:
0096.00
, 0097.11 , 0097.12 , 0097.20 , 0097.40 , 0097.51 , 0097.52 Fire-safe hotels and motels in Grove City, Ohio:
Red Roof Inn, 4055 Jackpot Rd, Grove City, Ohio 43123 Phone: (614) 871-9617, Fax: (614) 871-0740
Comfort Inn, 4197 Marlane Dr, Grove City, Ohio 43123 Phone: (614) 539-3500, Fax: (614) 885-9280
La Quinta Inn, 3962 Jackpot Rd, Grove City, Ohio 43123 Phone: (614) 539-6200, Fax: (614) 539-6211
Hilton Garden Inn Columbus/Grove City, 3928 Jackpot Rd, Grove City, Ohio 43123 Phone: (614) 539-8944, Fax: (614) 539-8956
Drury Inn & Suites Columbus Grove City, 4109 Pkwy Ctr Dr, Grove City, Ohio 43123 Phone: (614) 875-7000
Candlewood Suites, 3996 Jackpot Rd, Grove city, Ohio 43123 Phone: (614) 991-5950, Fax: (614) 991-5954
QUALITY INN, 1800 STRINGTOWN Rd, Grove city, Ohio 43123 Phone: (614) 277-0705, Fax: (614) 277-0705
Courtyard by Marriott Columbus Grove City, 1668 Buckeye Pl, Grove city, Ohio 43123 Phone: (614) 782-8292
4 other hotels and motels
All 12 fire-safe hotels and motels in Grove City, Ohio Grove City compared to Ohio state average:
Unemployed percentage significantly below state average. Black race population percentage below state average. Length of stay since moving in significantly above state average. House age significantly below state average.
Top Patent Applicants
Eugene Y. Ivanov (19)
Stanley J. Vernier (6)
Jeffrey James Boyce (6)
Robert S. Bailey (6)
David Chris Masterson (6)
Lora B. Thrun (5)
Matthew Palastro (5)
Steven R. Nelson (5)
Aaron Spencer (4)
Matthew A. Short (4)
Total of 166 patent applications in 2008-2024.
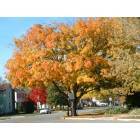
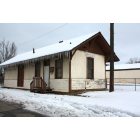
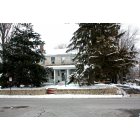
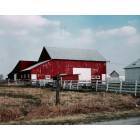
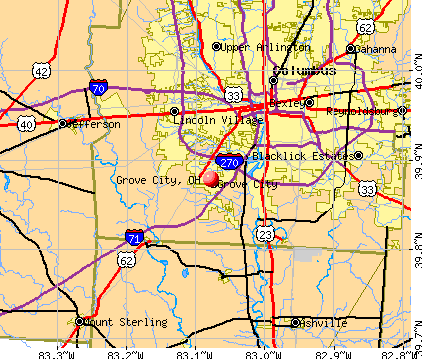


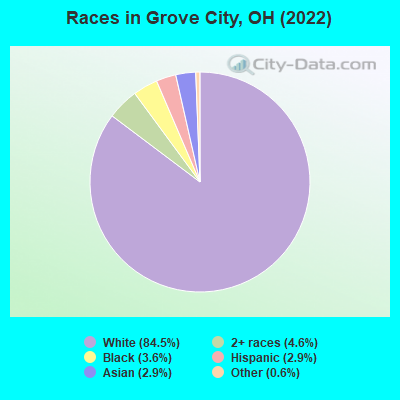
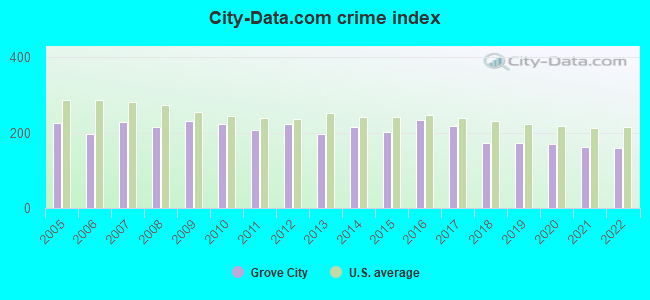
 Recent articles from our blog. Our writers, many of them Ph.D. graduates or candidates, create easy-to-read articles on a wide variety of topics.

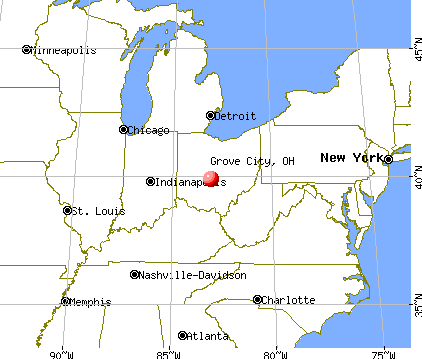
 (9.0 miles
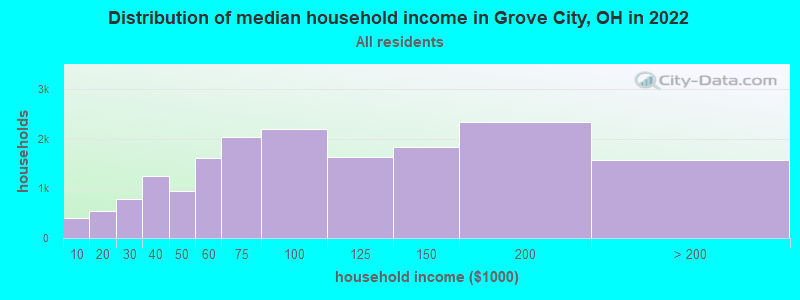
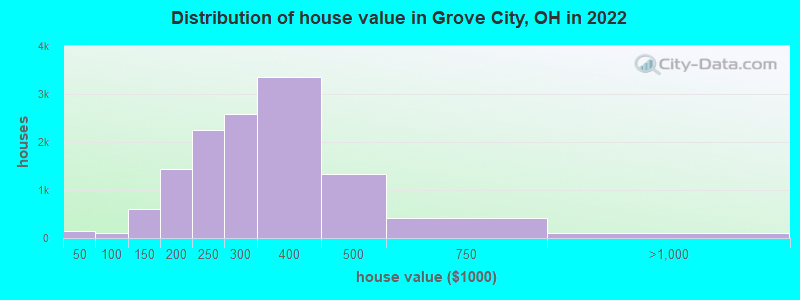

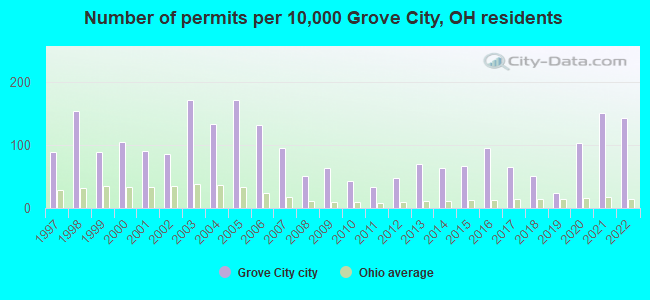
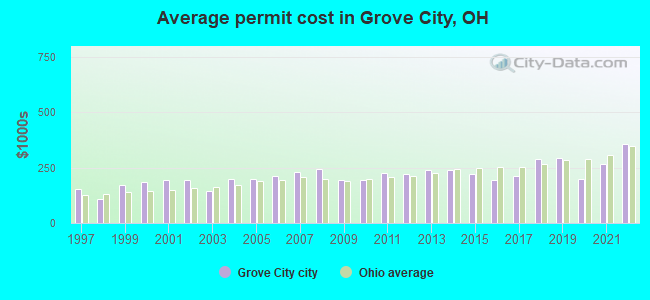
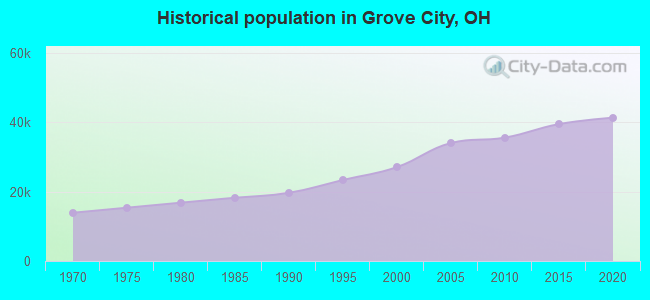
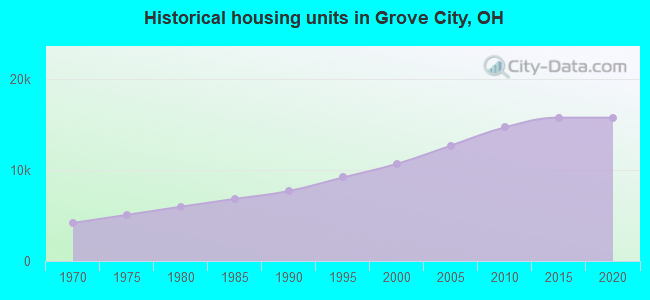
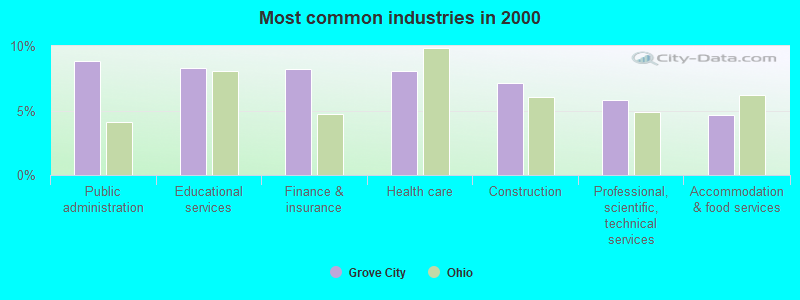
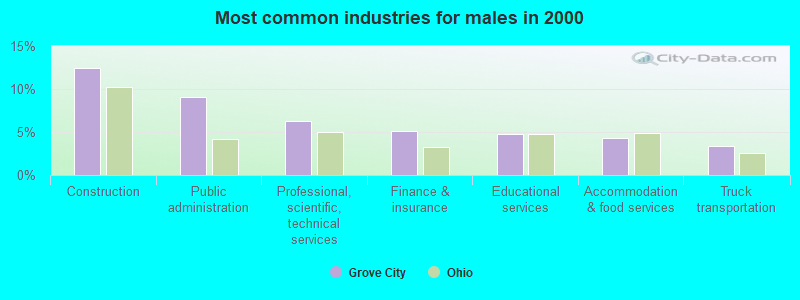
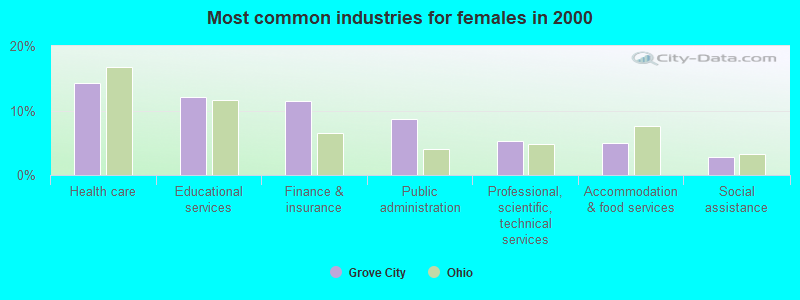
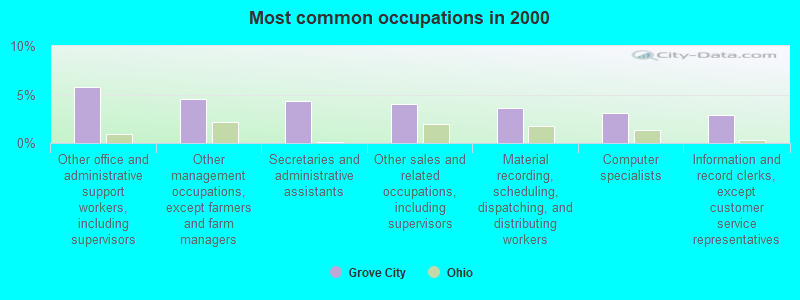
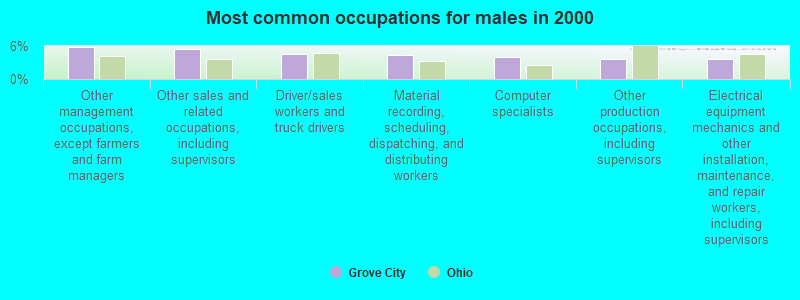
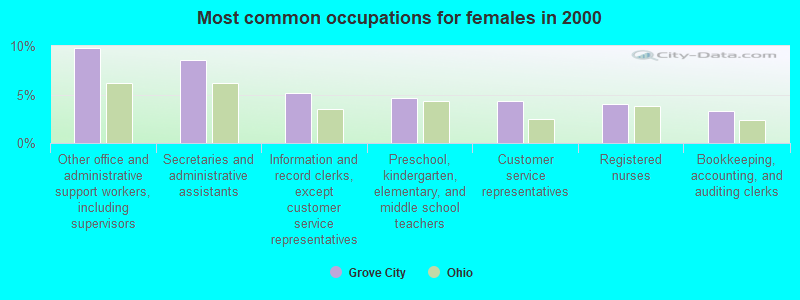


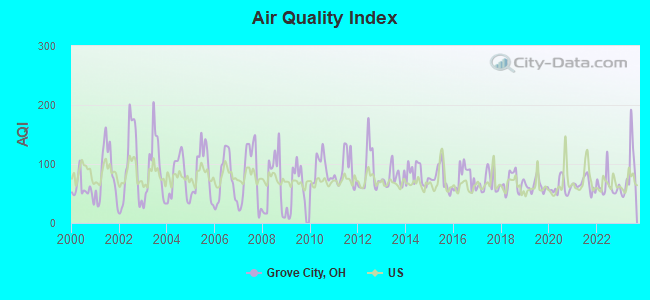
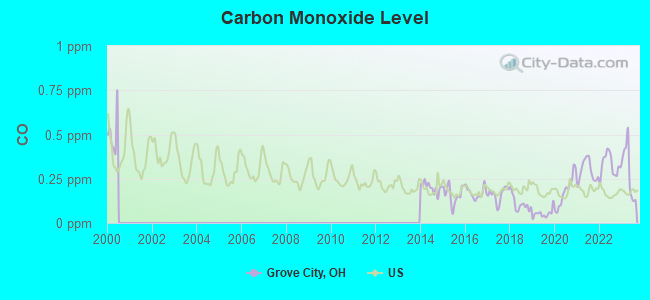
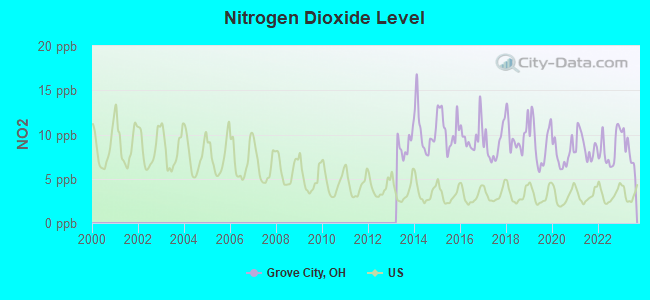
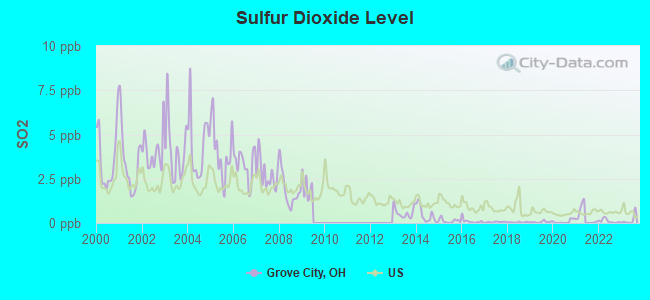
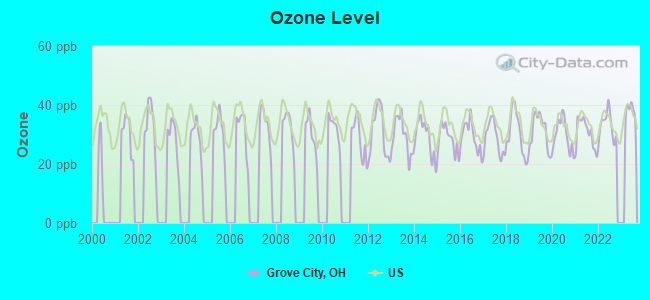
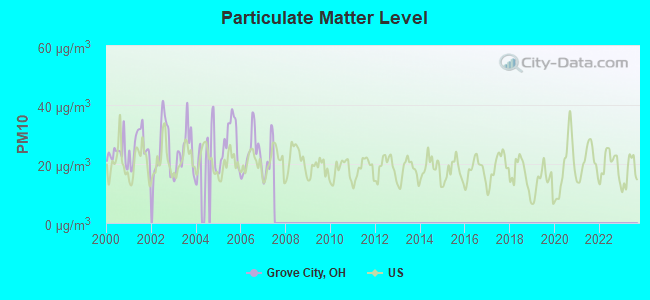
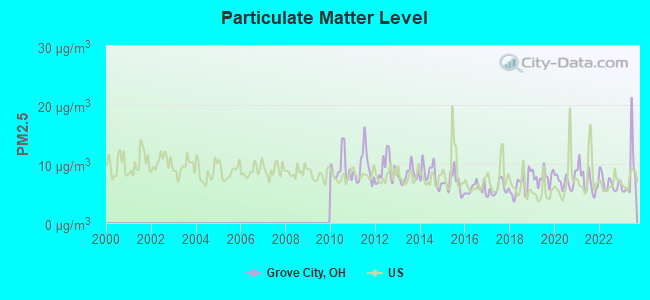

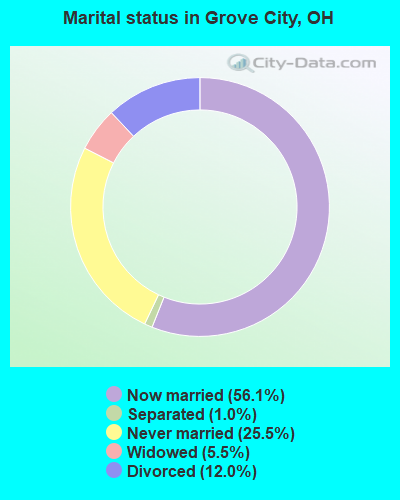
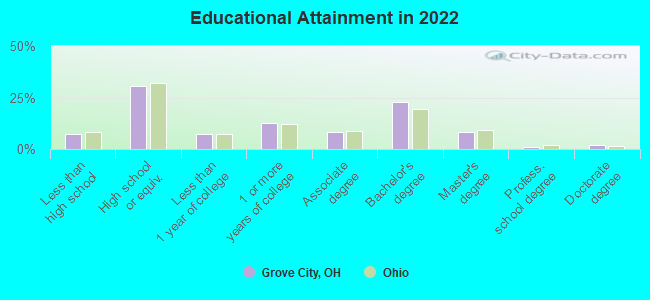
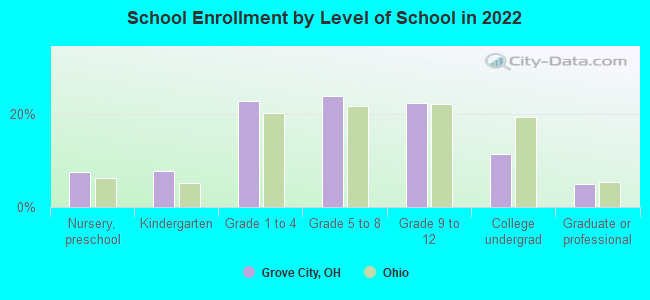
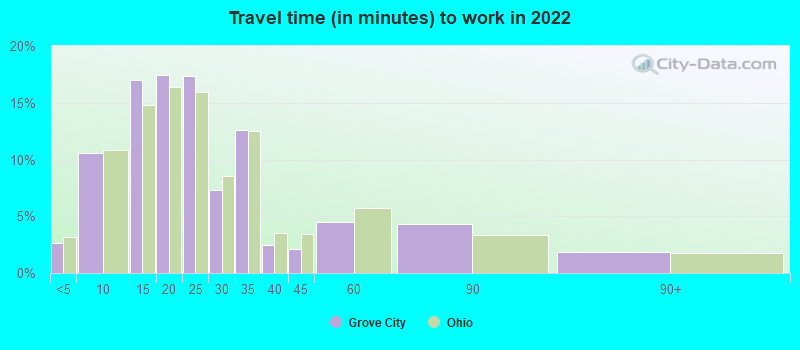
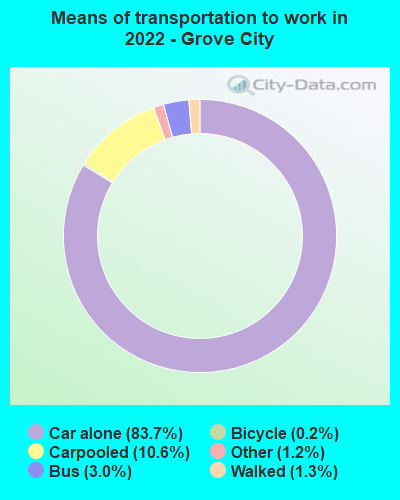
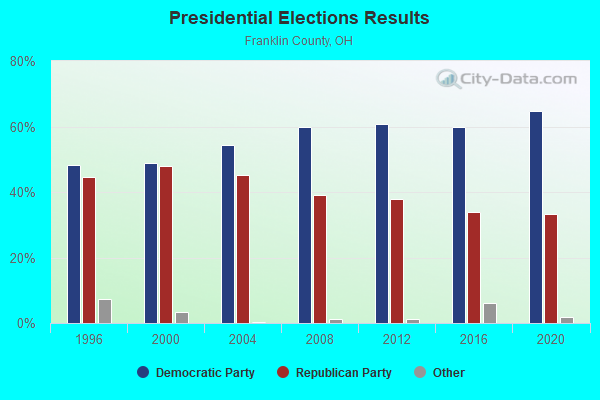
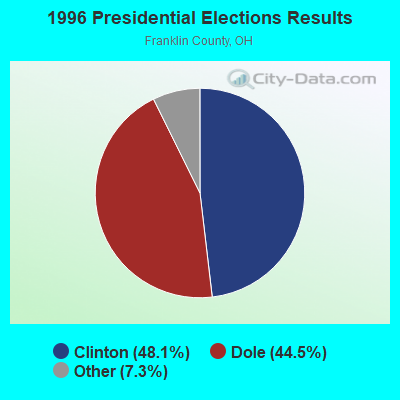
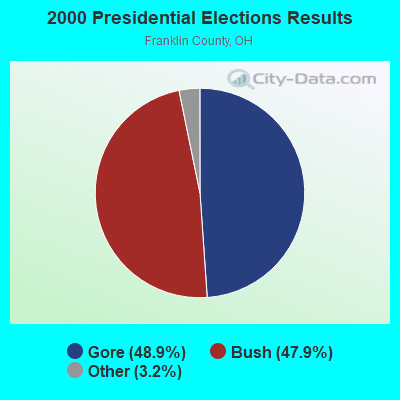
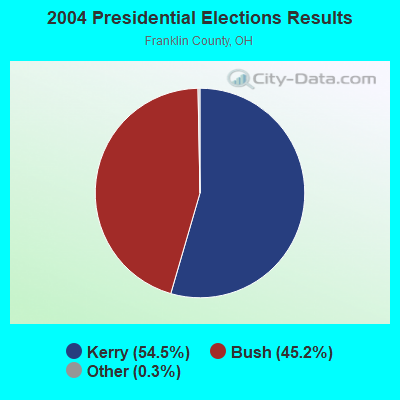
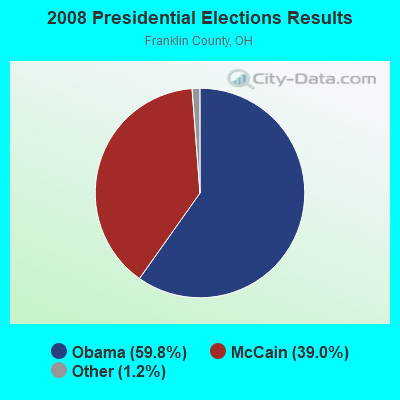
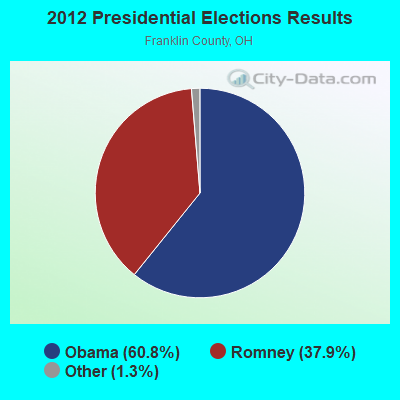
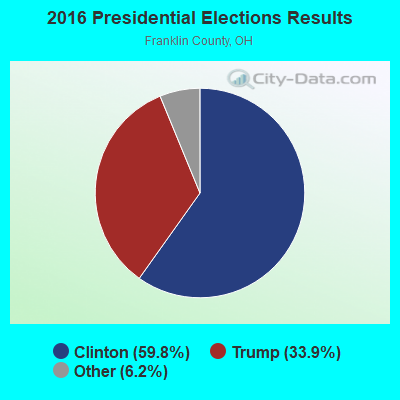
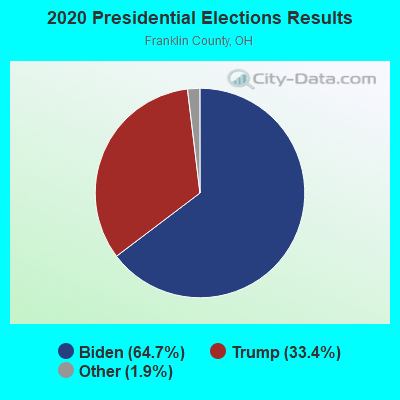
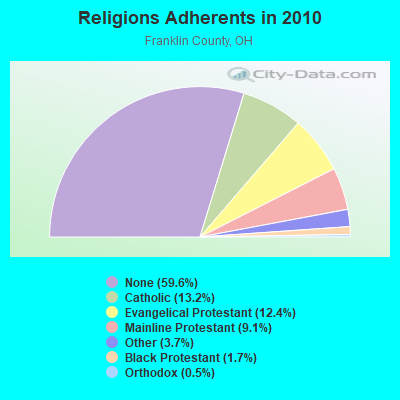
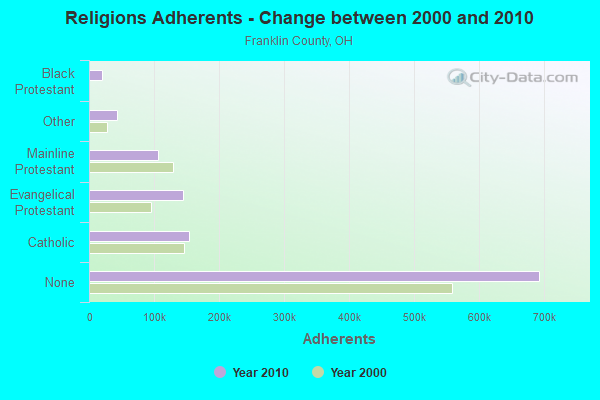
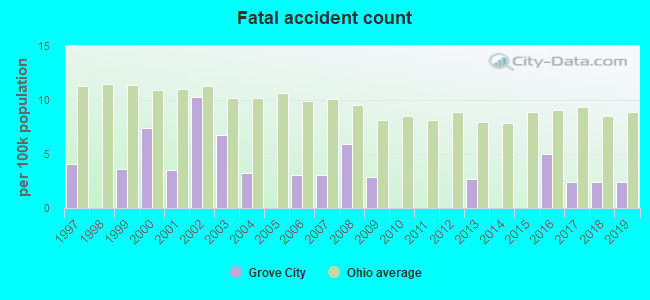
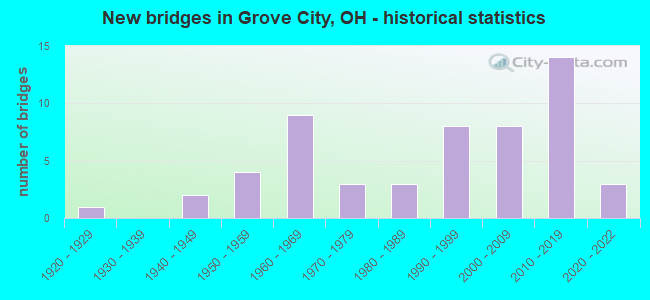
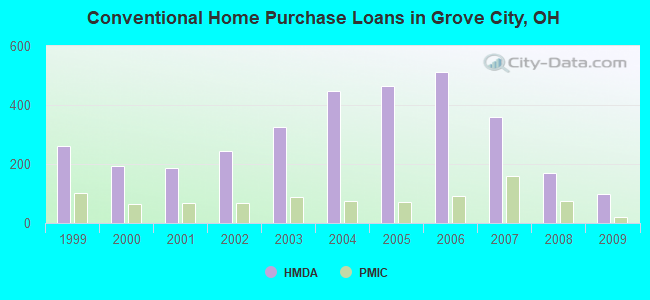
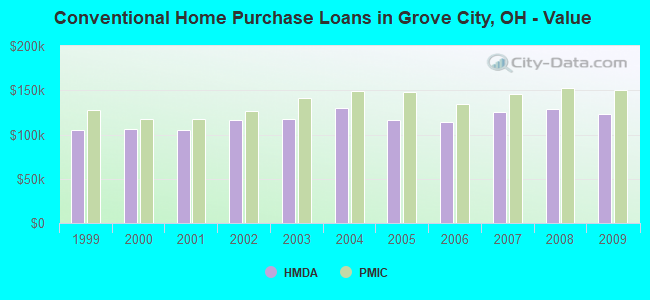
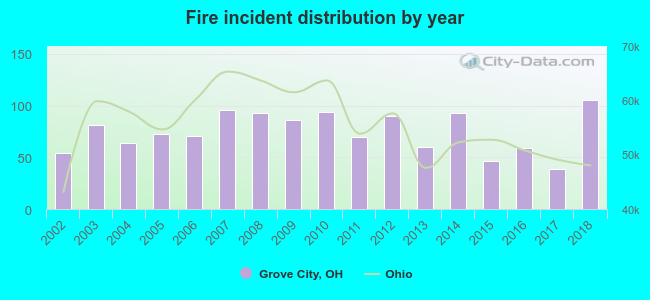 According to the data from the years 2002 - 2018 the average number of fires per year is 75. The highest number of fire incidents - 105 took place in 2018, and the least - 39 in 2017. The data has a rising trend.
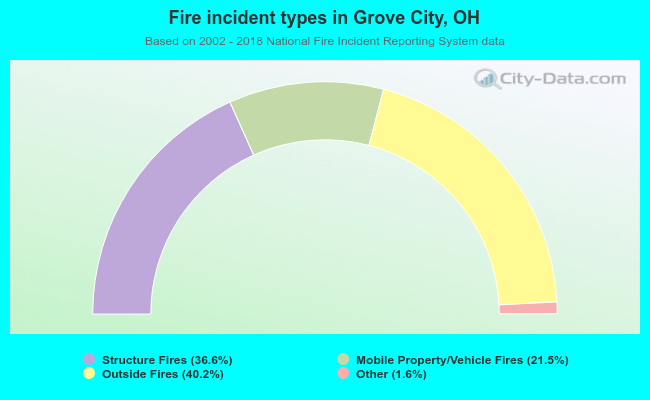 When looking into fire subcategories, the most reports belonged to: Outside Fires (40.2%), and Structure Fires (36.6%).